Wikipedia Megaproject Update (August 2008)
Posted by Sam Foucher on August 25, 2008 - 8:42am
This is an update on the Wikipedia Oil Megaproject Database maintained by the Oil Megaprojects task force (Ace, Stuart Staniford, myself and many others). The database contains now more than 440 separate entries and is growing everyday. The derived net new capacity (i.e. once depletion from existing production is included) is around 1.5 mbpd for 2008 and 2009 after which depletion may dominate.

Possible future supply capacity scenario for crude oil and NGL based on the Wikipedia Oil Megaproject database. The resource base post-2002 decline rate is a linearly increasing rate from 0% to 4.5% between 2003 and 2008 then constant at 4.5% afterward. The decline rate for each annual addition is 4.5% after first year. The observed data points are the monthly crude oil + NGL estimates from the EIA.
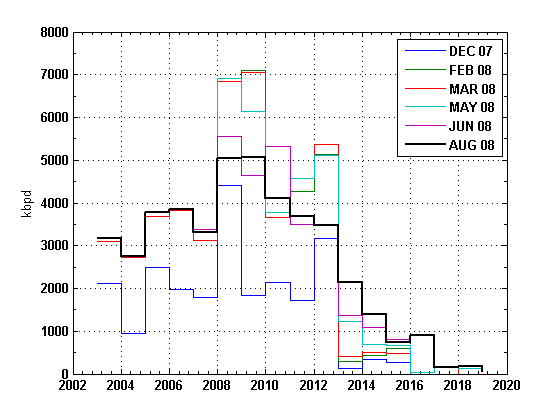
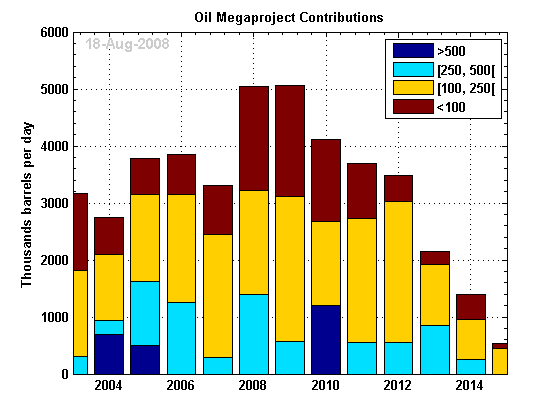
Here is the last compilation of new supply peak contributions stacked according to their projected first oil year:

Below is the evolution of this chart since the database creation. Since last month, the 2008 and 2010 levels went down and 2013-2014 went up.
Below is an hypotetical scenario for future supply growth based on the Megaproject database and a 4.5% decline rate for the resource base. The last monthly numbers from the EIA seem to confirm an increase in supply of about 2 mbpd compared to the same month last year. The years 2008 and 2009 should see reasonnable supply growth after 2 years of negative growth then a decline is foressen at the moment starting in 2010-2011.
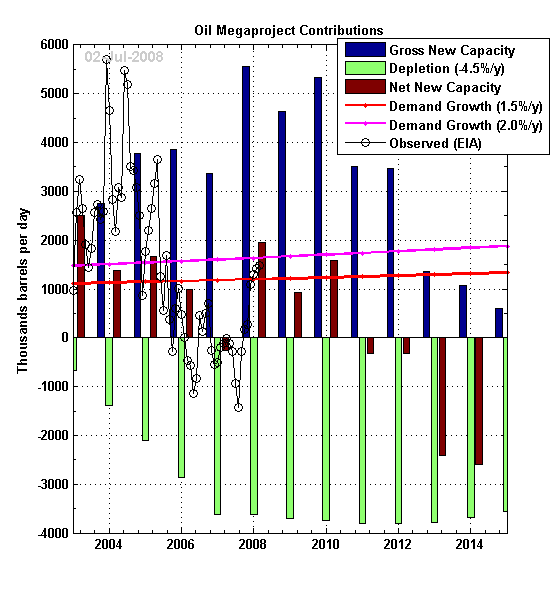
Possible new gross and net new supply additions compiled by year of first oil. The observed data is the year-on-year change in Crude oil + NGL monthly production from the EIA. The resource base post-2002 decline is a linearly increasing rate from 0% to 4.5% between 2003 and 2008 then constant at 4,5% afterward. The decline rate for each annual addition is 4.5% after first year. Demand growth is calculated using 2002 as a baseline.
Below is the corresponding supply profile for crude oil + NGL where a broad production peak is seen around 2010.
Possible future supply capacity scenario for crude oil and NGL based on the Wikipedia Oil Megaproject database. The resource base post-2002 decline rate is a linearly increasing rate from 0% to 4.5% between 2003 and 2008 then constant at 4.5% afterward. The decline rate for each annual addition is 4.5% after first year. The observed data points are the monthly crude oil + NGL estimates from the EIA.
Many thanks to Ace and countless others who have diligently updated the data.
Finally, maintaining this database is a lot of work and it is crucial to track delays, project final approval, etc., so I'd like to repeat our appeal: the more folks in the TOD community head over to the Wikipage and help, the faster we'll know what's really going on here.
Related stories:
Oil Megaproject Update (July 2008)
Update on Megaproject Megaproject
Help us List Megaprojects
“What gets us into trouble is not what we don't know, it's what we know for sure that just ain't so.”
—Mark Twain
Contact
- Content: editors at theoildrum dot com
- Tech support: support at theoildrum dot com
License

This work is licensed under a Creative Commons Attribution-Share Alike 3.0 United States License.
Fellas -thank you for continuing to volunteer your time in this area. This is great work and the DOE, IEA, EIA and Jon Q Public should all thank you.
Question: for the megaprojects tranches, did you come across any cost time series (finding and development)?
I.e. the dark blue (resource base) gets cut in half in the next decade. This is the old oil. Does the new oil cost $20 per barrel, $50? $100? Basically not only will we need to know the amount of oil, the decline rate, but also the cost structure. 60 million barrels in 2020 is a moderate decline (given alt energy, efficiency, conservation, etc.) but if it costs $200 a barrel (2008 dollars) it has far different social implications than $80 oil.
I suppose if we knew the marginal cost of the oil coming online in 2015 we might be able to predict a floor price for that year. In theory, if the most expensive new project of 2015 has a break-even cost of $100 per barrel, then the oil price should not fall below this.
In practice I'm not sure this piece of conventional wisdom will be terrible useful - the projects coming on stream in 2015 will be going through the approval process right now, and it is unlikely they would get the tick unless the expected production cost was less than $70, since who wants to risk a fall in prices?
The implication is that the current spot price, which should act as a market signal telling planners to go ahead and produce expensive oil, will actually be ignored in favour of something like a lagging 3 year average. So in order to prompt production of whatever "$100 oil" may exist, the spot price would need to be well over $100 for several continuous years.
Hypothetical question:
If the production cost hurdle rate was $100
how much oil could be produced, and by when?
If the production cost hurdle rate was $200, how much could be produced, and by when?
what I'm trying to get at is how much oil is "out there" in any reasonably high case future?
Trying to paint some different scenarios
Simmons is saying $500 oil. maybe he is right. in which case $200 production costs would be very reasonable
If it takes 10 years to get that oil to market, we should start now
This is why I think worldwide decline rates presented by Khebab and others are close to best case (though they are not including EOR). Its easy to ignore the law of receding horizons, which reflects the basic fact that many costs accelerate along with revenues - so an oil project that looks like it has juicy profits with projected costs of $70 all in, will either be scrapped, delayed, or scaled down as costs go up almost as much as the commodity. As we deplete the fixed oil in the ground and replace with higher costs marginal new oil, the rate of change of the price floor will rise faster than the rate of change of the crude price.
This is because the market is not correctly pricing in future production potential.
I think free markets have a fundamental flaw if they are misinformed. In general they only work if they have reasonably correct data and external forces such as subsidies don't distort the market to much with to much being intentionally vague.
The oil market is only fungible over a fairly short term time period for immediate production and is in general misinformed.
Next even if it was a more perfect market you have a real problem in the case of resource depletion since current production costs have been marked down for the marginal barrel of oil sold the market underprices future production costs and certainly flows.
Free markets are horrible at resource management and most of the distortions we apply to free markets tend to further push short term gains over long term viability.
I'd invite anyone to show me a free market that actually resulted in correctly managing a resource.
This is why open markets suffer wild fluctuation's in prices when the underlying resource starts to decline. They are always behind the curve and as they explore the maximum price boundaries the market participants who are human don't like the fact that the market signal is that the only bound is the price that ensures enough demand destruction to balance supply.
Thus the core issue is that any open market is poor when the problem to be solved is reducing demand to match supply much less prorating rising production costs.
This is even worse for critical resources.
A really good example of market failure is famines.
Also in the cases of many famines if you look you will generally find that external interference of some sort caused the market to be distorted leading to failure shortly after supply problems start happening. Its hard to find evidence of famines without heavy distortion but the isolated Indian communities of the southwest United States are probably a good example of decline because of resource loss and indeed it seems they took a long time to finally fail.
In my opinion the best corollary for peak oil is famines under various conditions.
The historical record contains information about various famines with modifications to the standard free market that closely parallel all the responses we have to peak oil including even the export land effect. In basically all cases the outcome was the same.
Said differently, the market does a pretty good job of pricing above ground resources (e.g. how much is in tankers, in barrels, in storage vs. how much demand there is), and a terrible job of pricing long term underground resources that are yet to be procured. It is my opinion this is linked to our domain specific neural wiring that focuses (as it historically always did) on the present.
I agree we intrinsically distort the yet to be procured problem. This paper is actually a perfect example it presents a generally rosy picture by ignoring almost all complications except what is probably a low estimate of the decline rate in production.
On theoildrum of course these issues will be highlighted so the overall presentation is balanced but I'd suggest that this is rare most of the time this distortion makes its way into our assumptions about the world without critical review. As I side note it shows one thing I've noticed is that few people understand the importance of true peer review. Despite the problems with peer review its the basic principle of science in my opinion.
But this goes back to the misinformed market problem underlying that is the simple fact that we intrinsically desire to be misinformed. Its part of our neural makeup.
Although it might seem off base the classic example is that people continuously fall for the exact same scams year after year and thus on of the biggest truths about people is that a sucker is indeed born every minute.
The problem is of course to counteract this intrinsic problem you generally have to present the absolutely worst case scenario to get a problem to be recognized but then in general your labeled a doomer and banned from society. So not only are we suckers for the best news we are very effective at killing the messenger of bad tidings.
And last but not least in the ultimate hypocrisy of our self denial we don't even admit that we think this way.
I think the only reasons humans have been successful is that in the past we have always had groups of breeding populations able to reinfect the host (Earth) when our civilizations collapse. Our success is thus based on our ability to survive in harsh environments and continuously repopulate
from a base hunter/gatherer level if needed.
In general the difference between oil and food is that food (locally) depends on the weather and the weather changes on a year to year basis. The population is sometimes over the carrying capacity for that year, but most of the time is substantially over.
Famines kill poor older people and poor people's children mostly, because they are not powerfull enough to fight for food, or have savings enough to buy it, or economically usefull enough to borrow money and buy food.
What is happening in oil now is more like shifting ecotomes during climate change. The rain just stops falling as frequently and intensely as it used to.
Hmm
1.) Fighting for it ? Yep
2.) Only the strongest/wealthiest get it ? Yep
3.) Economically powerful enough to borrow to buy it ? Yep
Actually my point is in the real world everything your saying is not happening is happening.
Geologic depletion itself presents the problem as a slow steady decline in most models its not clear that they are correct.
But reality is a different picture. In a few years we will know the truth but the chances of you being correct in your description are slim just like I'm willing to bet 100 dollars that future production will be less then is predicted by the model used in this paper. Are you willing to take that bet ?
I'm glad you agree with me. What made you change your mind? (Just trolling! I'm joking, joking!)
:)
Actually its important the reason for the production curves for oil is because of above ground factors certainly the details of the reservoir effect its production profile but we could have produced our reserves for 1000 years if we chose to.
Or never for that matter.
Geologies input is given a certain extraction profile whats the final result.
Everything else from the extraction profile i.e who/what/when/where/why of oil extraction on up is above ground decisions.
This is important because real future oil production is at the moment on a month by month basis depending on geopolitical events and hurricanes in the gulf. And major disruption in oil supplies from now on out will probably lead to war that will further disrupt oil supplies. After the US elections tension may drop and we are back worried about geologic depletion but its going to keep flipping back and forth.
As we flip this coin so to speak the chances are incredibility high that above ground factors will result in lower oil production then we would see vs the baseline geologic depletion.
At the longest we are at best on a five year horizon within five years peak oil will have to be accepted within five years after that chances are society will be quite different from what it is today.
This is certain even from the geologic graph.
Some dodgy pseudopsychology in posts above:
On the contrary, one of the most important facts of human psychology is great individual differences in many respects. For instance Mozart said he considered death would be his truest friend, and Schubert every night hoped he would not wake up the next morning. In a late decadent society such as here/now, there will be a preponderance of short-termism, wishfulthinking and pretentiousness, but still it is not universal. But some behaviours dominate a society. The wastefulness of high-livers tends to defeat the efforts of more prudent others. High spenders force up prices for everyone else. Peaceful people are dominated by warmongers. Etc.
No. Some more basic principles of science are basing one's conclusions on demonstrable evidence and reasoning. And getting beyond mere "authority" assertions by providing justification of one's assertions by presenting one's data and reasoning. This means that everyone can judge the scientific case for themself (in principle) rather than having to rely on some contest of either status or numbers or a mix thereof. I didn't take the view that AnthroGlobalWarming is happening until I saw the case behind the (near)consensus. The (near)consensus (of intellectual prostitutes) is certainly utterly wrong on other matters such as the hiv-aids hoax.
This is why I celebrate and do not castigate the presence of investment demand in the back end of the crude oil futures curve. I am also a strong advocate of the idea that we need more speculators in oil, not less. Functionally, that large institutional capital that has flowed into the out years of the curve is available to oil and gas production companies that want to take advantage of it. I'm also quite confident that an enormous amount of thought and research lies behind much of that investment demand for oil in the out-years. The smart money reads the Oil Drum, and agrees. It's OK. Rex Tillerson doesn't get it and doesn't want to. However, CEO's of other oil and gas companies do. The sooner we get future expected prices into the present, the better.
G
Memmel
One of the other distortions we need to consider with respect to the cost of production is the differential between capital cost and production cost.
A substantial portion of the cost of production is the capital cost of the oil production facilities. In many cases (and increasingly so into the future) this capital cost represent a greater portion of the production cost than does ongoing operations. Once the project is committed and built then this is a sunk cost. To continue viable production the operator only needs to overcome the hurdle of the ongoing operational cost, a much smaller number.
If you examine the receeding horizon issue raised by Nate then you need to treat new field development in a different way than production from existing developed fields.
Right receding horizons is a bigger problem for new fields agree 100%.
But with most of our fields getting pretty old infield drilling is at best slowing decline. The problem is without a fairly continuous supply of new fields esp in the small field case with lifetimes of 5-10 years you quickly hit the point where more and more fields are in the heavily depleted steep decline case. Its only the new fields we have developed over the last 20 years that has kept production up.
This is on top of the broad hopefully slower decline of the giant fields that dominate the production. Deep Water for example precludes development of smaller fields same with artic etc. Simply because of costs and receding horizon problems make it uncertain how much of the arctic or deepwater will ever be developed.
We are losing our shallow water smaller fields that really kept production going over the last 20-30 years and the new replacement choices are prohibitive in cost capital wise and energy wise.
Nate: I assume you meant "Law of receding horizons reflects the basic fact that many costs accelerate along with revenues"
D'accord. Merci
polytropos said:
Simmons is saying $500 oil. maybe he is right. in which case $200 production costs would be very reasonable
If it takes 10 years to get that oil to market, we should start now
Why? Is the aim simply to keep economic growth going for as long as possible, whatever the cost? What would be your position once oil is well into its decline and there is no possibility of ramping it back up? Is it only then that you would think, "hold on, we're going to have to figure out how to live with declining energy supplies, better get onto that project as a matter of priority"?
Why do so many people want the world to use a strategy of reaction, instead of proactive planning? Wouldn't it be better to assume peak in 2010, at whatever price, and plan accordingly? You can't put this off for ever.
It's worth noting that you're not necessarily contradicting the previous poster.
If you assume a peak in 2010, "how much is available at $500?" is essentially a quantitative version of "what's the shape of the post-peak decline curve?"
Knowing that - and knowing how the world economy is likely to react - is a key part of planning accordingly.
Maybe because, to be truly proactive in planning, planners would have to admit that we passed the limit to growth long ago. It's a tough call to tell 6 billion people they have been fired and will have to get off the planet. At the same time those planners would have to be setting a new earth friendly industrial system in place for the remaining populous, possibly by beginning with some sort of sustainable energy source such as a massive wind power project...hmmmm!! ;-)
Keep in mind that there are two bounds on the upper level of oil price. One is the development of mining technology that reduces the cost of battery elements (lead, lithium, cobalt, and nickel for transport), and the other is the development of materials technology for low temperature and low pressure catalysts for synfuels.
Thanks to everyone involved for the huge amount of work in this project.
Question: Do you try to capture BTL, CTL and GTL projects in this database?
BTL projects are excluded.
CTL included
eg China Erdos CTL Ph 1 2008 20 kbd
http://en.wikipedia.org/wiki/Oil_Megaprojects/2008
GTL included
Qatar Pearl 2009 & 2011
Nigeria Escravos 2011
An excellent job!
Has anyone posted a chart or guesstimate on the amount of heavy oil (<20 API) megaprojects. I guess some big producers are producing mainly heavy oil--most of Brazil, Angola, Mexico, Venezuela, Kuwait, even Iran off in the future. I am surprised that so much heavy oil is offshore as that seems like a production headache.
I thought Ural fields were mainly heavy oil but many projects aren't marked.
Overtime how rapidly is heavy oil increasing as a proportion of world crude OPEC/Non-OPEC? I think that most US refineries are equipped for heavy and sour but I thought most overseas refineries were light only; I imagine conversion is extremely expensive. Is this going to result in a bottleneck?
I thought heavy oil was priced at about half as much as WTI?
Brazil is a good example of an offshore heavy oil production headache.
The chart below shows Petrobras crude/NGL production forecast in Brazil. Almost all of Brazil's production is related to Petrobras projects. It's doubtful that Petrobras will be able to meet their 2008 crude/NGL production target of 1.95 mbd since the YTD average to July 2008 is only 1.84 mbd. Oil analysts Broad and Kovarsky agree.
http://www.bloomberg.com/apps/news?pid=20601087&sid=anXwzNM8si2c&refer=home
http://www.bloomberg.com/apps/news?pid=20601072&sid=arYVWwf8e8sg&refer=e...
I think that Brazil's crude/NGL annual production rate will never exceed 2.3 mbd.
click to enlarge
source http://www2.petrobras.com.br/ri/pdf/Diretor-Almir-IBEF-final.pdf
The chart below shows Brazil's megaprojects by year. Despite capacity additions of 340 kbd in 2006 and 640 kbd in 2007, Brazil's production looks more like a plateau since 2006 rather than a good increase. Maybe Brazil's underlying production decline rate is over 10%/year.
For reference the EIA Brazil crude/condensate production data is shown. It is less than Petrobras because NGLs are excluded in the EIA data.
click to enlarge
source
http://www2.petrobras.com.br/portal/frame_ri.asp?pagina=/ri/ing/Destaque...
http://www.eia.doe.gov/ipm/supply.html
In his January 2008 newsletter, Colin Campbell forecasts Brazil's crude production, split between regular and deepwater. His forecast shows that Brazil is on a plateau, including Tupi. A quote from his newsletter:
This is an interesting presentation by Petrobras on Tupi.
http://www2.petrobras.com.br/ri/ing/DestaquesOperacionais/ExploracaoProd...
Petrobras Brazil onshore crude oil production appears to have peaked in 2003 at 221 kbd and NGL appears to have peaked at 87 kbd in 2006.
http://www2.petrobras.com.br/portal/frame_ri.asp?pagina=/ri/ing/Destaque...
source Jan 2008 newsletter
http://www.aspo-ireland.org/index.cfm/page/newsletter
Offshore heavy oil production is difficult. What is also disappointing is that Brazil's additional capacity of 1000 kbd from 2006/2007 has not signficantly increased Brazil's production yet. Brazil's 1000 kbd additional capacity is about 12% of the world Megaprojects capacity additions for 2006/2007 and it's not becoming increased production.
As I see it Angola/Gabon are similar offshore heavy oil provinces to Brazil(which would please only Alfred Wegener, I think).
Rigzone has estimates of world heavy oil reserves totaling 429 Gb.
(yet I read online somebody else said that the Persian Gulf had several hundred Gb of heavy oil.)
60% of heavy oil is in South America
and 80% of bitumen in North America.
http://www.rigzone.com/magazine/heavyoil/
As I remember ASPO suspects that the nature of the bitumen resource will extract much slower than conventional regardless of investment and
as you mention heavy oil( and not just extra-heavy) may be extracted much slower than conventional as well. Then you have problems with heavy sour refining capacity, yet megaprojects curves all look only slightly more inclined over time.
Your graph shows that the world didn't peak in 2006--because of tar sands AND heavy oil?
Cantarell is an offshore heavy oil field. Is it depleting 'normally'?
I'm sure you've heard the claim that there is enough heavy oil to delay peak oil for many years.
If only conventional crude/condensate (C&C) production is considered then the peak year may have been 2005. Including tar sands and heavy oil could cause the peak C&C year to be 2008. However, the specific year of peak is not as important as the strong likelihood that the peak 74 mbd C&C production plateau will end in 2008. World C&C production is forecast to drop to 72.9 mbd in 2009.
There was a good discussion of Cantarell on yesterday's Drumbeat
http://www.theoildrum.com/node/4438/397039
and some background here
http://en.wikipedia.org/wiki/Cantarell_Field
A nod and a wink to you Alfie reference majorian. We geologists do appreciate any attention.
Hehe...(Wegener)... is that why East Greenland has 31.4 Gb boe without drilling a single well?(Greenland mirrors Norway)
http://pubs.usgs.gov/fs/2007/3077/pdf/FS07-3077_508.pdf
And this is exactly the reason why the above methodology:
(a) assume an average decline rate for the existing oil supply system
(b) add Mega-projects
fails. You have to do it country by country. Moreover, if there are now so many smaller projects in the hundreds, many will be in-fills, enhanced oil recovery etc. at field level, so you got to take the field decline rate which was 7% pa in 2005, increasing to 10% pa in 2015. Read here:
IEA workshop July 2004 in Rio entitled "Is the world facing a 3rd oil shock?"
http://195.200.115.136/textbase/speech/2004/kr_rio.pdf
Drill,drill,drill at $95 per barrel cost in GOM!?
http://money.cnn.com/2008/08/21/news/economy/oil_price_floor/
Indeed. Another piece of data dropped into my ongoing project, which is to have a running notion of the price level of the marginal bbl. I'm still using 90.00. And am comforted that Goldman Sachs is above me at 105.00. For myself, I use: statements by deep-water/expensive drillers like Statoil, Petrobras, and now Chevron. I use commentary from groups like TAQA when they describe marginal cost levels globally, as they invest in the oil sands. I use Russian extraction and export duties (stealth indications of both hoarding, and ELM), and I also use quarterly reports which reeveal cost inflation and cost projections for various new projects. I'm still at 90.00. However, when Petrobras received their first bill this month for drilling 20 pre-salt wells, at 1 billion, I started thinking about moving up towards 100.00.
G
Khebab, just to be crystal clear, is the decline rate used for all liquids or C+C+NGL? Just want to be clear.
Second, the IEA's latest decline number is 5.2%. Given the IEA is better regarded than CERA, why go with the out-of-date and CERA-supported 4.5%? Given that 4.5 was the generally accepted number before Russia began declining in total output, does that not support the 5.2 number rather than the 4.5?
If you go with 5.2%, what does that do to the database?
Cheers
We are just tracking C+C and NGL projects for now, including synthetic fuels such as tar sands.
Ideally we should produce several forecasts with high/low assumptions on the resource base decline value. The Hubbert linearization gives around 5% for the asymptotic decline rate:
Using 5.2% and 6 years as a maturation period instead of 5 years, we get a longer plateau and a peak around 2008-2009:
Colin Campbell agrees with your statement, but includes processing gains and excludes biofuels. June 2008 Newsletter.
http://www.aspo-ireland.org/index.cfm?page=viewNewsletterArticle&id=49
My total liquids forecast has been updated for the recent Megaprojects changes including Iraq project delays, July production for Mexico/Brazil and the IEA's July 2008 OMR highlights.
http://omrpublic.iea.org/
Total liquids production, including biofuels, is forecast to peak at 86.8 mbd for 2008 and 86.0 mbd for 2009.
Supply, Demand and Price to 2012 - click to enlarge
Hi ace
How can supply and demand diverge? I thought they were always equal and the price changed to reflect the balance point. Or does the curve show what supply and demand would look like at a particular price - in which case what is the price point being assumed?
Khebab - huge thx for the overview.
tw
Historic demand and supply will differ slightly due to inventory fluctuations.
Future demand is labelled as "notional" in the chart which is an attempt to estimate future demand based on current expectations and the current price of oil. These demand projections are similar to those of the IEA. See pages 4-14 of the IEA July 2008 OMR and Table 2 on page 46.
http://omrpublic.iea.org/currentissues/full.pdf
OPEC also discusses demand in their Aug 2008 OMR. See pages 20-26 and Table 32 on page 53.
http://www.opec.org/home/Monthly%20Oil%20Market%20Reports/2008/pdf/MR082...
The price is forecast to increase which will force demand destruction downwards to the red supply curve.
The price chart assumes an inflation rate of 9%/yr so the price in 2012 is in 2012 dollars, not 2008 dollars. This inflation rate may seem high but unlike official US Government figures it includes food and energy. This 9%/yr is also much less than the estimated true inflation of just over 11% from John Williams' Shadowstats.
http://www.shadowstats.com/alternate_data
Other assumptions include an inelastic price elasticity of demand of 0.10 which remains constant until 2012. To take into account long run demand destruction, only half of the supply demand gap is used for calculating the price increase. An alternative method is to increase the price elasticity over time so that the long run price elasticity is greater than the short run price elasticity. See page 24 of this report for more information.
http://cta.ornl.gov/cta/Publications/Reports/ORNL_TM2005_45.pdf
A serious weakness of using price elasticities is selecting the initial price and quantity which are used to calculate the forecast price. In this case, the quantity or supply has been relatively constant. However, the recent price has been exceptionally volatile in an increasing trend and the unit of price measure, the USD, has been volatile in a decreasing trend.
http://quotes.ino.com/chart/?s=NYBOT_DX
http://en.wikipedia.org/wiki/Price_elasticity_of_demand
Selection of the initial price is subjective. The weighted average oil price in Jan 2007 was $50 and on May 23, 2008 it was $123.
http://tonto.eia.doe.gov/dnav/pet/xls/pet_pri_wco_k_w.xls
I have used an initial price of $99 to forecast the price, as I am assuming that some of the recent price increase is due to investment demand. If I used $123 the price forecast would be much steeper. Instead of using the words "price forecast" it probably should be called a "price projection".
The price forecast does not take into account price shocks from planned/unplanned maintenance, terrorist attacks, wars, hurricanes, oil pipeline leaks, voluntary production cuts, hoarding, further project delays, labour shortages, oil tax changes or fuel price control changes. The price forecast does not include investment demand. A price elasticity of supply is not used because the supply forecast is based on production decline rates and depletion rates of remaining recoverable reserves.
The demand forecast in the price chart above is based on a bottom up forecast of 18 regions/countries and is reasonable but does not include the possible effect of a deep global recession. As total liquids supply decreases, panic and hoarding could result causing increased price volatility and temporary price spikes. My price forecast is a rough estimate and is for a weighted average oil price. It would not surprise me if light sweet crudes such as Tapis exceed $150/barrel by the end of the year. If there was a sudden supply interruption from Iran or Nigeria, Tapis might reach $200/barrel this year.
thx ace for a comprehensive response!
tw
Ace,
I think there are some great speculative work/assumptions your making here.
There was a very useful -if lengthy- paper refered to on TOD recently regarding possible future prices. It dealt with aspects around a trading range of (lower) Marginal barel cost to (upper) 'User Value' which I took to mean the maximum value before demand destruction/recession kicks in. I think they said the lower value was ~$110. Also there is a 'speculator margin' of upto ~20%-25% on either end as the price over/undershoots. I think it would be great to incorporate somthing along those lines into a future graph to show upper and lower prices, I got an upper value near $500 around 2020 doing this...
In addition nothing goes in a straight line so within those bands for the next decade the price will be up and down like a yoyo as recessions kick in -for example the price could hit 'max band line' in 2012 then crash to 'min-band line' as PO recession bites b4 starting its inevitable climb again. It might be possible to map this as an oscillator around a business cycle lenght -say 4-5 years. Again all getting highly specualtive.
For sure the highs will be higher and lows will also be higher post PO.
Nick.
"Other assumptions include an inelastic price elasticity of demand of 0.10 which remains constant until 2012. To take into account long run demand destruction, only half of the supply demand gap is used for calculating the price increase. An alternative method is to increase the price elasticity over time so that the long run price elasticity is greater than the short run price elasticity."
I believe that a recent assessment for the price elasticity of demand shows that short term elasticity of demand to be 0.03, and long term (greater than one year) to be 0.07. If you cruch the numbers, these numbers seem about right. For the purposes of these analyses, I would always assume long term behavior.
As fuel prices continue to increase, I would expect the long term price elasticity of demand to increase. This is because the ability for households to absorb higher fuel prices diminishes, and people will start to adopt more inconvenient measures for vehicle use to avoid higher and higher fuel bills (i.e., they would rather car pool than loose their home).
At my own workplace, this has proven to be true. I ride my bike to work and despite the increasing gasoline prices from 2004 to 2007, bike ridership did not increase that much. However, in 2008 with the price of oil skyrocketing to almost $150/bbl, bike ridership increaed dramatically. We now have to build in increased bike parking capacity. This is also supported by the price elasticity of demand back in the early 80s when fuel costs comprised a larger portion of our income. The price elasticity of demand was 0.20 back then. Assuming higher price elasticity of demands would be consistent with our economies being hit by recessions.
Thus, you may want to use a higher price elasticity of demand at higher oil prices. For example, above $200/bbl, you could use 0.15 and with oil prices above $250/bbl perhaps use 0.20.
Using a higher price elasticity of demand obviously reduces the price impact of diminished supplies.
Retsel
Khebab, Ace,
First, quick question. Is the megaprojects data available anywhere in a easy computer readable form, or is the wiki page the authoritative source?
Second, I'd suggest its reasonable to expect decline rates to increase over time. We know the impact the largest fields have on the total, and the way in which infill drilling etc. can only reduce their decline rates for so long, before their production is pulled back to the historic curve with faster than average decline rates (cf Ghawar, Cantarell). We also know that even the new, smaller, fields tend to decline in production after only a short time.
Thus I'd suggest the CERA 4.5% > IEA 5.2% is more a question of when you do your calculations and highlights a steady increase in rates. Put a monotonically increasing value for decline rates onto your data and the result is to sharpen the peak and increase post 2010 net decline rates - which is the key point for societal adaptation.
Lastly, ace, I think the most telling element is the correlation between the production upkicks in predicted and actual data. Its a good thing to see! If the 2000-2004 data could be bought into correlation (maybe with a recognition of major production sustainment projects on old fields?) then I think the media could easily be enticed into using it over less considered analysis.
Thanks much.
Cheers
Its hard to read the Possible future supply capacity scenario chart.
How many mbd does it peak out at in 2010?
around 82-83 mbpd.
What would that convert to on an "all liquids" basis similar to what EIA publishes?
It depends on the future refinery gains, Biofuel/Ethanol production, etc.. lets say it's around 4 mbpd, it gives 86-87 mbpd for all liquids.
It is my understanding that many projects are not announced until 3-4 years before their start up. If this is the case the down slope might not be quite so severe.
It is true that there exists a project sanction time horizon. This issue was discussed in this thread of Khebab's July 2008 Megaproject Update
http://canada.theoildrum.com/node/3958/373254
The first part of the thread is copied here for convenience:
Yes, there should be an increase in expected new supply for 2013 and beyond as shown in the second chart.
According to the red line in the chart below, the recent average discovery rate has dropped to about 6 Gb/year since 2001. If an optimistic depletion rate of 6%/year is applied to this discovery rate of 6 Gb/yr, this implies that new project capacities should be 0.36 Gb/yr or about 1 mbd/yr for regular oil.
Source of original discovery graph is from Colin Campbell's monthly newsletter
http://www.aspo-ireland.org/index.cfm/page/newsletter
It is further assumed that by the year 2022, almost all of the discoveries prior to 2001 will have been turned into production. This means that only 1 mbd/yr will be the gross annual capacity additions for regular oil. Being optimistic, another 0.25 mbd/yr could be added for tar sands and NGLs. This gives a forecast capacity addition of 1.25 mbd for 2022 shown in the chart below.
As there will probably be more project delays, some of the capacity additions for 2010 to 2012 will be pushed into 2013 and beyond. Consequently, an estimated forecast supply addition profile, shown by black line below, is a likely outcome. This profile includes yet to be sanctioned projects based on the discovery profile in the chart above.
Ace,
A suggestion for a companion piece (as Khebab can testify, I am very good at suggesting projects for other people to do). In any case, how about a continuing update of all oil fields that have ever produced one mbpd or more of crude oil? If memory serves, there were 14, with four--Ghawar, Cantarell, Burgan and Daqing--still producing one mbpd or more. Of course, it now appears that we are down to two, Ghawar & Burgan.
The elephant in the room is of course Ghawar. Given the challenges in getting accurate production data, the best assessment may come from evaluating all fields which have ever produced one mbpd or more, excluding the Ghawar complex.
It would be very interesting to see what a HL plot of the bottom 13 would show.
BTW, does anyone believe that the total Ghawar complex is not presently in decline?
Ace :
A potential problem with basing estimates of future new production on recent discoveries :
Perhaps there is a backlog of long-since discovered, undeveloped fields to produce? The Saudis claim this, of course, and it might conceivably be the case elsewhere in the ME, where they may disdain little fields that would make a Texas oilman wet his pants. In this scenario, when their big fields peak, they race to develop the little ones, which of course deplete quickly, but might push the plateau out a few years???
It is further assumed that by the year 2022, almost all of the discoveries prior to 2001 will have been turned into production.
Do you mean that all discoveries prior to 2001 are accounted for in the projected new production in this graph?
Thank you for the thorough reply. The next 5 years should be very interesting to say the least.
It's a real concern with that kind of bottom-up approach, tar sands megaproject are announced a long time before construction and we have a good visibility up to 2020. Now some projects cannot be included simply because they have not been discovered yet :). This is what happened with Brazil for instance, where we have added Tupi and other recent importnat discoveries. A prudent guess is to assume a 6 Gb of new discovery every year as shown by Ace above but we don't know how many of those will be megaprojects and the impact on new supply will be dispersed other a long period of time. Also, some projects in the database have not received their final financing approval so it's not sure if they will produce any oil.
The amount of new projects is falling by 2 thirds between 2012 and 2013, this is 5 years for now. If in August 2009, the 2013 number comes up at the same level as 2012, we can then say the we had an horizon effect in 2008.
We can say that pretty confidently already: compare today's version of the page with that from the end of last December. 2012's total has changed by about 25%, whereas 2013's total has changed by about 1,500%.
The data seems roughly stable up to 4-5 years out, but there seems to be very limited information beyond that. As has been discussed before, that's exactly what we'd expect, since typical announcement-to-oil delays seem to be about 4 years.
Hello to the Megaprojects Editors,
I second the motion by Nate Hagens that the entire world owes a Huge Thxs to your efforts, and I hope that people from CERA/IHS, USGS, EIA, XOM, OPEC, RigZone, etc, etc will contribute further info for enhancement.
Too bad that the cascading blowback concepts detailed by Jeff Vail, John Robb @ GlobalGuerrilas, Matt Simmons [rust & corrosion], and others will probably lower and slightly shift this final peak.
Bob Shaw in Phx,Az Are Humans Smarter than Yeast?
Like all others I also add my huge thanks for the tireless effort being put up by this group.
I have two questions to kebab.
1. It is becoming clearer that in the period 2011-15, the peak oil will be reached. The data focusses on Crude+condensate production. Since increasingly Natural Gas will replace large quantity of Oil, how does the projection look with Natural Gas also added?
2. Notwithstanding the doubts being expressed by many experts, it is clear that all around the world, besides some amount of demand destruction, major efforts are on to replace oil with renewable/alternate sources of energy (Ethanol, bio-diesel, wind power, Nuclear power etc.)Taking all these into account how does the total energy supply-demand outlook will be, say, next 50 years?
Thanks
Excellent Post!
Your hard work is appreciated.
I assume that the production estimates are gross production values. For the purpose of evaluating relative energy availability, have any estimates been made of net export (production +/- + internal consumption +/-)?
Further, have any estimates been made for EREOI as the more challenging fields are developed?
For net importing countries, gross production is just part of the picture.
I am not a petroleum geek. How can I help?
Interesting if I'm reading the graph correctly it look like by 2010 about 25% of the supply will be from projects brought online after 2003. About 20 mbpd. Over a seven year period.
The historical data has about 3.5 mbpd coming online per year from 2003 to 2007 so projecting this forward give 24.5 mbd total.
A rough total from the graph of additions gives about 40mbd so you have about 40% difference between average past performance projected forward and the prediction from the mega projects.
The net new additions seem to total about 9.5 mbd given the 4.5% depletion rate.
Looks to me like the projected production increases are in the uncertainty level of the projects.
This fits fairly well with the revisions made since the database creation in Dec 07 if you would consider the updates as a sort of error term.
I think its a bit erroneous to use this months supply to assume a 2mbpd increase actually happened this year at least some sort of running average is needed to detect a supply increase.
Khebad normally does a better job at this.
http://www.theoildrum.com/node/4386
Finally the error in reported production has been discussed in the past I did not find the link but I recall its either +/- 1mbd or +/- 2mbd I think potentially misquoting Khebab he said +/- 1mbd.
Assuming the worst case of -1mbd and and expect 300kbd revision downwards we might have a real increase this year of not 2.0 mbd but 0.6 mbd. Given that May was one of the highest shipping months using any type of smoothing average over the year probably drops this down to between 0.2-0.4 mbd.
Net oil exports however have consistently been closer to 2006 thus its a pretty safe bet that if we did get a production increase of this level it probably did not result in a change in net exports for the year. Mexico's decline alone put a serious dent in net exports.
Whats interesting is that the uncertainty seems pretty high in these numbers other changes like higher decline rates etc would also have a significant impact on the total increases as shown by changing the decline rate assumptions from 4.5 to 5%.
And finally although its not explicit it would be nice to see the contributions broken out into light sweet vs NGL vs heavy sour etc.
Its NGL's and unconventional are broken out on the Wiki page
Here we can see that for 2008 at least conventional crude is 4mbd much closer to the results of previous years where a lot of the production was conventional.
Finally we can throw in some reasonable EROEI estimates on top of this coupled with ExportLand and the net energy supplied to importing countries is certainly down.
Although a pessimistic analysis I don't think any of these observations are unreasonable.
I hope my pessimistic viewpoint balances the optimism that one would have from a quick read of the results.
Hi All. This may be somewhat off point, but I have been thinking about the potential effect on exporting countries when they realize that their internal demand will soon outstrip internal production, and as a result, will reduce their exports at a faster rate than the projected normal production declines.
The reason I mentions this is that if this kind of effect does come into play, it could substantially alter the timing and severity of peak oil and thus the production and supply curves that depend on current market dynamics and psychology.
My line of reasoning was spurred by Jeffrey J. Brown’s recent post through Khebab
"Geopolitical Disruptions #1: Theory of Disruptions to Oil & Resource Supply"
http://www.theoildrum.com/node/4373
where he argued using the “Land Export Model” that the large profits of oil exporting countries creates a feedback loop which encourages internal consumption. Then, when their production begins to decline, their stimulated economies cause them to become net oil importers far sooner than one might have normally predicted.
My feeling is there will be a second feedback loop, which is once KSA, Russia, Norway, Iran, Nigeria, UAR, and the other remaining large exporters realize that they only have few years left before internal consumption outstrips internal production, they will cut back or eliminate exports at a rate that is a balance between the short term revenue loss and the projected long-term impact of continually falling internal oil supplies.
I anticipate that such a rate will be far more severe than normal production declines and will most likely be preceded by a mad rush to find the last low-hanging fruit, something I think we are currently seeing here in the U.S. with the drumbeat to drill off-shore, in the Arctic, under the pole, and in the lobby of whatever Walmart John McCain is standing in.
This reaction, which could be loosely, termed “Hording” might be modelable if we have other market examples to follow or know what the driving factors/triggers are and what theory to apply. However, I’m not familiar with economic hoarding theories. Does anyone have any thoughts here? Chaos Theory might also be applicable.
My personal bet is that such a reaction will be triggered one of the remaining large exporters announcing their intent, followed by many others which would then lead to a world-wide oil production crash. - SMH
Stephen:
I don't think this is in any way off point, as IMO, this thread is about available energy. Production figures are all well and good but the situations you mention are very relevant. Geopolitics may eclipse geological constraints. Politics are an intrinsic part of the energy equation.
I may be suggesting something outside of this thread, and perhaps something outside of this site, but I feel that we should be expressing figures in terms of energy units, which would clarify the production, consumption and transfer of energy around the globe.
By expressing changes in terms of net available energy, the data has much more context. If oil production is decreasing at x quads per year and wind power etc. is increasing at y quads per year, the situation is clearer.
Unfortunately, this means that the quality of the oil source (light sweet, heavy, sour, etc) must be quantified better (BOE is not sufficient), as well as the EROEI of any alternative source. Thus, it means much more work.
My impression is that Norway wont regulate its oil export to fit internal consumption. They will instead invest in abandoning oil use in favor of biomass, electricity and natural gas and then start investing in alternatives to natural gas. From my point of view in Sweden they have already started this with a huge interest in efficiency and alternative energy and fairly large investments. Everey other month I also stumble over public long term plans like redundant grid connections for future natural gas production to power it with the local nordic mix of mostly non fossil electricity.
It feels great to have Norway as our closest neighbour!
Hi Magnus,
Norway is a good example of how a country can responsibly respond to declining fossil fuels, but how would you compare it to other exporting countries with larger populations who may feel the need to conserve their remaining oil? Do you think that at some point, even Norway will decide that whatever small amount they are pumping is better conserved in case of an emergency, rather than exported?
Norways production is off shore wich menas that they have to produce before the infrastructure rusts away in the sea. Long term low volume production off shore would require a new production technology with longer life lenght and lower maintenance etc overhead. Such technology will probably be developed but a Norwegian SPR will probbaly be bedrock caverns filled with Norwegian oil or GTL diesel.
I introduced the term Export Land Model (ELM) in a January, 2006 post focused on the top three net oil exporters at the time, Saudi Arabia, Russia & Norway. Here is an excerpt of a post I just made over on the Russian thread:
Supply balanced on a knife edge
Khebab - this is growing into a fascinating story. This chart is highly significant - though I'm struggling with the time / date scale.
In 8 months we seem to have lost about 2 mmbpd projects from 2008 and 2009? In addition we seem to have lost projects out to 2012?
I think there is a real possibility that we see further reduction in the 2008 / 09 projections before the year end and this will leave net new supply additions running below 1 mmbpd, which is likely to be lower than demand growth at current price - so prices will continue to rise.
What I bet we see between now and the end of the year is another mmbpd delayed projects - zero net new capacity - with this rolled into next year, giving the perennial optimistic view that there is ample new capacity coming on next year. This promise, that is never delivered, gives rise to global optimism.
Of the 5 mmbpd prognosed for this year, can you say how much of this is already on?
And one suggestion. Your final chart includes an event horizon in 5 years time. I believe this horizon always exists as well. So I'd suggest you need to include somehow a forecast for projects not yet declared. These will definitely exist and this will broaden your peak and soften the decline.
I agree, the curve is getting flatter due to delays and revisions. I'm not convinced that bottom-up approaches have a good visiblity beyond 5 years. A good test will be to check how the 2013 estimate will change in one year from now, if it moves up to the present 2012 level it means that we had an horizon effect of +5 years in 2008.
We need a model that translates an expected amount of yearly discovery (lets say 6 Gb) to new supply additions over the years, that's what we tried to do with the shock model:
The visibility into the future beyond 5 years is indeed problematic. I think the reserve addition approach, ala the HSM, together with the extrapolation potential of a model like Dispersive Discovery is one way to get beyond the 5-year horizon. If you look as the oil discovery data in the chart above in the years past 2000, that is where the DD may really provide insight.
I think we have the reserve growth maturation profile worked out to some extent (using USA data as a conservative estimate) yet the ultimate scaling for the reserve growth asymptote is still up in the air.
BTW, I fixed the broken link above : Shock Model.
Does Stuart Staniford still post here? Or has he moved on?
What about Dave Cohen. Dave was posting on ASPO-USA, then he abrubtly quit. I saw a mention of Cohen on Energy Bulletin the other day.
I know Dave reads the Oil Drum and still writes occasionally. Maybe he could fill us in.
Both Stuart and Dave were inspirations in their day. The Love's still here.
It would be good to hear from them.
The last Stuart TOD was around was in March. He said he wanted to write some peer reviewed papers. I am sure we would be happy to have him back.
I don't know anything about Dave Cohen. His last comment on TOD was on July 18, when I check on his list of stories with comments. I believe he had a paid position at ASPO-USA.
I would agree--they both have written some really memorable articles.
Here is my case (I showed the model a few weeks ago, hereby I'm showing the results only.)
And with the original megaprojects data:
I also have a graph for all liquids.
Should anyone be interested, I can show you that, along with C&C + NGPL projections.
Oh, and here is something else. Though it's in Hungarian, you'll understand.
Here's my English version I posted a month ago (does not yet include the latest Megaprojects update date included on this page):
Looks the same to me...
:-)
This is my C&C + NGPL forecast:
Khebab,
I am wondering to what extent the resulting graphs from the MPD will also 'look' scary due to the fact that it does not include MPs that will be added in the coming years that will come online mid next decade?
In other words perhaps it should be seen more as a useful tool to judge the required investment needed by indicating the shortfall than something to run to the hills over?
Consider that many times in the past it must have looked like the top of the mountain was fast approaching only to find another peak ahead to use a climbing analogy.
If the oil price stays high there will be more investment in MPs but perhaps the point is that these will take too long to come on and will not greatly impact supply?
Regards, Nick.
I posted on DB that this article suggests Khurais will come online next year, not 2010 as the MP database suggests:
Halliburton confident oil's slide will not reduce orders
Just in case you guys missed it. Sounds pretty definitive but then that AFK GOSP was supposed to be finished months ago too.
I just want to precise one thing:
1. Ace (Tony) did most of the painstaking database updates and additions for the last 6 months so we owe him a big Kudos!
2. my involvment was mainly in maintaining the main page of the project and in particular the summary table and charts.
How is EROEI figured into production numbers. If it takes 50 barrels of oil to produce 100 barrels is this a production of 100 barrels or 50?
These are all gross numbers. No impact of likely declining EROEI are in the graphs. *Note - the energy input for oil production is largely natural gas and electricity, very little oil/gasoline.
Though your question needs to be answered, the data just doesn't exist, other than to make guesses.
Nate, a neophyte question here.
Wouldn't there be data of oil quality kept by refineries. If so, do you have an idea how what was used in the pre Hubert-peak era would compare to what is being handled now and what would be the the difference in costs of handling them.
I dont think the viscosity (API quality) or sweetness( sweet vs sulfur differential) is a major impact on the cost increase - yes extremely low API oil would be very expensive to refine. The majority of cost increases are due to increases in price of steel, needing more pipe and more labor and more technology to drill deeper etc. I am sure historic quality data exists, but so far, I would surmise that deterioration in (overall) quality is a minor part (i.e. <15%) of the cost increases. On Chart 1 of this BMO Capital piece reduced quality looks to account for about 15% of the cost through 2006. Perhaps someone has some more recent and inclusive data.
I think its should be made clear that we have two problems EROEI for extraction of a primary resource and more complex cases of conversion efficiency of between energy types. Conversion itself has its own resource constraints and has a much larger economic component in the form of infrastructure costs etc.
CTL/GTL and in general any syngas like conversion for fuel suffer from conversion problems.
The conversion issue is what eventually prevents most alternative energy sources from being perfect substitutes.
We do have a fantastic example of the successful harnessing of low EROEI source in the form of food crops in general all our food sources can be consumed with minimal preparation and low conversion costs. But it took us thousands of years to develop farming. We have better tools if you will in the form of science but you still have to develop a sort of ecosystem/lifestyle around low quality energy sources they have to be integrated and societies have to adjust to using them.
I read a article don't have the link about a West African nation adopting to shortages of rice by integration of wheat noodles into the diet. On the energy front we have a similar problem with alternative fuels we will probably always produce some biofuels for the foreseeable future but we have to change to accommodate then and we also need time to make them efficient. I'm pretty confident that over time we will eventually develop reasonable fuel crops for most climates and we will balance this with our need for nutrition but this sort of accommodation is not a short term process if history is any guide. If anything the rate of change is restricted to the rate at which various plants grow and we can do little to change that. As and example look at mining or oil extraction its taken decades to reach the level of sophistication we have today and we still have a lot of potential technical advances possible. A lot of people believe this is a good thing and that technology will save us but what it means if you look is that refining new process and approaches take decades to accomplish. Its not a good thing that after almost 100 years of progress we still leave at least 40% of the oil in the ground.
One viewpoint that I think I picked up from you is that these oil production forecasts are being made in an environment of unusually low NG prices (in terms of energy content) and thus are dependent on a continuing supply of cheap, abundant NG to power the oil megaprojects, which is in dispute. Many on this site feel that NG supply will be an issue within approx 7 years (guesstimate), so it calls into question the viability of some of the later projects IMO.
Yeah we still don't have a good handle on whats going to happen in a world of expensive NG and expensive oil.
As Nate says a lot of the costs of oil extraction is from NG. Also this is true for refining. So in my opinion whats going to break us for sure is not oil supplies or reserves but problems with NG supplies and distribution. Because of NG problems I think a lot of the remaining oil will be left in the ground. Just consider the EROEI of the oil industry in the US if we had to pay even current LNG market rates. If US NG prices even reach current world LNG prices we have serious problems.
I think that biggest problem with oil is coupling of heavy sour refining with NG usage. However as many people have noted using a variety of scenarios oil usage for transportation in the US could be curtailed by a lot if we had too so conservation/demand destruction is possible without losing our core economy and it can balance agianst world supply for the foreseeable future. Economically this probably means conditions close to a depression but its still doable.
However if you throw NG problems and potential NG/HeavySour issues on top of this things get a lot more dicey.
On a higher scale the oil industry is not isolated from the rest of our economy shorter term resource/economic issues will probably impact the oil industry in such a way that production will become increasingly problematic despite rising per barrel costs. Right now for a host of reasons the current market has been duped into thinking we will see a 1980's style demand drop. These sorts of swings and miscalculations that result in high volatility in prices alone act as a very effective damper on exploiting expensive marginal reserves.
Underlying this is the fact that as oil gets more expensive you have the ability to have larger nominal price swings for the same percentage change. When oil hits close to 200 a barrel a +/-10-20 dollar price change would probably not be unreasonable in normal trading.
Problem is thats a crap load of money.
If the concerns about NG prove correct we can expect similar volatility and fairly large changes in costs on the extraction side so its a double whammy the oil industry will be seeing production cost changing rapidly and profit margins changing rapidly along with overall economic conditions changing rapidly.
Attempts to practice business as usual under these conditions are practically impossible.
For example the latest swings in the price of NG and Oil will in my opinion have a serious and broad longer term effect across the oil industry and for the consumer. The next time prices spike higher everyone will assume its temporary and not change. Eventually of course since the system is volatile prices will pull back albeit to a higher level vindicating everyone that predicted that some sort of price bubble was occuring. It will take a lot of swings before the volatility becomes obvious and can be factored into future production. By then for all intents and purposes it will be to late.
You can see that the combination of NG and Oil problems probably dramatically increases the volatility of the entire system and at the ending of the day its volatility not absolute price increases that will in my opinion lead to far greater problems then are currently predicted.
This volatility problem is everywhere for example we are seeing increasing evidence that oil production and NG production numbers provided by government source may be increasingly noisy.
Another example from a completely different area but it points out the problems with volatility
as housing prices drop tax revenue drops this volatility causes serious problems for state and local governments esp coupled with the previous bubble induced gains that distorted projections in the first place. In time of course we can probably average say 15 years of housing prices say form 2000 to 2015 and the average or mean will probably be fairly close to historical levels.
But the problem is the volatility.
I agree with your general point that increasing amounts of NG will be needed for crude oil production/refining. However:
The energy return on oil wouldn't change if the EROI of one of its inputs dropped - it would require the same amount of natural gas BTUs as it did before - cost might go up -but no decline in EROI.
Also, Im pretty sure that in a pinch the nat gas usage in E&P could be substituted by electricity from other sources (or stranded gas) and as someone previously pointed out, using an otherwise useless energy source as an energy input kind of makes EROI for that particular endeavor meaningless.
But these are quibbles - your broader point is valid - all the extra flow rate from Haynesville, Marcellus etc just extends a)the treadmill and b)our perception that gas is abundant.
Maximum power baby
Indeed. In 2007, I said to several of my trading and investing friends, that once we got above 100.00 two things would happen. 1. For a period of time, the TV and print media would repeatedly misconstrue the larger nominal moves in the price of oil, to be proof of increased "crazyiness and volatility." In addition, I felt observers and market participants also would become emotionally persuaded by a single day move from 120 to 125, where previously they had no such reaction when oil traded on single days from 60 to 62.50. I called this the "google effect" where a unit of something trading at a "large" dollar amount would cut against observers more habitual analysis, and push them into a biased position where they deem the asset "overvalued." I believe we have seen both of these responses this year. They are of course completely emotional and psychological. And, they continue to this day. Just Friday, the media reported the 6 dollar drop to previous drops in dollar terms. In fact, I would have to say it's rare to hear the media refer to oil price moves in percentage terms. For observers as well, oil prices "above 100" continue to vex and persuade them that oil is too expensive. 2. I also predicted that the half-contracts would become more popular. Indeed, when oil is at 200.00 we will surely see 10 dollar single day moves routinely. I think participants will want to reduce exposure some using the 500 bbl contracts rather than the full 1000 bbl contract, and I also think we will see an introduction of a 250 bbl contract. When Oil finally goes to 250.00, I think we'll complete the passage from the "old" 1000 bbl contract to the 100 bbl contract.
As we know that Open Interest has made an eye-opening downward journey in NYMEX oil over the past year, I have to believe that the intra-day movements on full size 1000 bbl contracts at these levels above 110.00 were part of the reason.
G
What makes anyone believe that we wont see a repeat of 1980-1983 followed by a repeat of 1985-1990? If we get hit with a major recession/depression in the next year, then we just might see a repeat. But it wont mean that we've really passed the peak, because economic and political factors will have trumped geological. And that opens up the doorway for a new peak in ~2020, after a decade-long dip. And then all these conversations will repeat...
Ico,
I get our point. I keep wondering myself if we'll see as severe a demand destruction that led to $10 oil in 1986. On the other hand, it's not 1986 as far as the amount of excess production capability. The KSA cranked open the valves in ’86 to recover lost market share. I’m not sure we’ll have that level of competition as we get closer to a prolonged PO. I’m actually starting to think more about an APO (artificial PO) than a PPO (physical PO). At some point I think the oil producers may choose to deliver a daily volume that maximizes their reserve value. Take an extreme, and thus unlikely, case of the KSA cutting lifting 50% tomorrow. Even if oil prices didn’t rise as a result of such a move (a ridiculous assumption for sure) the KSA total income for 2008 would still exceed their total 2007 income. Two days ago the chair of OPEC said (according to Bloomberg) that OPEC should evaluate Venezuela’s call for production cuts since the current market was “over supplied”. What the hell does that mean: the refiners are buying more $110+ oil then they need???? Perhaps what’s to be read between the lines is that the producers need to stop competing with each other on a price basis and stick with their current market share.
I’m sure Mexico would vote for a 50% rate cut if that causes oil prices to double. They make the same income and are able to double their reserve life over night. The real question is OPEC finally ready to become a functional cartel. Even if such drastic rate reductions doubled the current oil price (and killed half the global demand thru DD) as long as there are enough buyers at that price then they would make the same income as producing all out at $100 per bbl. But it would all hinge on each producer being satisfied with their market share.
And perhaps we will find some Huber/Lynch type oil fields, where individual oil wells peak and decline, but the total field production--the sum of the output of discrete depleting oil wells--increases forever. Alternatively, some would argue that key producing regions like Saudi Arabia, and the overall world, will behave in a fashion similar to regions like Texas & the North Sea:
http://www.theoildrum.com/files/TexasAndNorthSea.png
But I'm a finite world kind of guy. Most people prefer to believe that we can have an infinite, or nearly infinite, rate of increase in our consumption of a finite fossil fuel resource base.
Great Job on the MEGA PROJECT. I noticed recently that the IEA just announced an increase of WORLD OIL DEPLETION from 4% to 5.2%. The MEGA PROJECT used a 4.5% Linear Figure. Would a 5.2% depletion rate change the numbers, and if Matt Simmons is correct that the depletion rates will be more like 6-8% in the next several years (or could be here already), how would this alter the MEGA PROJECTS numbers?
Minor point, I'm not involved in the ongoing Mega Projects effort.
In any case, ExxonMobil used a range of 4% to 6% for the decline rate from existing wells. I suspect that it is closer to 6%, which, as you noted, is below what some sources have used. At 6% per year, we need about 4.4 mbpd of new crude oil production every year, just to maintain flat production, or by 2015, we would need 44 mbpd of new production that we did not have in 2005, in order to maintain flat production. Such is the difficulty inherent in trying to maintain an infinite rate of increase in our consumption of a finite fossil fuel resource base, but our economic system is largely based on the infinite earth model. If nothing else, this does at least give the finite earth crowd an opportunity to unload highly energy dependent assets on the true believers in the Yerginite Community--Buy your SUV and McMansion before the price goes back up!!!!
This has been debated and yes, I believe it is a possibility - in some form.
However, now is not 1980s.
The significant differences:
1) OAPEC nations, esp. KSA, got really badly hurt during 80's and went into debt. They swore NOT to do the same mistakes again. Hence the price band protection we see now.
2) The world had much more spare capacity in the 80s than it has now.
3) Asia was not booming at the the rate it was in early 80s
4) OECD had much higher oil intensity figures and cuts were easier to made (if we believe the oil intensity aggregate statistics)
Of course, it is still possible, imho. To what extent, I don't know.
The common wisdom, fwiw, is that the world needs to hit a major depression (not a mere recession) for the oil demand growth to stop or to start shrinking.
Clearly that is a possibility now, even if a small one. However, the central bankers will do EVERYTHING in their power to fight that - including inflating at an unprecedented rate.
We'll see how this goes.
On your main point of the argument I agree 100%: IF this happens, then it won't be the geological peak, just a big demand drop.
I've thought about this question for about 4-5 years, during my investment period in energy. I am sure most would agree here that the answer to this question would probably best come in the form of a long conversation, spanning several days. And then some. However, as I have been having that conversation with myself and others for years, on this question and others, I will give my simple answer: When you have reached a point where scarcity and depletion sets the terms, then the quantity of unmet demand starts to increase as price goes higher. Rather than demand destruction, what the world is experiencing now is demand suppression. Right below all the prices you see on your screen for NG, LNG, Brent, NYMEX, and Coal lies significant, unmet demand. The tail of production, going back several years, is very different now than it was in the OPEC induced price shocks of yore. Those were artificial shocks. This time, the production tail already has a flat shape to it. The only way to increase supply is to suppress demand. But even as we suppress demand, there is no classical "wall of supply" coming along behind any curtailment of demand. Moreover, in addition to the Production Tail, the Demand Tail is also quite different. The industrialization of Asia, yes much flogged, much heralded, much talked about is--gulp-real. But as important, imo, is that the Demand Tail also incorporates 20+ years of OECD energy efficiency gains. So within the global Demand Tail there is much less fat, discretionary demand to cut easily from the system. I lived in Europe when Oil was 15.00-20.00/bbl. Small cars everywhere and massive train transport projects continued unabated. There is a perception I think, because of the advent of the SUV here in the States, that Americans returned to their wasteful ways of the 1970's. We didn't, really. That SUV trend was a blip in a 30 year trend. (I'm being less congratulatory here, and simply pointing out that US and OECD demand growth has been in a multi-decade trend of moderating growth).
As I think Non-Opec supply has now likely peaked, and as I believe Asian/BRIC demand has a unique characteristic which I call fractional/multiplier-demand (lots of new users of petrol who use small amounts but collectively using alot), then my view now is that here in the OECD we are pretty much trapped between OPEC supply for export, and Asian/BRIC demand. The game and the terms of the game seem to have pivoted away from us.
Because the Demand Tail, and the Production Tail, are now so different from the previous shocks, this is why I think an OECD recession will not put the kind of dent in the march-towards-peak the way it once did. A strong pan-global recession however might do so. However, I expect that to unfold from much higher price levels in all energy sources, and, I think it's guaranteed that a pan-global recession does indeed unfold once we pass geological peak/functional peak (ELM, hoarding, etc). It's possible we are getting into position now, actually, for just such an outcome. Not yet, however. I think the global economy has at minimum another 2-3 year blow-off top in the making that will ramp pretty much everything higher, including the search and competition for energy sources. Ironically, I think part of what I see coming over the next 2-3 years is a GDP-boosting energy boom that will largely unfold in a peaceful form, but as we can already see, will likely devolve into a more widespread hostile form. In closing, I will add however that I have very few beliefs, and a surplus of thoughts.
G
Net New Capacity goes unambiguously negative (more than -1.0 Mbpd) by 2012. That is, IMHO, one very important number. This makes it very likely that 2012 will be the "Oh $hit!" moment world wide when the truth of the matter can no longer be denied or obfuscated any further.
Given the long lead times for new megaprojects and difficulty in scrounging up financing in the present financial climate, I would venture to suggest that whatever megaprojects are already in the pipeline are close to being all that are likely to come online by 2012. Slippage from megaprojects forecast to come on line earlier will do absoultely nothing to help Net New Capacity by that point. Movement is usually one-way: projects slip because of unexpected problems or other delays, but seldom can they be speeded up very much.
A big negative net new capacity by 2012 isn't quite "baked in the cake" yet, but it is getting very, very close to being so at this point.
Might that spur on a new wave of megaprojects that could bring enough net new capacity online to temporarilly reverse the trend? Maybe. Unfortunately, with each year that passes in negative territory, we go deeper into the hole and it becomes harder and harder (and eventually impossible) to make up the lost ground.
2012 is shaping up to be a very momentous year.
I find it very interesting that 2011-2012 tend to pop out repeatedly no matter what approach you use as the point at which we have to face our problems.
The prediction seem to be surprisingly robust regardless of methodology.
Even the Mayans...;-)
But Jan 1, 2013 will come and go and as JHK said on Colbert, everyone can go eat the Captain Crunch stored in their bunkers
But then, we've known that for thousands of years ;-)
Google "Maya Calendar 2012" for 462,000 responses in 0.28 seconds. For example:
Does Maya calendar predict 2012 apocalypse?
For the record, my comments did not reference and were not inspired by the Mayan calendar thing, nor am I suggesting that 2012 will herald any sort of apocalypse or collapse. I am suggesting that 2012 will be a year of very significant and profound discontinuities, mainly because the reality of what we are facing will finally break through any and all efforts to hide it. 2012 will be the year when we must finally face the truth.
2012 is when the US elects a demagogue and TSHTF. Nehemiah Scudder, here we come. Wow, Heinlein had good timing.
Thanks to everyone who worked on this. It's a tremendous resource.
I found this interesting link on heavy oil.
http://pubs.usgs.gov/fs/fs070-03/fs070-03.html
The USGS found that only 30% of remaining petroleum resources are light or medium(>22 API) while that constitutes 50% of current production and that 33% of remaining petroleum resources and that 33% of the remaining petroleum resource is extra heavy while that constitutes just 10% of current production.
If the world has 1000 Gb barrels of petroleum left, that would mean that there is 300 Gb barrels of light/medium, 370 Gb of heavy(API 22-10) and 330 Gb of extra-heavy(API <10).
OTH, if we are consuming 30 Gb per year, that means we are refining
15 Gb of light/medium, 12 Gbpy of heavy and 3 Gbpy of extra-heavy.
Conclusion: We have only 20 years left of light/medium; 300/15=20 years.
We have 31 years left of heavy; 370/12=30.8 and we have 110 years left of
extra-heavy 330/3=110.
If you make a chart you would have an abrupt drop of ~50% in 2028 and a drop of 90% 11 years later. I realize this isn't a hubbert type depletion chart, but the point is to show a 20 year burn up of light refined oil and a quick burn up of heavy refined.
Given the lead times of building refineries, should this discontinuity based on types of oil reserves be also reflected in megaproject data?
Comments?
Well quite a few of the sources of light sweet crude are old but in particular I'd say that Ghawar is the most important field as far as the light sweet crudes go. As it declines it will cause the biggest change in the percentage of light sweet crude available for export. And its a pretty old field.
So the future production of light sweet crude really depends more on the when and how Ghawar declines.
Once it does we should see light sweet command a significant premium over heavy sour crudes.
Next I've read a few places that Nigeria may be peaking not sure on that I googled and did not readily find any predictions for future Nigerian production but production out of Nigeria is suspect for political reasons alone. This is one of the other major sources of light sweet crude.
So if your worried about light sweet and future effects you should look at some of the shorter term issues such as this. Surprisingly I've never seen anyone compile the data on light sweet producers to try and predict the future production. But the Ghawar situation alone makes the outlook for light sweet production over the next few years interesting to say the least.
In the last week, I've updated the Wiki Megaproject annual tables due to further project delays and also moving some expansion projects ahead from 2009 to 2008.
China Tahe exp and Iraq Khurmala Dome, each 100 kbd, have been moved ahead to 2008.
http://safedinar.com/Iraqi_Dinar_News_Detail.asp?nID=2947
http://english.peopledaily.com.cn/90001/90776/90884/6357330.html
Delays are likely for some Iraq projects as short term contracts are likely to be abandoned.
http://www.iht.com/articles/ap/2008/08/20/news/Iraq-Oil.php
However the Iraq Ahdab field contract appears to have been signed.
http://www.moneymorning.com/2008/08/22/china-iraq/
Also, Canada's offshore 150 kbd Hebron project has been delayed a few years more to first oil in 2016.
http://www.canada.com/montrealgazette/news/business/story.html?id=897133...
Most of the crude/NGL capacity from Saudi Arabia Khursaniyah remains scheduled to start in late 2008 on the Megaprojects. However, if this statement made below by Professor Paul Stevens, senior research fellow for energy at Chatham House, is confirmed then a significant part of the 2008 capacity additions will be delayed to 2009. The total capacity additions claimed by Aramco for the Khursaniyah expansion project is 790 kbd (500 kbd crude and 290 kbd NGL).
http://www.metimes.com/Security/2008/08/11/walkers_world_200_oil_is_comi...
Ace, many thanks for your hard work over the last 6 months. I've seen an update on Wikipedia from you almost everyday!
I have included your chart in the main post for better visibility.
I have modified my Perl script so that I can track projects delays.
There has been some debate on the depletion rate: should it be 4.5 or 5.2 or higher.
What we have not considered is WestTexas ELM, which posits effective depletion (wrt usable exports) of 2X - 3X the geological depletion rate ie. 10% - 15%
This makes me think there will be a cliff, not a gradual decline
So the nightmare scenario is oil spikes to lets say $300, causing a major economic slowdown, and demand destruction. But the ELM cliff is so steep that depletion is GREATER than demand destruction, forcing ever higher prices.
How do we model global demand destruction in the face of that?
I'm sure there will be a few books on that - written in about 2020. Can't do it now - only speculate
... may you live in interesting times...
again I highly recommend the book "The Great Wave"
this spike in energy & energy shortage has happened in the past
and as the saying goes 'the past is prologue'
This has been a growing question with me also Poly. I watched first hand as DD drove oil down to $10 in 1986. The KSA was hell bent on regaining lost market share they gave up by continually decreasing their production rate to support OPEC prices. But it’s not 1986. And I think we may be only a few years from an artificial PO. At that point it may not be a question of how much the KSA could produce but how much they are willing to produce. The KSA knows better than anyone what the reserve life looks like. They also know how little excess production capacity exist elsewhere and how quickly that volume is decreasing. Here’s just an extreme example of my point: DD reduces global demand 20% (it only dropped 15% in 1986). But if the KSA and other producers don’t try to compete on a price basis and accept their current market they could well exceed income expectations. Selling 70% of their combined production for $150/bbl would earn them more than 100% at $100/bbl. I’m sure Mexico would love to cut their production 30% and still net the same or greater income. This would expend their quickly declining reserve life. The key to this scenario is that the remaining demand being able to afford the higher prices into the future. Also, ELM makes this scenario all the more likely IMO.
It only makes sense that at some point prior to hitting a sustained PO period that OPEC could become an effective cartel. As such all the debate of future maximum production rate becomes less critical. Of course, this ignores the political/military consequences of OPEC withholding rate from a demanding world. Oddly enough, the economies which could outbid the weaker would be less likely to be reactionary. An odd potential future landscape: China and the US supporting the KSA et al against the angry EU.