Updated World Oil Forecasts, including Saudi Arabia
Posted by ace on August 5, 2007 - 11:00pm
Executive Summary
PLEASE NOTE: click on the link below for the most recent oil forecast update
http://www.theoildrum.com/node/3623 which includes forecasts for Kuwait and the UAE.
- World total liquids supply production (Fig 1) remains on a peak plateau since 2006 and is forecast to fall off this peak plateau in 2009. As long as demand continues increasing then prices will also continue increasing.
- Forecast world crude oil and lease condensate (C&C) production retains its 2005 peak (Fig 2). The forecast to 2100 shows declining C&C production, using a bottom up forecast to 2012 (Fig 3). The forecast to 2012 shows a 1%/yr decline rate to 2009, followed by a 4%/yr decline rate to 2012.
- World oil discovery rates peaked in 1965 (Fig 4) and production has exceeded discovery for every year since the mid 1980s. Discoverable reserves in giant fields also peaked during the mid 1960s (Fig 5). The time lag between world peak discovery in 1965 and world peak production in 2005 of 40 years is similar to the time lag of 42 years for the USA Lower 48 (Fig 6).
- World C&C year on year production changes to March 2007 and April 2007 (Figs 7,8) show significant declines for Mexico, North Sea and Saudi Arabia; significant increases for Russia, Azerbaijan and Angola. As Russia is likely to be on a production plateau and Saudi Arabia has probably passed peak production, the world C&C production will continue to decline slowly.
- Key producer Saudi Arabia recently released an updated project schedule which does not show originally scheduled expansions of Shaybah phase 2, 0.25 mbd and Al Khafji Neutral Zone, 0.30 mbd. Consequently, it is now almost a certainty that Saudi Arabia passed peak C&C production of 9.6 mbd in 2005 (Figs 9,10).
- World natural gas plant liquids is forecast to increase due to new OPEC projects (Fig 11). World ethanol and XTL production is forecast to double by 2012 (Fig 12). World processing gains are forecast to decline slowly to 2012 (Fig 13).
1. World Total Liquids Supply & Demand
Although crude oil & lease condensate (C&C) production is forecast to continue declining, the total liquids supply remains on a plateau until 2009, due to offsetting production increases from natural gas plant liquids (NGPLs), ethanol and XTL (BTL - biomass to liquids, CTL - coal to liquids and GTL - gas to liquids).
Demand is forecast to continue growing but supply will start to fall forcing up prices to reduce demand.
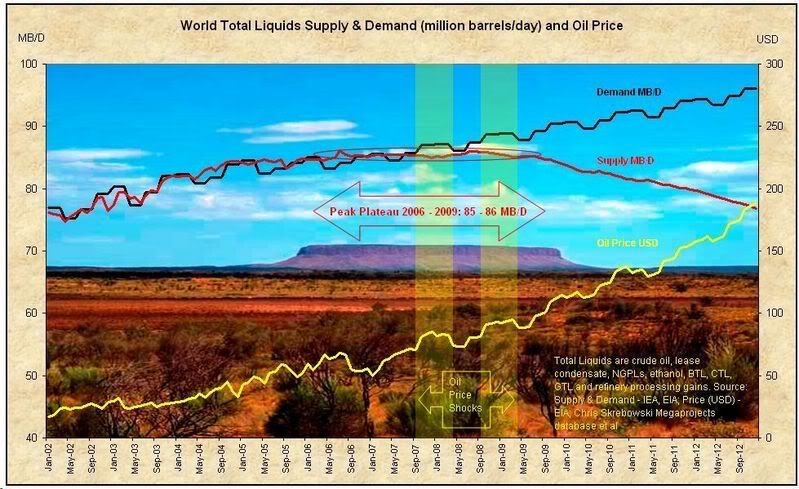
Fig 1 - Total Liquids Supply & Demand to 2012 (bottom up forecast) - click to enlarge
![]()
2. World Crude Oil & Lease Condensate Production
The largest component of total liquids is world C&C production. The first part of the forecast to 2100, in the figure below, is created using a bottom up forecast based on over 300 continuously updated regions/projects to 2012 (Fig 3).
After 2012, two scenarios are shown. The green line is a forecast using BP Annual Statistics Review 2006 proven reserves data. The dark red line, the most likely scenario, is based partly on the BP data, but large downward revisions are made to OPEC reserves and small upward revisions are made to the reserves of many countries to derive a more accurate estimate of proven and probable reserves. This estimate is assumed to be equal to the ultimate recoverable reserves (URR).
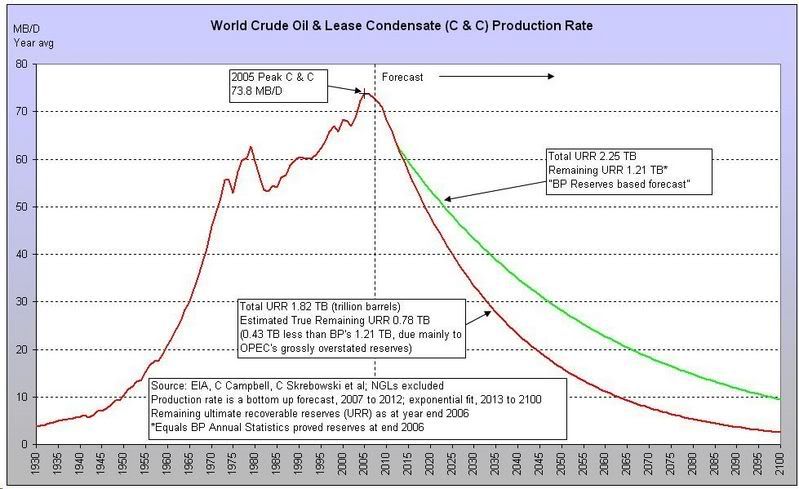
Fig 2 - World Crude Oil & Lease Condensate Production to 2100 - click to enlarge
World C&C production continues to retain its May 2005 peak and is forecast to decline by 1%/yr until 2009. The decline rate steepens to 4%/yr until 2012. The main reason for the end of the total liquids plateau in 2009 (Fig 1) is that the C&C production decline rate changes from 1%/yr to 4%/yr in 2009.
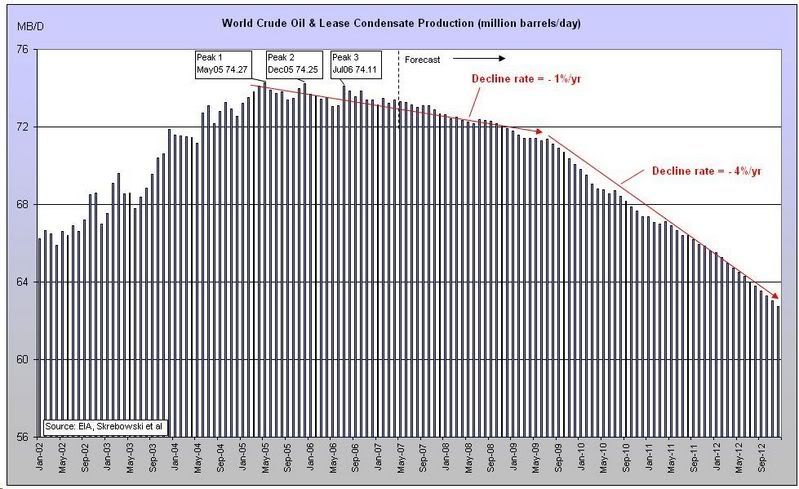
Fig 3 - World Crude Oil & Lease Condensate Production to 2012 (bottom up forecast) - click to enlarge
![]()
3. Peak Production and Peak Discovery Time Lags
Although the forecast production decline rate in Fig 2 appears high, it is a natural time lagged response to the peak year for discoveries as shown below. As the world uses more oil each year than is discovered, oil production must decline after a time lag from the peak discovery year.
The figure below shows a peak discovery year in 1965, followed by a steady decline. Since the mid 1980s, annual production has been greater than annual discoveries. This is not sustainable and it is inevitable that world annual production will start to decline. This timing of peak production and rate of decline is forecast by Fig 2.
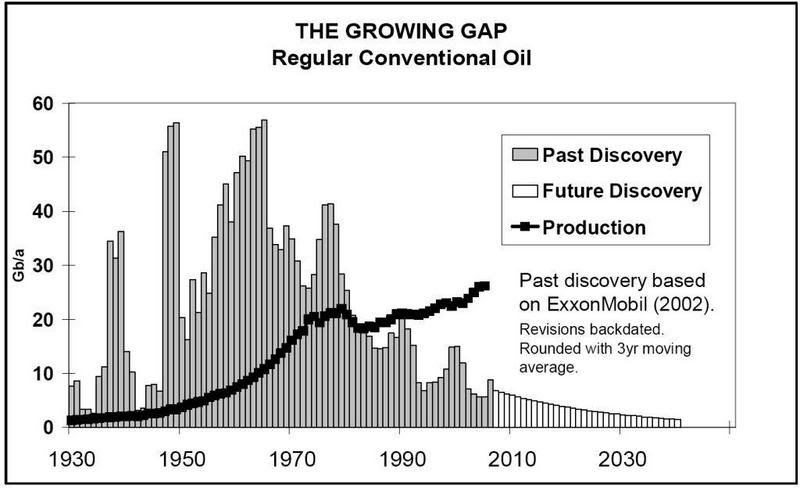
Fig 4 - World Discoveries (source ASPO Ireland Newsletter No. 79, July 2007) - click to enlarge
The figure below focuses on giant oil field discoveries and shows a similar shape to the figure above. The number of giant oil fields discovered peaked in the 1960-69 decade and both the number of giant fields and their respective recoverable reserves have declined steadily. The shape of the discovery decline curve below from 1960 to 2006 is similar to the production decline curve (Fig 2) from 2005 to 2100.
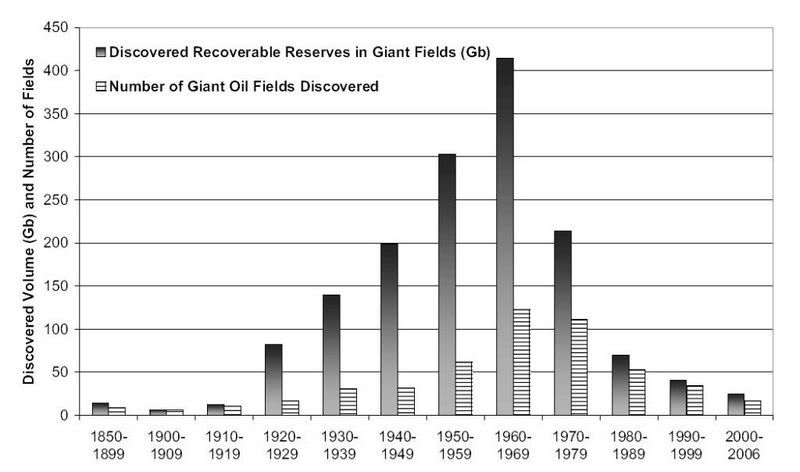
Fig 5 - World Discoveries, Giant Oil Fields (source Giant Oil Fields – The Highway to Oil, Fredrik Robelius, March 2007) - click to enlarge
A very good example of the time lag between peak discovery and peak production is the USA (Fig 6). Peak discovery was 1930 and peak production occurred 42 years later in 1972. Fig 4 shows peak discovery for the world occurred in 1965. Fig 3 predicts that peak production occurred in 2005, which is 40 years later than peak discovery, a similar time lag to the USA.
Fig 6 – USA Lower 48 Peak Discovery and Peak Production (source Presentation at the Technical University of Clausthal, C.J.Campbell, December 2000 ) - click to enlarge
![]()
4. World Crude Oil & Lease Condensate Production Changes
The green bars, representing year on year changes, in Figures 7 and 8 below, show the biggest declines for Mexico, North Sea and Saudi Arabia; the biggest increases for Russia, Azerbaijan and Angola. Angola has many projects which should continue to increase its production but Russia’s mature field production will probably limit Russia’s future production growth.
Militant action in Nigeria and maintenance in the North Sea decreased production from Feb 2007 to Mar 2007.
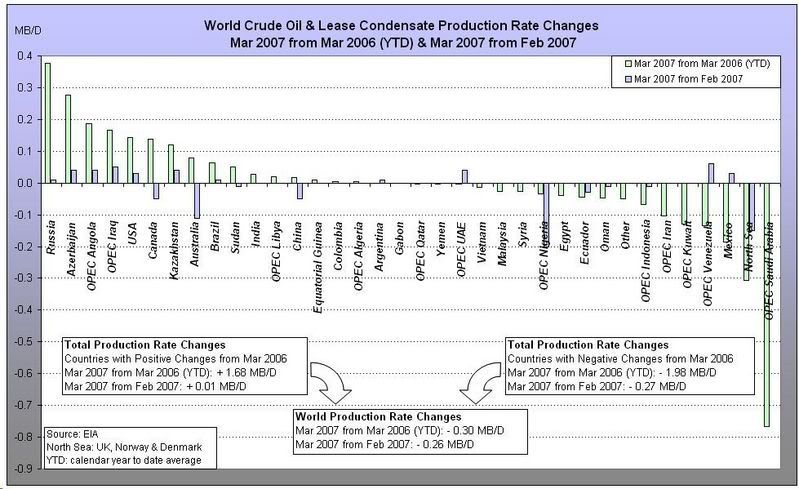
Fig 7 - World Crude Oil & Lease Condensate Production Changes to March 2007 - click to enlarge
Both Nigeria and the North Sea reversed some of their Mar 2007 losses to show small increases in Apr 2007. However, Nigeria’s production growth appears to have stalled and the North Sea shows continuing decline.
In Apr 2007 Canada decreased C&C production by almost 0.10 mbd. On a year on year basis their production is only up by 0.10 mbd, as shown by the green bar in Fig 8. Given all the promise of the oil sands this increase is small.
Russia also showed a decrease in production from Mar 2007 to Apr 2007 of 0.10 mbd. Could this mean that Russia’s C&C production is on a plateau?
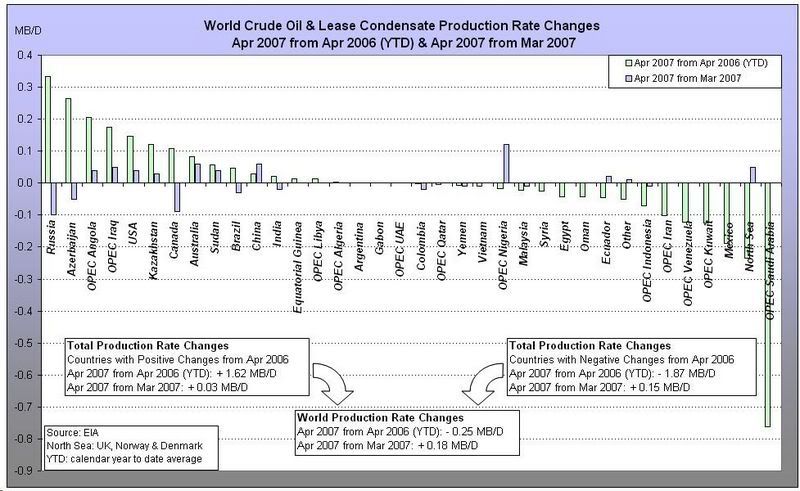
Fig 8 - World Crude Oil & Lease Condensate Production Changes to April 2007 - click to enlarge
Both Figures 7 and 8 show world C&C production dropping on a year on year basis by about 0.30 mbd. This is not a large decline but given that Russia is unlikely to increase production and that Saudi Arabia, North Sea and Mexico are unlikely to reverse their decline, this means that the world C&C production rate will continue to slowly decline (Fig 3).
![]()
5. Saudi Arabia Crude Oil & Lease Condensate Production
Saudi Arabia remains a key producer in the world and continually reminds the world of its enormous reserves and surplus production capacity.
This paragraph on capacity in IEA's 12 June 2007 Oil Market Report, page 15, explains Saudi Arabia’s current surplus capacity situation within an OPEC context.
Notional spare capacity stands at 4.0 mb/d, while our measure of effective spare capacity (excluding Indonesia, Iraq, Nigeria and Venezuela) stands at 2.85 mb/d. Although these volumes are physically producible, even this lower figure likely overstates what OPEC could actually shift onto the market given current prices and shortages in refinery upgrading capacity. Heavy, sour Saudi Arabian and Kuwaiti crude accounts for 88% of the effective spare capacity figure. In the absence of substantial discounts, these volumes might struggle to find buyers while sizeable amounts of refinery upgrading capacity remain offline for scheduled and unscheduled maintenance. Readily marketable spare crude capacity may therefore be much lower, and a more accurate reflection of current market tightness.
In other words, this IEA paragraph says that the world has only 0.35 mb/d spare capacity of readily marketable light sweet crude because the spare capacities of 2.20 mb/d from Saudi Arabia and 0.30 mb/d from Kuwait are hard to sell heavy sour crudes. Given the statements in this IEA monthly market report, the following forecast assumes no effective spare capacity of easily marketable Saudi Arabia crude.
The new production capacities from AFK, Shaybah expansion, Nuayyim and Khurais are just enough to offset decline from existing fields. Aramco has scheduled Manifa last because it will produce heavy oil which is less marketable than lighter grades.
It is also assumed that Saudi Arabia will produce their fields while maintaining the annual depletion rate of remaining reserves at less than about 5.3%/yr, which should ensure that reservoir damage does not occur due to overproduction from their fields. The figure of 5.3%/yr was selected because the annual depletion rate of remaining reserves reached a peak of 5.3%/yr in the third quarter of 2006 (Fig 9), based upon estimated ultimate recoverable reserves (URR) of 175 Gb for Saudi Arabia.
The estimated URR of 175 Gb is equal to 155 Gb of non heavy crude plus 20 Gb of heavy crude. Although the heavy sour crude fields of Safaniya and Manifa may ultimately produce much more than 20 Gb, only 20 Gb is assigned because this low quality crude is difficult to market and difficult to process by refineries. The non heavy crude URR of 155 Gb includes 85 Gb for Ghawar (light), 15 Gb for Abqaiq (extra light), 8 Gb for Berri (extra light) and the remaining URR is assigned to Aramco’s other non heavy crude fields including Marjan, Qatif, Khurais, Zuluf, Shaybah, Abu Safah and Khursaniyah. The estimated URR is based mainly on the information sources about Saudi Arabia, located at the end of this article.
As of June 2007, Aramco’s total C&C production is 112 Gb, being 64% of the URR 175 Gb. Over half of the 112 Gb has been produced from the super giant Ghawar. Abqaiq, Berri and Safaniya have also been significant producers. As Aramco has produced over half of the estimated URR, the production curve is forecast to follow a typical post peak decline curve, shown by the red line in Fig 9.
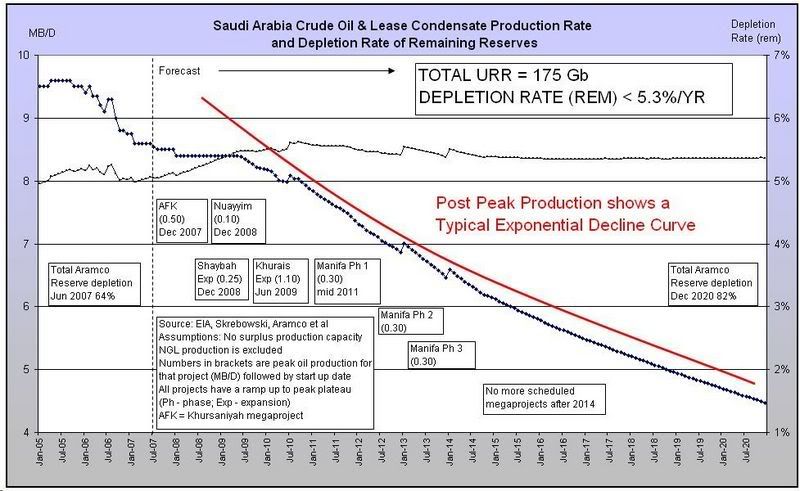
Fig 9 - Saudi Arabia Crude Oil & Lease Condensate Production to 2020 (bottom up forecast) - click to enlarge
Figs 9 and 10 have been updated for Aramco’s most recent project schedule, released in June 2007. Due to both Al Khafji (0.30 mbd) and Shaybah ph 2 expansion (0.25 mbd) being removed from Aramco’s recent project schedule, the probability that Aramco has passed peak production in 2005 is almost a certainty.
The solid red line shows a “Do Nothing” forecast scenario in Fig 10. This represents a production decline rate of 8%/yr which is equivalent to ultimate recoverable reserves of 148 Gb (billion barrels). Of course this scenario is highly unlikely but serves as a lower bound for the production profile.
The “New Peak?” dashed red line represents a scenario for which another peak is attained. However, the inset in the chart explains that another 1.75 MB/D would be required from other projects and infill drilling. This is highly unlikely and confirms that a peak in 2005 has passed.
The “Bottom Up” dark blue line represents the most likely scenario and includes the forecast to 2020 from Fig 9 and a 5%/yr decline thereafter.
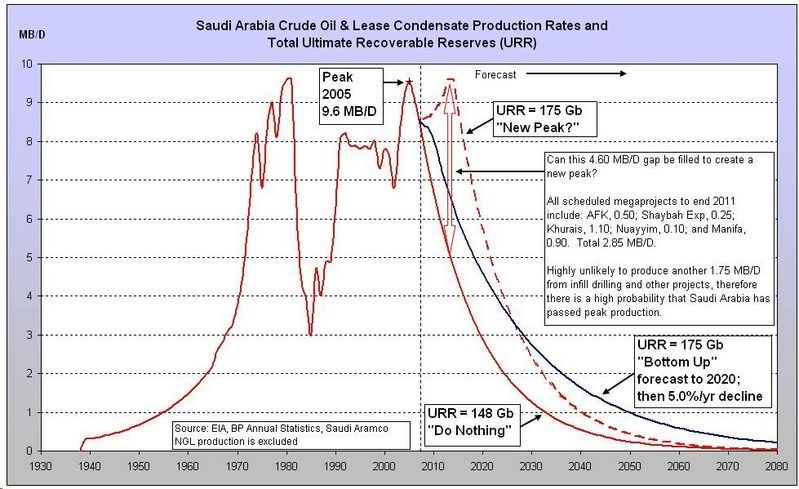
Fig 10 - Saudi Arabia Crude Oil & Lease Condensate Production to 2080 - click to enlarge
![]()
6. Other Components of Total Liquids Production
Natural gas plant liquids show an increase in production due to OPEC projects from Saudi Arabia, Algeria, Iran and Qatar.
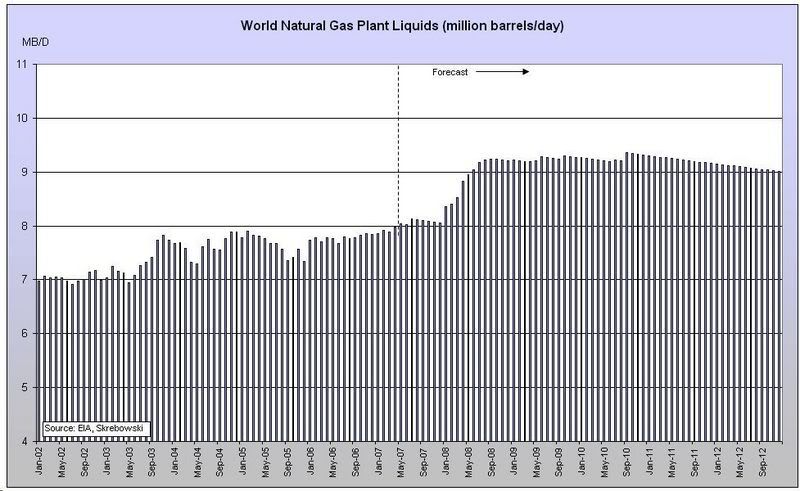
Fig 11 - World Natural Gas Plant Liquids Production to 2012 (bottom up forecast) - click to enlarge
Ethanol and XTL (BTL, CTL and GTL) production is forecast to double to 2012. Unfortunately, the increased production of government subsidised corn based ethanol in the USA is increasing the prices of many other food products.
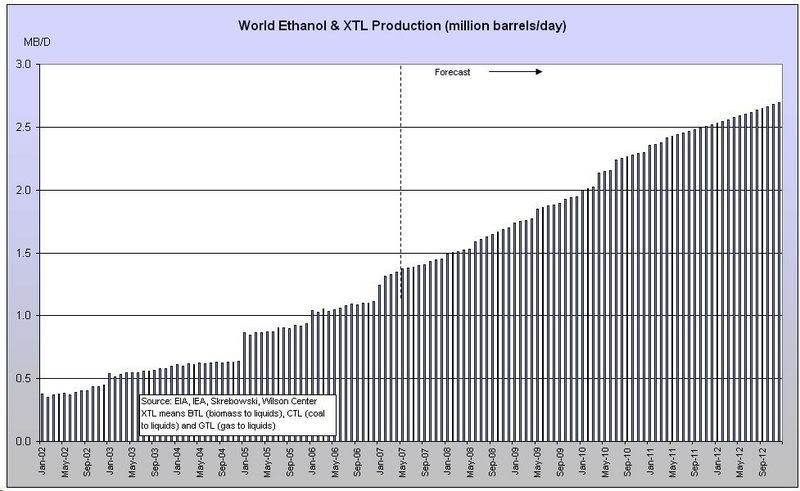
Fig 12 - World Ethanol & XTL Production to 2012 (bottom up forecast) - click to enlarge
Processing gains are defined by the EIA as “The volumetric amount by which total output is greater than input for a given period of time. This difference is due to the processing of crude oil into products which, in total, have a lower specific gravity than the crude oil processed.” These gains are forecast to decline slowly based on the decline in C&C (Fig 3).
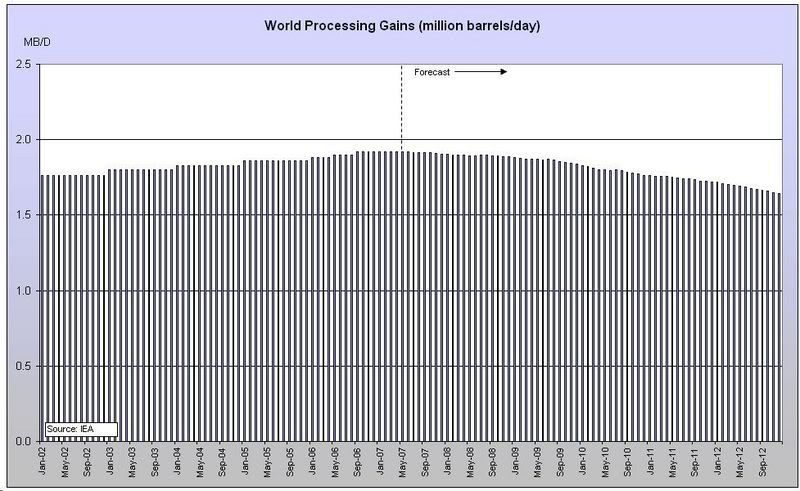
Fig 13 - World Processing Gains to 2012 (bottom up forecast) - click to enlarge
![]()
7. Additional Information Sources
For more forecasts please refer to this article by Khebab, Peak Oil Update - June 2007: Production Forecasts and EIA Oil Production Numbers
![]()
Further articles about Saudi Arabia:
by Stuart Staniford
- Saudi Arabia and Gas Prices
- Depletion Levels in Ghawar
- The Status of North Ghawar
- Further Saudi Arabia Discussions
- Water in the Gas Tank
- A Nosedive Toward the Desert
- Saudi Arabian oil declines 8% in 2006
by Euan Mearns
- Ghawar reserves update and revisions (1)
- GHAWAR: an estimate of remaining oil reserves and production decline (Part 2 - results)
- GHAWAR: an estimate of remaining oil reserves and production decline (Part 1 - background and methodology)
- Saudi production laid bare
- Saudi Arabia and that $1000 bet
by Heading Out
- Simple mathematics - The Saudi reserves, GOSPs and water injection
- Of Oil Supply trains and a thought on Ain Dar
by Ace
Contact
- Content: editors at theoildrum dot com
- Tech support: support at theoildrum dot com
License

This work is licensed under a Creative Commons Attribution-Share Alike 3.0 United States License.
Excellent work.
IMO, if Russian crude oil production is now declining, I expect it to show an annual decline rate in the vicinity of 10% per year. If they do show a 10% decline rate in production, and if their domestic consumption continues to increase (in the short term at least) at about 5% per year, their net exports would probably fall by 50% in less than two years.
"Mr. 5%" did the following graph of net oil exports by the major net oil exporters (one mbpd or more, EIA + BP Total Liquids):
http://bp2.blogger.com/_kdcZbozWthI/RnbjgrSk5YI/AAAAAAAAAOU/NwFg57zOqd0/...
Note that it shows a 5% decline in net exports, from 9/05 to 3/07. The major net oil exporters account for close to 90% of total net oil exports worldwide.
It appears that for every 20 barrels of net exports from the top exporters in 9/05, we have already lost one barrel--in the space of 18 months. Also, the Export Land Model suggests that net export decline rates will accelerate with time.
Again, Alan Drake has shown us how the US and Switzerland respectively provided for transportation, before the oil age really kicked off and during an oil cutoff:
Streetcars 100 Years Ago
http://www.familyoldphotos.com/tx/2c/chadbourne_street_trolley_san_an.htm
Electrification of Transportation
http://www.energybulletin.net/14492.html
Given the time lags and capital for an effort like this, once oil production starts declining it's probably too late. People will be using all their resources trying to keep the old way going.
I think that it is important to get people to understand that oil exports are probably crashing, and at least Alan is offering a plan based on transportation that has been built in the past with little or no oil input.
Jeff Rubin on Peak Exports:
It's funny that nobody pays attention to WT's point that the Golden Age of Trains in the United States dates from pre-1925, when there was almost no petroleum use at all!
Strictly speaking, of course it's Alan's point, but I think that it is critically important. Many electric systems were built in the late 19th to early 20th centuries, with little or no oil input. The car culture is so ingrained in the US that I think that people have trouble thinking of alternatives.
IMO, Alan will be giving the single most important presentation at the ASPO-USA meeting. How many times and in how many different ways do we need to hear that we are in trouble? What we need are plans to implement, in order to "make things not as bad as they would otherwise be."
"Many electric systems were built in the late 19th to early 20th centuries, with little or no oil input. "
And yet, they did a lot of manufacturing, and construction. This is not unique to trains: personal transportation is manufactured with the same techniques as trains, which suggests that PHEV's and EV's are also a perfectly viable path.
yes, trains can mitigate
and will be useful for just
hand cars if nothing else.
But the "bottleneck" will prevent usefulness of trains
at the beginning.
People will camp on train lines for ex.
Trains use diesel for ex. Just retrofitting
will be an awesome endeavor and coal will be at peak as well.
Pre 1925 they weren't also tasked with using the same resource base to support a population of 300 million Americans and a car-based infrastructure that had been built up over the previous century.
Pre-1925 we dug coal out by hand and hauled it to the surface with ponies.
Pre-1925, we picked cotton by hand.
Pre-1925, most families used kerosene light.
Pre-1925, most families did not have a radio or a car.
Pre-1925, per capita oil production was almost an order of magnitude less than today (even though we exported oil then and import it now).
We did *NOT have the same resource base in 1925, we had (effectively) *FAR* fewer resources per capita then than now.
I do not think you have any real comprehension of pre-1925 America.
Alan
What this? Is Alan becoming a realist?
In the 1920's 40% of the US population lived in poverty. And I mean poverty. By today's standard those that live in poverty lived similar lifestyles of the 1920's era middle class. Few people has access to basics that we take for granted (ie clean water, fresh foods, health-care, etc).
In the 1920's the unemployement rate ranged from the 25% to 35%. Just imagine today if 25% to 30% of the workforce was unemployment. Most People also worked much longer days (about 10 hours day + 5 hours on Saturdays), and they were happy to have a job. The work was far more grueling and the working conditions where dangerous (no worker safety regulations).
Arkansawyer here,
I talked to you last, right after Katrina.
Your ELM model is working but it should be
combined with positive feedback loops. Like once
the collapse begins, we have to run faster to stay ahead of the curve.
And Alan is still not understanding that NO is already in
the Gulf.
People think we still have 20, 30, 40 years left to get this done. They're not even close," said St. Pe, director of the Barataria-Terrebonne National Estuary Program, which seeks to save one of the coast's most threatened and strategically vital zones. “Ten years is how much time we have left — if that."
http://www.nola.com/speced/lastchance/t-p/index.ssf?/speced/
lastchance/articles/day1.html
Great Work WT.
James
ACE
Thanks for this excellent work.
WT
The Rubin article is worth reading in full.
http://research.cibcwm.com/economic_public/download/sjul07.pdf
Hi Westexas,
Little or no oil input for rail transport would mean that coal was used at that time.
Global CO2 is to my mind the really big problem and, even basing the electrical demand for rail on nuclear (solar and wind etc. are not IMO in the running presently) the use of oil would not be diminished. Any mitigation of the problem of petroleum meeting demand seems to merely add to the problem of increase in CO2 without reducing the world's use of oil.
I like Alan's rail ideas, but I can't seem to think my way around the above to see them resulting in an improvement in the situation at present. I also don't like what a 'no solution' using current and popular ideas of mitigation implies at least as far as a soft gradual solution. It is all one big bummer as far as I can see it.
I am quite sensitive to GW (Global Warming) and I am quite concerned about responses that make GW worse (arguably corn ethanol does).
CTL (Coal to Liquids) works, no doubt about it. See Sasol, Germany during WW II. The worst GW response to Peak Oil
The Hirsch, Bezdek, etc Report has the US building CTL plants as fast as humanly possible (as fast as WW II munitions plants, economics did not enter into the picture).
IMHO, a MASSIVE Urban Rail and Electrified Intercity Railroad program(s) will absorb large amounts of money and quite frankly hope (tangible results people can see generate hope).
I do not think we can mount the rail building program I envision AND the CTL program envisioned by Hirsch et al.
Electrification of Transportation is an alternative to CTL (we will get some of both, but better a little CTL & lots of EOT).
Trading 20 BTUs of diesel for 1 BTU of electricity cannot be that bad for GW. Build infrastructure that will last a half century to a century plus (recycled metal does not take that much energy BTW).
And wind has more potential and can be built faster than nuke IMO.
Best Hopes,
Alan
Hi Alan,
Thanks for the response. Possibly I am unclear in what I have said. My feelings are that you are on the right track but precipitate in timing.
Putting as many factors together as I am able I do not see under present circumstances alternate energy sources nor energy saving forms of industrial technology as being a remedy to the problems faced. In our current social/political mold we are not able to solve the two major problems of population and its twin, overconsumption of resources. This will leave a solution if there is one to happenstance.
Under this social/political paradigm any new, alternative or retrograde (coal etc) energy sources will, IMO, merely be added to the current energy sources. These new sources may delay economic collapse for a period but in the end only make the final results even more disastrous and possibly final. Demand trumps mitigation I fear.
If you see any other outcome to this I would be more than happy to hear of it.
Best wishes in hope that we will find a brand new paradigm that will run on the rails.
Karl Marx was the author of the last new social & economic paradigm that was implemented on a wide scale.
Saying that "we need a new paradigm" has strong elements of truth, but the corollary that we must wait before starting any serious mitigation seems nonsensical to me.
As with Karl Marx's efforts, I am doubt that any whole cloth "new paradigm" will work as advertised in the real world.
Saying that we need to solve all problems (in theory at least) before starting to do serious work on any of them is recipe for the worst of all outcomes, endless debate and conflict while doing nothing !
I see several advantages in my proposals.
Elasticity in Supply (they can do more as things get worse).
A serious diversion from Coal to Liquids (CTL), the worst solution. Spending a trillion $ (2007 value) every few years on my proposals will probably prevent similar efforts with CTL. And the money would be better spent on rail !
Long lived infrastructure that still has value under virtually any scenario. See Cambodia & Liberia, where shattered societies found innovative uses for railroads (local Liberians prevented the tracks from being torn up). And the Anarchists ran the trams during the Spanish Civil War. Much modern rail infrastructure will survive the "bottleneck" if it comes to that.
A collective effort is required. Under a near worst case, the organization to run efficient rail may be a focal point to prevent social collapse. And under milder cases, this collective effort in problem solving can be a critical catalyst for a new paradigm.
I hope that seeing the VERY tangible results and benefits of a new rail line post-Peak Oil can create positive feedback, better morale, a new world POV. Heal by doing, rather than just talking & theorizing ! Roosevelt had somewhat the same goal with the WPA.
In the gales of a post-Peak Oil storm, with early Global Warming kicking in, building as much rail as possible seems a far more positive social goal than many other alternatives (building as much CTL & biofuels as possible, or conquering oil exporters or ..)
And a desperate society focusing on positive goals seems far more likely to evolve positively than the same society focusing on "deals with the devil" like CTL and invading other nations.
There are no perfect solutions, but there are better and worse solutions.
Best Hopes for Better Solutions,
Alan
Hi Alan,
I think I have been spending too much time in my garden these days as I find that on looking, here on TOD and even scarier on Google, about Coal to liquid fuel that it is not just some idle unfeasible daynightmare but a seriously intended business.
I hope you will be able to divert those funds for CTL to rail projects. I support you in that endeavor wholeheartedly.
Population will, I imagine either be dealt with by us or more likely natures wisdom, but CTL if it were to be implemented could trump even that specter and leave just a ball of stone.
Good luck in derailing CTL (and as a great side benefit, bringing back rail for the later post peak world)
BTW, Would have replied sooner but things like now,among other things a warm router and slow neural connections, get in the way.
There are two separate issues: ultimate and in-the-meantime. Ultimately there are no more hydrocarbon fuels, so that greatly contraints where we have to end up. In-the-meantime, we are going downslope of ever more expensive energy. So we have to figure out the best use of remaining hydrocarbons.
I believe that trains are part of the answer in-the-meantime. But even more is re-arranging things so we don't need to travel so far, at least regularly. Compact smaller cities that go up five stories, surrounded by agriculture and park lands and so on. Some of Kunstler's ideas are right on in this regard.
I often wonder how much of modern science and technology we will be able to rescue and carry forward into the post-hydrocarbon age. I'm not sure we'll be able to continue space exploration or high energy physics. Modern warfare won't be missed, however.
In any case, unfortunately, I believe our gov't will lead us into the valley of death before it leads us into green pastures.
Alan says above that:
"A collective effort is required. Under a near worst case, the organization to run efficient rail may be a focal point to prevent social collapse. And under milder cases, this collective effort in problem solving can be a critical catalyst for a new paradigm."
I know that it is hard to imagine "us", today's average citizens of the USA, pulling together for any collective purpose. We all know how divisive and polarized and contrary "we" can be.
*On average of course, you and I are not like that :o)
Something can give you some hope for the future is to look into how our society, our US culture, has changed its personality and its individual-vs-community focus many times during our history in pretty well defined and patterned cycles or waves. And another wave change is supposedly happening at this moment - towards a more community focused and collective action orientation. (Keep your fingers crossed Alan)
You can read about it in the books by:
William Strauss and Neil Howe,especially -
"The Fourth Turning" http://www.fourthturning.com/ and
Millennials Rising: The Next Great Generation" http://www.johnreilly.info/miri.htm
and Jack Lessinger's "Schizomania" and "Your County - Boom or bust?: The Rise of Penturbia the & The Fall of Suburbia" http://www.predicting2020.com/
(check out the "Insights" section for a quick overview)
Remember that our societal personality keep changing as the young replace the old, and today's ideas replace yesterday's. Even though "we" of today can not imagine doing something together, that does not mean that "we" of tomorrow will not be able - maybe even enthusiastic - to do it.
Greg in MO
One concept that hasn't been worked on too much here is NET oil production, ie production net of the energy inputs of the oil industry itself. Ethanol, tar sands, heavy oil, deepwater, tertiary and enhanced recovery etc have significant energy inputs. The NET oil production curve would show a steeper dropoff. (A little like WT's Export Land Model.)
On Russian forecast production, I'm more optimistic.
As at June 2007, I am assuming remaining URR C&C of 91 Gb. (URR is proven plus probable plus yet to find.) Given Russia's new projects, the annual depletion rate of remaining URR is forecast to be below 4%/yr.
Russia's C&C production for Apr 07 was 9.37 mbd (EIA). My forecast is Apr 08, 8.91 mbd; Apr 09, 8.78 mbd; Apr 10, 8.47 mbd.
If Russia shows a decline rate of 10% pa then the decline in Fig 2 becomes even steeper.
If we assume a 5% production decline rate for Russia and a 5% rate of increase in consumption, their net exports would initially decline at about 13% per year.
http://www.themoscowtimes.com/stories/2007/07/20/041.html
The Moscow Times: Pacific Pipeline Delayed Until 2015
By Anatoly Medetsky
Staff Writer
tahoevalleylines.org ASPO article 374 "Second Dimension Surface Transport Logistics Platform"
With thanks to Alan Drake and his Parallel Bar Therapy Prescription: Please see http://nyc.theoildrum.com/node/2800 down the lines...
Railway rehab, expansion & extension is most assuredly doable, and will prove invaluable as a morale-builder!
Ace,
Thanks for pulling all this together, I really appreciate all your hard work in trying to project a realistic world production forecast.
Bob Ebersole
One way you all can thank Ace is to hit the tip jars of reddit, digg, heck, spread it around on other sites you visit, hit stumbleupon, etc. The more people read this great work, the better.
The authors do appreciate your spreading around of their work, believe me.
Well done Ace, sadly I think 'geologic peak' is the best we can expect; probably above ground events will only make the situation worse, to say nothing of the 'Export Land' difficulties that any oil importing countries may suffer.
I wonder how Yergin et al would comment on a properly researched article such as yours (along the lines of Stuart’s dissection of the latest National Petroleum Council Report)?
Xeroid.
great work by ace and i agree 100% with you omb. as far as i am concerned, this is the gold standard and until something different happens or someone comes up with a better model i dont see much room for further discussion.
i would just add that all this ethanol, gtl, ctl, tar pit mining, yada, yada and yada will only support crude oil and natural gas demand
I would like to know how the price projections are estimated. When you look at other commodities, the prices are much more volatile if supply doesn't meet demand. For example, if milk supply fails to meet demand by .5%, then the wholesale price almost doubles. Wheat, corn, platinum, etc, all show the same kind of results. Either the demand will have to be forced down somehow (rationing), or the price will go chaotic.
http://www.newworldeconomics.com
P.S. It takes a while for people with a lot of gold to figure out that you can't buy what isn't available. Stubbornness and ego trump reality every time on the markets.
"If you want Change, keep it in your pocket. Your money is your only real vote."
Deffeyes predicted the same thing would happen with oil. He said the volatility that comes when demand outstrips supply might disguise the peak for some time.
Price projections are forecast using short and long term price elasticities of oil demand. Short term elasticities are small which reflect the inelastic nature of oil demand.
Long term elasticities are higher to reflect demand destruction in the long term. In statistical terms, this increase is represented by lagged adjustment coefficient estimates.
Forecasting price is half art and half science but the general upward trend of oil prices, accompanied by seasonal variations, is likely to continue.
For a reference on elasticities please see pages 23 and 24 of this 64 page pdf
http://www-cta.ornl.gov/cta/Publications/Reports/ORNL_TM2005_45.pdf
Maybe I missed it, but are your price forecasts in current year dollars? At the rate the value of the dollar is changing, The price could be twice as much and the value just the same. :-(
This gets at a key question I have.
Can anyone approximate the cost of oil (or gasoline?) based on the supply/demand relationship?
Can we compare the change in costs of various commodities in terms of supply/demand relationship?
Are there any summarries of such information and analysis available?
One question I hear from people tells me that they have no idea how an increase or reduction in demand as related to supply will affect prices.
For example: if we cut demand for gasoline in the USA by 5%, how would this affect price? If we increased demand by 5%?
How about the affect of lesser increases or decreasers in demand?
I've googled around a bit, but have been unable to come up with answers to this yet.
Can anyone at TOD help with this question?
Beggar,
If anyone could answer that question (price), they would become very rich!
But, its very hard to estimate how demand cuts in the US will be affecting prices. To be accurate its going to have to guage the relative rate of inlation in currency, and the growth in demand and demand destruction of all the other countries in the world, which I don't think can be approximated easily, plus the increase or decrease in crude production, another unknowable projection.
I personally expect 5% of US demand isn't detectable-its only about 1.25% of world demand, and the Asian economies are growing pretty fast, plus there are a bunch of countries who are already experiencing shortages.
Bob Ebersole
Thanks, Bob. not the answer I was hoping for, but it is a start.
Are there historical patterns in supply and demand that shed some light on this?
I'll keep looking for some kind of answers that can at least give a range of possible effects of demand on price.
The charts showing world demand increasing and supply steady or declining have folks talking about oil prices of $100 or $200 per barrel in the near future.
What does that mean for gas prices?
How will $100+ prices effect demand, which will in turn affect prices again....???
Beggar,
I've been doing a little thinking, which is dangerous I admit, cause when I'm alone I'm with a bad influence.
Inthe great depression the US economy fell off a cliff. Oil became extremely cheap, because we were at the height of discovery with uncontrolled production, and fell as low as 10 cents a barrel in 1932. Still US consumption fell by 1/3rd. Our society has changed totally now, both adults in a family work, think they require a car for every adult, and has totally urbanised-only 2% of the people live on an actual farm, as opposed to 20% in the thirties. Still, from 1982-86 consumption fell 22% (as I remember) while prices fell from around $30/bbl to $12/bbl, and then finally in 1990 about $10/bbl. With low prices, consumption crept up exponentially untill we are using twice as much oil as we did about 1986, and prices have trippled in the last 5 years to $70+ a barrel.
So, if we have a heavy duty recession, demand destruction could outpace decline in production, and we'd be virtually certain to see $50.00, and possibly as low as the low $30 bbl range. If we have a gradual decrease in our standard of living, then prices may just stablise in the $60-$85.00
range. And if the geopolitical scene heats up more, the sky is the limit.
It seems to me that for every $25.00-$30 dollar crude price increase, gasoline prices go up about $1. So by my rough, redneck, eyeball formula, $100 oil =$4.00 gasoline, $200 dollar oil = $8.00 gasoline, and I fear to predict any further. all my crystal ball has to say tonight.
Here is a calculation for oil prices changing with demand. It has supporting links to show you how the calculations are done.
http://www.theoildrum.com/node/2798#comment-216111
Jon Freise
Analyze Not Fantasize -D. Meadows
Excellent job putting all this together,
Old WW2 poster, time for a rerun?
"When you ride ALONE, you ride with Osama!"
"When you drive a SUV, you drive with Chavez!"
"When you FILL UP your tank, you fund a Terrorist!"
People are a tad more cynical and anti-authority today, so the effects would be limited. Still, it would be nice if the government would step up and provide leadership, but in America the people get the government they vote for. At best.
Bill Maher did the first one:
Question is who are you riding with if you ride with Bill Maher if you want to stretch it that far.
Great poster!
But we shouldn't be encouraging the NeoCON BS "Global War on Terror". A typical Bushism, it is a syntactical nonsense.
Iraq and Afghanistan, both illegal and unjustified invasions and occupations of foreign sovereign nations (odious, but true) were justified by the "Global War on Terror". Morally the US is as bad as Saddam's with his invasion of Kuwait.
To the extent that there is terror, it is blow back from the stupid, shortsighted and damaging policies the US and UK (and a few others: Australia, France etc) have been implementing in the Middle East for over 100 years.
Also the balance of power has shifted. Russia and China are rising global superpowers, Iran is getting stronger regionally and the US is getting visibly weaker in relative terms on all fronts. The US would do well to retreat into its isolationist shell and concentrate on energy efficiency at home as hard as it can in the few years left of available oil for export.
It's been done.
Of course, in keeping with our modern times, it was done by a comedian, not by the government. Kind of like how The Onion and the Daily Show are now the best, most accurate sources of real world news and punditry.
Up to the excellent contributor standard, well done.
Does any one else feel ill looking at Fig 2? I was always crap at rollercoasters...
Arkansawyer,
Fig 3 and Fig 9.
What if the KSA doesn't hold production steady in '08?
Ace,
You're getting better, fast, and you started out on a high level to begin with. Kudo's with a deep bow.
I'd say that if Stuart's work at TOD makes people come to him for comment on the NPC report, then all politicians and other decision-makers who wish to know what the REAL world energy situation looks like, should use this Ace post as their reference. Not IEA, not NPC, none of that. You show them all to be little else than propaganda material.
Two little remarks; the oil price in Fig. 1 is a bit low?! About $55 for today? Also, I'd provide a source for every individual graph
Exactly right. All day.
8D
Indeed. I think it may be time to reconsider the tag line to emphasize the nature and caliber of core analysis that is really the hallmark of TOD. "Independent Analysis Focused On Energy And Our future" perhaps?
The source of the oil price is from the EIA - it's "All Countries Spot Price FOB Weighted by Estimated Export Volume (Dollars per Barrel)" which is a bit low compared to Brent or WTI.
http://tonto.eia.doe.gov/dnav/pet/xls/pet_pri_wco_k_w.xls
The forecast price trend is probably more important.
The source for each graph can be found by right clicking on the graph. The source of the actual data is specified on the graph.
Thanks,Ace. Thanks a lot. Nothing personal, but in the face of overwhelming evidence such as this, I feel a bit like hiding somewhere. We are in for a rough period. Peak oil in combination with global warming, geopolitical instabilities (Al-Quaeda, Iraq, Pakistan, entire Middle East), food and water issues. It's tough to have faith that there is a way out of this mess. A mess we humans have created to a large degree. Who will lead us out of Canaan to the Promised Land? Prophets, those who point out the errors of our ways, are not leaders. The job of the prophet is to say "this is not the way." The leaders who come after will say "follow me." In Biblical terms, the road is narrow and the path is steep. May we find true leadership along our way. May we lead ourselves as best we can to powerdown, to localize, to produce for ourselves. We have a few short years to make drastic changes.
Thanks very much Ace.
Do you have any way to model demand destruction with increasing prices? I think there is general consensus that in the short term term, demand for oil is price inelastic but what about over longer terms?
For example, you show that crude oil production has slightly declined over the last 2 years. Over this time the world economy has grown by around 9%. So the world economy now produces 9% more wealth from less crude oil than it did two years ago.
If the price of Oil had been $30 per barrel, would that have happened?
The world produces more debt, and prints more money. To call that "9% more wealth" is frankly ludicrous. Can we lay this to rest already? It's a huge perversion of reality, and utterly confusing.
HeIs: One fact is undeniable- as global oil production has slowed in growth over the last 25 years (and now slowly declines)-the richest persons in the USA and globally are increasing their wealth at the fastest rate in history. China's economy is growing at 11% per annum- this is unprecedented for an economy of that size.Yes, to a certain extent it is a zero sum game, but all the predictions of the sinking of the Titanic drowning everyone have yet to come true. A better analogy of the current situation is that as the boat cannot carry the load of the passengers, they are increasingly being thrown overboard to make more room for the increasingly sumptious buffet table.
Brian
We call this magical thinking. Sure, efficiency plays a role somewhere somehow. But how much increased efficiency do you see around you?
So other than by some magical occurence, there is no way we can expand production while using less energy.
How much bigger the wealth gap gets in the process is irrelevant to the topic.
GDP numbers are kept artificially high, inflation numbers low. It's all Fantasy Island. And I think it's time to stop the economic illiteracy. If we don't have the correct information, and hence the correct picture of the world, we will never be able to make the correct decisions.
And just as I'm thinking we should have this dicscussion elsewhere, since this is Ace's post, and his spot, I realize that it is the exact same thing.
Ace provides the real picture of what's going on in oil, while Yergin and co. are the false flagging GDP boosting crowd.
He didn't say anything about efficiency. He said the wealthy are doing fine, only the poor are suffering. (And more and more of us are being numbered among the poor.)
A lot of people have noted that the economic conditions now resemble those before the Great Depression. The chasm between the rich and poor widening to unprecedented levels, irrational exuberance in the stock market, etc.
Leanan: Yep. As an example, after leaving Hearst Castle (Xanadu in CITIZEN KANE), Randolph Hearst downsized to a more modest place in Beverly Hills. That more modest place is now for sale for 165 million. There is a lot of money swishing around at the top.
No, he didn't, but that's how it started with TT: the miracle of wealth accumulation in the face of oil conservation. Brian changed the conversation by saying there's more richer people. Yeah, so? Nice, but what's the point? I don't know why he wrote that, I kind of thought he was reacting to what was said before.
I guess the starting point is Peak Oil. And he turns it magically into the inevitable course of the rundown of the economic system.
Oh, smarties. Well, how does Peak Oil fit into that "noting"? What was the energy base in 1929?
THere's lots of debt creation, quite a bit driven by us citizens wanting more gov than they're willing to pay for. This could stop tomorow and has little to do with the topic at hand. The question here is, 'is the world producing more goods per unit crude than at an earlier period, or not?' If so, there may be reason for cautious optimism even tho few here are looking for such.
King Coal is largely responsible for the continued economic expansion and to a lesser extent NG/NGL supplies. Its not a simple problem. The ability of the world to purchase products from china primarily produced using coal energy is a result of some whacked economic games. In any case the current economic condition is so far from stability its not worth using as an example post peak. Peak oil or not our economies have to realign in the near future. After our insane policies finally fail we cannot intrinsically continue to grow in the face of expensive oil.
If the no-coal-no-China theory is correct things could nosedive sooner than we think. Some say only 2 years to go http://www.eurotrib.com/story/2007/5/13/105158/220
Is the West so dependent on China it needs to help them out? Think empty shelves in discount stores.
Nuts!! The government is printing money as hell! M3 growth was 8% last year, which means a real inflation of 8% per year! Yeah, that's right. But since 2006, the FED stopped showing their M3 graphs for good, a move not done for decades. Why, may we ask? Well, I guess if they are in a printing sprint run, they will delay people to start panicking and foreign banks to start selling dollars the most they can.
Debt has nothing to do...?!? WHAT? Are you CRAZY? Do you know the consequences of a banking meltdown? Do you understand that if a nine trillion dollars debt goes bananas, with dollar-selling panic, so the dollar goes puff?
Hell, the only way the DOW is going up is by comparing it to the dollar. If you compare it to gold or any other commodity, the DOW is CRASHING bigtime. But that's nothing compared to what's happening THIS YEAR.
Read the Headlines: Hedge funds are way DOWN. The only thing that will keep the dollar from plummeting down hard will be behind the curtains manouvers, like buying huge assets (trigging and exponentiating even more debt) to stop downward spirals to turn too great. Perhaps we're lucky and see the market plummeting "softly". Perhaps we're just witnessing another 1929. Good luck.
Reconstructed M3, which has been reconstructed then backdated for veracity by three different sources of which I am aware, uniformly agrees that currently M3 is expanding at 13.5%. Enjoy.
"The greatest shortcoming of the human race is our inability to understand the exponential function." -- Dr. Albert Bartlett
Into the Grey Zone
And I'd suggest this insanity and yes it is insanity is what is giving us the false sense that high oil prices are not effecting the economy and all is well.
Until its not.
>Nuts!! The government is printing money as hell! M3 growth was 8% last year, which means a real inflation of 8% per year!
Well that's not exactly the case since a lot of foriegn central banks hold USD reserves (from trade imbalances). Since this money is held it does contribute to inflation. We also have currency manipulation in Asia which holds down the prices of imported goods which caps inflation.
On the other side, M3 is probably growing about 13%. I think inflation probably growing about your estimate of 8% though. In any case, its much higher that washington reports.
I'd rather use the Genuine Progress Indicator than the GDP when assessing wealth production.
Thanks Ace.
Amazing work!
I am a big fan of bottom up analysis.
As we approach this fall, I find myself feel a fear that I did not expect...fear of geo-political meddling, far more dangerous than truth.
Ace,
Can you post the actually difference between supply and demand anticipated for this fall? Eyeballing it only goes so far (and highly error prone)
Thanks
Sure, these are the gaps between my forecast demand and supply for these months
Oct 07, 1.65
Nov 07, 1.85
Dec 07, 2.08
Jan 08, 2.00
For comparison, here is the IEA gap
The highlights of IEA Oil Market Report dated 13 July 2007 showed two graphs on supply and demand.
http://omrpublic.iea.org/
I placed the two charts side by side and stretched the demand chart so that the vertical scale was the same as the supply chart. The new chart below is the result.
I added a light blue vertical bar to show what oil supply would have to be in 1Q2008. There is also a reasonable likelihood that peak oil (total liquids) may have passed in 3Q2006 as indicated in the chart above.
In 2Q2007 oil (total liquids) supply, just less than 85 mb/d, was greater than oil demand. However the IEA is forecasting oil demand of about 88.5 mb/d in 1Q2008. This means that to meet forecast 1Q2008 demand, supply must increase by 3.5 mb/d! This explains why the IEA keeps on asking OPEC to increase production. It is highly unlikely that OPEC will be able to increase production by 3.5 mb/d in six months and consequently the next six months will be exceptionally volatile for the oil markets.
Thanks Ace...that is exactly what I was looking for.
The likelyhood of Peak total liquids being in the past and these gaps is sobering.
Thanks again. I am going to permalink this one.
BTW, any chance of getting your plateau graph without the picture in the back?
Sure, here it is
Thanks, that's much easier to read. Plus it looks more professional.
Your posts are always interesting.
The US decline rate has been around 2%/y. Is your projection of a world decline rate at 2x this value on account of the way modern fields are produced, ie with simultaneous primary plus secondary, or a higher proportion from off shore, or a bottom up analysis of future projects?
jkissing:
I think a lot of the difference can be explained by the economies of scale difference between small independents and national oil companies. A big company isn't going to spend $200,000 dry hole for a 100,000 bbl field extension, while an independent in the US would consider that profitable. Consequently, small projects aren't going to get drilled overseas.
It might not be just modern EOR techniques, jkissing. There is also the problem that the US, because of its social structure, was able to heavily drill post-peak. We were able to do this partly because of the nature of our economy and partly because we could import oil to subsidize further drilling. The world doesn't have anywhere from which to import nor are the individual nations of the world like the US in that they will encourage additional drilling.
"The greatest shortcoming of the human race is our inability to understand the exponential function." -- Dr. Albert Bartlett
Into the Grey Zone
US crude production declined almost 50% since 1971. Over 36 years that was close to a one percent per year decline, crude plus liquids declined less.
Not all oil companies will make it.
The U.S. was estimated to contain 140 billion barrels of heavy oil in place.
Heavy Oil Reserves Page
The sun was rising over the heavy oilfields of the world that were once discarded like trash.
1.9% by my calculation:
0.5^1/36=(1-de)
1-de = .981
de = .019
= 1.9 %
or,
(.981)^36=0.5
The world C&C decline rate of 4%/yr in Fig 3 is based on a bottom up analysis of existing plus future projects/regions.
After 2012 (Fig 2) the decline rate is also forecast to be about 4%, to one decimal 3.6%/yr. This decline rate is a result of fitting the curve to the total world URR.
I'd like to focus on this first point and see if anyone can come up for a plausible reason why we can expect demand to continue to increase in the face of high oil prices. I realized that this assumption has to be false.
First WT ExportLand model predicts some serious drops in exports over the next few years this of course leads to high oil prices. The latter stages of the model say 50% reduction in exports simply don't seem plausible so we would expect some significant changes well before we reach that stage.
This boils down to two simple issues.
1.) How are we going to pay for expensive oil when expensive oil slows economic growth and creation of wealth ?
2.) Are we a lot more addicted to cheap oil than we realize.
The first question is simply recognizing the obvious that expensive oil or gasoline will cause you to reduce spending in some other area credit can be used to avoid reducing spending but eventually you have too. This will slow the economy slowing or reversing any wage growth leading to tighter spending constraints ... Basically I see no way that increasing commodity prices won't result in a slowing economy its virtually impossible to escape. Recently the world financial system has been driven by insane policies that have temporarily resulted in the suspension of all the laws of economics but this cannot last. GDP vs M3 points to a major problem.
The second part is probably even more important and more general its how much are we dependent on oil being cheap not just on oil. I'm beginning to think that we are far more dependent on cheap oil then we realize. We can handle temporary price increases but over the long term we have a economy optimized for low priced oil. Simply looking at the scale of the problem of increasing fleet fuel economy points out that the underpinnings of our economy are not just dependent on oil but on cheap oil. In fact all the proposals I've seen for handling expensive oil simply serve to reinforce the fact that we hare highly dependent on cheap oil.
We talk a lot about transitioning off oil but we can't even make the transition off of cheap oil much less anything else. Thus models that assume any sort of stable economy under a high priced oil regime are simply not realistic past the earliest stages.
First, he didn't say that demand will grow. He said that if demand continue growing, prices will increase.
Now, isn't the nature of demand destruction that economy will scale down to exactly the amount viable with the amount of oil produced? If so, demand will be exactly equal to the production capacity (unless there is an embargo, of course), and no oil will be saved.
In other words, demand won't decrease because of economical slow-down. Since the small production is the cause of the slow down, the economy will be simply adjusting to the new amount.
Correct. So what we really are projecting is a period of economic adjustment that will generally be felt as negative.
The political implications of such and adjustment are worrisome. Given enough economic adjustment the politics could easily and quickly move from worrisome to deadly.
This paper presents depletion driven problems almost certain by 2009 any sort of export land projection and other considerations would move the date that issues begin to develop sooner and also magnify the problems later.
We are more than halfway through 2007.
My point is that what we probably will see is not a smooth increase in prices absorbed by a functional economy but an increasingly dysfunctional world soon.
your incresingly dysfunctional world begins this sept. When OPEC can't deliver more oil and we open up a 2mmbd shortage this fall things will get ugly. And as soon as Wall St/Joe Sixpack understands PO and that we are in terminal decline then what? We don't really know at this point. Based on human nature we will probably do the worst thing we could do. Like all of us try to buy Prius/super economy cars. Or try to all move back to the city. or start wars about oil. This fall will set the stage for yrs to come I'm afraid.
We better pray that ExportLandModel is very wrong and that the oil regimes are willing to deprive and oppress their population so as to give us the oil.
The world has been using more oil in the summer (roughly June to October) then in the winter.
So depending on how late more oil shortages develop, they could be somewhat mitigated until the next year.
.
DocScience
http://www.angelfire.com/in/Gilbert1/grid.html
.
"I'd like to ... see if anyone can come up for a plausible reason why we can expect demand to continue to increase in the face of high oil prices."
In principle, we can expect it because it is exactly what has happened since May 2005, when the oil price kissed $50 goodbye. At that time, prices above $50 were certainly viewed as high.
Here it is important to distinguish between demand and need, as Don Sailorman clearly explained a few days ago. Demand is the quantity people effectively buy. Then it's clear that demand will NEVER be greater than supply (= production + stocks draws). So when the IEA forecasts that demand will be 88.2 mb/d in 2008 it implies "IF there is such supply". An IEA official said so much as quoted in
http://www.telegraph.co.uk/money/main.jhtml?xml=/money/2007/07/10/cnoil1...
"Lawrence Eagles, head of the IEA's oil industry and markets division, said: "The results of our analysis are quite strong. Either we need to have more supplies coming on stream or we need to have lower demand growth.""
Now, there are basically three mechanisms whereby demand can converge to supply:
1. Endogenous demand destruction due to financial/monetary causes, like the Great Depression, the Asian Crisis of 97-98, Argentina 2001, etc.
2. High enough prices, whereby the richer buyers outbid the poorer ones.
3. Rationing.
Which (except for the third mechanism) is exactly what the IEA said in its recent Medium Term OMR:
"it is abundantly clear that if the path of demand does not change on its own, it may well be driven to change by higher prices."
I think the demand line can best be understood as what the demand would be expected to be at current prices, were sufficient supply available. Say OPEC had a "comfort zone" of $60 to $80 a barrel and plenty of spare capacity. Obviously, if the additional supply is not readily available, the price will rise to whatever is needed to reduce demand to the level that can actually be supplied. Hence, the two shadowed "price shock" bands that accompany the "gaps" between supply and demand. (Sorry for all the "inverted commas.")
Prius / Suburban = .21 = .97e50
Ken
I don't consider current demand as a good marker since its been supported by the most massive printing of money in history. 60 may well be above what we can sustainably pay for oil.
Next depending on how you factor in this inflation prices have not risen as dramatically as the dollar price indicates.
Overall its not a trivial problem and in general our current situation has short term stability at best.
So far albeit with some serious games we have managed to continue to grow the world economy this in particular does not seem like it will continue for much longer and as decline continues it must respond to the loss of probably its most important resource.
Plot the global M3 vs the price of oil to see how distorted our current system is.
***Basically I see no way that increasing commodity prices won't result in a slowing economy its virtually impossible to escape. Recently the world financial system has been driven by insane policies that have temporarily resulted in the suspension of all the laws of economics but this cannot last. GDP vs M3 points to a major problem.****
Since more than half of the world's population is tied to a commodity-centered economy, rising commodity prices are good for most people. Many inflation adjusted industrial prices are falling. The losers in the commodity upswing are high-wage mature industrial economies heavily dependent on commodity imports.
I don't know what laws of economics have been suspended. Fiat money is probably not the greatest idea in the world and the world bond market is a bloated beast, but economic principles haven't changed.
M3 growth greater than GDP growth a major problem? Depends--at what rate does inflation become a problem? If you own or produce tangible goods, some inflation is good. If you own mortgages and bonds, well, that's another story.
Paul
Hi Paul,
I'm coming back very late to this thread. I wonder if there's any chance you might email me, as I have a q about what you've said here. If so, thanks very much.
China's and Saudi Arabia's currencies are essentially tied to the USD -- and they have USD holdings. A lot of emerging economies have USD holdings. Ecuador (since 2000) and El Salvador (since 2001) have even officially dollarized. It would surprise me if M3 hadn't grown rapidly in the face of all this.
Why isn't this a Nash equilibrium? -- can any single country ditch the USD while the others hold steady?
Supply and demand are always confusing when price is rising... technically supply and demand are in balance, but only because some demand at the lower price was destroyed. In your graph you show supply and demand in balance up until now but, anticipating a higher price, you show demand and supply separating in the future. The picture would be more consistent by presenting demand exceeding supply at the point where price began escelating, around 1/04.
Future price is very difficult to predict because of the difficulty of predicting how much demand will be destroyed at, say, 80/b, much less at 100-200. Groppe, who so far has the best record at predicting future oil prices, thinks that substantial third world demand remains to be destroyed at 60+, which is presumably happening now that we are at 75. According to him, the current price is therefore not sustainable given current supplies. Meanwhile Pickens sees US ng remaining in the doldrums well into 08... what's an investor to do?
ANother poster tried to extend the example of how small changes in milk supply may generate large changes in price to the oil market. However, if milk goes from $3/g to 6/g, and a family's consumption is 1g/week, the increase in price is not enough to force a change in consumption (demand is very inelastic.) OTOH a similar change in gasoline may have a greater impact on a household's budget if both workers are commuting long distances to get to work (price is somewhat more elastic.) Food may be fuel, but we will stop consuming fuel (at least a little) sooner than we will stop consuming food.
But the problem is you have to either earn more money to pay higher prices with global wage arbitrage thats not and option or you can temporarily go in deeper into debt. Are you can conserve by not buying something else say eating out. The problem is the conservation approach means someone else does not have the money to by gasoline. It simply slows the economy eventually resulting in a demand drop when someone loses their job and stops buying gasoline.
I might add this is in the condition of flat or declining supplies. If the price was high but supplies increasing then we would assume we could spur growth to either overcome prices or a small slowdown would re balance things.
Increasing commodity prices with no increase in supply simply results in economic contraction required to keep supply and demand and price in balance. I'm not saying we won't see some wild price swings but intrinsically their seems no way a economy can grow given the core resources it needs to grow are decreasing in availability. If a economy cannot grow it cannot handle price increases.
Look at it this way.
Your working in the desert and you need about a gallon of water a day to keep from dehydrating.
Your boss comes up with the brilliant idea that he will only give you half a gallon of water to force you to work twice as hard.
The brilliant boss ends up with a dead workforce.
Thats the situation I see with our current economy and oil.
Is reddit.com censoring news from TOD ?
Twice I have submitted stories from here and both failed to show up in the 'New' section.
Has anyone else had this yet ?
I think they do it to preserve variety in content. Which is a shame, because stories with the same kind of subject (oil, Kunstler, smaller living, etc.) are regularly picked up over there. Try to tinyurl it, that should throw off the automated culling.
yes, they are. I've sent a couple of emails.
We have been blacklisted for a couple of months at least, and yes, it does hamper our growth.
About all I can suggest is that you write them a constructive email.
I have made a tinyurl for reddit, let's see if it works:
http://science.reddit.com/info/27u8j/comments
Up that one. let's see what happens!
They downmodded it, Prof. G.
"The greatest shortcoming of the human race is our inability to understand the exponential function." -- Dr. Albert Bartlett
Into the Grey Zone
Yeah, they don't like when you hide the source via tinyurl.
Any explanation as to why they are doing this?
ace - you're Figure 5 above is taken from the PhD thesis of Fredrik Robelius. This Figure is from the same thesis.
I kind of like this Figure (even though I don't fully understand it) because it shows production / consumption continuing to grow at around 1.5% per annum pre-peak - which is exactly what I think will happen.
Your forecast seems best to match Fredrik's worst case scenario - would you care to comment?
I'll share some of my thoughts...
I think you are being too pessimistic with Saudi Arabia. As you know I think the new peak in 2012 (?) will happen - maybe not as high as you show - but there abouts. The methodology you apply is fine up until a point. 8% decline in the "do nothing scenario" seems reasonable. And building new production upon that is the approach I have followed in my forecast for the UK.
However! With 2.85 million bpd new production scheduled by 2012 you are only adding a fraction of that to produce the dark blue line that you say is the most likely scenario. Why is that? It doesn't seem very objective to me.
And the 1.75 million bpd short fall. You say it is highly unlikely that this can be met from infill drilling and other projects. Why?
OK - to be sure they might not reach 1.75 million bpd from these sources but they will reach something - where is this shown in your forecast?
Finally, the cornerstone of Saudi Arabia maintaining production for the last 40 years has been drilling the undrilled areas of supergiants. We know that vast areas of Ghawar are still undrilled (Haradh and Hawiyah), I believe the same is true for Shaybah and suspect this to be the case in Berri and Sanfinya. Drilling the undrilled areas of supergiants is the power behind Saudi production. Where is this shown in your forecast?
In summary, I think if you provide a more full allowance for the prognosed 2.85 million bpd new production, some allowance for infill drilling and new projects and a full allowance for drilling the undrilled areas of the supergiants you might find that the gap between your and Fredrik's forecast for the world begins to close.
Robelius' (thesis page 125) includes C&C, natural gas plant liquids and processing gains for his bottom up project based forecast. He excludes ethanol. My Fig 1 includes ethanol, but Fig 2 is only C&C. The Saudi Arabia figures are also only C&C.
"In order to forecast future oil production, the results of the modeling of the giant oil fields contained in the GFP database have been combined with the production forecasts of deepwater oil, major new fields, Orinoco and oil sands, as described in chapter 7. In addition, historic production
and assumed future production of both NGL, condensate and processing gains are included in a strive to reach a comprehensive picture of global liquid production."
Page 79, table 6.1 of Robelius thesis, gives a range of Ghawar URR from 66-150 Gb; Greater Burgan, 32-75 Gb; and Safaniya 21-55 Gb. If the lower range of these three large fields is used then it produces the "worst case" peak 2008 in your chart from Robelius. If the higher range of these three fields are used, with his low demand case, then it produces the "best case - demand following" peak 2018.
My assumptions include Ghawar at 85 Gb and Safaniya/Manifa 20 Gb. Kuwait total URR 89 Gb with 45 Gb remaining (Jun 07).
Two years ago, May 2005 (peak C&C!),
http://www.peakoil.net/AIMseminar/UU_AIM_Robelius.pdf
Robelius used much lower estimates for the three large fields mentioned above: Ghawar URR, 66-100 Gb; Greater Burgan, 32-60 Gb; Safaniya, 21-36 Gb. Two years later, Robelius has increased the upper range of these three old fields by 84Gb!!! Maybe his thesis supervisor did not want his thesis prediction to create too much panic?
My forecast is a little more optimistic than Robelius "worst case" but below his "standard case low end."
For the Saudi Arabia forecasts, which are C&C only (no NGPLs which you usually include), I really do hope that I am too pessimistic. My Fig 10 forecast assumes a URR of 175 Gb. Saudi Arabia's actual C&C production to June 2007 is about 112 Gb. This means that their URR is 64% depleted. Given this assumption of URR 175 Gb, the only way that Aramco could get to another peak is to overproduce and damage their reserves which would increase their annual depletion rate of remaining reserves from 5.4%/yr to a dangerously high 7.5%/yr. I also think that if Aramco had an infill project capable of 1.75 mbd that they would announce it. Also, I tend to think that Khurais will produce at most 0.8 mbd which is what Matt Simmons stated.
I really think that it's time for an ex Saudi Aramco employee to make some comments on TOD to help clarify these forecasts :)
First off let me say I enjoy your updates and can't wait to see if the price shocks materialize(!) (although I agree with another poster the Ayrs rock backgrounder is a bit naff!)
Isn't the issue though that if they do not increase production then it's 'game over man'. I mean if KSA goes on record as saying they are at peak then the whole NPC report -and that wonderful "Global supply/demand bubble graph to 2030" of theirs- goes out the window.
I don't see as they have any alternative but to create a new peak if they want to maintain global stability for a 'few more year'. This would also have the very negative effect of making any of the current rash of Peak-Oilers sound like cry wolves again just when the wolf is appearing...
Another question: to what extent does KSA and the other OPEC producers utilize the Enhanced Recovery technology of the majors -and how might this affect production? If they can buy Billions of dollars of arms why not ERT?
Nick.
Could you clarify the reasoning behind this statement?
Due to both Al Khafji (0.30 mbd) and Shaybah ph 2 expansion (0.25 mbd) being removed from Aramco’s recent project schedule, the probability that Aramco has passed peak production in 2005 is almost a certainty.
Maybe the reasoning should be obvious, but it's not to me.
There are a bunch of methodological issues with this piece. 1) it's inappropriate to treat estimates of proven reserves as URR. Proven reserves do often grow over time, and while this factor can be overstated, ignoring it altogether is likely to lead to overpessimistic forecasts. 2) the assumption of constant depletion rate on Saudi fields is not grounded in anything at all. We have no particular reason, at this time, to suppose that is what they will do amongst the range of choices open to them. We also have no particular reason to expect a constant decline rate in the future of global production. In general, it appears that operators are more likely to maintain plateau as long as possible and then suffer precipitous declines.
For these and other reasons, forecasts like this should be phrased far more tentatively than this is, as possible scenarios hedged about with caveats. The executive summary of this piece in particular exudes a confidence in its numbers that is completely misplaced.
Thanks, Stuart,
re: "We have no particular reason, at this time, to suppose that is what they will do amongst the range of choices open to them."
Could you possibly outline the options as you see them? (I assume you mean deliberate cut-backs - anything else?)
re: "We also have no particular reason to expect a constant decline rate in the future of global production. In general, it appears that operators are more likely to maintain plateau as long as possible and then suffer precipitous declines."
WRT your first sentence, could you possibly expand on this?
What types of decline rates do you see 1) as possible (for what reasons) and as 2) likely?
WRT your second sentence, are you saying that the operators would make a conscious decision to manage the field in a way that was less than optimal - (if optimal means maximizing the total volume extracted?) (Or, is it the case that there's really not much room to maneuver?)
And also on this point, do you see the "Oil Depletion Protocol" as an effort to address the scenario of operators' effort directed toward maintaining a plateau? (i.e., as an attempt to counter that?)
If so, do you see it as effective? And, if not, do you have any other ideas?
And do you see any (even hypothetical) means of addressing this?
WRT your first sentence, could you possibly expand on this?
If you are referring to his comment that it is inappropriate "to treat estimates of proven reserves as URR", this is what I wrote about in:
A Different Approach to Calculating Saudi Arabia's Oil Reserves
I pointed out that in the U.S., we have produced 57 billion barrels of oil since 1982, and yet only pulled down reserves by 6 billion barrels. That generated quite a discussion, and some very hostile comments.
Hi Robert,
Thanks (and I'm way overdue in checking back). I'm glad for the link again on URR.
Actually, what I was referring to was this:
------------
re: "We also have no particular reason to expect a constant decline rate in the future of global production. In general, it appears that operators are more likely to maintain plateau as long as possible and then suffer precipitous declines."
WRT your first sentence, could you possibly expand on this?
What types of decline rates do you see 1) as possible (for what reasons) and as 2) likely?
WRT your second sentence, are you saying that the operators would make a conscious decision to manage the field in a way that was less than optimal - (if optimal means maximizing the total volume extracted?) (Or, is it the case that there's really not much room to maneuver?)
-----------
In other words - Stuart says we have no reason to expect a gradual decline rate. I wondered if he might expand upon this, is what I was asking.
What decline rates, for what reasons, with what probability - that's my question(s).
Then, I'm also asking *why* are operators "more likely to maintain a plauteau as long as possible" - ? Does he mean - more likely to for political reasons or as demanded by others? Or, more likely to, because this is the optimal way to develop the field? Or, because it is not the most optimal way to develop the field, but they are powerless to do otherwise? Or what, exactly - ? Just wishing for a little more explanation.
Or, is it the EOR tecyhnology that gives us the precipitous decline?
Agreed, Stuart. This is a problem with the community in general. Most of the contributed / original articles and many of the comments phrase opinions and speculation as if they were fact or certain to occur.
Those who truly profess to be trying to make the largest impact should consider whether articulating a more balanced point of view (including possible criticisms to their arguments) is more likely to be persuasive than a point of view that is obviously slanted to the point of inaccuracy.
They used to.
These days, just as often they don't. What is still seen as proven OPEC reserves, despite strong suggestions they are largely fictitious, could make that picture much worse. And OPEC is not the only reserves question mark.
Well, it's a bit semantics, but by itself that sentence can only possibly work out one way, since production means depletion. No-one knows the %rate of depletion, though, (since it depends on URR), but then again, that includes you, doesn't it?
So what's the point? The constancy? Again, you don't know. Hence, you saying that it's not grounded in anything is in itself ungrounded.
Any such range of choices is purely supposition on your part, more like wishful thinking. You have no particular reason to suppose they won't.
You don't know all options the Saudi's have, anymore than anyone else. And you know that. You can say the same for Ace, but then this argument is not good enough on your part, you'll have to come with proof as best you can. You ain't even trying.
Ok, well, prove that one too while you're at it. I have no idea where it comes from. Appears to whom? Where? I think you just made that up. And that doesn't even yet include the question whether they could maintain any plateau, nor if they would want to if they could.
Both this comment, and the confidence it exudes, are misplaced as a reaction to Ace's work. And that is disappointing, and hurtful to your reputation.
You can't just come in and blast other people's work with mere suggestions. Doing it with your own contributors' work goes a step or two beyond the pale.
I think you're merely trying to make the data fit your beliefs, and not, as you obviously should, the other way around.
Well, there's a whole bunch of methodological issues with your response as well. And I'm sorry to see this is still how contributors are treated around here. Haven't learned much, have we? It's not the fact that you don't agree, it's the way in which.
If you want to publicly disagree with your contributors, at least show respect.
Constant depletion rate means that they produce a fixed percentage of their remaining reserves every year. Other things being equal, that implies a gradual exponential decline in production. They don't have to do that, and it's not particularly likely. More likely, but by no means certain, is they'll seek to keep any given set of facilitiies operating at full capacity until they can't. It's called "maintaining plateau".
"Any such range of choices is purely supposition on your part, more like wishful thinking. You have no particular reason to suppose they won't" Agreed. But I'm not claiming to know the future Saudi production profile with much precision at all, whereas Ace appears to be. The Kuwaiti parliament has been debating producing at a constant depletion rate, so it's certainly a possibility. But I have yet to see any discussion of KSA planning to do so.
"I think you just made that up. "
Try reading SPE 93439 or IPTC 10395 for instances of KSA apparently trying to maintain plateau on particular fields.
"If you want to publicly disagree with your contributors, at least show respect."
I'm criticizing the argument, not the person.
Stuart, did you misread Ace? Here is what Ace actually said:
He did not say a constant depletion rate. He said a constant percentage of remaining reserves. In other words, they are producing 5.3% per year of remaining reserves which themselves are shrinking due to production depletion. So 5.3% of this year's reserves would be more than 5.3% of next year's reserves. Or at least, that is how I understood Ace's comment.
If I am incorrect, could you or Ace explain the above quote to me then, please? Thank you in advance.
"The greatest shortcoming of the human race is our inability to understand the exponential function." -- Dr. Albert Bartlett
Into the Grey Zone
The depletion rate is the amount of remaining reserves consumed this year (by definition). I think you might be confusing it with the decline rate, which is the amount by which production declines year to year (an error I was guilty of myself in some of my very first posts).
Some more info on annual depletion rates of remaining URR.
Tariq Shafiq, a petroleum engineer who was Vice President and Executive Director of the Iraq National Oil Company (INOC) said:
http://www.mees.com/postedarticles/oped/a46n50d02.htm
Shafiq thinks 4-5% depletion rate is good for large fields. Perhaps my forecast for Saudi Arabia is too optimistic since I am assuming a maximum of about 5.3%, which is greater than Shafiq's upper limit of 5%.
If Saudi Arabia produces its fields at a higher rate of say 6% the forecast curve in my Fig 9 will show a slower production decline rate in the next few years but then the decline rate will steepen even more. The North Sea is a good example. From 2000 to 2003, the annual depletion rate of remaining URR was just over 12%/yr. As the depletion rate drops due to maturing fields, the production decline rate has been around 10%/yr.
Colin Campbell's modelling assumes that for
http://www.feasta.org/documents/feastareview/campbell.htm
The midpoint is the date when 50% of the URR has been produced. As Saudi Arabia has passed midpoint some years ago, assuming 112 Gb produced out of an assumed total URR 175 Gb, maintaining an upper limit of about 5.3% annual depletion rate of remaining reserves seems appropriate. 5.3% was the depletion rate reached in Aug 2006 when it is believed that Saudi Arabia was producing at its maximum potential.
Here is a more detailed view of the first part of Fig 9 which shows the depletion rate of remaining URR exceeding Shafiq’s 5% limit starting in about Mar 2005 and returning back to just under 5% in Feb 2007.
I'm still waiting for an ex Aramco employee to post here and clarify Saudi Arabia's forecasts :)
No, I am aware of the difference between depletion and decline. But a constant depletion rate (as a percentage) against a shrinking reserve will result in declining production.
In other words, if I have 100 Gb of reserves this year and I deplete those reserves by 5% or 5 Gb (produce that much) then next year I have 95 Gb (not counting reserve growth for a moment, ok?). Now if I deplete 95 Gb by 5%, I only produce 4.75 Gb for the year.
Thus, if I maintain a constant depletion rate against a shrinking reserve resource my production must decline. That was how I understood Ace's comment and his further explanation below appears to go in the same direction though again he didn't directly answer that.
Anyway that is why I asked, because that is how I understood the comment and it was clear from your comment that you believe he meant something else so I was hoping for a bit more clarity.
"The greatest shortcoming of the human race is our inability to understand the exponential function." -- Dr. Albert Bartlett
Into the Grey Zone
"In other words, if I have 100 Gb of reserves this year and I deplete those reserves by 5% or 5 Gb (produce that much) then next year I have 95 Gb (not counting reserve growth for a moment, ok?). Now if I deplete 95 Gb by 5%, I only produce 4.75 Gb for the year."
This is exactly what I mean - agreed. Another point on depletion and decline rates from your example above is that when the depletion rate (as a percentage of remaining URR) stays constant from year to year then the decline rate is equal to the depletion rate. From above production of 5 Gb in year one also falls by 5% (0.25 Gb) to give 4.75 Gb in year two.
Also, the URR which I use above is an estimate of proven, probable and yet to find or as Colin Campbell says "yet to produce".
I kind of thought the tone was more one of academic disagreement, like a negative critical review. And where there is a great deal of uncertainty it is a fault to make statements that imply certainty of knowledge, so I think at least that criticism is clearly valid.
>1) it's inappropriate to treat estimates of proven reserves as URR. Proven reserves do often grow over time, and while this factor can be overstated, ignoring it altogether is likely to lead to overpessimistic forecasts
Proven Reserves or URR are not important as flow rates. If the world had 20 Trillion barrels of oil but could only produce 50 mb/d in the future, we have a problem.
We can see that more and more production is coming from smaller fields. When the remaining giant fields enter tertiary recovery, production is very likely to crash. Based upon the work you and others have done, thats likely around the corner.
All I can add on a semi-positive spin, is that at some point the economy will respond to issues related to energy and global financial issues that will lead to strong demand destruction. Although I can not provide a estimate when and how events will play out. On the flip side, I suspect that if there is a lose in confidence of future oil production, strong geopolitical events will drastically reduce the availability of oil on the open market.
I've been lurking The Oil Drum for several months now and this is my first comment. First of all, my congratulations to the contributors behind this forum. It is simply excellent. Now my questions:
How is the information about Peak Oil actionable?
The arguments concerning Peak Oil are compelling and a consequential long term economic downturn due to Peak Oil seems logical. So I have been forewarned. What do I do with this information other than put a paper bag over my head and start whimpering?
In the context of Peak Oil, should I be invested in the stock market, hold US dollars, buy gold, or what? Given that I have advanced knowledge about Peak Oil then in theory, I should be able to make money or at least avoid losing money. How do I do that? I live in the San Francisco Bay Area. After Peak Oil, is this a bad place to be? If so then where's a good place to be after Peak Oil? Is New Zealand a good or bad place to run to?
Welcome to the legion of commentators!
In regard to your questions, nobody can TELL you the answers; you have to figure them out for yourself.
Some forty-five years ago I lived in New Zealand for a few months; it is a land flowing with milk and honey, both then and now.
My awareness that oil would peak goes back to 1949, and maybe that gives me some seniority here. But I want to emphasize: You look at facts (and assertions and opinions), then you make up your own mind. I know where the best place in the U.S. is to make it through tough times, but I'm not going to come right out and tell you. It isn't that hard to figure out, once you get down to basics of energy and food and population density.
What should you do with your money? That's up to you. I give away some of mine, but that is because I have all the stuff I'll ever need and I've practiced ELP (especially the Economize part) to the point where my modest income is well beyond my very modest needs.
Read and get to know the contributors: They are all good. Read the comments, because many of them are excellent also. Over time you'll figure out who the smartest people are on this site.
Be not bashful: Make constructive comments of your own.
well I've known about PO since 1932 and I know a better place to live then you!
if you want to survive PO then buy a lot of guns and ammo and learn how to use them. Find friends who think likewise. Lern how to live like Jesse James of old. Farmers and shopkeepers are just going to be BIG fat targets when TSHTF. After 20 yrs when the dust settles down you can be a farmer if you like.
And that place is ????
Jesse James was shot in the back and killed. Maybe he isn't such a great role model. Several of his gang were killed in the raid on Northfield Minnesota. Not really much of success at all, was "Mr. Howard."
Korg, I'm not so sure Jesse James is a valid model. James was analogous to Osama bin Laden; he was an outlaw who was sheltered and supported by most of the population of a small area. Even in the "Wild West", small towns had duly delegated law enforcement and the general population would band together to protect the local bank and general store (it was in their own self-interest to do so).
However, I think your idea of looking at historical models is a good one. I'll suggest the US Civil War; even though the US population was much smaller than today it's extimated that about 500,000 Americans were refugees at one point or another. The armies of both sides were similar to some people's vision of post-collapse; well-armed gangs that ate or "requisitioned" everything in sight. Nonetheless, civilization survived.
PLAN, PLANt, PLANet
Errol in Miami
After the Rodney King trial, and the subsequent riots in Los Angeles, a select group of men from downtown Long Beach banded together to protect the local grocery store.
Happened in the far past, the recent past, and will happen again in the future. It's the "L" of ELP.
Eggplant,
There seem to be two primary approaches to personally surviving Peak Oil among the Peakniks hereabouts with a variety of intermediate positions taken as well.
The approach taken seems to depend on whether you fall into the "Very Severe Prolonged Depression" camp or the "End of the World as We Know It" camp. In the former scenario, life becomes very hard, but generally we muddle through. Great fortunes can be made, as they were during the hyperinflationary depression of the early 20's in Germany. Society does not collapse, although it is nobody's idea of a picnic. Indeed, for a large segment of the population, there is only crushing poverty. In this scenario, financial responses can probably get you through.
The second alternative envisions a collapse of society. Survival in this context involves sustainable, local solutions with some thought given to defense. You might want to move to Molokai, or some other equally remote location, preferably someplace where you have blood relatives who like you. Did you mention New Zealand? Learn a useful trade, and buy food storage for when the rains fail.
Personally, I think the first scenario is probably more likely, at least in North America. My suggestions would focus on financial responses and include:
1) Purchase all the oil you will ever consume in your lifetime now. Most people in the West use less than 25 barrels a year (at least in direct consumption, i.e. at the pump.) A twenty year supply (500 barrels) would be less than $40,000. Put at least 50% down on whatever you buy otherwise a 50% or greater correction in price wipes you out. If we Peakniks are right, oil will never be $35 a barrel again, so 50% leverage is safe. Buy a very long-dated contract, like one for 2012. Avoid the near month contracts that are mentioned in the news, as they are too volatile for your purposes.
Unfortunately, contracts on the futures exchanges are for 1000 barrels so you would need to split one with a like minded "investor/purchaser."
2) Continue to live in San Francisco if that suits you. SF has great public transit, you don't really need a car most of the time. San Franciscans will be less affected than other Americans by the price shocks and will make for better company.
3) Secure a job in an "essential industry" like working for the water company, or a defense contractor, or the government. When people have to cut back because the economy goes sour, you don't want to be selling timeshares in Tahiti.
4) Avoid stocks and bonds like the plague. A lot could be said about this, if you want a complete description I suggest "The Coming Economic Collapse" by Stephen Leeb. Generally, there are a number of factors in addition to Peak Oil that make stocks and bonds bad investments now: very high valuations is one of them. The Social Security Trust Fund That Doesn't Exist is another. Inflations are very bad for bonds; Depressions are very bad for stocks. It's hard to predict with certainty, but if Peak Oil occurs in the near future, we'll probably have both at the same time, like the Germans did in the early 20's. An exception to the above: you might consider the stock of oil companies (especially oil service companies) and alternative energy companies, etc. An easy way to invest in these is with Exchange Traded Funds like OIH.
5) Put your savings primarily in gold and silver. Throughout history, when times got bad, people have turned to gold and silver as a store of value. At these times, "Cash is King", and there is a premium on something tangible, something that isn't dependent on somebody else's ability to repay, or ability to make a profit, or inclination to feel optimistic about the future. Paper currencies are wonderful media of exchange, but when the government gets desperate it has a tendency to debase the currency to meet current expenditures, (especially when it owes a great deal of such currency to others.) If you hold paper currency or government obligations during such times, you lose.
6) Buy the most fuel efficient vehicle you can, if you need a vehicle. At present we have little in the way of alternatives to the automobile for a wide variety of purposes.
These are just my recommendations.
HI CZ,
re: "Buy a very long-dated contract, like one for 2012."
Just "FYI" and for the "questioner". Memmel, in an earlier post, (which is worth looking up if one is so inclined) I believe is of the opinion that the normal oil markets will not exist once "peak" is confirmed, which well be as early as 2012, and, therefore - if I understood his argument correctly - the contracts would not be worth anything. Just thought I'd mention this, as you may want to check out that discussion at some point. (I'd have to do a search for it, or you could possibly email memmel and ask him when it was.)
My advice:
Don't worry too much about the worst case dieoff doomer scenarios. There is certainly a possibility that such a "black swan" even may happen. But what can you do about it? Everyone in the US is surrounded by 50 million Bubbas with guns, plus we have a huge lethal military that won't just go away. Survival through a total civilizational collapse will be as much a matter of luck as anything.
What WILL make a difference is preparing for the "bad case" and "very bad but not quite worst case" scenarios. The probabilities of having to live through those are considerably higher -- IMHO much higher than the probability that the cornucopians are right and that we'll somehow pull a rabbit out of a hat and continue onward and upward as usual. The thing is, if you prepare as well as you can for the bad scenarios, you will have done about all that you reasonably can do for the worst case scenario as well. As I said, surviving that will be a matter of luck, but you will have made as much of your own luck as you can.
WT's "ELP" model is as good as anything for a "to do" list:
Economize: Learn to live frugally. Power down now. Start living as if times really were bad, money were tight, and energy and food were hugely expensive and increasingly scarce. Implementing maximum energy conservation & efficiency is an obvious priority; if you can implement any renewable energy sources, do it. Many of us are also trying to grow at least some of our own food, as we know that food prices will be going up as well.
Localize: If you are likely to need to depend upon a local supplier when times get bad, then patronize them now. You need to help build up your local economy so that it will be there when you need it. For food you can't grow, buy locally produced foods in season. Get involved in the community and help to strengthen community institutions. Get to know your neighbors better and build stronger personal ties with them. Reducing your automobile use to an absolute minimum is both an "E" and and "L" action; bring your workplace, shopping, etc. into close proximity with your home so that you can minimize your dependence upon the automobile, and eventually live without it completely.
Produce: No man is an island. You are probably not going to be able to be 100% self sufficient, so you are going to need to produce something of value that can be exchanged for those things that you can't provide for yourself. A lot of jobs are highly vulnerable, especially those in the "discretionary" sector. If/when times get hard, there is going to be a stripping away of a lot of waste and frivolity and a refocus on real necessities. You need to find something to do in the "non-discretionary" side of the economy.
One more point: I understand the temptation to escape to NZ or Costa Rica or wherever. Unfortunately, that may not be wise. The US and its citizens are becoming increasingly unpopular throughout the world; it is looking like this trend will likely get worse rather than better. The time may come when the welcome mat will be rolled up, and expatriates told to go home, even in places like NZ. Don't count on an angry mob being able to distinguish between "bad Americans", "good Americans", or even "former Americans".
Thanks to everyone for the responses to my earlier questions.
I find it interesting that within this forum there is general consensus that we're in deep trouble due to Peak Oil (a conclusion that I share) but the responses to this conclusion seem to be all over the map.
Normally when I'm confronted with a crisis and have no clue what to do next then my usual tactic is to do nothing and seek more information. However ignoring the problem of Peak Oil by doing nothing is effectively what a cornucopian would do except the cornucopian would do so in ignorance or denial. Mimicking a cornucopian doesn't seem a clever tactic to me. I guess the problem boils down to there being too many unknowns, e.g.when exactly will economic collapse begin, how dire will the immediate consequences be, will economic collapse coincide with widespread warfare or social breakdown? Historical experience is almost useless in preparing for Peak Oil. Except for local cases like the collapse of the culture on Easter Island, there really is no prior history of a world economic collapse due to resource depletion. This is uncharted territory. I guess where I'm going with this line-of-reasoning is the basic argument concerning the validity of Peak Oil has been made but unfortunately the rational responses to Peak Oil's validity remain undetermined.
Eggplant,
There are a lot of ways Peak Oil could unfold.
ELP is the obvious first step.
I spent some time thinking about what my life would be like if Gasoline was $25/gallon. (10 years from now?) I would probably have to cut back to 1 tank of gas per month (from 3). So I would be looking at local transportation only. I already walk to the commuter rail for work, so I'm better off then a lot of people.
My walkability score was 46, which seemed bad, but really my neighborhood is extremely walkable - with good sidewalks, and lots of places small local businesses could flourish. I already have at least 1 of everything within .25 mile.
Home insulation / energy improvements are another good bet. Double the insulation in your attic. Upgrade your furnace and hot water heater to high efficiency models (possibly solar for hot water if you have the right exposure). New windows. Etc...
If you really want to move - I would suggest moving close to your family.
A fixed interest mortgage is a good idea. Pay off all of your other debts.
If you have a little extra money - do some traveling now, it is likely to be a lot more expensive in the future.
Good luck!
Garth
Garth,
Thanks for the excellent advice.
It's funny how "great minds" work alike because I'm already doing many of your suggestions, e.g. rearranging my daily commute to walk home, new windows, double insulating the attic, etc. I've got the house now where it's quite comfortable with the electricity turned off. However something that I worry about is drinking water. I live in the San Francisco Bay Area (Sunnyvale) where about 20% of our drinking water comes from the Hetch Hetchy reservoir via a long aqueduct (the remaining 80% comes from local wells). All of San Francisco's water comes via the Hetch Hetchy aqueduct. If there is a full blown economic collapse due to Peak Oil then that aqueduct water may go away and the Bay Area become mostly uninhabitable. There doesn't seem to be any reasonable defense against this scenario (setting up an Australian style tank water system based upon roof collected rain water does not appear to be practical due to the large tank required). I'm still puzzling over that one...
In reading about what the Russians did when the Soviet Union collapsed many had small farms dacha's. It seems that the left the cities and retreated to these small farms.
I live near LA probably the worst place to be since we will eventually have riots. I'm of the opinion the Bay Area is just as unsustainable.
My suggestion is to invest in a small farm. Farther north in CA you have a reasonable water supply and east along the Sierra's. A manufactured home although not trendy is cheap.
If things get bad I'd leave the Bay Area I'd certainly prepare to leave I don't see that it has anymore survivability than LA.
Longer out or once we have handled declining oil San Fransisco probably will again be a important and safe city along with some of the others around the bay but the population will be a lot lower than now and I'd not be surprised to see Silicon Valley revert to farmland.
And of course you can expect a lot of the current irrigation works to not exist. In general most of California is not really that habitable or at least capable of sustaining a dense population. So it makes sense to assume it will drop back to some sustainable level. I'd just suggest having somewhere else to be while it does the dropping.
Memmet said:
"Longer out or once we have handled declining oil San Fransisco probably will again be a important and safe city along with some of the others around the bay but the population will be a lot lower than now and I'd not be surprised to see Silicon Valley revert to farmland."
You're touching upon one of my pet hates, i.e. so much prime farm land in California has been paved over and turned into urban areas. Some of the best top soil on the planet is in Santa Clara County and Orange County. I remember as a child seeing vast fruit and walnut orchards in these areas but now it's all city. IMHO, having this land revert back to farmland would represent a return to sanity.
Eggplant said:
Don't forget that one of the first steps in urban construction is the removal of the organic soil layer i.e. the topsoil, only enough is replaced to sort of grow a lawn around the houses
restoring that by sustainable methods we know of today is a century + long labour and skill intensive project
Eggplant--
i also live in the Bay, in Marin. Marin has a 80% local water supply from Mt.Tam.
Also, I have been trying to eat at least one thing I have wild harvested every meal- mushrooms and fish in the winter, blackberries, huckleberries, wild plums, clams, apples in the summer and fall----
Obviously this would not work if the entire population of the Bay did this, but I am horrified how few people can ID a wild mushroom, and be comfortable with it's consumption. I am a former commercial fisherman (last of the hunter gathers on a major scale) and appreciate the embedding in the world that feeding yourself and others instills.
Hightrekker -
I've thought about this, with much personal experience to draw upon, and have concluded:
If only a fraction OF A FRACTION of the people around you began foraging/gathering/hunting in 'your spots', in very short order virtually everything edible would be gone.
You would be left with a crowd of people gathered beneath beneath your tree a week after the rain waiting for one mushroom to appear.
Think about it. How many mushrooms do you find in a year? How many people live within 1 or 10 miles of you? Divide. How long will that sustain you? How about deer? or clams? Imagine all the clamming spots you know - would your neighbors even fit on the beach, shoulder to shoulder, shovel to shovel? Know how long it takes to replenish those populations?
I'm not trying to bum you out, but I believe many don't realize just how few people can 'live off the land' in our world.
The only reason you can do it now is that at least 99% of your neighbors have no clue. If the workaday world fails, or for whatever other reason more of your neighbors start looking, your yield will diminish by 99.9% immediatly. Guaranteed.
Being embedded in this world elicits other feelings than appreciation sometimes...
got2surf--
Totally agree with your analysis----
Earth supported about 30 million hunter gathers max, with intact ecosystems--
Sometimes less---
I am just amazed how detached humanity is from that existence, seeing that it occupied the major part of our ecxistence--
You surf obviously-- Lived in Maui 10 years, Guam 3, born in California---
I have been missing the little green box lately--
Hightrekker
PS- During a hike this afternoon witnessed a family munching on wild plums--
I harvested plums and blackberries
Considering that almost all cities pump their water to end user I would say that this is going to be the last thing that will go. However that's not to say that there would not be intermittent power outages when the taps run dry.
As humans we need ~2/3 litres of drinking water a day. If your growing stuff a lot lot more. Toilets, washing, it's all going to add up. A solar powered water condensing unit would be nice if it existed, anyone?
Yes, the water question is a big one -how did people use to do it in London, SF, NY, etc. before pumped water -was it all done from local hand pumped wells?
Nick.
The reality is most folks here have comfortable urban jobs. (including me) Their gooses are cooked and (deep down) they know it. So they're willing to acknowledge we're in deep shit but unwilling to acknowledge it's time to prep for that beyond writing your congressman.
NZ has its charms. But I suspect anywhere you choose to live you should know well, or get to know well (people/land/climate/history/etc.)
Although I note that even we are not free from the clutches of big oil... but look at where they are thinking of drilling. Desperation?
http://www.bloomberg.com/apps/news?pid=20601087&sid=ahecPZfR0HYM&refer=home
"You can never solve a problem on the level on which it was created."
Albert Einstein
I revisted the EIA website about Saudi Arabia:
"One challenge for the Saudis in achieving their strategic vision to add production capacity is that their existing fields sustain, on average, 6 to 8 percent annual "decline rates” (as reported by Platts Oilgram) in existing fields, meaning that the country needs around 700,000 bbl/d in additional capacity each year just to compensate for natural decline."
Their new drilling efforts were published:
"In December 2006, Saudi Aramco announced its 2007 exploration and drilling budget of almost $4 billion - nearly double the draft budget and full quarter of Aramco’s 2007 capital budget. According to Oil Daily reports, Aramco plans to drill 427 onshore and offshore crude oil development wells in 2007. Approximately 134 wells will be in or near Ghawar, while 85 will be drilled in Khurais, and some 50 drilled in Khursaniya."
http://www.eia.doe.gov/emeu/cabs/Saudi_Arabia/Oil.html
The Saudis have a high probability of finding smaller satellite fields that are mapped structural features but were not drilled as they once had wells that flowed in excess of 10,000 barrels per day and did not bother to waste the time of day drilling smaller structures, developing difficult reservoirs, or tapping larger structures holding subprime crude.
Saudi Arabia also has huge natural gas reserves in associated and non-associated gas.
Don't we drill several thousand oil and gas wells every year in the US. I can't seem to find the exact number. Also do these numbers include water injection wells ?
Wow found it interesting article.
http://alum.mit.edu/ne/whatmatters/200411/index.html
Compared to the US if KSA is in decline that are not in a frantic hurry to overcome it. In general Aces stance seems closer to correct for KSA.
I've said a few time I don't think the world will try near as hard as the US has to maximize production once decline begins this seems to indicate that this statement is true.
memmel,
Wells in the US are averaging about 6 bbl/day, and 90% of the new wells completed are gas wells, not oil wells. We're pretty seriously depleted.
Bob Ebersole
The point is if you look at the US oil industry and compare to the rest of the world you get this huge gulf between how we have handled depletion and they way the rest of the world seems to be handling. We turned the US into a pincushion to keep Oil/Gas production up.
I'm astounded at how much we spend in the US on marginal production and all these small wells eventually add up to a several mbd which itself is impressive.
However this does not tell us much how depletion will play out in the exporting countries we can expect the response to declining production to not be on the same scale as the US.
Consider if you removed all the independent contractors keeping up US production ?
We would be at a few mbpd at best.
Thats the sort of analysis I did and its frightening.
What you see are huge drops in production at close to the natural decline rate which is in general 8% plus.
For example Ghawar it seems that once parts of Ghawar hit 90% water cut they may be abandoned while in the US we would still be pumping like crazy. This is several mbpd of production that might not be produced for a long time.
Memmel,
I'd hate to speculate about the best production practices at Ghawar, they have the best petroleum engineering in the world, I guarantee the Saudi's want to make the gravy train last as long as possible. It could be that they don't produce wells behind the water front because they are more concerned with keeping effective pressure up in the reservoir so as to drive more oil to their well bores that have not watered out.
As far as numbers of wells in the U.S., the drainage is likely more effective per acre foot in some areas because they are so dense. But there was also a lot of economic waste because there were way to many wells drilled into the same reservoir. At Kilgore in the East Texas field people could literally walk from derrick floor to derrick floor back in the 1930's. At Spindletop, found in 1901, promoters sold the land and minerals so that an "investor", or mullet, would own the land even if he/she didn't get a well. There are some 50' x 50' lots on top of the mound. And, if you want to have real fun, try chasing down the heirs of great-grandpa's get rich quick scheme in 1901.
Still, Spindletop produced 160 million barrels, and several of the Major oil companies started there, including Humble, who became Exxon-Mobil, Texaco and Gulf, who are a large part of Chevron and some fortunes were made that are still huge. The East Texas field was the largest field in the lower 48, and my grandfather's estate's minerals still make about $600 per month of which I get about $100, and it beats working for the money.
Twenty barrels a day is an excellent income, so its worth operating a few stripper wells. Figure it out-thats 600 barrels a month gross, 450 barrels after paying royalties. At $60/bbl thats $29,700.00 a month. Pay electricity, a pumper (field worker), a secretary, water disposal, treatment chemicals, a little office, ad valorem taxes and that's $180,000.00 a year take-home and it beats working for a living. All the old oil field towns in Texas, Oklahoma and Louisiana are full of those guys, mostly bitchin' about liberals and taxes at the local cafe.
Of course its not always that easy, when prices were down they had to work a little more for a lot less, but guys like that are the reason these old fields still limp along. And there's a lot of leases that are abandoned because the operators got squeezed out that should be very profitable now.
So now I'm out of the closet with my peak oil plan!
If Matt Simmons is right about oil prices, a 17 bpd well, after royalty, before operating costs will generate a cash flow of about one million dollars per year, in constant 2005 dollars.
I've compared small oil producers to small organic farmers. We can't materially change the world energy/food picture, but we can have positive impacts on our community, and provide local jobs, while we hopefully transition to an electrification of transportation system (and organic farming), powered increasingly by wind/nuclear.
I've had some interesting discussion with some Peak Oil aware upper income friends. When it comes to what kind of jobs their little darlings will be doing, the near-universal response is that their will still be a need for "policy makers," i.e., lawyer types in white collar positions, while someone else does the energy/food work.
In any case, the current situation is not "the boom." It's just a squall line in front of the big energy storm. I say "Boom," because service prices will rise in lockstep with product prices. But it is better to be a net energy/food producer than a net energy/food consumer.
Jeffry,
I'm pretty sure Matt Simmons is smarter than I am, and definitely harder working. For the sake of our country and the sake of the world, I hope he's wrong. But taking my little money and placing my bets-I'm going to do what the experts tell me.
And the other way to look at it is if you can find a 100,000 barrels of overlooked oil, whether in an old field or just a shabby show that was never completed-its worth $20,000,000 at Matt Simmons prices, gross returns. At the conservative $60 a barrel I used, its $6,000,000.00. And I have several good prospects, as I know you do too.
Bob Ebersole
Is it just me or are others out there seeing a rash of out-of-work college grads rushing into law school in the hopes that when they get out, there will be hordes of clients waiting in line to hire them for much needed legal services?
LMAO !
I do spend two seconds wondering what will happen to Paris, Britney, et al post-Peak Oil.
Alan
Thank you, Ace, for a comprehensive post.
One thing I notice in the comments here at TOD is a lot of debate, quibbling, and outright flaming about forecast methodology. It's not surprising, given the wealth of technical experts, the multiplicity of methods, and the difficulty of obtaining decent data points. Still, sometimes I find it less than completely useful.
A broker friend of mine says, "Nobody can time the market." He's right, there are too many variables. Likewise, peak oil. Technical experts can do their best, but then a civil war, an economic downturn, a hurricane, a policy change, or more likely a combination of all these things and more throw all that careful calculating in the dumpster. That said,I don't think that anyone who reads this site regularly thinks that the next generation will be happily cruising the highways in Ford Escalades. A parable:
You are a very careless skydiver. You have jumped out of a plane a couple of miles up into a thick cloud bank, and you left your altimeter in the plane. Damn. You had intended to freefall for a mile and a half and then pull the ripcord. You know that the ground is down there, and that the inexorable force of gravity is drawing you towards it at a terminal velocity of somewhere around 120 mph. You know that you have roughly a minute. You don't know if the clouds will end at 2000' or 1000' or 100', or if they will go right to the ground. When do you pull the ripcord? Do you rely on your innate sense of timing, hope for an exact 120 mph velocity, and follow your wristwatch for 45 seconds? Do you wait for the clouds to part and hope you don't end up feeling really stupid for a few seconds? Call me a weenie, but I'd pull the ripcord right away.
I appreciate the forecasts, for sure, but I really appreciate the articles on possible avenues of action. I liked the ones about discount rates and human psychology, because convincing people to act is 99% of the battle for the relatively tiny group of TOD folks.
I gave a talk at the spring conference of Vermont Businesses for Social Responsibility about preparing for peak oil/coal/natural gas. I created some graphics myself from EIA data, borrowed (with permission) from a TOD poster, and managed to drop some jaws in a room full of people who were better informed than most. When I say "dropped some jaws," I mean it literally, as in people with frightened eyes showing me the insides of their mouths. And these are people self selected for some kind of environmental/political awareness.
How about less of the "2% decline in the BorgaWorga field!?! What have you been smoking? It will be 2.1% at least!" and more about what we need to do before BorgaWorga declines 2% or 2.1% or however much. We need a discussion of how to get the general concept of "Peak oil is a geological inevitability and it is going to happen before you collect Social Security and it won't be a picnic" into the general consciousness. Or, as a friend of mine in the alt-energy business replied to an SUV driving soccer dad's classic "They'll think of something": "I am they, and we won't."
I think that the key question, which Alan Drake has asked, is how did the US move people and goods around the country, with little oil input in the past?
Tahoevallylines ASPO article 374 Second Dimension Surface Transport Logistics Platform
Please see http://theoildrum.com/node/2800
We cannot nor should we turn back the clock. We can and should build on past infrastructure that will fit in a plan to help us survive the Oil Interregnum. Maintaining Societal & Commercial Cohesion is paramount. Franklin's Post Road concept, formalized in statute with the Congress July 10, 1838 Act declaring All Railroads in the USA to be "Post Roads" is a crucial element in the solution set. Railways are integral to America's Plan B for meeting this unparalled emergency.
Note Association For The Study Of Peak Oil & Gas Newsletter 42, article 374. Pick it apart & put it together for a starting point. An obscure but eerily prescient discussion of our current challenge is to be found in "RAIL TRANSPORT & THE WINNING OF WARS", by James A Van Fleet, Association of American Railroads, 1956. Published same year Ike signed the Interstate Defense Highway System Bill... Hmmm.
The answer of course was coal and wood. Steam engines were wood fired, then coal fired. And the golden age of trains happened when the competition was largely the horse. Horses were relatively slow and required lots of land for feed and care. Trains now compete with planes and automobiles. For passengers, this comparison is mostly unfavorable. However, when oil supplies decline, trains may be viewed much more favorably.
Don't forget ocean shipping and canals. Most of the population of the country lives close to the oceans, the Mississippi and tributaries,the Great Lakes, and the canal system. Its the cheapest form of transport.
Ports of one kind or another will be the merchantile centers in an energy constrained world.
Or, as a friend of mine in the alt-energy business replied to an SUV driving soccer dad's classic "They'll think of something": "I am they, and we won't."
MH,
Great line! This sums it up in a nutshell...
You pull and the chute fails. But you have a ball of yarn and some knitting needles...
| The problem will solve itself.
| But not in a nice way.
LOL
COL
Thanks for the imagery.
Like most of you, I have been watching the gasoline situation with interest. It looks like the Americans are going to scrape through this summer by just enough to keep the peak-oil issue below the public radar.
It occurred to me that predicting the date of peak-oil is irrelevant if nobody knows it. Like a tree falling in the forest.
Therefore, I have decided to make my prediction. I declare that Peak Oil will be on the 4th of July 2008. I reckon that will be the day it dawns on the public at large.
I've tried to bring up the issue of what we will do about gasoline next summer a few times. So far no one has discussed it. But its obvious that we probably will have problems. We may well have heating problems this winter but these become fairly certain by winter 2008.
I actually think it will be 2009 before people generally wake up to peak oil understand the average American is not a fast thinker and they will wait patiently for the MSM to spin a story.
According to the IEA, the current peak oil (total liquids) has potentially happened on Jul 2006 at 86.13 mbd, Table 3 the 2006 Oct 11 Oil Market Report.
http://omrpublic.iea.org/omrarchive/11oct06tab.pdf
(24 page pdf warning)
According to this Saudi Gazette article on 14 July 2007, based on the IEA,
http://www.saudigazette.com.sa/index.php?option=com_content&task=view&id...
(and also http://www.busrep.co.za/index.php?fArticleId=5018310&fSectionId=552&fSet... )
According to IEA, current Peak Oil (total liquids) is potentially 86.13 mbd on Jul 2006. One year later, production in Jun 2007 was 84.3 mbd, which is a drop of 1.83 mbd or just over 2%/yr. This is a bigger drop than I have forecast! I hope that Jun 2007 was just an unusual month.
It is not just a matter of lack of awareness. The issue is surrounded by considerable obfuscation on the part of the government, big oil, the MSM, etc. General awareness and undisputed acknowledgement that oil has peaked will not occur until long after the event has passed.
The is the perfect format for this kind of thing -- executive summary up front. It won't prevent me reading more, though perhaps selectively. There have got to be more senile readers with ADD than just me here.
I am disappointed that this was just posted as an update to a prior post. The worsening numbers deserve attention on their own and not to be treated as a rehash. The situation in August is already different than July.
"The greatest shortcoming of the human race is our inability to understand the exponential function." -- Dr. Albert Bartlett
Into the Grey Zone
Ace, I'm not clear on the assumptions you used with respect to production rates of Saudi heavy sour. OK, their current claimed "spare capacity" is currently unmarketable due to refinery capacity constraints. But this is presumably a transitory condition : at some point, surely somebody (if only the Saudis themselves) will have adequate capacity to refine all the oil they choose to produce.
1) has anyone studied this question of when world refining capacity will catch up with the heavy sour production potential?
2) does your forecast of Saudi production integrate this current "spare capacity" at some future date?
3) why, then, the arbitrary limitation of the reserves of Safaniya and Manifa to 20 Gb? What does the production forecast curve look like if you integrate all that heavy sour?
Anyone else care to comment?
I'm wondering whether this discrepancy on heavy sour oil accounts for the fact that Ace is calling the peak at 2006-2009, whereas others, using mostly the same bottom-up data, are calling 2009-2012?