World Oil Forecasts Including Saudi Arabia, Kuwait and the UAE - Update Feb 2008
Posted by ace on February 17, 2008 - 11:00am
Executive Summary
- World total liquids production (Fig 1) remains on a peak plateau since 2006 and is forecast to fall off this peak plateau in 2009. Increasing numbers of oil experts are forecasting impending peak production plateaus. According to the International Energy Agency (IEA), the current peak production of 87.2 mbd occurred on January 2008. As long as demand continues increasing then prices will continue increasing.
- Forecast world crude oil and lease condensate (C&C) production retains its 2005 peak (Fig 2). The forecast to 2100 shows declining C&C production, using a bottom up forecast to 2012 (Fig 3). The forecast to 2012 shows a slight decline to 2009, followed by a 3%/yr decline rate to 2012.
- World oil discovery rates peaked in 1965 (Fig 4) and production has exceeded discovery for every year since the mid 1980s. Discoverable reserves in giant fields also peaked during the mid 1960s (Fig 5). The time lag between world peak discovery in 1965 and world peak production in 2005 of 40 years is similar to the time lag of 42 years for the USA Lower 48 (Fig 6).
- World C&C year on year production changes to October 2007 and November 2007 (Figs 7 and 8) show significant declines for Mexico, North Sea and Saudi Arabia and significant increases for Russia, Azerbaijan and Angola. As Russia is likely to be on a production plateau and Saudi Arabia, Kuwait and the UAE have probably passed peak production, the world C&C production will continue to decline slowly.
- Saudi Arabia retains its 2005 C&C peak (Fig 10), which is the same as the peak year for world C&C (Fig 2). Saudi Arabia C&C production has dropped to 9.0 mbd which is 0.6 mbd less than its peak in 2005. It is now almost a certainty that Saudi Arabia passed peak C&C production of 9.6 mbd in 2005 (Figs 9 and 10).
- Kuwait retains its 2006 minor C&C peak (Fig 12). Kuwait C&C production has now dropped to 2.5 mbd which is less than its peak in 2006. There is a strong likelihood that Kuwait has passed its minor 2006 peak (Figs 11 and 12). Kuwait’s major peak was 3.3 mbd in 1972.
- UAE retains its 2006 C&C peak (Fig 14). UAE C&C production has now dropped to 2.6 mbd, adjusted for maintenance, which is just less than its peak in 2006. There is a reasonable likelihood that UAE passed its 2006 peak (Figs 13 and 14).
- World natural gas plant liquids is forecast to increase due mainly to new OPEC projects (Fig 15). World ethanol and XTL production is forecast to almost double by 2012 (Fig 16). World processing gains are forecast to decline slowly to 2012 (Fig 17).
Major Changes from the Previous Update Oct 2007
The major changes from the previous update are the inclusion of additional forecast production from the projects listed at Wikipedia Oil Megaprojects and the increase in OPEC production quota by 0.5 mbd starting 1 Nov 2007. There are also a few paragraphs added in section 1 below describing the increased consensus about peak oil by more oil industry experts.
![]()
1. World Total Liquids Supply & Demand
Although crude oil & lease condensate (C&C) production is forecast to continue declining, the total liquids supply remains on a plateau until 2009 (Fig 1), due to offsetting production increases from natural gas plant liquids (NGPLs), ethanol and XTL (BTL - biomass to liquids, CTL - coal to liquids and GTL - gas to liquids). The main causes for the end of the total liquids plateau in 2009 (Fig 1) are that the C&C production decline rate accelerates to 3%/yr in 2009 (Fig 3) and the production growth from natural gas plant liquids stalls (Fig 15).
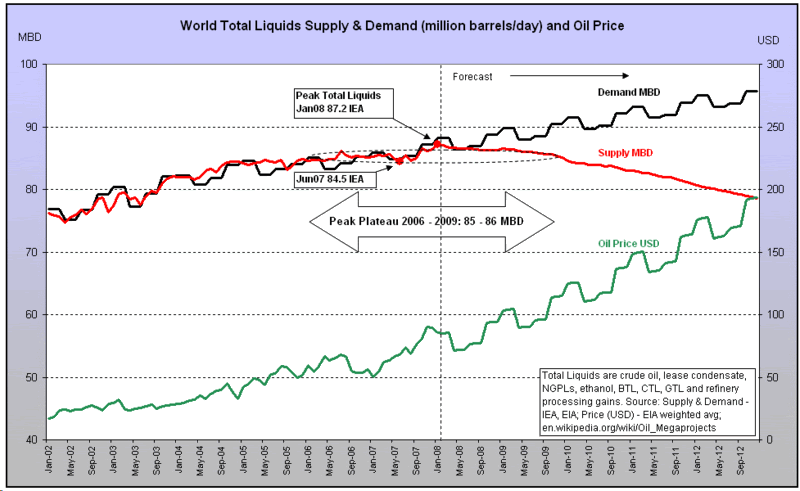
Fig 1 - Total Liquids Supply & Demand to 2012 (bottom up forecast) - click to enlarge
Is future total liquids production likely to exceed the current peak of 87.2 mbd on January 2008? It might be possible but it appears unlikely. North Sea production continues to decline. Mexico's production is also in decline. Former USSR production might increase by a small amount. Canada's production should increase slowly but the oil sands are experiencing production constraints and despite claimed reserves of up to 315 Gb (billion barrels), the oil sands will probably produce, at best, a maximum of only 2.5 mbd (million barrels/day). Biofuels production should also continue increasing. Non OPEC total liquids production might increase slowly, assuming that no unexpected disruptions occur.
Increasing Numbers of Oil Experts are Forecasting Impending Peak Production Plateaus
Matt Simmons’ presentation to the Minnesota House of State Representatives, February 4, 2008, shows the current production plateau on slide 29, with a forecast of 69 mbd crude oil and lease condensate by 2012. On January 31, 2008, Kang Wu and Fereidun Fesharaki, of the East-West Center, released a book titled "Asia's Energy Future: Regional Dynamics and Global Impliciations" which stated that global oil production might increase to 100 or perhaps even 105 mbd somewhere between 2015 and 2020. Jeff Rubin and Peter Buchanan, CIBC World Markets, wrote a report, dated January 10, 2008, which forecasts a peak production plateau of just over 88 mbd from 2011 to 2012. On January 22, 2008, Jeroen van der Veer, CEO of Shell, in an email to all Shell employees, acknowledged the reality of peak plateau when he said that “after 2015 supplies of easy-to-access oil and gas will no longer keep up with demand”. In a similar acknowledgement in November 2007, the CEO of Total, Christophe de Margerie, and the CEO of ConocoPhillips, James Mulva, both stated that supply would not exceed 100 mbd. Colin Campbell, in his November 2007 newsletter also stated the possibility of a peak plateau now, altering his original forecast of a depletion based “Peak in 2010 at 87.3 Mb/d that becomes 90 Mb/d with refinery gain. A depletion-based Peak may not of course be reached if high prices hold down demand, delivering more of a plateau than a peak”.
On October 30, 2007, Shokri Ganem, Libya's National Oil Corp Chairman, said that supply may not exceed 100 mbd and later, in January 2008, he said that OPEC can do little and that most OPEC countries are producing at capacity. Sadad Al-Husseini, former Saudi Aramco exploration and production head, presented this production forecast at the Oil & Money October 2007 conference which showed a production plateau of crude oil, condensate and natural gas liquids extending from 2009 to 2012 at 83 mbd, followed by a decline. Dr. Werner Zittel and Jorg Schindler, Energy Watch Group, wrote a report, dated October, 2007, which forecasts a historic peak of 81 mbd in 2006 of crude oil, condensate and natural gas liquids. On October 8, 2007, Jim Buckee, retired CEO of Talisman Energy, said that the world is at peak production or close to it. Finally, Chris Skrebowski, editor UK Petroleum Review, said in October 2007, that world total liquids production will reach a peak plateau of 92 mbd during 2010 to 2011 but he adds: “so what my analysis is saying is that we’ve got another 5 to 7 million barrels a day to come if everything works properly”.
Another expert who made great contributions to the awareness of peak oil is Dr. Ali Morteza Samsam-Bakhtiari, a retired director of the National Iranian Oil Co., who regrettably passed away in October 2007. Dr Samsam-Bakhtiari, using his WOCAP model, predicted a 2006 to 2007 peak plateau of 81 to 82 mbd of crude oil, lease condensate and natural gas plant liquids. He also said that “it became clear that the modelling phase of ‘Peak Oil’ had come to an abrupt close and that henceforward ‘Peak Modelling’ should be shelved once and for all”.
As world total liquids production is forecast to decrease to 2012 (Fig 1), two important consequences are likely to occur. First, as demand is forecast to increase, prices are forecast to rise, using short and long run price elasticities, which will force demand downwards to equal supply. Second, the decreased available supply may invoke the IEA Response System for Oil Supply Emergencies. Unexpected supply reductions could trigger oil rationing among the 26 countries which are signatories to this IEA Response System, but unfortunately China, Russia, India and Brazil, which are not signatories, are highly unlikely to agree to the IEA’s rationing method because its rationing basis is by country rather than by person. The resulting tensions, from oil supply shortages, among the signatory and non-signatory countries could lead not only to continued competitive oil bidding, but also to continued conflicts and violence in order to secure vital oil supplies.
![]()
2. World Crude Oil & Lease Condensate Production
The largest component of world total liquids production is world C&C production. The first part, 2008 to 2012, of the forecast to 2100 (Fig 2), is created using a bottom up forecast based on over 350 continuously updated regions/projects from 2008 to 2012 (Fig 3). After 2012, two scenarios are shown.
The first scenario, shown by the red line, is based partly on BP reserves data, but large downward revisions are made to OPEC reserves and small upward revisions are made to the reserves of many countries to derive a more accurate estimate of proven and probable reserves. Yet to find C&C reserves are added to this estimate of proven and probable reserves to give world total ultimate recoverable reserves (URR) of 1.85 Tb (trillion barrels) including remaining URR of 0.78 Tb as at end 2007.
The second scenario, shown by the green line, uses Colin Campbell’s URR estimate from his February 2008 newsletter. His URR estimate is equal to 2.23 Tb, excluding natural gas plant liquids. His estimate is higher than the first scenario estimate of 1.85 Tb due to an additional 0.23 Tb URR from the UAE, Iran, Iraq, Kuwait and Saudi Arabia, and higher URR estimates from heavy oil and polar oil. The green line forecast shows what might be possible if the middle east gulf countries really do have the reserves close to what they have claimed, if promised production increases from heavy oil occur and if additional significant polar oil is discovered.

Fig 2 - World Crude Oil & Lease Condensate Production, including OPEC Core, to 2100 - click to enlarge - (the reserves and production of the Neutral Zone are shared equally between Saudi Arabia and Kuwait)
The production from OPEC Core countries of Saudi Arabia, Kuwait and UAE is shown by the blue line and retains its 2005 peak (Fig 2). These three countries are labelled as OPEC Core because these countries have over 50% of proven reserves of OPEC-12 total proven reserves, (according to BP statistics) and produce almost 50% of the OPEC-12 total C&C production. Gately also labelled these countries as core potentially due to similar reasoning. There is a strong correlation between the production from the OPEC Core and the world.
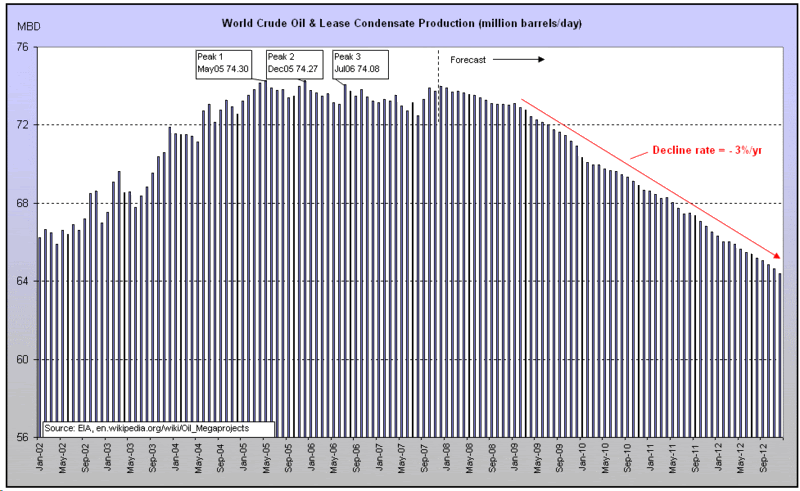
Fig 3 - World Crude Oil & Lease Condensate Production to 2012 (bottom up forecast) - click to enlarge
World C&C production retains its May 2005 peak and is forecast to decline slightly until 2009. The decline rate from early 2009 to 2012 is 3%/year.
![]()
3. Peak Production and Peak Discovery Time Lags
Although the forecast production decline rate in Fig 2 appears high, it is a natural time lagged response to the peak year for discoveries as shown in this section. Fig 4 shows the peak discovery year in 1965, followed by a steady decline in the discovery rate. For every year since the mid 1980s, annual production has been greater than annual discoveries. This is not sustainable and it is inevitable that world annual production will start to decline. This timing of peak production and rate of decline is forecast by Fig 2.
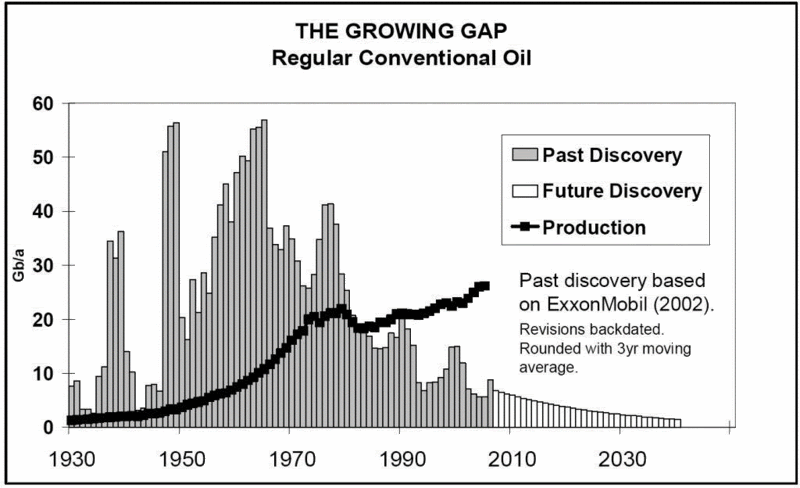
Fig 4 - World Discoveries (source ASPO Ireland Newsletter No. 80, August 2007) - click to enlarge
The figure below focuses on giant oil field discoveries and shows a similar shape to the figure above. The number of giant oil fields discovered peaked in the 1960-69 decade and both the number of giant fields and their respective recoverable reserves have declined steadily. The shape of the discovery decline curve below from 1960 to 2006 is similar to the production decline curve (Fig 2) from 2005 to 2100.
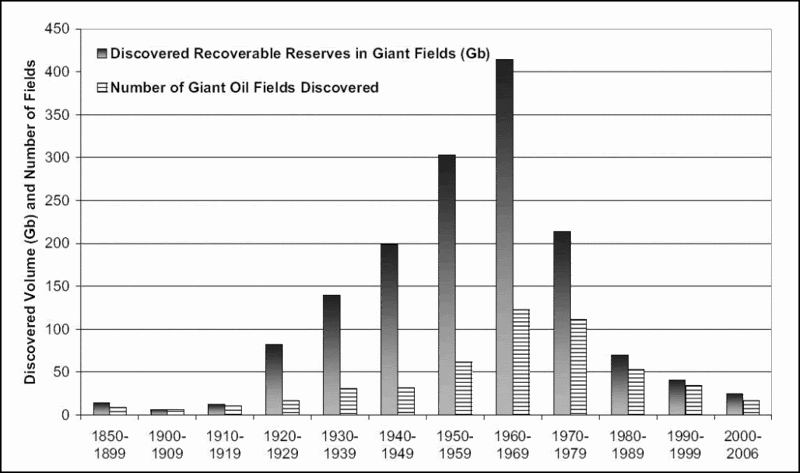
Fig 5 - World Discoveries, Giant Oil Fields (source Giant Oil Fields – The Highway to Oil, Fredrik Robelius, March 2007) - click to enlarge
A very good example of the time lag between peak discovery and peak production is the USA (Fig 6). Peak discovery was 1930 and peak production occurred 42 years later in 1972. Fig 4 shows peak discovery for the world occurred in 1965. Fig 3 predicts that peak production occurred in 2005, which is 40 years later than peak discovery, a similar time lag to the USA.
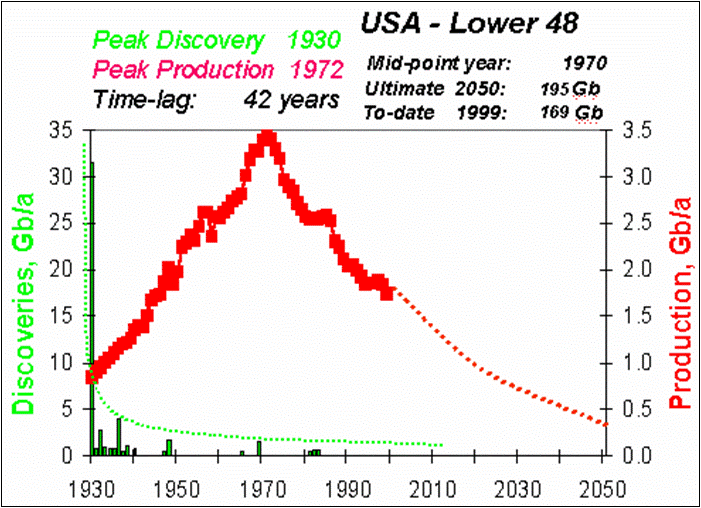
Fig 6 – USA Lower 48 Peak Discovery and Peak Production (source Peak Oil: an Outlook on Crude Oil Depletion, Colin J.Campbell, February 2002) - click to enlarge
![]()
4. World Crude Oil & Lease Condensate Production Changes
Year on year production changes, represented by the green bars in Figures 7 and 8 below, show the biggest declines for Mexico, North Sea and Saudi Arabia and the biggest increases for Russia, Azerbaijan and Angola. Angola has many projects which should increase its production capacity but actual crude production rates will be limited to its new OPEC quota of 1.9 mbd. Russia’s mature field production will probably limit Russia’s future production growth.
Month on month changes from Sep 2007 to Oct 2007 (Fig 7), represented by the light blue bars, indicate decreases for Canada, Egypt and Mexico. Over the same time period, Angola, Azerbaijan, Iraq, USA and the North Sea showed good increases.
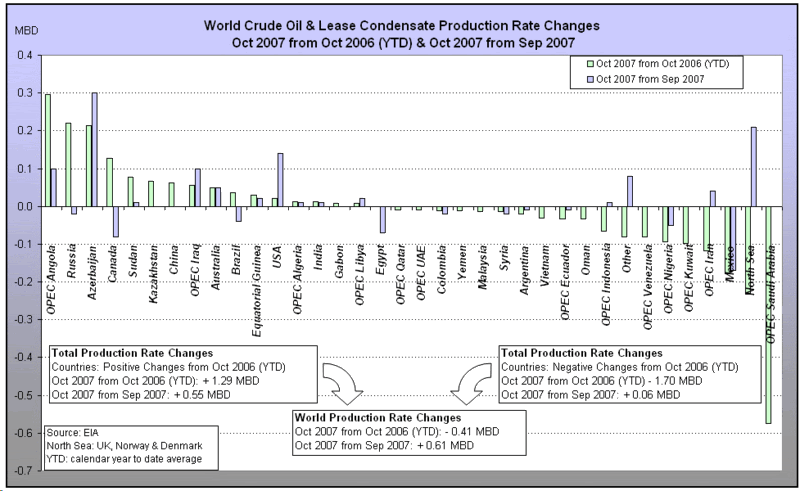
Fig 7 - World Crude Oil & Lease Condensate Production Changes to October 2007 - click to enlarge
Month on month changes from Oct 2007 to Nov 2007 (Fig 8) showed good increases for Azerbaijan and Saudi Arabia. Production fell for UAE due to significant maintenance. The production drop for Mexico is due mainly to continued geological decline as PEMEX announced that “oil reserves may run out in seven years”. Also from Oct 2007 to Nov 2007, Canadian production remained constant, despite the optimism about oil sands. Russia showed a small decrease in production. Could this mean that Russia’s C&C production is on a slight decline now?
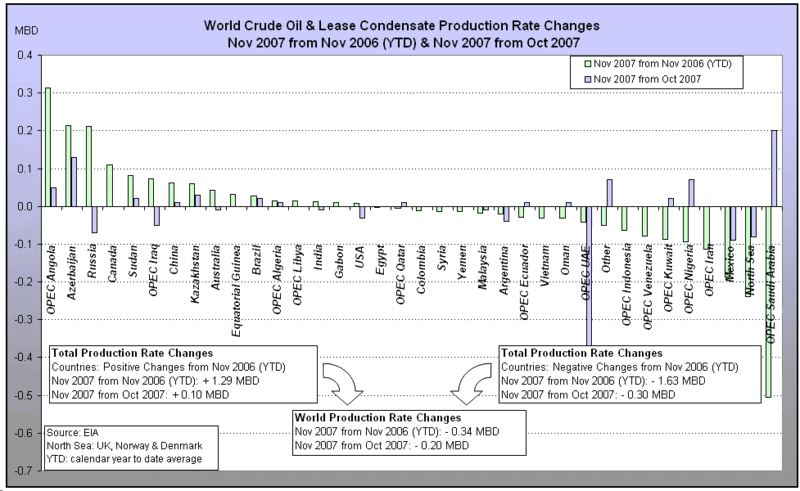
Fig 8 - World Crude Oil & Lease Condensate Production Changes to November 2007 - click to enlarge
World C&C production is dropping, on an annual basis, by about 0.4 mbd (Figs 7 & 8). This is not a high decline rate but given that Russia is probably unable and unwilling to increase production and that Saudi Arabia, Kuwait, the UAE, the North Sea and Mexico are unlikely to reverse their decline rates, the world C&C production rate is forecast to continue its decline (Fig 3).
![]()
5. Saudi Arabia Crude Oil & Lease Condensate Production
Saudi Arabia remains a key producer in the world and continually reminds the world of its enormous reserves and surplus production capacity. This paragraph on capacity in IEA's 12 June 2007 Oil Market Report, page 15, explains Saudi Arabia’s current surplus capacity situation within an OPEC context.
Notional spare capacity stands at 4.0 mb/d, while our measure of effective spare capacity (excluding Indonesia, Iraq, Nigeria and Venezuela) stands at 2.85 mb/d. Although these volumes are physically producible, even this lower figure likely overstates what OPEC could actually shift onto the market given current prices and shortages in refinery upgrading capacity. Heavy, sour Saudi Arabian and Kuwaiti crude accounts for 88% of the effective spare capacity figure. In the absence of substantial discounts, these volumes might struggle to find buyers while sizeable amounts of refinery upgrading capacity remain offline for scheduled and unscheduled maintenance. Readily marketable spare crude capacity may therefore be much lower, and a more accurate reflection of current market tightness.
In other words, this IEA paragraph says that the world has only 0.35 mb/d spare capacity of readily marketable light sweet crude because the spare capacities of 2.20 mb/d from Saudi Arabia and 0.30 mb/d from Kuwait are hard to sell heavy sour crudes. In August 2007, energy analyst Bill Herbert reaffirmed IEA’s views when he said that “even if OPEC decides to open the spigot a bit more, it’s hardly a guarantee prices would stay in check. Most of OPEC’s spare capacity is in heavy sour crude oil, which must be processed in types of refineries that already are running at full capacity. There’s very little ability on the part of the supply system to respond to more demand”. Furthermore, the EIA Short Term Energy Outlook, 7 August 2007 stated that “The low level of surplus OPEC oil production capacity, which is primarily in heavy crude oil, remains a key reason for the continued tight market conditions…Further, the apparent unwillingness by OPEC to use available surplus capacity in the face of rising crude oil prices reduces any downward price impact that additional surplus capacity might have.” Given these statements by the IEA, Herbert and the EIA, the following forecast assumes no effective spare capacity of easily marketable Saudi Arabia crude.
It is also assumed that Saudi Arabia will produce their fields while maintaining the annual depletion rate, which is annual production as a percentage of ultimate recoverable remaining reserves, at less than 5.0%/yr. This should ensure that reservoir damage does not occur due to overproduction from their fields. The figure of 5.0%/yr was selected because it's slightly more than the annual depletion rate of remaining reserves reaching a previous peak of 4.5%/yr in the third quarter of 2006 (Fig 9), based upon estimated ultimate recoverable reserves (URR) of 185 Gb for Saudi Arabia. This figure of 5.0%/yr could be slightly optimistic. Tariq Shafiq, a petroleum engineer who was Vice President and Executive Director of the Iraq National Oil Company (INOC), said that a depletion rate of 4-5% is well within good reservoir management for large fields. In addition, Colin Campbell stated on page 7 of his ASPO Ireland Newsletter No. 80, August 2007 that “a Depletion Rate of 4.2%...sounds quite reasonable for a mature country like Kuwait, compared for example with 6.5% in the United Kingdom or 4.5% in the US-48”. If a lower forecast annual depletion rate is assumed then Saudi Arabia’s production rate would drop faster than is forecast (Fig 9).
The estimated URR of 185 Gb is equal to 150 Gb of non heavy crude plus 35 Gb of heavy crude. The 35 Gb includes the heavy sour crude fields of Safaniya and Manifa, which is slightly less than Horn's 2006 estimate of 37 Gb. The non heavy crude URR of 150 Gb includes 75 Gb for Ghawar (light) which is greater than Horn’s estimate of 66 Gb, 13 Gb for Abqaiq (extra light), 9 Gb for Berri (extra light), 6 Gb for half of the Neutral Zone and the remaining URR is assigned to Aramco’s other non heavy crude fields including Marjan, Qatif, Khurais, Zuluf, Shaybah, Abu Safah and Khursaniyah. The estimated URR is based on the information sources about Saudi Arabia, located at the end of this article and the previously mentioned Horn's 2006 paper. Furthermore, this estimate of URR 186 Gb, from this source, gives good support for the estimated URR of 185 Gb.
The possibility of a lower Saudi Arabia total URR exists. Based on this mathematical technique, this recent research “suggests that the Saudi Qt (or total URR) is only 150 Gb, which in turn suggests that Saudi Arabia is now over 70% depleted, with about 40 Gb in remaining recoverable reserves.” A 2006 research paper, using the same method, estimated a total URR of 160 Gb, as shown in this plot. Another source of oil reserves, prior to nationalization of Saudi Aramco in 1980, is a report titled “Critical Factors Affecting Saudi Arabia’s Oil Decisions”, published by the US General Accounting Office in 1978. As referenced on page 72 of Twilight in the Desert, this report stated that the remaining proven reserves as at the end of 1976 was 110 Gb with 70 Gb in the four super giants of Ghawar, Safaniya, Abqaiq and Berri. Cumulative production from these four giant fields was 26 Gb and cumulative production for all Saudi Arabia was 29 Gb. Thus, total proven reserves (produced and remaining) at the end of 1976 was equal to 139 Gb (29 Gb plus 110 Gb), of which 96 Gb (26 Gb plus 70 Gb) was attributable to the four super giants and 43 Gb (3 Gb plus 40 Gb) was attributable to the rest of the fields. This figure of 139 Gb does not include probable reserves, unlike total URR, and is less than the total URR estimates of 150 Gb and 160 Gb from the two research sources above. Allowing for the inclusion of probable reserves, heavy oil reserve upgrades and only small discoveries since the last giant field Shaybah was found in 1968, an appreciation from 139 Gb to the total URR of 185 Gb appears reasonable.
As of December 2007, Aramco’s total cumulative C&C production was 113 Gb, being 61% of the URR 185 Gb. Over half of the 113 Gb has been produced from the super giant Ghawar. Abqaiq, Berri and Safaniya have also been significant producers. Aramco has increased their production during this winter to 9 mbd according to recent OPEC quota increases. Aramco has produced over half of the estimated URR and the production curve is forecast to follow a typical post peak decline curve, shown by the red line in Fig 9. Unfortunately, the new production capacities from AFK, Shaybah expansion, Nuayyim and Khurais are not enough to offset decline from existing fields. Aramco has probably scheduled Manifa last because it will produce heavy oil which is less marketable than lighter grades.

Fig 9 - Saudi Arabia Crude Oil & Lease Condensate Production to 2020 (bottom up forecast) - click to enlarge
Figs 9 and 10 have been updated for Wikipedia Oil Megaprojects.. Although Khurais is forecast to produce 1.1 mbd, Matt Simmons doubts that Khurais will produce 0.8 mbd. This report stated that the “Khurais field west of the giant Ghawar field could potentially increase Saudi production by a further 800,000 b/d” and another report made a similar statement “Another potential project, at the Khurais field, could increase Saudi production capacity by 800,000 bbl/d”. These statements indicate that the forecast production of 1.1 mbd from Khurais might be too high.
There are three forecast scenarios from 2008 to 2080, shown in Fig 10. The solid red line shows a “Do Nothing” forecast scenario. This represents a production decline rate of 8%/yr which is equivalent to ultimate recoverable reserves of 148 Gb (billion barrels). This scenario is highly unlikely but serves as a useful lower bound for the forecast production profile. The “New Peak?” dashed red line represents a scenario for which another peak is attained. However, the inset in the chart explains that another 1.75 mbd would be required from other projects and infill drilling. This is highly unlikely and predicts that a peak in 2005 has passed. The “Bottom Up” dark blue line in Fig 10 represents the most likely scenario and includes the bottom up forecast to 2020 from Fig 9, followed by an annual production decline rate of 4.5%/yr.
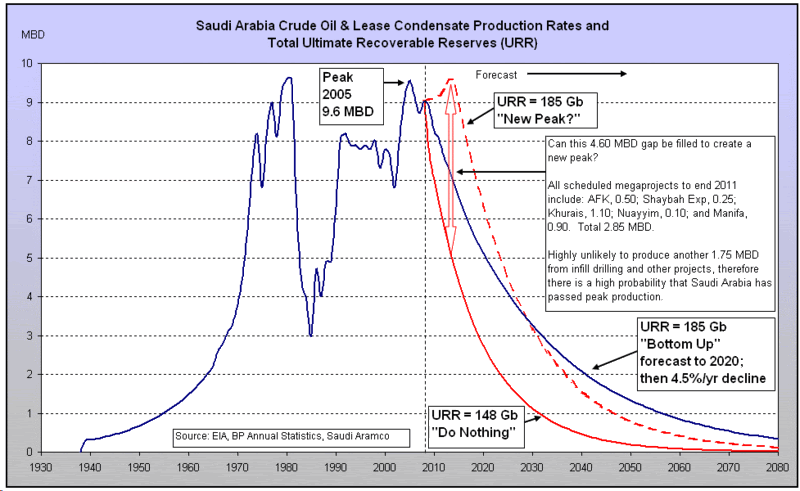
Fig 10 - Saudi Arabia Crude Oil & Lease Condensate Production to 2080 - click to enlarge
Saudi Arabia has never directly admitted that it has passed peak C&C production, but in August 2004 a former OPEC president, Purnomo Yusgiantoro, admitted that “oil prices were at crazy levels, but that OPEC was powerless to cool the market…There is no more supply”. Thus, based on Yusgiantoro’s statement, in August 2004, Saudi Arabia’s C&C production was at maximum capacity of 9.5 mbd, up by a significant 1.1 mbd from April 2004 (EIA). Furthermore, on 11 April 2006, according to this source and requoted here, Platts quoted a Saudi Aramco spokesman saying that “Saudi Aramco’s mature crude oil fields are expected to decline at a gross average rate of 8%/yr without additional maintenance and drilling” and that “This maintain potential drilling in mature fields combined with a multitude of remedial actions and the development of new fields, with long plateau lives, lowers the composite decline rate of producing fields to around 2%.” Therefore, as of April 2006, Aramco’s crude oil production was forecast by this Aramco spokesman to decline at 2%/yr which means that Saudi Arabia has passed peak crude oil production.
These three sources provide additional information about Saudi Arabia’s production decline rates. Aramco Senior Vice President Abdullah Saif admitted that “One challenge for the Saudis in achieving this objective is that their existing fields sustain 5 percent-12 percent annual "decline rates," (as reported in Petroleum Intelligence Weekly and the International Oil Daily) meaning that the country needs around 500,000-1 million bbl/d in new capacity each year just to compensate”. The Schlumberger CEO said that “the industry is dealing with a phenomenon that is exaggerated by the lack of investment over the past 18 years. This phenomenon is the decline rate for the older reservoirs that form the backbone of the world’s oil production, both in and out of OPEC. An accurate average decline rate is hard to estimate, but an overall figure of 8% is not an unreasonable assumption.” The EIA also stated that a “challenge for the Saudis in achieving their strategic vision to add production capacity is that their existing fields sustain, on average, 6 to 8 percent annual "decline rates” (as reported by Platts Oilgram) in existing fields, meaning that the country needs around 700,000 bbl/d in additional capacity each year just to compensate for natural decline.”
Saudi Arabia C&C production was 9.5 mbd in August 2004. According to the previous EIA statement, Saudi Arabia needs 0.7 mbd additional capacity each year just to compensate for natural decline. Therefore, three years later, by August 2007, additional capacity of 2.1 mbd (3*0.7 mbd) would have been required just to compensate for natural decline. Since August 2004 there was a total capacity addition of only 1.1 mbd from these two projects as stated by Saudi Aramco’s Press Kit on their website. In late 2004, Qatif (including Abu Safah) began operations with production capacity of 0.8 mbd and in early 2006, 0.3 mbd capacity from Haradh III, 0.3 mbd (Fig 9), which leaves a shortfall of 1.0 mbd. This implies that Saudi production in August 2007 is 8.5 mbd, 1.0 mbd less than the 9.5 mbd production in August 2004, excluding capacity additions from infill drilling. Accordingly, this number of 8.5 mbd is slightly less than the number of 8.6 mbd for July 2007, from the EIA Short Term Energy Outlook, Table 3a, 7 August 2007. Based on the quotes and statements in this and the previous two paragraphs, it is highly unlikely that capacity additions from new projects, including infill drilling, are sufficient to compensate for existing production decline, and consequently the “Bottom Up” scenario in Fig 10 remains the most likely scenario.
![]()
6. Kuwait Crude Oil & Lease Condensate Production
It is assumed that Kuwait will produce their fields while maintaining the annual depletion rate below 4.5% which is slightly higher than its peak depletion rate of 4.1% on Oct 2006. The URR of Kuwait, including its share of the Neutral Zone, is assumed to be 60 Gb. This is based partly on Colin Campbell’s August 2007 newsletter which states that the balance of evidence points to a total URR of 53 Gb for Kuwait only (excluding the Neutral Zone - NZ). Adding in 6 Gb for half the Neutral Zone and rounding up gives a total URR of 60 Gb. This research estimates Kuwait URR to be 75 Gb, but if the most recent data point is treated as an outlier then the URR could drop to about 65 Gb. Furthermore, in January 2006, this surprise downgrade of remaining proven reserves to only 24 Gb, 25% of the BP Annual Statistics official figures of 99 Gb, with 15 Gb in its biggest field Burgan, adds further support to a URR of 60 Gb. The accompanying reserves data table shows the total produced and remaining proven reserves to be 60.2 Gb, including the NZ. This figure may indicate that the above URR might be too low, but given the insignificant new scheduled production capacity by KOC (Fig 11), the URR of 60 Gb will be assumed for forecasting the production rates.
As of December 2007, Kuwait’s total cumulative C&C production was 38 Gb, being 63% of the URR 60 Gb. Over half of the 60 Gb has been produced from the super giant Burgan. It is assumed that Kuwait will increase their production during this winter according to recent OPEC quota increases. Kuwait has produced over half of the estimated URR and the production curve is forecast to follow a typical post peak decline curve, shown by the red line in Fig 11. Unfortunately, the insignificant new scheduled production capacities from Project Kuwait Phase 1 and Sabriya GC-24 are not enough to offset decline from existing fields.

Fig 11 - Kuwait Crude Oil & Lease Condensate Production to 2020 (bottom up forecast) - click to enlarge
There are only two new projects shown in Fig 11, Project Kuwait Phase 1 and Sabriya GC-24, according to Wikipedia Oil Megaprojects. Project Kuwait, costing $US8.5 billion, which has been discussed in Kuwaiti parliament for ten years has still not been officially approved as of February 5, 2008. This extensive delay probably means that Project Kuwait’s key assets are difficult reservoirs similar to heavy oil which will comprise a large part of Kuwait’s future oil production.
The unsubstantiated production targets of the Kuwait Oil Company (KOC) are partly explained in their publication, The Kuwaiti Digest, on KOC’s website. The Jan-Mar 2006 issue stated that the KOC’s production target is 4 mbd, up 1.5 mbd from their current 2.5 mbd production at that time. However, the only significant project mentioned is the $US8.5 billion Project Kuwait which aims to raise production by only 0.37 mbd, over a 20 year period, which is small relative to the required 1.5 mbd increase. The Jul-Sep 2007 issue stated that “There may be surprises for our general readers – that we cannot reach our 4 million barrels per day strategy for 2020 without unlocking the potential partnerships of International Oil Companies (IOC).” In other words, the KOC is struggling to increase their output without assistance from the IOCs. However, even if an agreement can be made with the IOCs to start Project Kuwait and identify other projects, the time to first oil could be several years which means that decline rate in Fig 11 may only be a little less than forecast and that the minor peak of 2006 would not be exceeded.
There are three forecast scenarios shown below. The solid red line shows a “Do Nothing” forecast representing an equivalent URR of 53 Gb, which serves as a lower bound. The “New Peak?” dashed red line represents a scenario for which another minor peak is attained. However, the inset in the chart explains that at least another 0.49 mbd would be required from other projects and infill drilling. This is highly unlikely and predicts that a minor peak in 2006 has passed. The “Bottom Up” dark blue line in Fig 12 represents the most likely scenario and includes the bottom up forecast to 2020 from Fig 11, followed by an annual production decline rate of 4.5%/yr.
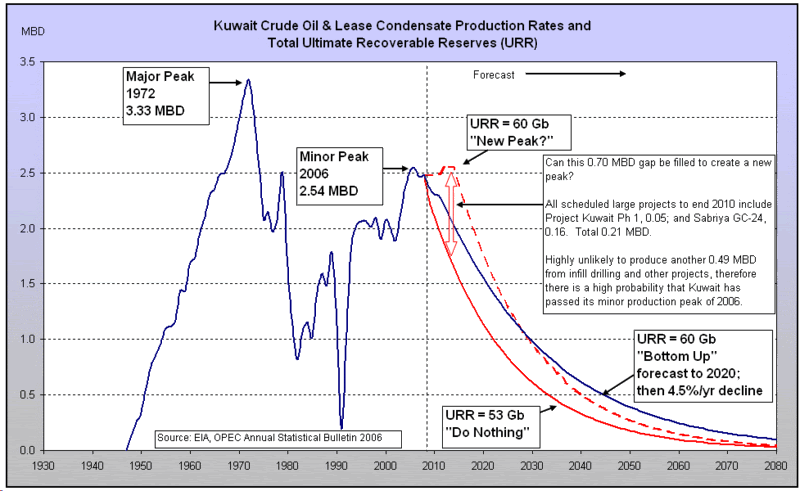
Fig 12 - Kuwait Crude Oil & Lease Condensate Production to 2080 - click to enlarge
Like Saudi Arabia, Kuwait has never directly admitted that it has passed peak C&C production. However, in November 2005, the Kuwait Oil Company admitted that Burgan, Kuwait’s biggest field and the world’s second largest, had passed peak. This admission is further supported by EIA data showing that Kuwait C&C production fell off a 2.6 mbd peak plateau in February 2006. As Burgan is Kuwait’s largest field, comprising at least 60% of the total URR, the Kuwait Oil Company admission provides strong evidence for Kuwait having passed its minor peak C&C production in 2006.
![]()
7. UAE Crude Oil & Lease Condensate Production
It is assumed that UAE will produce their fields while maintaining the annual depletion rate below 5.0% which is the same as its peak depletion rate of 5.0% on Oct 2007. The URR of UAE is assumed to be 45 Gb which is between the two following estimates. This chart predicts that the total URR is just over 43 Gb. Page 49 of this MIT source from August 1977 stated that the URR of Abu Dhabi, which holds almost all the oil of the UAE, was 49 Gb.
As of December 2007, UAE’s total cumulative C&C production was 26 Gb, being 57% of the URR 45 Gb. The drop in November 2007 was due to previously scheduled maintenance. UAE has produced over half of the assumed URR and the production curve is forecast to follow a typical post peak decline curve, shown by the red line in Fig 13. Unfortunately, the new scheduled production capacities do not start until 2009 and are not enough to offset decline from existing fields.
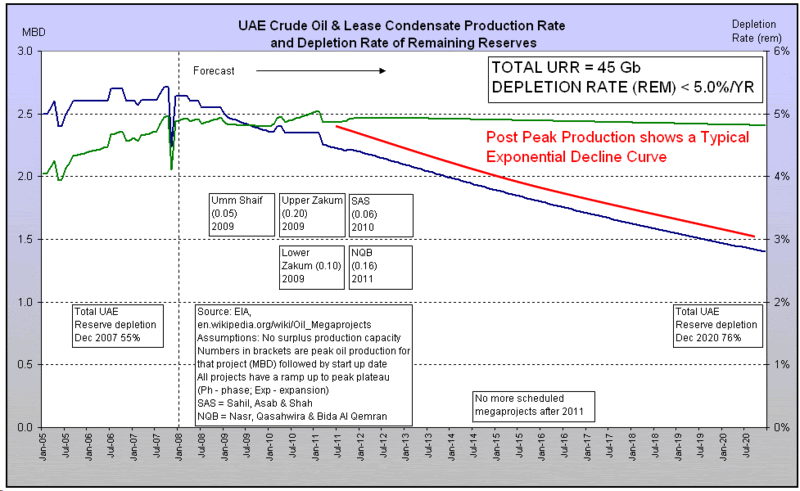
Fig 13 - UAE Crude Oil & Lease Condensate Production to 2020 (bottom up forecast) - click to enlarge
There are three forecast scenarios shown below. The solid red line shows a “Do Nothing” forecast representing an equivalent URR of 40 Gb, which serves as a lower bound. The “New Peak?” dashed red line represents a scenario for which another peak is attained. However, the inset in the chart explains that at least another 0.23 mbd would be required from other projects and infill drilling. This is highly unlikely and predicts that the peak in 2006 has passed. The “Bottom Up” dark blue line in Fig 14 represents the most likely scenario and includes the bottom up forecast to 2020 from Fig 13, followed by an annual production decline rate of 5.0%/yr.

Fig 14 - UAE Crude Oil & Lease Condensate Production to 2080 - click to enlarge
Also like Saudi Arabia, UAE has never directly admitted that it has passed peak C&C production. The scheduled maintenance in November 2007, reducing production by 0.6 mbd, may only serve to ensure that production remains at just over 2.5 mbd for 2008, as there has been no disclosure by UAE about the impact of this maintenance on future production rates. As UAE does not have any projects scheduled until 2009, it is likely that UAE has passed its peak in 2006.
![]()
8. Other Components of Total Liquids Production
Natural gas plant liquids show an increase in production due to OPEC projects from Saudi Arabia, Algeria, Iran and Qatar. Saudi Aramco’s most recent project schedule, released in June 2007, shows two significant NGPL projects to be completed by the middle of 2008: Hawiyah at 318,000 barrels/day and Khursaniyah at 290,000 barrels/day.
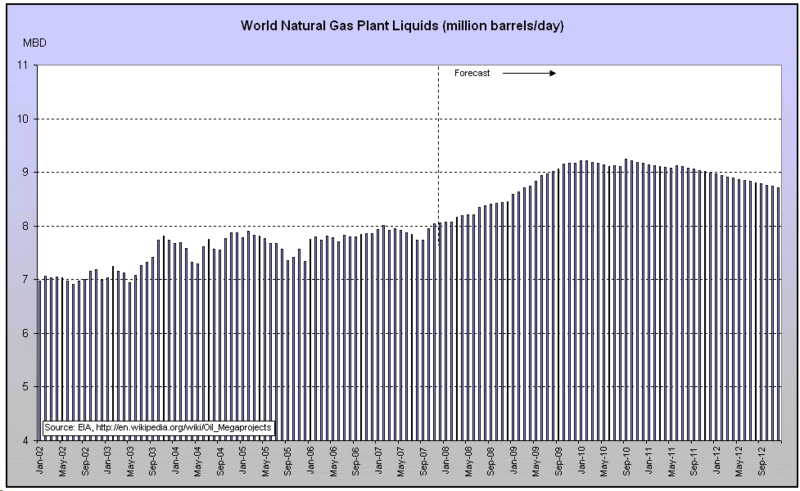
Fig 15 - World Natural Gas Plant Liquids Production to 2012 (bottom up forecast) - click to enlarge
Ethanol and XTL (BTL, CTL and GTL) production is forecast to almost double by 2012. Unfortunately, the increased production of government subsidised corn based ethanol in the USA is increasing the prices of many other food products.
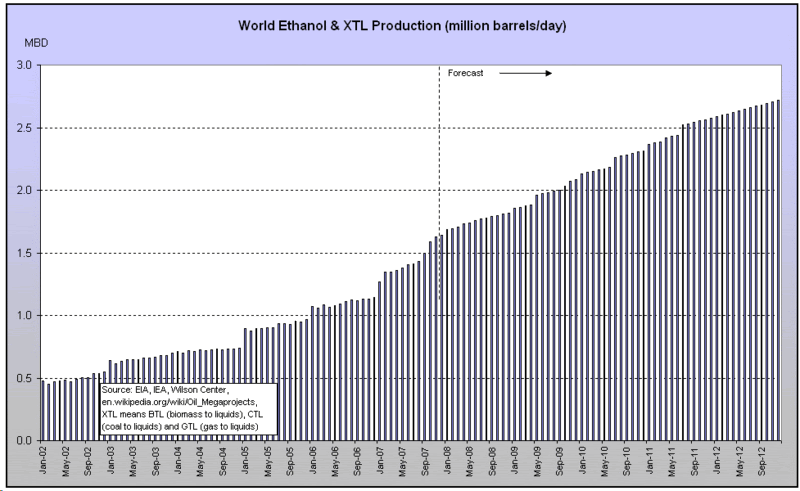
Fig 16 - World Ethanol & XTL Production to 2012 (bottom up forecast) - click to enlarge
Processing gains are defined by the EIA as “The volumetric amount by which total output is greater than input for a given period of time. This difference is due to the processing of crude oil into products which, in total, have a lower specific gravity than the crude oil processed.” These gains are forecast to decline slowly based on the decline in C&C (Fig 3).
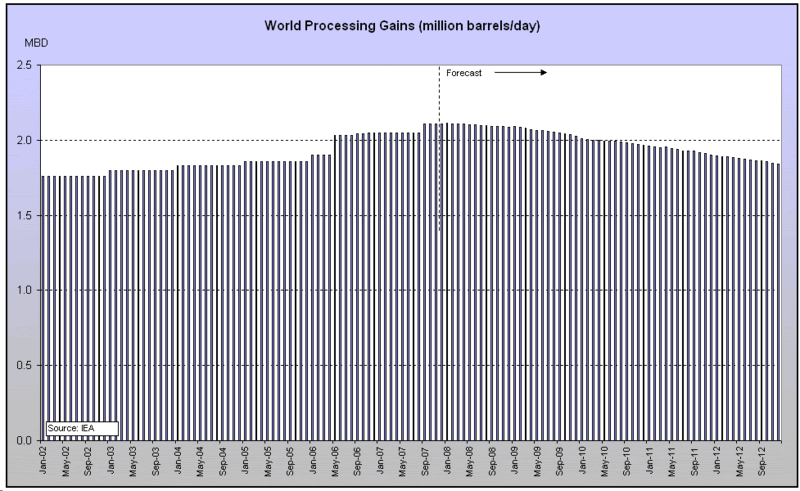
Fig 17 - World Processing Gains to 2012 (bottom up forecast) - click to enlarge
![]()
9. Additional Information Sources
For more forecasts please refer to this article by Khebab, Peak Oil Update - December 2007: Production Forecasts and EIA Oil Production Numbers and to Peak Oil Media Redux by Prof Goose, including this lecture by Dr. Albert Bartlett.
![]()
Further articles about Saudi Arabia, Kuwait and UAE:
by Stuart Staniford
- Satellite O'er the Desert
- Saudi Arabia and Gas Prices
- Depletion Levels in Ghawar
- The Status of North Ghawar
- Further Saudi Arabia Discussions
- Water in the Gas Tank
- A Nosedive Toward the Desert
- Saudi Arabian oil declines 8% in 2006
- What would we have predicted for Kuwait?
by Euan Mearns
- Ghawar reserves update and revisions (1)
- GHAWAR: an estimate of remaining oil reserves and production decline (Part 2 - results)
- GHAWAR: an estimate of remaining oil reserves and production decline (Part 1 - background and methodology)
- Saudi production laid bare
- Saudi Arabia and that $1000 bet
- IHS Data Suggest Kuwaiti and Global Proved Oil Reserves Significantly Lower Than BP Estimates
by Gail the Actuary
by Jerome a Paris
by Heading Out
- Another look at the Kingdom of Saudi Arabia
- Simple mathematics - The Saudi reserves, GOSPs and water injection
- Of Oil Supply trains and a thought on Ain Dar
by Khebab
- Saudi Arabia: An Attempt to Link Oil Discoveries, Proven Reserves and Production Data
- The Hubbert Linearization Applied on Ghawar
- An Attempt to Apply The Parabolic Fractal Law to Saudi Arabia
by Ace
World Oil Forecasts Including Saudi Arabia, Kuwait and the UAE - Update Feb 2008
PDF version
172 comments
World Oil Forecasts Including Saudi Arabia, Kuwait and the UAE - Update Feb 2008
PDF version
172 comments
Contact
- Content: editors at theoildrum dot com
- Tech support: support at theoildrum dot com
License

This work is licensed under a Creative Commons Attribution-Share Alike 3.0 United States License.
Ace, your price forecasts have been pretty much spot on lately, congrats on some good calls.
From what I can tell, it looks like you are not looking for oil to break out much over $100 until around this time next year, right?
Tapis and Bonny Light are both back above $100 today!
One argument: I am missing IRAQ. It is said, their reserves are quite substantial, 2nd after KSA.
A projected output of 6mbd within the next 6 years seems reasonable.
Of course, given the mess Iraq is in and the likelihood of an eventual US pullout, a projected output of 0mbd within the next 6 years also seems reasonable.
IRAQ
"An Ultimate Recovery of 140 Gb could deliver a theoretical peak of 5 Mb/d around 2040, given that operations were stepped up to the maximum level possible, which is hardly likely, given the political situation. A lower Ultimate Recovery of 100 Gb would deliver a corresponding of 4 Mb/d around 2030."
http://www.aspo-global.org/index.php?option=com_content&task=view&id=55&...
Iraq's reserves may be substantial but real projects must be completed to change reserves into production.
Given Iraq's current unstable petroleum legislation and general problems, it would be completely unreasonable that Iraq would produce 6 mbd within 6 years.
If all of these projects listed here
http://en.wikipedia.org/wiki/Oil_Megaprojects
were actually completed this would give an additional 2.0 mbd production. When added to current production of 2.3 mbd this gives 4.3 mbd. However, I think that given project delays, existing production declines and Iraq's current state, Iraq will probably produce about 3 mbd in 6 years.
Euro - "One argument: I am missing Iraq."
What I think a lot of the bloggers (as well as industry pundits) overlook is the political framework that Oil exporting nations and oil importers are up against. The supply / demand arguments don't explain how America is going to get around the fact that
A. 95% of the worlds oil reserves are nationalized.
B. a large percentage of those oil exporting nations don't like America.
C. Oil is the new weapon of the 21st century
We may never get to record historically whether we have in fact reached the peak of finite oil production because the energy wars that are already raging will obfuscate whether we have reached peak or not.
This competition: Peakers vs. Optimists, has reached the stage of being irrational.
In the meantime the U.S., the world's biggest importer of oil, is failing miserably in coming up with viable energy policies. Ethanol, Solar, Wind, Nuclear, Efficiency, Clean coal...the wish list seems to go on and on.
What the energy literate that pay attention to this site can agree on is oil is never going to be replaced. It is imperative that the West start now to create an economy that is far less energy intensive.
My question is: What can Peak Oilers do to move the debate to the mainstream public? How can we make this most vital issue relevant to more than a few scholars?
As I re-read my own words I realize how nieve this sounds. People having frank intelligent discussions and implementing selfless solutions to intractable problems: Imagine that!
It wouldn't surprise me if light sweet crudes such as Tapis, Minas, WTI temporarily reach $150 price spikes late this year.
The oil price which is displayed by the green line in Fig 1 above is a weighted average price of many different types of crude oil, from heavy sour to light sweet, source from this EIA spreadsheet as "All Countries Spot Price FOB Weighted by Estimated Export Volume (Dollars per Barrel)"
http://tonto.eia.doe.gov/dnav/pet/xls/pet_pri_wco_k_w.xls
In Jan 11, 2008, this weighted price reached $US93 when Tapis was much higher at $101.
Black Friday
March 7 2008 11:30 am ( NY time )
BOOM
$500 you're wrong?
Obviously, no arguments from me. Very good work.
Texas production around its peak and recent Saudi C+C production (estimated for 2007):
(A note for Bob Cousins. If you plan another drive by ad hominem attack on Khebab and me, could you please explain how any aspect of this graph is misleading? For original graph, see the following article.)
Texas and the Lower 48 as a Model for Saudi Arabia and the World (2006)
http://www.energybulletin.net/16459.html
Overall, this is always a very impressive body of work. However, at the risk of opening up a can of worms, I want to get into Saudi. As everyone here knows, I think the analyses of Saudi by a number of posters here has been off the mark. Heck, let's not mince words. It has been off the mark.
Recall the forecast that you made just last April:
http://www.theoildrum.com/node/2429
I was arguing at that time that I expected the Saudi declines to stop by summer (which they had) and to increase if demand picked up (which is what happened). In other words, I believed that Saudi was managing production, and weren't at the mercy of a terminal decline. Now, look at the prediction from that link (and some of the comments in the thread). Your forecast had Saudi production down almost to 8 million bpd at the end of 2007, when in fact it was around a million bpd higher than that. You did have production picking back up once some of those new projects came online, but so far they haven't. And if we continued to extend your line, without those new projects you would have Saudi production dropping below 8 million bpd about now.
The reason I bring this up is not to give you a hard time. I think the mark on Saudi has been missed because the entire body of evidence has not been considered. So my plea is for people to look back at those Saudi forecasts, and consider what information was missing in order to cause some of those forecasts to be off so much. By doing so, the hope is that we can improve the accuracy of these forecasts going foreward. If you ever do any computer modeling, it is always important to go back and validate the model. If the model makes wrong predictions, you need to dig around and find out why - not to continue making forecasts using the same model that went wrong before.
Now, that is my single criticism. I think the rest of the work is awesome, and contains a wealth of information.
(Apologies if you have addressed this, but I don't ever recall seeing a post on "Why the Saudi forecast was wrong.")
As you know, when Stuart did his "Nosedive" post, in the comment section he thought that the HL projection was wrong, because it suggested that the Saudi decline rate would be lower than what we were seeing at the time. To which I replied that I thought that there was a good chance that Saudi production would, at some point, rebound.
And the initial Texas decline, especially rounded off to the nearest 0.1 mbpd, was low:
1972: 3.5 mbpd
1973: 3.4
1974: 3.4
(Time for Bob Cousins to jump in and complain, with some justification, about pissing contests over who was right. However, I would argue that it is an important question as to whether the world's largest net oil exporter is post-peak).
However, I would argue that it is an important question as to whether the world's largest net oil exports is post-peak
There is no doubt that it is an important question. I don't argue about it just because I like to argue (although I do like to argue). I debate this because I want to get to the bottom of what's going on in Saudi. But to do so, we have to look back at these forecasts, and see why they were right or wrong. If we don't, we can't have a lot of faith in the next round of forecasts.
KSA definitely looks to be managing production, but it is possible that it is also at the mercy of terminal decline - especially for light sweet - the two things are not mutually exclusive.
Taking two or three months figures is not good statistical analysis - if you take a longer timescale then the trend is down. If you take their 'net exports', the bit that's important to us 'net importers', it seems to be down even more.
You'd think that KSA would try and keep exports constant or at least not let them fall. The fact that they are falling raises the suspicion that they can't stop it.
Don't overlook worldwide inventories in your analysis. This, in my opinion, is where people missed the boat on Saudi. When they started cutting production, worldwide inventories were at record highs and rising. The Saudis even noted that when the cuts started. But a lot of people completely discounted that, which is why many expected Saudi production to just keep falling. They thought Saudi was helplessly watching their production fall, when a year later it is clear that they weren't (else it would have kept falling).
I have been a believer in peak oil for many years. I have invested accordingly. But since recently I belief peak oil may be 20 years ahead. Iraq is coming! Kuwait, this tiny country is still delivering over 2.6 mbd. Then there is Kasachstan with new projects. And Brasil. Etc. Etc.
No, I won't go long any energy anymore.
"When they started cutting production, worldwide inventories were at record highs and rising."
I see you're still claiming to do know something for which you have never provided evidence. I would especially like to see your inventory records for the countries accounting for most new demand in recent years.
Maybe like IHS you have secret data.
What is it about me that always brings out at least one troll? Does it bother you so much that I was right, that you now have to resort to lying so you can feel better about what happened? I have provided evidence on numerous occasions, and you well know it. You just always claimed that somewhere in the fraction of evidence that wasn't transparent, may lie the evidence to support your wishes. That's the difference.
I actually did support my claims by pointing to known U.S. and OECD data (which comprise the majority of the world's inventories), and furthermore backed up with comments by various other countries (like China) that their inventories were high. I also showed that some other countries in OPEC were saying much the same thing that Saudi was saying about inventories. Those things are evidence. It is people like you who didn't support your claims. Whereas I used available data to create graphs and support my point, you appealed to undiscovered evidence and said Saudi was lying.
And in the end, Saudi production did what I said it would, further strengthening the evidence that I had it right. Yet you want to continue to hang on to your fantasy that Saudi was in terminal decline, and yet they magically arrested it without bringing on any major new projects. Have you ever come up with an explanation for that? How, if they were in terminal decline, those declines flatlined until late in the year when they increased just as OECD inventories were coming down(without the benefit of a major project)?
Now, if you wish to come off as a trollforoil, you have done yourself well. If you were actually trying to have a debate, you failed miserably, just as you did the last time you kept making these claims. You do yourself no favors by continuing this line of wishful thinking, when it is now clear in hindsight that you were wrong.
Sticks 'n stones may break my bones, etc.
Hearsay does not evidence make. Your inventory explanation is unsupported by data for the markets driving the price.
It is possible in my mind that KSA is managing its production. If so, the most reasonable explanation is that it is doing so because it knows that its oil is worth more in the ground, as sure a sign of peak oil as one might wish for. Peak oil was always going to be an economic event occurring over a period of time, that is the nature of rising entropy. The entropy law is as Georgescu-Roegen argues, with insight you demonstrably could only hope for, the most economic of all the universal physical laws. Those who used HL to determine the Saudi peak have most probably benefitted from the ability of this technique to approximate the economic process at work in the context of declining energy quality, constrained quantity and an expansionary financial system. I am not surprised that the most intuitive thinkers on this blog recognize not only the predictive strength of HL, but are quick to recognize the multi-dimensional nature of peak oil: peak net energy, peak net exports, hoarding, peak production of oil of quality a,b,c,..., etc. They all arise from a deterioration in resource quality, including critical factors such as reservoir pressure.
I can only guess, but I think you were so blinded by your attempt to coin a memorable phrase, 'peak lite', that you have missed the big picture. I suppose this sore fact mixed with a socially competitive trait might underlie your childish, and abusive, namecalling.
ATTENTION OTTAWA SKATERS:
It might be past 3 am here, but I'm off to put another coat of water on the rink. This week has all the preconditions for peak ice quality, so a little extra effort is warranted. Anybody in Ottawa who likes shinny is invited to the rink in Plouffe Park (Preston and Somerset, behind the Plant Bath). The mercury is plummeting; the ice is going to be hard and fast today.
Your inventory explanation is unsupported by data for the markets driving the price.
Good Lord, man! The inventory explanation is directly supported by.....inventories! You know, those things that people like you think are important when they are falling, but not so significant when they are rising. But look back at your history. 2006 was the year of the big Saudi cuts. 2006 prices ended the year just about where they started the year. That was also noted in my previous arguments. But if you want to think I was lucky in calling Saudi correctly, more power to you.
It is possible in my mind that KSA is managing its production.
Now we are getting somewhere. You say it is possible. So let's explore the other side. If they aren't, why did their production flat-line, given that all fields will be depleting? And how did they manage to raise production in Q4, if in fact they aren't managing production.
I am not surprised that the most intuitive thinkers on this blog recognize not only the predictive strength of HL
Do you consider Stuart an intuitive thinker? Ask him whether he thinks the HL is predictive. I have personally lost count of how many times I have shown failure in the HL to display predictive ability.
I suppose this sore fact mixed with a socially competitive trait might underlie your childish, and abusive, namecalling.
What big picture did I miss? Did Saudi production behave contrary to what I predicted? Has pressure on prices remained strong (in my opinion, due to supply/demand tightening)? Are biofuels turning out to be a fiasco? I don't intend to keep arguing with someone who simply ignores their past faulty predictions, and insists that somehow I missed the big picture, even though my predictions were accurate. I mean, what is your problem? Seriously?
Namecalling? Buddy, you have taken a number of unsolicited digs at me. You have never been able to just calmly discuss the evidence without taking potshots. Look at the potshots in your first reply above. Don't cry about namecalling if you set the tone for it.
And you know what a troll is, right? It is someone who posts something just to get a response. Given that we now have history to back up my predictions, saying that I never posted evidence is trolling. And if the name fits....
Robert's position is partially supported by available data on OECD stocks.
However the OECD is only part of the picture. But I am not aware of any location to review the BRIC nations' inventory levels, nor that of the remaining non-OECD nations. Saying that the world was well supplied only is valid if you argue that the OECD is the world, which is not true.
Robert, you have provided data similar to what I've linked about OECD nations but do you have sources for non-OECD nations? I honestly have to say that I do not recall you ever showing complete data about the world as a whole, but only the OECD nations instead. That is a very persuasive case, given that the OECD is the largest consumer of fossil fuels but it's clearly not the complete case.
Ref: 2005 article by Matthew Simmons
Now the above article doesn't cover the last two years obviously but it supports my question by demonstrating that growth of demand in non-OECD nations was larger than in OECD nations. Thus the question of non-OECD stocks appears to be rather important because over the last decade and a half, growth in non-OECD demand, both as a percentage basis and in absolute barrels, has exceeded OECD demand. Therefore, non-OECD inventories become critical to the question of price.
Please do not take this as sniping or trolling, Robert. What I am attempting to do is demonstrate a potential flaw in your overall argument that I have never seen you answer. You have eloquently answered the OECD question and proven your point about OECD inventories. If you have written about non-OECD reserves and can prove the same point there, then you have truly fully made your case. If you have not, then the non-OECD inventory situation remains as a large question mark about your hypothesis.
Thus I ask - can you provide a URL where you have written about non-OECD inventories? And if you have not, can you find such information to support your argument? I have looked and not found that information myself specifically but there is a vast sea of data out there to comb through.
Please do not take this as sniping or trolling, Robert.
No, no, no. That is not what I consider sniping or trolling at all. That is asking me for evidence or to clarify some issues. Trolling is claiming that I didn't provide data, and then making wise cracks. That goes way back with toilforoil. Every time he engages me, he likes to misrepresent my position, make wise cracks, and/or just generally insult me. At some point I obviously got under his skin, and he has never gotten over it. His favorite tactic is the "you think you are so important, but you are really nobody" line.
Now, on to what you asked for. When I was making that argument, I did rely on OECD inventories, because that's all we have. But, I also pulled up some news items from China and South Korea, other major crude users, that indicated they were running high on inventories as well. It still isn't a complete picture, but it's a strong indicator of world crude inventories.
But you can never have a complete picture. However, think about it. OECD inventories rising means the OECD is buying more crude than they need. Fact. If they are very high and rising, one thing is certain: They are going to either have to start running a lot more crude through their refineries, slow down on their purchases, or have their purchases cut for them by their supplier cutting supplies to prevent prices from falling. That was what I argued was happening, and based on what happened with Saudi production after that, appears to be what actually did happen.
Now, we can always argue that the non-OECD countries really picked up their purchases as the OECD purchases slowed down. The only problem is, we have no evidence for that. That is an appeal to the unknown; that perhaps hidden data still means you are right. I built a case from the data publicly available. And over the time period you cited for fast non-OECD growth, we know that world oil supply grew rapidly to meet the demand. We also know that it has been flat for a couple of years now, and I would expect (and there is much anecdotal evidence to support) that many non-OECD countries have been having difficult affording oil lately.
Also, consider the alarm that people react with around here when OECD inventories are low and falling. If we can casually dismiss high and rising OECD inventories because of what might or might not be going on in non-OECD countries, why should we worry about low inventories? After all, we can always go back to that same hidden evidence and use exactly the same arguments that toilforoil is using: We don't know the whole story, because we don't have 100% inventory data.
I agree that the facts have better supported your hypothesis than that of the catastrophic decline hypothesis. However, the analysis here of KSA still indicated potential for problems soon, if not immediately. Countering that was clear evidence shown by you, Euan, and others that ARAMCO has managed their fields about as well as anyone anywhere has ever managed large fields. But good management in the past is no guarantor of future behavior.
My own suspicion, based on evidence such as Epcon signing that huge deal with Aramco to help with higher water cut problems, is more middle of the road and is that ARAMCO is not yet in catastrophic decline but that they also are not going to be able to grow production in any meaningful way above 9.6 mbpd again for any long period of time. I also worry, precisely because of those contracts such as Epcon's, that Ghawar may be "managed to death" and suffer from serious water cut problems in the near future.
Ace's current forecast about KSA seems (to me) to really lean more in Euan's direction now than towards any other single TOD contributor. Euan expected a few more years of healthy production but then he too expected a serious decline. He differed with Stuart mostly in how soon that decline would come.
Given that KSA has made repeated promises to expand production since 2004 and has never once yet met those promises, it certainly seems to me that KSA is in the same boat as Stuart's XOM article painted for XOM - declines are eating up assumed new increases and internal corporate methodology has not yet adapted to higher decline rates. If KSA is fighting the water cut monster and the decline beast hard right now, any significant increase from KSA certainly seems completely out of the question and declines in production over the next 5-10 years seem far more reasonable.
Of particular concern to me is this Epcon press release claiming 75%-90% water cuts in KSA for some fields. That is far higher than I have ever heard ARAMCO admit yet here we have a business deal between ARAMCO and one of the world's engineering firms that specializes in water cut issues for oil fields.
Robert, KSA may not yet be in catastrophic decline but there remains a host of evidence that they are relatively close to facing serious problems. I agree that you were right for the 2006-2007 time period but what is your feeling looking forward 10 years at KSA? Do you feel KSA can significantly grow production still or are they becoming the red queen, running faster and faster just to stay in place?
I agree that you were right for the 2006-2007 time period but what is your feeling looking forward 10 years at KSA?
That's the million dollar question. I based my previous predictions on Saudi based on what they were doing, what inventories were doing, what they were saying, and what prices were doing at that time. There is nothing there that helps me forecast where they will be in 10 years. I have tried, by going back and looking at what their reserves were before they closed the books on them. My conclusion was that they were in better shape than most people here think (and I know that Stuart now thinks this as well). But do I think they could crank production to 12 mbpd for several years? No.
Using oil storage by itself as some sort of indicator of the overall worlds oil supply is in my opinion not exactly a good idea. At best supply vs price ratio is better. Then of course we have to correct this against a currency basket to minimize the exchange rate effect. Next the level of oil inventories is simply related to the level that refineries are operating at.
I've never understood why people think OECD supplies are a leading indicator of peak oil by the time the OECD countries have problems procuring oil we will be well past peak. At the earliest real supply issue are 1-2 years off.
And it makes sense that before we see this we will see a much stronger and more volatile price signal as more people have to go to the spot market to procure crude.
About the only thing that has me concerned right now is I expected oil prices to drop back to the 70-80 dollar range by now. The fact they have not is perplexing. But back to what signal to look for I'd say that until we see a strong price rally say +30-50 dollars over a fairly short time three months or so. Right now absolute levels of OECD inventories are operating under strained but normal market conditions.
Most people use the $200 a barrel price point as the indicator that shortages are influencing the market. Only at this point does inventory becomes a good indicator of the worlds oil supply.
Using oil storage by itself as some sort of indicator of the overall worlds oil supply is in my opinion not exactly a good idea.
And of course that isn't what I did. It was based on the fact that inventories were high AND rising. If inventories had been high and flat, then they are buying the amount of oil they need, and just carrying extra inventories. If inventories are rising, they are eventually going to cut back. I think Saudi reacted first and cut them back.
At best supply vs price ratio is better.
And as I pointed out, in 2006 when they made their biggest cuts, the price for their crude at the end of the year about almost the same ($2 higher, I think) than it was at the beginning of the year. That was a further indication that their cuts were what the market was asking for (and I was making this argument in 2006). I think they ultimately overdid the cuts, but I think they also have gotten accustomed to the revenues from those high prices.
Sorry Robert should have made this clearer I actually agree with your analysis in general but we probably disagree some on the interpretation of the data.
So I don't think your wrong in your supporting data or conclusion.
Alternatives are also generally equally viable. The problem is insufficient data so at least for now no amount of logic is going to make the real situation in KSA clear.
I'm just saying that in general I see a lot of people read way too much into OECD storage. And this includes professional oil traders.
Again by the time OECD inventories become problematic because of peak oil we will have already had serious problems. I might add KSA plays this inventory game as much as anyone else for their own benefit. If you include growth in the equation then OECD inventories are not far off from a just in time supply levels and have been that way for a while. I think in general your talking a 22 day supply.
However I am concerned about gasoline imports in the US. These are much more sensitive and in my opinion the US will see serious problems with gasoline imports well before crude becomes a issue. Thats the one number I watch like a hawk. We could easily see gasoline imports into the US drop off rapidly as the world oil supply tightens.
I have made the point that for the markets moving the price up the demand schedule you have no data on inventories. All your bluster does not change this point.
If I was your personal troll, you could expect me to respond to your other posts, yet I mostly do not, because for the most part you make well supported arguments. You often post on ethanol. I only posted once or twice, my memory fades, in response to your comments on the ethanol question and that was quite some time back. At that time, I pointed out an error in remarks you made concerning sugarcane based ethanol. I believed I linked to Milton Maciel then for your benefit and the benefit of others on this blog. Your position, either because of my response or because someone else led you to Milton's work, evolved beneficially.
Now, if you would think about the information which you do not have regarding inventories, then you would realize that the limited data, which all of us can access, is insufficient to make 'inventories' an indicator of any value. We can confidently infer its insufficiency with the quickest glance at the prevailing dynamic in the world economy, as well as at the prevailing dynamic in the oil markets, for the period being considered.
Sometimes I'm not in the mood to turn the other cheek. Such is the case when I see someone who is analytical, who is skilled in numbers, and so forth, but who continues to insult my intelligence through the stubborn repetition of poorly supported claims. As you know from our previous discussion on the matter of inventories, I searched widely for data which might substantiate your claims. I found naught. Nor did you ever provide a single suggestion as to where such information could be found. In truth, I don't believe that you have secret information (and frankly I don't believe that IHS has any of any significance either).
Even though your first comment in this thread regarding inventories was annoying, I don't think my posted response degenerated into snide comments. Perhaps the phrase about IHS was going too far, but I wouldn't qualify it as snide. Maybe that's because I kill kittens for sport. The degeneration occurred after you decided, like Dick Cheney throwing around comments about terrorists, to call me a troll. How is your behaviour better than that of those people who decided that your affiliation with an oil major made you a tout.
I think the "t" words should be used with more care. I also think you need another argument with which to make the case for managed production in KSA, and I tried to provide you one.
I want to add that it is perfectly conceivable to me that others who argue that KSA is going all out with the production of refinable product may be right. Unsurprisingly, if this is the case, it too would be consistent with Georgescu-Roegen's analysis of the economic process.
In my opinion, when future historians describe peak oil, they will say it began around 2000 of the common era, and they will provide a range of historical events mostly with imprecise dates. It is likely they will have some monthly and yearly data already known to us revealing particular tipping points in their citations.
Someone in the future may even create a way to construct an inventory model, based on other known knowns, which arguably approximates the missing inventory data for those countries accounting for the overwhelming proportion of new consumption. This model may serve historians wishing to account for producer behaviour in the period concerning us. For the moment, we have only wind.
The degeneration occurred after you decided, like Dick Cheney throwing around comments about terrorists, to call me a troll.
Yeah, that's the explanation my kids always use: The trouble started when he hit me back.
I want to add that it is perfectly conceivable to me that others who argue that KSA is going all out with the production of refinable product may be right.
So then their fields aren't declining? Because if they are going all out, and their fields are declining, each month production should drop. That's how you know they aren't going all out.
As for the Maciel comment, that's the second time you have said that, but I don't believe I ever came out against Brazilian ethanol. Early on, I said I wasn't sure. When I investigated (and Milton and I have discussed ethanol via e-mail) I wrote up something positive on Brazilian ethanol. Feel free to show where you corrected me by posting the link. Other than that, we are done.
You have made a claim, which boils down to "Information on the inventory levels and changes for the majority of the world's oil users equates to no data." OK. I think most would disagree.
Woke up early, and decided to check out your claim. After all, I am all about correcting misinformation, and I certainly didn't remember it that way. But since you have now made this claim twice, I figured I better get to the bottom of it before the 3rd time rolls around and you once again claim that I didn't know what I was talking about until you set me straight. So let's review. Twice you have made this Maciel claim. Above, and also here:
http://www.theoildrum.com/story/2006/12/8/223354/987#417
(There's one of the "you’re a nobody" digs from toilforoil that I mentioned earlier: "WT has done a great deal to further our knowledge, while you, because of confusion, lack of imagination, etc. only flail about"). Now, here is the actual exchange:
http://www.theoildrum.com/story/2006/8/20/91034/9282#81
Me, in direct response to that:
Now, here is your response, which seems to have morphed in your mind over time:
That was the "error", and my subsequent "grasping" of Maciel's case. I made a comment "Brazilian sugarcane has a big advantage, but it would seem to me…UNLESS." Where I come from, we don't call this an error. And my "position" at that point was a non-position, which is clear from reading my comments. I guess that's not the way you remembered it? I suggest you review before again claiming that my biofuel writings became worth reading once you "corrected" me on Maciel.
Robert,
The crux of the matter is that OPEC is not able to increase production
enough to make oil cheap again. Remember that as late as 2004 their stated goal was to keep oil in a price band between $22-$28. Back then $35/barrel was seen as a catastrophe for the global economy :-)
Also, remember that last September OPEC declared that if the price stays above $80 for more than 2 weeks they will increase production and bring the price down. $80 was the ceiling back then; now it looks like $85 is the floor for the price of oil.
I think all the evidence indicates that OPEC is not able to make a large enough increase in production to bring the price down. So KSA may not be in a terminal decline yet; but neither do they have significant spare capacity.
The crux of the matter is that OPEC is not able to increase production enough to make oil cheap again.
Can't, or have they just gotten greedy? For a long time, we have had Venezuela and Iran both saying $100 oil is good.
Back then $35/barrel was seen as a catastrophe for the global economy
And when they saw it wasn't? What would you do, as a businessman? You want to charge the highest price the market will bear. I expect that price band to continue moving up until it is clearly hurting the world economy (which I think we are there now, but I also don't think some members of OPEC care).
It's also worth noting that, when you look at the weekly price data, the Saudi cuts in 06/07 were never done while prices were rising. Prices were, in every case, falling either immediately before or immediately after their cuts.
When I looked at the production quota changes in 2006, I found:
That's a pattern I'd expect to see from someone producing what they want to, not what they are able to. YMMV, though.
Following are the percentage rate of change numbers for Saudi Arabia for 2006 and my estimates for 2007 (estimate made in 9/07). I assumed a fourth quarter increase in production.
Saudi Total Liquids production in 2005 was 11.1 mbpd (EIA). I estimate that if they wanted, and were able, in 2008 to match their 2005 net export level, they would have to kick up production to about 11.7 mbpd.
KSA like the US has invested heavily in advanced extraction methods. I'd argue that they may well have the most advanced wells on the planet.
Incorporating increases in extraction ability over time result in a asymetric production profile generally with a fairly long plateau followed by steep declines.
Couple this with the fact KSA is also managing production and you get a fairly strange scenario they have increases production capacity and actual production against what may be a much lower resource base then most people estimate but on the other hand they are managing the production to ensure they maximize profit over the next few decades.
Given the above we can expect Saudi production to stair step down over the coming years as they continue to maintain a spare capacity cushion agianst a lower overall production capacity.
Given the above your probably not going to be able to discern the real reserves until they pass one or two more pullbacks as their spare capacity cushion is eaten up by depletion.
I expect that if they are actually following the above we will see another big drop in production by 2009 at the latest. This could still be offset by increased production of the poorest quality oils.
If KSA has the reserves they claim to have why do they use such advanced extraction methods?
If KSA has the reserves they claim to have why do they use such advanced extraction methods?
If you are already producing a field, and the economics support advanced extraction methods, why would you not use them? Unless there was just a huge economic advantage from packing up and moving on to another field, it seems that it would make sense to use every weapon at your disposal - provided the payback is acceptable.
My understanding from reading about extraction in the US is that the move to advanced methods becomes a issue near the end of a fields life. Otherwise most people opt for the cheaper vertical wells. And if they are idling so much production to provide spare capacity why not slow production at these old tired fields instead of using increasingly advanced extraction methods ?
The problem I have is if you assume that everything they have said is the truth then using advanced wells now does not seem to make sense. This means to me at least that they probably don't have the reserves they claim.
I think the overall evidence points to the fact that KSA is almost certainly lying about their reserves.
So the question is if they are lying how big is the lie ?
Modern extraction methods allow the production to remain high right to the end of a fields life.
Well of course.
Which has entirely bypassed the point of exactly what made the question of economics supporting advanced extraction necessary in the first place...
The only logical answer that comes to mind is 'Necessity Is The Mother Of Invention'. You just don't spend more than you have too.
Sorry, I don't mean to be sniping, but get real on this one.
Along the same vein as recent efforts in Western North Dakota. There appears to be decent quantities in the basin structure but it is a thin basin. Vertical wells just don't pay out over any kind of time frame. Whereas horizontals expose the string to much more of the pay zone allowing an economical recovery over time. Much more expensive over time but the only way the zone will pay out.
One has to assume that KSA would only use these advanced methods for a reason- They have to.
Exactly because they have too. That's the simplest answer in some cases it for purely technical reason because of the geology. In others its because the oil layer is so thin or water problems make the advanced wells the right answer.
The use of advanced extraction methods makes it difficult to determine the reserve from production data since it tends to distort the production.
Next its known that they did indeed have spare capacity but its in oil grades that they have had a hard time selling. Now its seems this is becoming less of a issue.
My final opinion is that KSA does not have any where near the amount of oil they claim. Agressive use of advanced extraction will ensure that they can maintain production rate high for some time.
This coupled with the goal of maintaining a spare capacity cushion will result in a stair step like production profile for KSA.
I'm guessing that their goal is to remain a significant exporter of oil for at least 20 years. I think that rising internal demand will become a increasing issue. I think that the only real goals they have are to transition the KSA economy away from a reliance on crude oil exports and towards a diverse petrochemical industry. They have plenty of crude/NG to support a petrochemical industry for the foreseeable future even as demand for crude as a fuel wanes over time.
Outside of the outlandish claims of reserves the facts and KSA's statements seem to support this scenario. By maintaining some spare capacity they can respond to some extent to the global markets as they execute the longer term plan of weening KSA off of raw crude exports.
As far as I know they may be the only nation on earth thats actually instituted a real depletion protocol.
No - you don't spend more than is justified.
One possible reason for using advanced recovery techniques is to maximize the total amount of oil that can be extracted. Suppose that using basic techniques on a specific field will allow KSA to produce 10B barrels at $1 each, and that using advanced techniques will allow KSA to produce 11B barrels at $2 each. Further suppose that they can sell each barrel for $50.
Profit in the first case is $49/bbl, or $490B over the life of the oil field. Profit in the second case is $48/bbl, or $528B over the life of the oil field.
Accordingly, if the use of advanced oil recovery techniques allows the Saudis to sweep the oil from their fields more efficiently, producing more from each field, then it only takes a very small improvement in the amount of oil available to justify a very large (relative) increase in the cost of production.
It would be a mistake to treat Aramco as if it were a private company; their goal is almost certainly not to maximize short-term profits.
Oil is Saudi Arabia's lifeblood, and it makes no sense for them to spill it all at once. It would be far more sensible to limit to an adequate flow rate to cover the nation's expenses while using all available means to ensure that flow rate can be maintained as long as possible. If that means they need to make 2% less profit in the short term so they can make 8% more profit in the long term, so be it - it's a very rational thing for them to do.
"If that means they need to make 2% less profit in the short term so they can make 8% more profit in the long term, so be it - it's a very rational thing for them to do."
But they are under political constraints as well: paying off enough disgruntled citizenry now helps keeps the ruling family in power, now.
They are a prime suspect for a fundamentalist revolution and the house of Saud wants to keep their heads connected to their necks.
So it could also be rational to pump more now than a long term (infinite horizon) profit maximization would state, in the event that the "we" who are making the decision probably have a finite lifetime.
It's the same reason that an international major in an poltically dangerous country wants to pump as much as possible as soon as possible, because the past production (and presumably profits removed elsewhere) can't be nationalized.
Absolutely true. Oil prices are high enough, though, that they have more than enough money to do so.
And that's one of the key reasons to suspect the Saudis have a long-term view: they're ruled by a hereditary dynasty, meaning the longevity of the family is a factor, not just the longevity of the individual.
In that case, it would be sensible to put a strong premium on long-term stability. If you have enough money to secure the family's position for now, why overproduce and make it difficult for your son to keep the family secure in the future?
This I actually agree with. Using advanced production methods then letting a substantial portion of your production capacity makes no sense. You left that out of your financial equation. If they where maximizing production in certain fields and allowing the rest to lie fallow then it makes a lot of sense.
Instead they are maximizing production in current fields and bring the rest online using advanced methods at a steady rate. And looking at what they are doing its not to reach 12mbd of capacity.
Your on the right track I think in recognizing that KSA is not driven primarily by market forces and this is what I've said a few times. Their primary goal is to try and make sure that KSA has a strong economy once oil is too expensive to be used as a cheap fuel.
Next given what we know about the rest of the world and the government in KSA its not clear that its wise for them to set on 4-5mbpd of production forever.
Sooner or later it may make sense for the importing companies to topple the current government. The story of the golden goose comes to mind.
I think that they don't have near the amount of oil they claim and are working on a plan that leaves KSA with a viable economy with a large petrochemical infrastructure within 20 years. They certainly have enough oil and natural gas to supply feedstocks for such plants for decades to come.
One of hundreds of stories on the matter.
http://petrochemical-plants.blogspot.com/2008/01/petrochemical-plant-sau...
I think Robert has graciously raised a valid point. I recall his debates with Stuart over the production issue. I was generally on the fence, because the information we had was inadequate in my opinion to fully support or rule out either one's view. I admit I was inclined towards Stuarts interpretation, but not ready to really commit. To be honest, we have to acknowlege that many here stated a strong belief that SA was in terminal, involuntary decline and would not be able to raise its production again, except perhaps for some brief intervals following major projects coming online. However, they have raised production recently and this calls for a reappraisal of the assumptions in the peakers arguments. This can only help improve our understanding of what is really happening. However, I will stick with my position that the unknowns still are large enough to prevent definitive statements.
My understanding of the increased production is that they lowered the price on the poorest grades and these are now selling. No one has argued that KSA did not have spare capacity for the lowest grades of oil.
I don't think this changes the situation at all.
http://www.gulfnews.com/business/Oil_and_Gas/10187700.html
Note Arab Heavy was discounted for both the US and EU.
The exact nature of the recent increases are important.
Question to anyone: If Saudi Aramco are correct and everything is cushdy, and they can get their production up to 12.5 mbpd or more and sustain that for the rest of the century, why are they so secretive with their data? Why has there never been any pressure on them to be more forthcoming? Or maybe organizations like the CIA already know.......
KSA is a very secretive place in general. It's their normal way of doing things, I doubt it will change anytime soon, and is clearly to their advantage when it comes to oil - which is why it annoys importers so much.
Unlike 'net importers', for KSA peak oil is 'bonanza time' to be managed to their advantage (and nobody elses) for as long as possible (and clearly they are managing it very well) since without the oil they are literally dead, unless they can eat and drink very hot sand.
Plame was in the Counter-Proliferation Division at CIA. Bush/Cheney appear to have wanted to destroy that division and the programs they ran to slow/stop proliferation of nuclear weapons. Further, Plame appears to have also been involved in spying on KSA. Was she outed because of Joe Wilson alone? Or was she outed because of who she was and that KSA found Americans spying on KSA? Was throwing Plame to the wolves a multi-point victory by damaging Wilson and at the same time destroying the CPD and Plame herself? What data did Brewster, Jennings, and Associates have access to from ARAMCO? You know that any data they had went to the CIA and thus to the administration if they wanted it.
References for Valerie Plame and Brewster, Jennings, and Associates:
http://www.washingtonpost.com/ac2/wp-dyn/A40012-2003Oct3?language=printer
http://en.wikipedia.org/wiki/Brewster_Jennings_&_Associates
Further, in this article you can see that the Bush administration was already trying to expose and destroy Plame, the CPD, as well as Brewster, Jennings, and Associates as early as 2001.
So you tell me - was Valerie Plame outed because of her husband? Or was Valerie Plame outed because she was Valerie Plame with Joe Wilson being useful collateral damage? And if she was outed after working for a company with known direct ties into ARAMCO, do you really think that the US government doesn't know in detail exactly the state of KSA's oil fields?
None of this is new news really. DailyKOS raised this very issue back in 2005.
And this is one conspiracy that people cannot hand wave away. This is a conspiracy to spy on ARAMCO and on WMDs in the Middle East. On top of that is another conspiracy by this administration to destroy that spying program. If these two conspiracies are visible to us now, how much more is not visible to us? And these conspiracies are directly related to petroleum because it directly dictates the political actions of the largest consumer of petroleum on the planet. In fact, we know that these conspiracies were tied to the invasion of Iraq and that the invasion of Iraq was tied to the Cheney Energy Task Force and to secretive papers created by that task force that planned to divide Iraq amongst the IOCs more than 6 months before the terrorist attack of 9/11! Again, this is not new news and was covered in 2003 when the courts forced Cheney to release this information.
Many people on TOD believe that with education about peak oil we can get politicians to change course. But what if the politicians are already educated? What if the current course is the course they chose to address peak oil? What if their response is resource wars?
A better question might be is at what point do you decide that society has made suicidal decisions? A followup question is what would you do for yourself once you decided that society had embarked on a suicidal course? Would you simply go down with the ship? Would you cling to the hope that if you vote for a new captain that the ship will somehow stop sinking? Both the economic and energy situation of the world today appears worse to me than it did as recently as January 2005. How much worse must it get before you decide that your priorities should be yourself and your loved ones rather than a rapacious petroleum empire that is hellbent on destroying anything between it and its next petroleum fix? How long before you admit to yourself that it may be time to think in terms like triage?
Hi Grey,
Thanks for this post.
re: "But what if the politicians are already educated? What if the current course is the course they chose to address peak oil? What if their response is resource wars?"
You've made a good case that - for a number of politicians - they are educated, and they have chosen.
It's still possible that there are others who are not and/or have not.
What I wonder about is the following:
Who is in a position to act?
Each actor feels helpless in his/her position (the scientist, the politician, the populace, the soldier, etc.) because each has a narrowly-construed mandate - (along w. constraints on information and/or understanding and/or ideas). And is simply following the will of "others" who are seen as the actual movers.
More and more I'm wonder about corporate persons (CEOs, etc.). It seems to me that just about the only hope is if a number of them decide to make a statement that brings the situation out into the open, which may (most likely) or may not necessitate losing/foregoing his/her job. Kind of like a "strike" for sanity. And for the saving of whatever can be saved. It could work. It might work. Will anyone try?
Also, because the "rapacious empire" is one of corporate control, really, w. the state as enforcer, and even that is being taken over by corps w. no allegiance to the state in a fundamental way.
re: "How much worse must it get before you decide that your priorities should be yourself and your loved ones rather than a rapacious petroleum empire that is hellbent on destroying anything between it and its next petroleum fix?"
Excellent point (of course).
At the same time, given the interdependence of people, it seems hard to imagine that it's even possible to save oneself/family...separately.
Indeed they did; from your link:
" Edited to reflect DeTocqueville's post on making clear the difference between Brewster Jennings the person and his identity theft by the CIA to create a prestigious-sounding name plate for the cover operation."
As said post states:
"So this diary is LARGELY based on the connection between Mobil Oil's Brewster Jennings, the person, and the almost non-existent Brewster-Jennings and Associates, the company.
There's only problem, there is zero evidence of a connection other than the name and when you take into account that the CIA or whoever filed the info with Bradstreet, they made it quite clear that the name comes from two guys, Victor Brewster and partner Jennings.
Get it? Two last names that have nothing to do with Mr Mobil."
***
The dummy corporation Plame used for cover was just that - a dummy corporation. It had no office at its address of record, a fake phone number, a ficticious head, and no connection to Mr. Brewster Jennings:
""I certainly can't shed any light on this," says John P. Jennings, 73, the son of the late Mr. Jennings. "He had nothing to do with the CIA -- ever." He figures the company's name is just a remarkable coincidence."
Regardless of how nice of a story it would make, evidence suggests that there was no connection between Plame and Aramco.
You are harping on a comment to the DailyKOS article and that comment was answered by the original author, whom you conveniently failed to quote. You also try to portray that just because this company is not associated with Brewster Jennings of oil fame that it therefore could not have been involved in Saudi Arabia. Yet you provide no proof of that. And there is proof that KSA, as well as Syria, Iran, Egypt, and other Middle Eastern nations were watched by the US for potential involvement with proliferation of nuclear weapons, exactly the area for which Plame was responsible as a member of the CPD. In fact, Plame was also involved deeply with monitoring Iran's nuclear program. Outing Plame thus also crippled the CPD's attempts to monitor Iran exactly as Bush was moving into Iraq and would shortly thereafter begin to make noises about Iran's nuclear ambitions. And within the last 24 months the Bush administration has given tacit support to (a) Egypt exploring nuclear power and possibly weapons, (b) the UAE exploring nuclear power, and (c) KSA itself exploring nuclear power and nuclear weapons as a response to Iran's supposed nuclear weapons program.
I didn't quote it because it adds nothing. He simply repeats the claim that the company has ties to Aramco, but provides no evidence.
Indeed, the claims he makes appear to be contradicted by the other link I gave. He asserts:
"OVer decades, the CIA had built up the fake firm and through it insinuated agents to keep an eye on not only WMD, but also ARAMCO, Saudi Arabia and their oil production and politics. Hundreds of agents have worked for Brewster Jennings and Associates."
However:
"There is no record of a business by that name in the Washington area and only one mention elsewhere. Dun & Bradstreet Inc.'s business-information database lists a Boston legal services firm with the same name without the hyphen.
...
D&B lists Brewster Jennings & Associates at 101 Arch St. in Boston, and provides a local telephone number. It names a partner, Victor Brewster, who is described as a "general practice attorney." There is no other record of the firm.
The address is a 21-story office building in Boston. Tenants include lawyers, insurers and consulting firms, but none by the name Brewster Jennings. Property and building managers say they have never heard of the organization and can find no record that such a firm rented there since the building opened in 1985. The phone number is not a working number.
...
D&B first listed Brewster Jennings Associates on May 22, 1994."
That doesn't sound like a company built over decades with hundreds of people working for it. What it does sound like is a relatively simple front for a single agent, or maybe a few.
You're the one making the (dubious) claim, you provide the evidence.
All you have so far is the word of one guy, as compared to a whole host of people who say he's not credible, and as compared to verifiable details on the company that do not match up with his claims. There is, at this point, zero evidence of a link to Aramco other than Masden's claims, some of which appear very unlikely in light of other information.
Until you provide some evidence that is not merely "Madsen says so", you have nothing. Just because you really want something to be true doesn't make it so.
Why is it important? If we had a coherent global strategy for transitioning to a post fossil fuel world, then the amount of fuel left would be an important factor in the implementation of that strategy. But since, in fact, our strategy (I do not mean yours and mine, but the collective strategy of those who benefit the most in the short term from the continuation of the economic status quo) is to grow our total economic output as fast a possible until grim, hard, necessity forces us to do otherwise, I have difficulty understanding the "importance" of the size of the Saudi oil reserves. The exact date when the current global economy falls into a hole it cannot climb out of if it continues to operate in its current structural form seems unimportant compared to the task of figuring out new social and economic structures which are capable of functioning effectively in a world in which constant increases in our net economic productivity are no longer possible.
In practical terms Roger, the timing is immensely important. I agree that a strategy would help, but even without the timing will make a huge difference.
We may approve of them or disapprove, but given oil prices around the current level oil sands will be much more developed.
Wind farms in many areas will also provide much more power in many areas, whilst solar power should be much cheaper than today.
Battery technology should allow PHEV, and initial production runs should have started.
Nuclear programs should have moved down the line towards build in many places, and very efficient CO2 air pumps suitable for harsh climates should be available everywhere, not just in Japan.
The industrial and technological capabilities of India and China should be much enhanced compared to today, in particular China should be well advanced in their nuclear build program.
We would also be more certain about what is happening with the worlds' climate, as without disputing the idea of GW, it is still possible that overlayed on that we might have a mini-ice age due to low solar activity, and we would know that if sunspot activity does not pick up in the next couple of years, according to some.
So it matters enormously when things happen.
I've changed my assumptions and lowered field decline rates for Saudi Arabia, used a depletion rate of remaining reserves upper bound and now use a 150 year time horizon for Saudi production (fig 10 above). This has caused a different production forecast profile.
Since there is no audited field by field production and reserves data for Saudi Arabia there will always be a considerable margin of error accompanied by conjecture.
Making forecasts is both an art and a science. In many cases, at least there is some accuracy in the actual data. For the oil industry, OPEC, IEA and EIA all publish actual production data and each source gives different actual data.
In addition, there is likely overstatement of actual OPEC production by OPEC members. Henry Groppe of http://www.groppelong.com/index.html said in December 2007 that Iran is one of OPEC's biggest overstaters of actual production
http://globalpublicmedia.com/transcripts/2891
An excellent (detailed!) overview of current and projected C&C production.
If I could have one tiny quibble, it appears that figure 2, based on Campbell's Feb 2008 newsletter information, has aN earlier and higher decline than the 1.8% his data represents. Am I seeing this right or is there some explanation for a different decline rate?
I use Colin Campbell's total URR figure only for an exponential fit.
Colin Campbell does not use a bottom up project basis for his forecast. Instead he relies on using depletion rates of yet to produce oil. Please refer to Campbell's August 2007 newsletter for an explanation of his forecasting methodology.
http://www.aspo-ireland.org/contentFiles/newsletterPDFs/Newsletter80_200...
http://www.aspo-ireland.org/index.cfm/page/newsletter
I heard the CEO of Shell Oil on C Span last night state that if the oil companies could get access to all public lands and off shore areas, they could increase domestic production by 2 to 3 million barrels per day. Combine this with like conservation and we could reverse the import/export ratio.
Does anyone here think that is credible, putting aside for the moment the environmental wisdom of undertaking such an effort? Peak oil? I guess if we just shoot all the environmentalists we can get out this mess.
I'm sure something similar will be attempted, despite prospects of climate change, but it won't stop an eventual peak of a finite resource - it'll just delay it very slightly and leave even less for our children and grandchildren.
Shell just sees an opportunity to make more profits - they want burning of crude oil to go on at the highest rate possible, for as long as possible, with the highest profits possible - even though it changes the atmosphere.
They could probably do even better than that if they developed underwater platforms serviced by submarines to go after the really deep stuff.
There is that pesky little problem of money, though. . .
Hi t,
re: "they could increase domestic production by 2 to 3 million barrels per day"
1) For how long?
2) And then, we do exactly what with the newly-purchased time?
Underline added.
As far as I know, all US resources are fungible. Saying access would raise domestic production is NOT saying that such production would go to US markets. More bullshit from Shell.
Todd
I take oil as fungible. I also care more about the net currency cost of our oil. Assuming any profits from exported oil is kept in country, it doesn't matter whether a given increment of production is exported or used domestically, it all contributes to reducing the net oil import bill.
Any opinions on where the extra production would come from?
(1) ANWR
(2) Offshore California
(3) GOM (Florida)
(4) NE Grand banks?
Of course the extra production would be used to continue business as usual for a little longer. That is what we are hoping to do with ethanol isn't it? Now that might still help a bit -technology for plugins is advancing -but I think PHEVs will be available before any of this new (over environmentalists dead bodies) production would be available. Probably it would just slow the transition.
Is there a high-res pdf of this document available? If not, I'm going under the assumption that this is under the Creative Commons, and I plan on modifying this for good printing and sending copies to my representatives and senators both at the Federal and State levels, while also providing it to county officials as well. Hopefully some of these politician's assistants will at least read the executive summary, and say a word or two to their bosses.
Thanks ace, and Durandal,
If ace okays and you do this, is there any chance I could also have a copy?
Hi Durandal,
Perhaps some of the editors at TOD could help you with your pdf request. I don't have a pdf version and if it's OK with TOD, please send copies to as many government officials as possible!
No wonder we haven't heard from you lately.
I guess I can kiss this weekend goodbye since I'm going to be trying to soak all this in.
Here's a quick example conversion done with PrimoPDF (free for Windows)
http://www.savefile.com/files/1383894
I didn't edit out the comments or do any reformatting but that could be done easily. I just provide the link to show what can be done. Note: Hyperlinks in the document are not preserved.
http://reddit.com/info/68vhj/comments/
http://digg.com/business_finance/World_Oil_Forecasts_someone_with_good_p...
thanks for your support.
There is one feature of Ace's approach that I particularly appreciate: He places a vertical line in his time-axis graphs that indicates the "present." I wish everyone who compiled oil and other energy forecasts would do this, for there is a fundamental epistemological difference regarding KNOWLEDGE of data from the past and SPECULATION regarding data for the future. I think this is a very important distinction that is often somewhat obscured by time-axis graphs that lack an explicit indication of where the present lies.
I agree 100 %.
What about the Brazil Oil Find. I heard it could be the size of SAudi Arabia. Probably not, but still large.
What about the East and West coasts of the USA? What about Florida? What if you add in the North coast of Alaska, where we are not currently allowed to drill?
If the USA coast line was opened up for exploration, how much oil do you think they would find?
Here's our piece on Tupi in Brazil: http://europe.theoildrum.com/node/3269
As for the coasts of the US, sure there's oil there. Most of it would be ridiculously expensive to get to (moreso than the Jack 2 find in some cases) and extract.
What a lot of people do not understand is that we have gotten to the easy oil first in the world. Now it gets more and more costly--often requiring huge sunk cost at the beginning of development in order to get the project moving, etc.
Based on my readings, the only place on earth left with relatively low cost oil is Iraq. See this recent article in Asia Times:
http://www.atimes.com/atimes/Middle_East/JB16Ak05.html
Even if they can't ramp up to "6 million barrels per day within the
next four years", Iraq has some very significant potential and should factored into the models. I would be interested in seeing if it only results in delaying a production peak by a couple years or could it be even more?
The recent Washington Post editorial by Rice and Gates on the upcoming negotiations on "status of forces"
http://www.washingtonpost.com/wp-dyn/content/article/2008/02/12/AR200802...
will prove insightful. The last gasp policy for the Bush/Cheney period. They seem to be willing to give up permanent military bases for access to the oil.
New mega discoveries made this close to Hubbert's theoretical peak have virtually no effect on the peak time frame. They only dampen the decline rate post peak similar to what Alaska did with the U.S. profile. I think Deffeyes included some example figures on this in his book. That's why it's so ridiculous for the price of oil or oil policy to be effected by any announcement of finds at this point.
Hi accceptance,
re: "relatively low cost oil"
The costs have been "externalized" (eg.: dead and wounded and sexually assaulted members of US military, dead and wounded and sexually assaulted members of US-financed corporate contractors, US taxpayer-funded "investments" to produce these outcomes), as well as "internalized" (same for Iraqi population).
Edited to add references WRT sexual assault, (since the death tolls are more well-known):
WRT US military (female soldiers), along w. US-financed corporations:
http://www.guardian.co.uk/world/2004/oct/25/usa.gender
http://www.washingtonpost.com/wp-dyn/articles/A10959-2004Jun2.html
http://www.alternet.org/asoldierspeaks/46294/
http://www.truthout.org/cgi-bin/artman/exec/view.cgi/57/17327
http://rawstory.com/news/2007/ABC_Sexual_assault_claim_against_State_121...
WRT: Iraqi women: http://www.dahrjamailiraq.com/hard_news/archives/newscommentary/000183.php
http://www.amnesty.org/en/library/info/MDE14/001/2005
http://www.democracynow.org/2005/3/29/u_s_soldiers_accused_of_raping
Trauma is also costly.
When Hubbert did his Lower 48 projections in 1956, he found that a one-third increase in URR delayed the projected Lower 48 peak by all of five years, from 1966 to 1971.
thanks for the reply.
In looking at Fig 2, and if you add 6-10 mbd from Iraq depending on when and how it was ramped up, you could extend the peak plateau for around 15-20 years.
In looking at the 5 stages of grief, I'd bet the US went to all this trouble to stay in the Bargain stage
"Bargaining: "Just let me live to see my children graduate."
instead of using the last remaining easy oil to transition to the new reality.
I think that all this data is too much. Peak What? Crude Oil? C&C? Ethanol? Tar Sand goop? Fryer Oil? Whats next to add to get a new peak?
How about just concentrating on what the public is going to understand? Like Peak Gas and Diesel. People understand that. They respond to that. This site's credibility would go mainstream by impacting people's lives on an everyday basis.
For instance, What do all the analyst's on this site think of gas and diesel production this year? Are there going to be shortages? What can be done?
When gas and diesel shortages hit and the price skyrockets people are going to be angry, scared and looking for answers. This site could position themselves to provide those answers by addressing the issues that will affect most people. Namely gas and diesel in the future.
Maybe I'm rambling but this site is fascinating, informative, and has some of the smartest analysts around. But, i still don't have a feel for what the price and availability of gas will be this summer.
And where will the shortages hit first (in the US)? North Dakota? Or the Gulf states (if supply is tight and "fog" hits the ports)?
Or would other nearby countries be hit first? What if Mexico needs X amount of oil for the govt. to stay afloat so they start rationing, or just cutting of parts of the country?
And (more questions) what are the required amounts of gas for people in the US by percentile?
For unleaded gas (pulling numbers out of my ass http://www.collegerecruiter.com/weblog/2006/11/your_daily_comm.php):
So the top %1 requires 2 gallons a day.
top 10% 1.75 gallons
top 25% 1.5 gallons
top 50% 1 gallon
etc.
If you did population distributions (on where high percentages of the top %10 or so live - I bet you'll see they live in working collar communities in exoburbs, so from where they live to where they work they will require that much gas _to survive_).
Long story short - I want to see if gas rationing would literally destroy (ghost towns) outlying communities. This could happen with high gas prices before rationing even kicks in. Is there any data on this to give any clues?
For example, my brother-in-law (in Iowa) has a 80 mile one way commute to his job with his honda sedan - that could be four-five gallons a day (for both ways). And grid-lock turns those 5 mile commutes into something that guzzles a gallon of gas.
Those people with the long commutes would be the first to carpool. Get four people in the car and that 80 mile one way commute becomes effectively more like 20 miles.
Once even that is too much for their gas rations, they find a way to sleep and eat cheap close to work, and their daily commute becomes a weekly commute.
Finally, they find some way to bring their home and workplace into closer proximity, changing one or the other.
Do you think fuel shortages will affect the economy at all? Will fuel be scarce and expensive, or just scarce or expensive?
When fuel becomes as hard to obtain as that, would you suspect that they may not have jobs to commute to?
If fuel has to be rationed, then I would guess that commuting will be the least of any worries.
Hi Korg and duff,
These are excellent questions.
I hope you can find someone(s) to collaborate with and come up with some analyses.
My guess is that we will be above $4 even without a Gulf hurricane. Don't forget that the gasoline additive Alkalate may be in short supply, which can limit quantities of finished gasoline. The EIA stock numbers have finished gasoline at 115 million barrels this week compared with 124 million barrels for the same week last year. Last year, the price of gasoline went to $3.50 a gallon in May when the price of oil was below $70 because of refinery worries.
Ace: Impressive work as always.
Agreed. Thanks for all the work that went into this analysis!
Congratulations on putting together one of the most up to date, most comprehensive analysis of oil production worldwide. Regardless of minor deviations from reserve estimates and various possible production peak dates, it should be obvious to anyone seeking confirmation on this topic, that give or take some minor time period, there is no way to avoid skyrocketing oil prices due to shrinking supply.
It's easy to see where this is going to as far as replacing the easy to get oil to chasing all forms of oil, no matter what the expense in energy or to the planet. As part of that grouping, growing more crops for fuel to serve those that can afford it at the expense of the overall food supply to feed the masses will exceed all current expectations. The guy filling up his Hummer will always win over the guy with no money. That scenario will extend itself to the point where the wealthiest 1% are driving and demanding products while the other 99% are rushing around trying to serve them to make enough to eat and sleep at night in motionless vehicles.
That is unless some corporation develops a magic bullet way to solve the problem of losing that cheap energy filled liquid oil we always took for granted, by scaling up to produce algae ethanol, or ecoli synthesized diesel fuel? As an evolution of fuel usage, from wood, to coal, to oil and gas, then nuclear, its seems obvious that the next generation must be scaled up microbial production of a replacement liquid form of energy. Does anyone here agree with that assessment?
That scenario will extend itself to the point where the wealthiest 1% are driving and demanding products while the other 99% are rushing around trying to serve them to make enough to eat and sleep at night in motionless vehicles.
I don't think it will ever reach That point.
Before that happens, you will be seeing this type of slogan spray painted on walls (so to speak)
"Hungry? Dress Out a Banker for the Barbi"
That's cute but I prefer the simpler 60's version:
EAT THE RICH.
I don't know about 'Soylent Green' - but the French model, for which the guillotine was invented, may well apply since many of our societies seem to have become seriously unbalanced again. That includes many of the oil exporter countries especially!
Looking at Fig. 1, you project price based on the price elasticity of demand: projected demand is greater than projected supply, so calculate the price required to bring demand down until they match. But what about the price elasticity of supply? Those high prices will spur investment to bring new oil to market. The elasticities estimated in the link you cite are almost as large on the supply side as they are on the demand side (at least for non-OPEC producers; OPEC has historically been better modeled as a cartel, or else as revenue-targeting, rather than as competitive profit-maximizers; but as their production costs rise, their behavior may come closer to the latter).
I've played around a bit with vector auto-regressive models trying to incorporate supply, demand, income (world GDP), and price, with several estimated elasticities. So far they're quite sensitive to those estimates, and not always stable, but they suggest that rising prices can draw out the production plateau....
peace,
lilnev
Hello lilnev,
Could you explain this further (or write up and post)?
Also, re: "Those high prices will spur investment to bring new oil to market."
1) How do supply constraints figure into this assumption? (What does the investment actually do?)
2) How does "high-cost-of-production" oil add to the "world GDP"? (Not in the same way that "low-cost-of-production" oil does -?)
3) In other words, does a drawn-out production plateau effect the supply/demand shortfall (i.e., effects on economy) and if so, how?
Looking at fig.4 past dicoveries should be enough to maintain production for some time to come. According to it past discoveries overshot production by more than recent discoveries undersoot it. Is the graph right?
"past dicoveries should be enough to maintain production for some time to come."
And then add those 6 to 10 mbd from Iraq. It's a shame, not including Iraq in this analysis.
This analysis is not much worth, I'm sorry. But you cannot exclude the country with reserves estimated the same as the KSA. Maybe much higher. I guess you are a US citizen. The US has spent so far hunderds of billions of US$ in the Iraq. Do you really think, they have spent it for 2 mbd extra? Think about it!
Euro: The beneficiaries of increased oil supply from Iraq and increased USA taxpayer spending on Iraq paid very little for the bounty- "they" didn't spend "their" money-they spent the schmuck taxpayer's money. Would they waste the schmucks' money for 2 mbd extra? In a heartbeat-who wouldn't?
That's the problem right there. Too much willingness on the part of Congress/White House to spend the country's wealth indiscriminantly. If a war in Iraq was a business decision to profit on oil, the company would have gone belly up in the first year of action.
Yes, but the insiders would have done very well. Enron is the template for the US government at this point (as well as many 3rd world governments). American politicians as a group are totally worthless at their purported duties, yet becoming an American politician is almost always a sure route to riches.
Iraq had a production of 3mb/day in 1988 which is before economic sanctions. Iraq had a peak of 3.5mb/day in 1979 or 1980. Saudi hit their all-time peak back in the early Eighties. The increase you are projecting doesn't make any sense to me.
I'm surprised this needs to be explained to anyone who regularly reads this site, but here goes:
1. Depletion of 4.5% starting from 87mb/d (2007) =
18mb/d by 2012
27mb/d by 2015
39mb/d by 2020
56mb/d by 2030.
2. Known possible major increases: KSA/OPEC 3.5mb/d; Iraq 4mb/d; Tar Sands 3mb/d (recent revisions downward); other small providers and expected production coming on line '08 - '09 ~ 13mb/d*(?).
Anything I'm leaving out? Total: 20.5mb/d. You might notice this doesn't get us to 2015. You might also notice some of that production (tar sands) probably won't be on tap till closer to 2020. Further, to accomplish this great and amazing feat, we will have to accept flat economic development because this doesn't include increases in demand. The additional shortfall when accounting for demand equals
8 mb/d by 2012
13.3 mb/d by 2015
22.7 mb/d by 2020
44 mb/d by 2030
Total shortfall:
26 mb/d by 2012
40 mb/d by 2015
61.7 mb/d by 2020
100 mb/d by 2030
So... Iraq is speculative. KSA is semi-speculative. Tar sands and '08 - '09 are fairly reliable. Regardless, in this best case scenario we are completely and utterly screwed.
Cheers
Quite a bit, it seems; the megaprojects wiki lists 27Mb/d of projects slated to come online by 2012.
Also, interestingly, it allows an estimate of decline rate.
Oil supply increased by 8Mb/d between 2002 and 2007 (year-end to year-end), which is about half the 16Mb/d which was supposed to be added in the intervening time (according to the megaprojects list). Accordingly, 16-8=8Mb/d was needed to compensate for the underlying decline rate. 8Mb/d decline from 80Mb/d is 10%; over 5 years, that's 2%/yr.
For comparison, a 4.5% decline rate would have seen 18Mb/d removed from existing production, which would suggest that the megaprojects list is missing the 10Mb/d that countered that decline. It would be surprising if the megaprojects list completely missed 40% of the oil projects over those 5 years.
I certainly wouldn't call your scenario "best case". For example, consider simply plugging in the numbers in the megaprojects list:
If everything on the megaprojects list came in on schedule (and immediately producing at full from the start, which it won't), it seems as if there'd be a substantial surplus of oil by 2012.
Do I expect that? No, not really. That is pretty much what the available data suggests, though, meaning there appears to be a substantial scope for compensating for schedule slippage or unexpected declines. If, for example, every single project was delayed by a year, and if underlying decline was 4.5%, we'd get:
i.e., demand would only be able to grow by 1Mb/d, which would probably lead to substantial price increases.
Even assuming a much higher decline rate than the data suggests and arbitrarily delaying every project, though, oil supply still grows. Unless the megaprojects list that people here have been working on is completely and utterly wrong, it seems like it would take quite a pessimistic set of assumptions before oil supply declined through 2012, much less so much that we were "screwed".
The current mega projects list found a lot of "missing oil" that other mega projects lists did not include. I suspect if its backtracked over time which is a lot of effort you will indeed find that we missed 40% of the production brought online since 2002.
Also considering that one of the reasons we where able to initially surge production as the price of oil increased was because existing project and in field development could be accelerated and of course spare capacity brought online and the future is not as rosy as it looks.
At least in the US and I suspect elsewhere in the world a good bit of the about 10mbd of extra production we have enjoyed is from redevelopment of old fields these wells generally have a lifetime of less than five years the same for a lot of offshore development.
So a lot of the infill production if you will that kept us at the level we are at will be declining over the next few years. This means that its unwise to assume that world decline rates won't increase going forward.
Unless we work the megaprojects list back in time we can only wait to see how well projects map to real production. However the fact that CERA has a extensive database and blew it badly on there predictions indicates that touting mega projects lists as a indication that we will have plenty of oil is unwise at best.
In that case, the same would likely be true about the list's estimates for future production, meaning there's still ample supply.
To see a problem, you need to assume that the list has missed huge amounts of past projects, but found almost all of the future projects. That seems to be an odd assumption to make.
Why would those projects not be included on the list? It would be very odd if it didn't include that, since that's additional production, which is what the list is meant to capture. If they're not, that would seem to be a flaw in the list, but a flaw that should apply to both past and future production increases.
No, it just indicates that either their data or their methods were flawed.
Of course, it's certainly possible that the megaprojects list is sorely lacking, or that there's something deeply wrong with the simple measures I took of it. In general, though, reasoning based on incomplete information is better than reasoning based on no information, as it provides at least a little more objectivity and a little bit of an impediment to personal bias creeping into the result.
There's every possibility I'm wrong; the question is why. Is it the data? What's wrong or missing from the megaprojects list, then, that it would be so hugely flawed? Is it the approach? I've just done simple arithmetic; is that not applicable?
Actually it would not be surprising, Pitt.
Giant and super giant fields account for about 60% of all oil produced and about 65% of all reserves. Thus 40% comes from all those small fields, not mega-projects at all. For you to note that 40% of the oil is unaccounted for by mega-projects just further validates the megaprojects wiki in my mind because that is consistent with global ratios of oil from giant/super giant fields versus the small fields.
40kb/d isn't a giant oil field, though.
FWIW, both SS and Skrebowski have looked at how much of the production lists like these might miss, and it seems to be not much. As you look at progressively smaller and smaller projects, the cumulative quantity of production increases in a fairly predictable manner, suggesting that less than 10% will be missed by this approach.
(SS notes that he looked at larger companies first so there may be a bias in his results, but Skrebowski did the same analysis in his reports and came to the same conclusion.)
In which case the list should be missing 40% of future production capacity increases as well, or an extra 18Mb/d by 2012, and that would be more than enough to cover a 4.5% decline rate and projected demand increases, even with large delays for most projects.
It's only if the megaprojects list has far larger gaps in its knowledge of the past than of the future that it predicts a supply problem by 2012. Knowing the future better than the past would be a rather unusual situation, though.
So the megaprojects list is evidence that supply will be good through at least 2012, assuming the future is similar to the past in terms of decline rates, delays, uncounted projects, etc. Only if the list is totally bogus or if the future differs sharply from the past is there likely to be a problem in the next five years. Some ways that might happen:
There's certainly scope for that (e.g., sudden watering out of Saudi and Russian production), but it's not the way the available information is pointing.
This is only true if we can keep finding the smaller fields at the same rate and the same average size. Yet industry data suggests that the average find has grown steadily smaller over the last 20 years and is becoming more expensive and harder to find as well. You cannot validly assume that average size and number of fields found per year over the next 12 years will remain static.
No one attempts to refute that there are fewer discoveries over time. That's a fact. So the number of fields found is already decreasing. But the average size is decreasing too and has been documented as far back as 1987 by the USGS itself. (No online reference but abstract visible here: http://www.springerlink.com/index/X342X65478482UM2.pdf ) That statement is also supported by this study by the Energy Watch Group in Germany (see page 34). Robelius in his Ph.D. dissertation also establishes that giant fields are declining in average size as well (see page 81).
Thus, I think you cannot safely make the assumption that either the number or the size of fields to be discovered over the next decade is constant. The available data completely refutes that assumption. The question then comes back to the rate of decrease in discoveries, the rate in decrease in field size, etc. While it has been true to date that 40% of oil comes from the small fields, we would need better data to ensure that this trend would continue in the face of falling discoveries and decreasing average field size. Do you have such data?
That would suggest that the "under 40kb/d" portion of new production should increase as a fraction of the total, rather than decrease. I'm not going to suggest that will or won't happen (I simply don't have the data), but it doesn't seem to support your argument at all.
True, but neither can you validly assume that the next 5 years will be wildly different from the last 5 years in terms of the distribution of sizes of projects that come online. Considering that it appears to take about 5 years to get a project online (based on, for example, Sakhalin II), what we'll get oil from in the next 5 years will largely be what we've already discovered, so there shouldn't be all that many big surprises (in terms of projects that enter production).
Fortunately, I've done nothing of the sort. I'm not sure who you're addressing here - perhaps you're simply musing - but I've only been talking about projects producing oil in the next five years, which has little or nothing to do with future oil discoveries. They're projects built on already-found fields, so it's really just a matter of construction and logistics at this point.
Based on Robelius's definition of "giant", about 45% of oil comes from fields that are "smaller than giant". As both SS and Skrebowski show, though, "smaller than giant" is quite a bit larger than "40kb/d", and both estimated that projects producing less than 40kb/d represent less than 10% of new production capacity.
If you have evidence or an argument to the contrary, that would be interesting to see. "Not giant" does not imply "not on the megaprojects list", though, so confusing those two definitions is not helpful.
The problem is a bit more complex than this. And the root is not so much fields brought online but the lifetime of the field itself. Advanced extraction methods have allowed us to reach the point that depletion rates for a lot of fields approach 20% a year thus the field is 100% depleted within 5 years. This is especially true with smaller fields.
A lot of the small field production and infield drilling brought online in 2002 is nearing end of life right now. This makes up a good bit of the 10mpd production increases we saw once prices started increasing.
Your free to work through what happens when your replace production from mega-fields produced at low depletion rates with small fields depleted at high rates but its not stable.
What your not seeing is that the real underlying depletion rate may be a lot higher then most people expect and its reasonable to expect that given most finds are small fields it will increase over time.
Just to make it simple if you start all your fields at time t0 and they deplete in 5 years your need to replace 100% of your production every five years. Its not that bad but given that 40% of our production is from small fields and this will grow as the supers decline we are on one hell of a treadmill.
This is the underlying reason I think most of the current models failed to predict our current plateau no one accounts for the higher depletion rates from smaller fields and advanced technology and in my opinion its a huge factor in our overall production. And given that we are at the tail end of the exploration curve I just don't see us producing at our current rates in the near future. Time will tell but suspect your wall of oil from mega projects will result in a 2mpd lower overall production vs 2007. The only thing that could distort this is if KSA can turn on some more spare capacity. So given the noise in the data we could end up anywhere from down 4mpd to up 2mpd.
This points to a real depletion rate of between 4-12% and a expectation that at best half the oil slated to come online will but we actually get a lot more oil from uncounted infield/small field drilling then has been documented. If the infield drilling is not providing the increases it did in the past then down up to 4mpd is possible. Its almost pure guesswork to figure out when extraction from known sources can no longer stabilize or increase production but its a pretty safe bet that its probably over the next few years and once it does world oil production will decline noticeably and quickly.
Given the above I don't see a wall of oil coming. I'm hoping we make it one more year without serious declines.
Time will tell.
Do you have any documentation for the notion that double-digit decline rates is even remotely common for onshore fields?
There have been a few high-profile cases of rapid decline (Cantarell, North Sea), but all of the ones I know of have been offshore. By contrast, the large Daqing field, which many different EOR methods are being applied to, has dropped from 51.1Mtons in 2002 to 41.7Mtons in 2007, or an average decline rate of 4% per year. These kinds of long lifespans seem to still be the assumption in evaluation oil fields, at least according to the studies done on ANWR.
It's certainly possible that EOR techniques are being used to drain fields faster than before, especially for small fields, but it's not an assertion I can simply accept without evidence.
Pitt I was talking about depletion rates not decline rates they are different.
And I'm talking about depletion rates for small fields and infield drilling in old fields off shore both deep and regular. A substantial portion of our production is now from offshore fields this started in the 1980's.
Certainly the decline of the larges fields makes it difficult to increase production and will eventually result in declining production. But the overall decline rate may be controlled by the rate that these high depletion rate fields decline.
http://www.worldoil.com/magazine/MAGAZINE_DETAIL.asp?ART_ID=523&MONTH_YE...
Here is one paper.
http://www.sciencedirect.com/science?_ob=ArticleURL&_udi=B6V2S-4MKTXPP-2...
And another.
http://findarticles.com/p/articles/mi_qa3970/is_200410/ai_n9461232/pg_13
And this of course.
http://www.theoildrum.com/story/2005/11/16/182053/32
As far as 20% thats done by looking at individual fields esp in the GOM.
A large number are only in production for 5 years before going into steep production declines 10%+ this is normal for offshore fields.
Now here is the issue. Declines in the large fields tend to offset new production.
However 40% of the worlds production is coming from small fields and development and redevelopment of small fields and olds fields primarly offshore.
This is the production that may suffer steep declines. And its here where we stand a chance to loose up to 4mpd over the next couple of years without replacement. This production could suffer production decline rates from 8% to 15% if we have found most of the small fields in a region.
Understand we have been developing these fields intensely for almost 30 years now I'm simply saying we can't replace them over the next 10 years. This 10-30mbd or so of production probably needs to be replaced every 10 years. And as I said the newer stuff is approaching field lifetimes of 5 years.
Certainly the decline of the super giants is at the heart of the problem but we have two overlapping issues. We have our super giants in decline and we have exhausted most of the smaller prospects in existing producing regions.
My apologies; I'd missed that.
In that case, we're talking about different things; fair enough.
It would be safe to assume that 27 mb/d is inclusive of what I mentioned already: part of it would be expected oil sands, part would be the 8mb/d already talked about in other places for 2008 (and '09?), KSA's improvements, the 5 mb/d I built in for those specifics I didn't know off the top of my head.etc., so the difference is well under 20mb/d. Given the 17 above, no more than 10 mb/d I didn't include. Thanks for the info. I will try to remember to check Megaprojects should I post similarly in the future.
I could care less about supply... Let's keep this to production, shall we? I am probably being dense here, but don't follow your numbers in that paragraph.
There is no way on god's formerly green Earth that depletion is at 2%. There is nothing to support that contention but perhaps the math you used above. I don't think megaprojects is designed to assess decline rates. It shows production, doesn't it?
Where do you get these freaky numbers? Production has been rising at a minimum of 1.7 and is expected to be over 2 this year. Multiple sources for this. 1.5? Where the hell did that come from? You are wasting my time, friend.
This is some damned strange analysis. First, I have seen nothing but your statement in this post suggest decline is 2% and demand is 1.5%. Those change the numbers significantly.
Second, You are saying supply still grows. But you do so with an expectation of a 1% demand increase. Again, "Huh?" Another number seems to be flying out of your arse, friend. Where did it come from? It may be possible with a major recession, but only if it is global. Since this is possible, I 'spose we can let this one stand as possible. Still, where did it come from?
Third, I don't think I said anything about production declining. I did give decline rates. Your extremely optimistic, fanciful really, numbers still lead to a need for 13mb/d of new oil. That's half of what you say is coming online. Given the penchant for things being delayed and producing far less than expected, even at your numbers things are tight by 2012. The 10mb/d extra could very easily evaporate into a black hole of lower production than expected, project delays, higher costs and inefficiencies, increased depletion rates....
Fourth, I didn't say we were screwed by 2012. I gave numbers out to 2030 and specifically said we had no indication that we'd be still doing OK by 2015. Why did you choose 2012?
Curious about your numbers,
Cheers
I'd think so, yes. There's been some discussion of what that list might be missing, though.
It gives production, yes, but added production, decline, and net increase must all balance out. If 16Mb/d of projects are added while 8Mb/d of decline occurs, then the total increase in the amount of oil production capacity available must be 16Mb/d (new projects) - 8Mb/d (decline from old projects) = 8Mb/d. i.e.,
That's just an equation, though, meaning any one of the three values can be solved for if the other two are known. Since we know the increase in oil supply (it can be looked up in IEA/EIA tables) and the list of projects added, we can use those to solve for the total decline amount. Since we know the time over which the decline occurred, we can find the rate of decline per year.
One needs to be careful about shut-in capacity, though. I hadn't realized that OPEC had decreased production by almost 2Mb/d during that recession, so adding that back in shouldn't be counted towards the increase in production capacity (since the capacity was already there). That gives an increase of 6Mb/d over 5 years on 16Mb/d of projects, suggesting an underlying decline rate of about 2.5% (2Mb/d per year). i.e.,
It's a round number based on recent IEA and EIA forecasts that note high prices are having an effect on demand. EIA figures, for example, put the rate of demand growth at about 1.5% for 04/05 and 05/06, and roughly 1% for 06/07.
Given that the difference between my figure for extra demand by 2012 - 7Mb/d - and yours - 8Mb/d - is quite small, I don't see why this is concerning you as much as it appears to be.
That's the part you didn't follow. Hopefully the new explanation is clearer.
1.5%, same as before, same as the EIA data suggests, and practically the same as your assumption for 2012. You're complaining about the difference between 7 and 8.
The decline rate is derived directly from the megaprojects list. The growth rate is taken from EIA/IEA figures for the last few years, and is not so different from your own.
That my numbers don't say what you want to hear doesn't make them "fanciful".
No; given my numbers, there'd be "a substantial surplus of oil by 2012", as I said previously.
Given your numbers and substantial delays, things would be tight by 2012.
It could, but there's no reason to assume it will without evidence. That's one of the reasons I looked at multiple scenarios - one with the numbers the data gave me, and one with pessimistic assumptions arbitrarily added.
That's when the megaprojects list effectively ends, so there's no data on expected production capacity additions beyond that date. Anything I used for new projects after then would be an assumption on my part, and I prefer to stick to the data when possible.
No. We both neglected to mention the draw down in oil stocks. You have to add that in. Also, we should clarify our terms. Are we talking oil or liquids? I'm on oil. How does that affect your numbers? Again, I don't think playing with megaprojects numbers gets you to a clear discussion of depletion. If even CERA is saying depletion is 4.5%, how do you support refuting that? Even Cheney said depletion was at 3% *minimum* back in '98 or '99. Since then we've seen the collapse of the North Sea and Cantarell. Again, no way in hell depletion is at 2%. Regarding future decline, I've not seen those numbers. I've seen rvisions from around 2.2 to closer to 2, but nothing from any source that states 1.5 for '08. Links?
Past performance is no guarantee of future performance, but it can be an indicator. There is tons of evidence: rising costs of production, lack of manpower, lack of rigs, geologic constraints (E.g. Tupi)... there is, in fact, little evidence that there won't be delays and disappointments.
Why did you choose 2012?
You cannot respond to my post in this manner and be taken seriously. The average time for peak is in the 2012 range. How can we ignore this? There is substantial new production for '08 and '09 expected, but little after that. Given the time needed to get projects going, we can very safely project problems 7 to 10 years out because we have a good idea what is in development now. Saying we have difficulty going out to 202 might hold water. Saying we are limited to 2012 is not a tenable position, all the more so given the number of pronouncements since last summer about supply issues at or after 2012 from even the oil majors.
Cheers
No, that makes no difference. Drawing down stocks doesn't change anything in that equation.
At any rate, you may be surprised to know that stocks increased over that period. Year-average 2000 vs. 2007 gives an increase of 370Mb for the OECD, or about 0.15Mb/d. Stock increase since 2002 was 350Mb, or about 0.2Mb/d.
Oil supply, which the EIA and IEA both agree consists of all liquids.
It's the only sensible measure to use, for a lot of reasons. The most obvious are that the overwhelming majority of the additional liquids is NGL, which are use precisely like crude in a number of applications, such as ethylene feedstocks, and they're also directly blended into the gasoline supply in substantial quantities.
The only component of those liquids which is at all dodgy is the processing gain, but complaining about that is a red herring. Processing gain is basically just a constant fraction of total oil supply, meaning relative (percentile) changes in oil supply are the same regardless of whether it's kept in or taken out. It's not truly constant, of course - it's increased somewhat since 1980 - but the rate of change has been so miniscule in recent years that it's effectively ignorable.
Is that 4.5% decline on all fields, or on declining fields?
4.5% is probably a reasonable figure for fields which are actually declining. The large majority of fields are onshore, and those seem to have more moderate decline rates (e.g., Daqing, which has been declining at 4%/yr since leaving its plateau), so combining those with the steeper decline rates of offshore fields which are also in decline could indeed give about 4.5% per year.
However, this suggests that CERA's decline rate was for all fields, not just those undergoing decline. In that case, calculating the decline rate implied by the megaprojects list is useful precisely because it identifies this discrepancy; either CERA is wrong, the megaprojects list is missing enormous amounts of added production capacity, or some unknown third factor is affecting the analysis.
If the problem is gaps in the megaprojects list, we can use the difference between the calculated decline rate (2.5%) and the assumed-correct decline rate (4.5%) to determine how much the list is missing (8Mb/d, meaning it has only 2/3 of the projects).
Sure I can; you're just misunderstanding what I'm talking about.
I'm talking about what the available data implies; no more and no less. I'm not talking about the period you want to talk about because I don't have data on that period, so I can't talk about 2020 in the same manner I've been talking about 2012.
I'm not saying you're "limited" to 2012; I'm saying the data from the megaprojects list is limited to 2012. Since the analysis I'm doing here is simple arithmetic on the data from the megaprojects list, it follows rather clearly that that analysis stops at 2012 when the data stops.
If you want to talk about 2020, go right ahead. Just don't complain when I don't join in.
***
EDIT: it turns out that the IEA has done a very similar calculation to estimate decline rate in their Medium-Term Oil Market Report. They also have figures for OPEC's spare capacity, which needs to be taken into account when determining capacity changes due to projects and declines.
Based on their figures, OPEC's spare capacity declined by about 3.0Mb/d between 2002 and 2007 (spare capacity figures taken from June reports of each year), rather than the 2Mb/d I'd estimated before. That would make the decline during those years -11Mb/d of the 16Mb/d added, or about 2.8% per year.
Looking at their calculation (p.29) and the attendant charts, their figures for per-year non-OPEC gross supply added is:
By contrast, the megaprojects list gives:
So the megaprojects list seems to be missing only 5-10% of production, just as SS and Skrebowski's calculations suggested (although the production over those years is obviously distributed rather differently).
Even taking that "extra" 5-10% into account, I still get:
That's still significantly below the IEA's estimate of 4%; however, their estimate is based on their predictions for 2006-2012, rather than historical data, which seems a little odd.
So the methodology seems sound - it's what the IEA uses - and the data seems pretty good (within ~5% of the IEA's figures), suggesting that if the calculated decline rate of 3% per year is wildly wrong, there must be some unknown error we're not taking into account. But what?
If you mean your equation using megaprojects as your sources for numbers, I agree. I think it's a non-starter on it's face. Go to total production from IEA/EIA/BP, then look at total consumption. The number you get is NOT accurate unless you include what is drawn down, for that is the difference between the former two.
Counting from 2002 is meaningless. We are concerned with where production leveled off. The earliest you should be looking at is 2004. Either way, your statement is not useful: what does the total in stock tell us between two years without all the other relevant numbers? Nothing.
This is getting silly. I'll let you find the flaw in your question.
My problem is with your presentation of data in such a way to give the impression all is fine through 2012, so no worries. It is misleading. And, again, your comment is just wrong. If the megaprojects lists project through to 2012, then it is, by definition listing production gains well beyond 2012.
Capacity? Why do you keep talking about capacity? Capacity is a meaningless stat. This is not a CERA website.
Cheers
Consumption is irrelevant for estimating decline rate. If you think it's not, you don't understand the equation we're talking about. Go back and look at it, and you should realize that none of the terms in there involve consumption in any way.
When production levelled off is irrelevant to estimating the decline rate, which should continue at approximately the same pace regardless of whether people are having trouble finding new production to add.
The problem is that you don't understand what I'm talking about. You clearly don't understand the equation being used to estimate decline rate - you're trying to jam all kinds of irrelevant numbers into it - and apparently you don't understand the rest of what I was saying, either.
I've never said "if we're fine until 2012 we don't need to worry." That's simply your straw man, and has nothing to do with me.
But it effectively stops at 2012, since further years are far enough in the future that most projects intended to come online in them haven't been announced yet.
The list does indeed include a project as far out as 2019, but it would be utter folly to assume that project is the only one that will be finished in 2019. Most projects that'll come online in that year haven't even been thought of, much less announced.
Because capacity is the physical limit, and - thanks to OPEC quotas - production is an arbitrary subset of capacity. If you look at production rather than capacity, you get the wrong answer.
Look at the data. OPEC spare capacity fell by 3Mb/d between mid-2002 and mid-2007. If you were looking at production, rather than capacity, you'd find these 3Mb/d magically appearing, with no tie to any of the projects coming online in that year.
When a new project is finished, production capacity increases. When the owner of that project decides to operate it, production increases. Since those two don't have to go coincide - and often don't, in the case of OPEC - production and production capacity are not interchangeable. Since adding a new project increases capacity, then, capacity is the correct measure to look at.
"Accordingly, 16-8=8Mb/d was needed to compensate for the underlying decline rate. 8Mb/d decline from 80Mb/d is 10%; over 5 years, that's 2%/yr."*
not sure i completely understand your methodology in arriving at an implied decline rate.
the megaprojects do not include all of the added supply, i.e added supply and decline rate are understated.
also the apparent current peak was 2005, so your calculated decline rate seems to include an incline as well.
*10% decline over 5 yrs is not equal to 2% per year (close but not quite). for a small decline rate that is probably ok for practical purposes.
what if the decline was 50% in five years, the annual decline rate to get 50% decline in 5 yrs is about 16% per year, not 10%.
q/qo = (1-de)^t, d is the effective annual decline expressed as a fraction.
Yes, but the understatement appears to be small (<10%), so the effect is minimal.
It is if you're only reporting one sig fig.
I'm well aware of the mathematically correct way to calculate decline rates - it's what I've been using all along.
"- it's what I've been using all along".
...... well, ok except for this one time where you said 10% decline in 5 yrs is equal to 2% decline. you could have said "about 2%".
and what about the peak being in '05 ? your decline includes an incline.
and in a later post, you take non-opec supply and compare that with the megaprojects list, concluding they are within 5-10%. kindly explain what the hell that tells us, please.
I agree. The graph with two bell curves -- one with discovery and one with production is clear.
I just wanted to remind everyone that for Saudi Arabia the peak in 2005 is a "secondary one." According to my archived copy of the MER going back to 1973, during the 12-month period from September 1980 through August 1981 the KSA production rate averaged 10.184 MMBPD. The two calendar year averages were 9.900 MBPD and 9.815 MMBPD for 1980 and 1981, respectively.
The peak in 2005 for the KSA was just a "wimpy thang!" in comparison.
Hi Star,
Thanks. What are the implications of this?
There are two implications.
First, KSA has been pumping a lot of oil since 1981 (~69 GB). Yes, they dropped their output when the price collapsed and they learned some important lessons from that. But that easily pumped oil back in 1980 and 1981 (and the peak that could occur) is gone or at least reduced.
Second, while the KSA may be able to establish an new peak (analogous to what happened to Great Britain), it means a lot more wells and running faster to stay in place. There are a number of us who just don't see this happening.
What is interesting about the oil supply chart is that the very steep rise from about 1960 to 1972 parallels the rise of what most Americans consider the "middle class". It has risen since then, but this was effectively the strongest rise in standard of living at the USA median level. The forecast implies that the USA middle class might be on the verge of extinction.
Is the oil price climb in figure 1 based on all of the total liquids production going straight to everyone bidding on oil? Does it consider that you have just the exported portion of it being bid on by the industrialized users? The export models discussed here at TOD have the future export decline rates much higher than the total liquids decline rate. Also, the total liquids production includes ethanol, CTL, biofuels, and a whole array of very low EROEI oil substitutes that make up about 10% of the total. When you consider that these collectively take nearly as much real (conventional) oil to make as they replace, you effectively must knock about 10% off this supply untill EROEI improves. That means you have something more resembling the C+C plus NGL curve actually trying to meet the global importer's demand curve (after you've determined just the exported portion of this).
cancel posting
pardon me?
ace, an impressive body of work.
could you clarify one point ? you state: "The non heavy crude URR of 150 Gb includes 75 Gb for Ghawar (light)...."
based on the work of you, stuart and euan means, i thought that the cummulative for ghawar was around 65 - 70 Gb(currently) with up to 40 Gb remaining, bringing the Ghawar urr to around 110 Gb*, and implying a 4 - 5% annual decline.
if you accept the 75 Gb urr, then ghawar only has 5 -10 Gb remaining, implying an annual decline rate of around 20% for the 10 Gb case!
2007 5 mmbpd
2008 4 mmbpd
2009 3.2 mmbpd, etc.
* the 110 Gb urr would amount to 65% recovery of the 170 or so Gb of ooip from aramco pre nationalization (and more or less verified by stuart and euan means).
and incidentally, aramco is conducting job fairs in houston and midland, according to rigzone.
Ghawar - no audited figures available - so lots of conjecture.
You might be interested in Khebab's recent paper on Saudi Arabia field size ranges
http://www.theoildrum.com/node/2945
Rand, 1975, estimated Ghawar URR at 60-83 Gb. Robelius, 2007, estimated, using IHS data, Ghawar URR at 66-150 Gb. Ghawar URR somewhere between 60-150 Gb. OOIP between 170-190 Gb.
Ghawar is a carbonate reservoir which usually get only 25-35% economic recovery rates. 0.35*190=67 Gb URR for Ghawar.
Dr Mamdouh Salameh, has a doctorate in economics specializing in the economics of oil and energy and is an oil consultant to World Bank, sent this email to ODAC in May 7, 2007, supporting these recovery rates.
http://209.85.173.104/search?q=cache:TDXQJGMPjSgJ:www.odac-info.org/news...
Mike Horn (Master Science, Geology) in his 2007 Oil & Gas Journal paper on giant field data has stubbornly refused to increase the URR for Ghawar from 66 Gb.
http://www.searchanddiscovery.net/documents/2007/07032horn/images/horn.pdf
Based on Horn and Salameh's statements and on this Hubbert Linearization chart, I have assumed an economic URR of 75 Gb for Ghawar.
http://i129.photobucket.com/albums/p237/1ace11/ghawar2.png
In Feb 2004, Nansen Saleri, ex Aramco VP, said that Ghawar has produced 55 Gb to year end 2003. If Ghawar has produced about 4.5 mbd from 2004 to 2007, then cumulative production to year end 2007 would be about 62 Gb. If 66-75 Gb Ghawar URR is by chance right then Ghawar's production will collapse, as Salameh says above.
from the satellite photos a while back, its fair assessment to say Ghawar is slowly collapsing. But KSA is so big they can cover it up for a long time- if planned right, years. We may be seeing that, we may not. We all like to scream "look production was up" but there are so many details we may miss, such as is it above ground reserves, is it a new project, etc, its hard to make a definitive conclusion. I think the best we can hope for is to put off a collapse of Ghawar a little longer. KSA can go anywhere from 7-10 MBD depending on the weather. With the projects they have going, post Ghawar, they may even still be hitting 7 MBD. Of course how much of that gets exported is up to the geniuses at GM that keep selling 9MPG SUV's to the kingdoms to be used as sand buggies.
Prospects still look good for North Americans- Combined production of Ethanol and Tar Sands, will either put food on the table or gas in the car. At least we might get a choice.
The bottom line is there has not been any meaningful increase in production since 2004 and this in the face of sharply higher prices. I am not a fan of TA but will use the word "breakout." here. There has been no breakout which is what should have occurred if the free marketers/anti-peakers had been correct. Clearly, the plateau is a result of newer smaller discoveries and ERT's making up for general declines in larger fields like Canterell. Common sense would tell one that this situation is severely vulnerable to diminishing marginal returns as well as the lack of availability of new discoveries. My feeling has always been that the plateau would be about 5 years long. Just my 1.5 cents.
Matt
Define "meaningful".
The EIA reports oil supply growth of 1.4Mb/d between 2004 and 2007 (annual averages), whereas the IEA reports 2.4Mb/d over that period.
That's 1.7-2.9% growth over a 3 year period, or about 0.6-1% per year, which is about half the growth rate seen over the 90s.
Why?
Finding, developing, and producing large amounts of new oil - or oil substitutes - is a substantial undertaking, and can't reasonably be expected to happen quickly. Far from it - take a look at the enormous level of investment pouring into the tar sands, and how slowly that translates into new capacity.
World oil prices only moved above $30/bbl in 2004, meaning there's been 3-4 years of price incentives. It's not clear that's enough time to find and develop substantial resources; for example, the Sakhalin-II project in Russia took 5 years from signing the agreement to first oil.
So it's not clear that the petroleum world should or even can be moving as quickly as you suggest.
Your own posts elsewhere counter your arguments. World oil prices had NOT yet moved above $30 per barrel yet production grew by 7 mbpd from January 2002 to July 2004.
What happened there, Pitt? You can't have it both ways. Either the market can respond quickly or it cannot. When I see someone arguing out of both sides of their mouth in different threads of discussion, I have to ask myself what other motive might they have for posting if they cannot even keep a consistent perspective? The market had 2 years of price doubling and it brought 7mbpd online. Now it has had 3.5 years with price trebling and it cannot bring more online? WTF? And you were the one who the other day was making a big deal out of all this oil that came online in that period!!!
What makes you think I'd know? I'm just offering explanations based on the available evidence that seem reasonable; if there are problems with those explanations or are alternative explanations, of course I'd like to hear them.
We can get some information by looking at the production levels in context of price as well as surrounding economic conditions. January 2002 was in the middle of the dotcom bust, and recessions typically lower oil demand. Indeed, the price of oil had fallen to just $17/bbl by the end of Jan 2002. July 2004, by contrast, was in the middle of economic recovery and in the middle of summer driving season, meaning the price of oil had doubled to $35/bbl.
The obvious explanation is that production capacity was shut in to prevent an even greater price crash during the recession, and then that shut-in capacity was restored (along with new capacity added in the meantime) when the world economy recovered. This is further supported by observing that the month you chose - Jan02 - had production 2.5Mb/d lower than just 10 months before (when the price had been 50% higher).
Measuring from Mar01 to Jul04 to get around the question of shut-in capacity, we see that oil supply increased by 5.4Mb/d in 3.3 years, or about 1.6Mb/d per year. That's a little faster than the 1.1Mb/d average of the 90s, but it's no faster than the average if you start after the recession (1993-2000).
So it doesn't seem that surprising at all; oil production dropped during the recession, and then increased to accommodate the economic recovery. If you look at who added those extra barrels between 2002 and 2004, it was mostly OPEC. Roughly speaking, 1/3 of the increase was OPEC restoring production it'd taken off the market, 1/3 was increased OPEC production, and 1/3 was everyone else (mostly Russia, which grew strongly the whole time).
Not that mysterious.
Then I suggest you have an attitude problem.
I'm by no means "arguing out of both sides of my mouth", and I have a wholly consistent perspective throughout. My perspective is simply "what does the data say?"
Perhaps I've made errors in my analysis. Perhaps I've missed or overlooked things. If instead of considering that you immediately jump to conclusions of malfeasance, that's your problem, not mine.
The situation is rather less stark (and rather less misleading) if you don't cherry-pick data points to fit a preconceived conclusion - yearly averages are more stable and reliable than monthly, and don't suffer from the known cyclic effects of production and demand. It also substantially biases the data to pick a starting point in the middle of a recession.
From 2000 to 2004, world oil supply increased yearly by 1.3Mb/d - marginally faster than the average rate of the preceeding 10 years - and prices increased by about 40%. From 2004 to 2007, world oil supply increased yearly by 0.5Mb/d, which is certainly slower-than-average growth, and prices increased by 60%. Would I say that suggests producers are struggling to add new capacity? Of course. (The mere existence of the oil sands boom is proof of that, in my opinion.)
I haven't said otherwise. What I have said - which you appear to have misinterpreted - is that the data does not support the view that the capitalist/free-market approach has failed. Higher prices did indeed bring more supply, although certainly not at a 1-for-1 pace. My argument there was that the price increases have indeed brought more oil, but that the sharp price increases of the last 2-3 years haven't resulted in additional oil yet in part because the lead time of new oil projects is more than 2-3 years. Looking at the megaprojects list, though, you can clearly see a sharp increase in the projected capacity additions in the next couple of years, which neatly fits the roughly 5-year sign-to-produce timeline I noted.
Is that argument correct? Maybe. If you disagree with it, though, it's substantially more useful to offer a counter-argument, rather than simply posting insults.
The shut-in capacity from the previous high before the dot-com bust was 0.8 mbpd. Thus at least 6.2 mbpd of that was additional capacity that had not been brought online previously. Either (a) oil companies were able to discover and bring online a large volume (over 6.2 mbpd) of new oil very rapidly or (b) oil companies made bad investments at times of low prices (the 1990s) and then held onto those bad investments paying through the nose for years with no income from the investment (including through an economic downturn) just so they could later turn them on at the flick of a switch (in basically 2 years time).
Again, let's review actual annual supply numbers:
1995: 70.271 million barrels per day
1996: 71.916 million barrels per day
1997: 74.157 million barrels per day
1998: 75.654 million barrels per day
1999: 74.839 million barrels per day
2000: 77.762 million barrels per day
2001: 77.684 million barrels per day
2002: 76.994 million barrels per day
2003: 79.615 million barrels per day
2004: 83.124 million barrels per day
2005: 84.631 million barrels per day
2006: 84.597 million barrels per day
Source: http://www.eia.doe.gov/emeu/international/RecentTotalOilSupplyBarrelsper... (Warning: Excel spreadsheet)
Moreover, oil production grew in 2-3 mbpd leaps between years several times during the 1990s when prices were low. Yet suddenly, with an 800% increase over 1990s prices, oil cannot grow at all for nearly 4 straight years?
Oil production jumped by 3 mbpd from 1996 to 1997 and by 3 mbpd from 1999 to 2000. Were the oil companies losing money per barrel and thus eager to lose more money by pumping more barrels? I don't think so. But let's wait and see what 2008, 2009, and 2010 bring. Some people claimed a wave of new oil would arrive in 2006, then they moved their claims to 2007 and it never materialized. Let's see how much of this massive wave of oil actually materializes in the next three years.
By the way, Pitt, despite the fall in price to $17 per barrel that you nicely note, production only fell by 0.8 mbpd. It was also still over 1.3 mbpd higher than during the dot-com boom years of 1997-1999! Production was higher and prices were higher during the economic "bust" than during the boom years (as per your own supplied link)! My god! Not much of a response to "collapsing" oil prices, eh?
The 300billion in phantom barrels was also echoed by al Husseini in recent months.
Cheers
Regarding Ghawar, Matt Simmons' source, a retired Aramco executive, put the maximum URR for Ghawar at 70 Gb.
Apparently, Ghawar has made between 55 Gb and 60 Gb. To put this difference (between current cumulative producion and URR) in perspective, 12 Gb is the size as the largest oil field in North America--Prudhoe Bay.
I am skeptical about counting Oct. 2006 OPEC member decline rates as due to depletion. If I recall correctly OPEC did a million barrel a day cut in production in Oct. 2006 and then followed up with more cuts until they had cut almost 2 million barrels a day. Yes these cuts might have hidden underlying decline rates, yet in other cases the EIA has published charts showing some OPEC countries in no decline and steadily increasing production.
I recall a 2006 0r 2007 online magazine article where a UAE official indicating they were expecting to surpass 3 million barrels a day close to the turn of the decade. The article has since lost its search ranking and cannot be located. Am not sure how you can make these decline curves without releasing data. If you do not have data, how can you make a decline curve?
This article is hard to discern:
http://www.energyintel.com/DocumentDetail.asp?Try=Yes&document_id=224007...
OPEC forecasted a 1.9 million barrel per day increase in oil supply for 2008. Who is lacking data in this case; you, or them?
And KSA has promised to increase production to 12 mbpd at various times over the last 4 years yet never done so. OPEC is like KSA - their promises are largely political hot air. The only way to track OPEC is to see what they actually do and to follow price. OPEC's promised 1.9 mbpd increase might occur but then again it might not. Based on OPEC's past history, I would not even bet your money on that increase, let alone my own.
And KSA has promised to increase production to 12 mbpd at various times over the last 4 years yet never done so.
Production, or production capacity? I have seen them say they wanted to have a couple million barrels of spare capacity, but I don't ever recall them saying they would be producing 12 mpbd.
Yes, it was production capacity, Robert. But in the face of Rita/Katrina, KSA did not produce more despite saying they would. Multiple times as we hit $70 per barrel, KSA did not produce more despite decrying $70 oil. And then again the same story at $80 oil, and again at $90 oil.
At some point their claims of spare capacity get completely discounted by the market. In other words, put up or shut up. KSA has failed to put up when the chips were down, placed by KSA's own words.
I don't believe KSA currently has 12mbpd capacity or ever had 12mbpd capacity. And even if they did, if they are unwilling to use it, does it even matter? For all practical purposes, KSA's claimed productive capacity does not even exist.
Tell me, what good is spare capacity that you refuse to use even when your own (prior) words say it should have been used?
But in the face of Rita/Katrina, KSA did not produce more despite saying they would.
I have covered this ground as well. They said "we will produce more if someone asks for it." The question is, did anyone ask for it? To this day, while a lot of people act incredulous at that question, nobody has ever been able to point to a single instance where a customer asked for more oil, but was denied.
Remember, crude oil stocks were not low following Katrina. We had a lot of refineries knocked out, which knocked out a lot of crude demand. It was finished product stocks that dipped low. Again, if you are looking at crude inventories, it doesn't appear that there would have been a huge demand for crude right after the hurricanes. Inventories in Q4 2005 were higher than they were in the previous 3 years. See the inventories:
http://tonto.eia.doe.gov/dnav/pet/hist/wcestus1w.htm
And even if they did, if they are unwilling to use it, does it even matter?
Comments I have seen have suggested that they would only max out production in case of a true emergency; say a war breaks out in Iran and oil stops flowing. One thing is known: They have spare capacity. If they didn't their production would be falling each month. What is not known is how much.
It doesn't look like it.
Take a look at the weekly price data for Saudi Light; the price was rising through August, peaked in the week of the hurricane, and fell for the next few weeks.
If there was demand for more Saudi oil, why was the price of it falling?
Last time this came up, I found weekly production data for KSA, and it's basically a mirror of the price: they increased production for a couple weeks after the hurricane, prices fell, and so they took production back down to its previous level (and prices then returned to their previous level, briefly, before falling for the winter).
It's not conclusive, of course, but the evidence does seem to suggest that KSA started producing that extra oil they'd promised, found nobody really wanted it that much, and so stopped producing extra. Really, it doesn't make a lot of sense that they'd need to pump out lots more anyway - by the time anything extra they pumped could get to the US, weeks later, the problem of disrupted supplies would be largely over.
1. Oil is supposed to be fungible. Or so all the free market cheerleaders keep telling us...
2. US production fell by 1.5 mbpd, meaning the world was suddenly short by 1.5mbpd. Much of that 1.5mbpd was made up by other nations exporting oil or finished oil products to the US.
3. Ergo, if oil is fungible and if demand was down by 1.5mbpd, there was a clear global niche to fill with 1.5 mbpd more production. KSA did not fill that niche. Instead they allowed global prices to rise drastically.
From your own link used elsewhere here today, we see that world oil prices shot up after the hurricane from $52.24 at the end of July 2005 (before the hurricane) to $60.75 by the first week of September 2005. And then from your KSA light price link we see:
While prices did fall they did not fall anywhere near the prior price, meaning that KSA could easily have reaped a windfall at $57-$59 per barrel, yet they did not. Prices were UP, not down. Up considerably, yet KSA failed to respond.
Further, let's look at KSA production around that time period. I've been unable to find weekly data but weekly increases should roll into the monthly total and show an increase for the month as a whole. Yet monthly production data from the EIA for KSA show no change at all from May 2005 until October when they cut production despite oil prices still being well above summer norms due to the hurricane.
Now let's look further at that data! From December 2005 through August 2006, KSA light oil prices increased from $49 per barrel to over $71 per barrel. Yet KSA cut production! They cut production over that exact same time interval from 9.5 mbpd to clear down to 9.0 mbpd in September. So it is a FACTUALLY INCORRECT STATEMENT to say that KSA only cut when prices were going down and increased when they were going up. It was this exact cut in the face of a huge price increase that gave many of us reason to worry about KSA's ability to deliver oil in a timely fashion.
So let's fast forward to 2007. KSA light increased from $49 on 2/2/2007 to over $73 by 8/3/2007. Yet KSA production remained flat. No increase at all. Only from the 8/3 date going forward to 12/28/2007 when KSA light hit $91 per barrel do we finally see an increase and an increase of just 8.6 to 9.0mbpd.
This does not look to me like someone taking advantage of high prices to make money. It looks to me like someone struggling to make money when it's laying in their front yard.
Ergo, if oil is fungible and if demand was down by 1.5mbpd, there was a clear global niche to fill with 1.5 mbpd more production. KSA did not fill that niche.
But they don't sell to the spot market. They sell to their specific customers. That's why I kept asking for someone to show me that one of their customers asked for crude at this time, but was denied. It is simply speculation to suggest that they were powerless to produce more oil in the wake of Katrina.
Now let's look further at that data! From December 2005 through August 2006, KSA light oil prices increased from $49 per barrel to over $71 per barrel. Yet KSA cut production!
I have to cry foul on this one. That's cherry-picking the data. You have picked a local minimum price and run it out to a local maximum price, and you ignored a lot of data. In fact, you ignored data damning to the case you are arguing. What happened after the price hit $70? Prices fell back down and closed the year close to where they started the year. In other words, price fell despite the production cuts! And if you look at 2006, the really big production cuts happened between August and the end of the year - right when the price was falling. Further, prices continued to fall into 2007, and between August 2006 and February 2007, they cut production by 700,000 barrels, yet the price fell from $71 all the way to $46 in January 2007. This is significantly less than the price in January 2006, despite massive production cuts. Yet that is also when the production cuts stopped.
Look at 2006 as a whole. Saudi production falls by 650,000 barrels, with the bulk of the cuts coming as prices were falling. The price in December closed at $2/bbl higher than it was in January. What does that tell you, in the context of supply and demand? And why did prices fall sharply as Saudi made their sharpest cuts?
I think the market at the time validated Saudi's logic. However, I think they made one cut too many, and then left the cuts in place too long before raising production back up (if your goal is to avoid $100 oil).
The price for their oil fell, for two weeks straight immediately after the hurricane. To say that prices were rising drastically is simply false.
Uh, dude, the hurricane was at the end of August. The prices in July are irrelevant.
...while prices had been falling and continued to fall.
You keep harping on and on about what prices had been months prior to the production cut. Why are the prices in summer relevant to what the level of production should be in October?
Like RR said, you're cherry-picking data to try to make a story that simply isn't there.
If you're going to claim that the price of oil 6 months ago should control the level of production now, you're going to need to give people a reason to believe your assertion. On the face of it, it's laughable.
Yes, that's why OPEC is known as a "cartel" with "quotas".
OECD stocks remained ample during that period, with the main concern being gasoline stocks in the US (which KSA could do nothing about). With major consumers having plenty of oil (judging by crude stocks), KSA adding more production would simply lower the price of oil, which is exactly what OPEC's quota system is in place to prevent.
Given the low short-term price elasticity of oil, argued to be about 20:1 in a previous story here, a 0.5Mb/d increase in production would be expected to lead to a 10% price decline, which would leave everyone on OPEC earning less, including Saudi Arabia. If the price of oil wasn't hurting the world economy - and it didn't seem to be last summer - why would they want to do that?
I was pointing out facts that verified, independent of the hurricane, that KSA fails to respond directly to the market, as per your claim. When I make that demonstration, you fall back to another old saw - they don't respond to the market because they are a cartel. Man, get your story right. Which is it?
Like RR said, you were cherry-picking data to try to make it fit your story. That's not "facts".
You're trying to make a case based on numbers that are from months before the fact. Based on what do you assert that the price of oil in summer should control the level of production in October?
You have misunderstood what I was saying.
I pointed out that the Saudi production cuts people here made so much fuss about all came in the context of falling prices. Whether or not they'd choose to raise production in the face of rising prices is a separate issue.
One argument - which the data supports - is that they had no economic incentive to raise production, since the price elasticity of oil is low enough that doing so would lower their profit.
So how about you address that argument - or any of my other arguments - rather that simply throwing out insults and intimations of malfeasance? Are you unable to address a simple argument without resorting to insults and rhetoric? Can you not get control of your emotions and be civil and rational?
It might not make your positions any more true, but it'd be substantially less disruptive to the tone of discussion here. Your repeated abuse and insults are, let me remind you, against the reader guidelines. Please, let's simply engage in civil, rational, respectful discussion.
production in Russia is declining. For ex. Sakhalin-1 production (the major sourse of increase of production in 2007) will fall by 25%(sic!) in 2008, producing 7,9-8,2 mln t per year instead of 11,2 in 2007.
http://www.sakhalin.info/news/48082/
overall russian production declined 0,7% in January 2008
Here's a link to English translation (Google translate) as the original is in Russian.
The EIA has shown 14 months flat production data for Russia, from 10/06 to 11/07 inclusive, with production between 9.4 and 9.5 mbpd (C+C). If, as I anticipate, Russia shows an annual decline in production in 2008, the decline rate could be pretty severe. Khebab's most recent work shows a projected 10 year production decline rate of -5%/year plus or minus 2%.
The translated article also validates your prior claim that some people questioned where you said Russian oil production in January was down from January 2007.
Not only is Sakhalin 1 in decline but so is the old giant field Samotlor, discovered in 1965.
http://www.tnk-bp.com/operations/exploration-production/production/tnk-b...
In Feb 07, Samotlor produced about 0.66 mbd, and in Dec 07, 0.63 mbd, almost a 5% decline.
Overall, for TNK BP liquids production, Jan 07 was 1.44 mbd and Dec 07 was 1.41 mbd.
Both Figs 7 & 8 above show small monthly C&C declines for Russia and year on year growth of only 0.2 mbd.
Chris Weafer, UralSib chief strategist,
http://www.prime-tass.com/news/show.asp?topicid=65&id=433364
says in Feb 08 that
Based on the above, I think that Russia's C&C production rate will probably decline slightly in 2008, to be followed by steeper declines, as shown in the chart. The left axis is production in kbd, shown by the black line and discoveries are shown by the right axis.
http://anthropik.com/wp-content/uploads/attachment-0006.jpe
http://anthropik.com/2007/06/the-collapse-of-the-soviet-union/
naturally. as for companies distribution:
Surgutneftegaz - decline started in 2007 (-1,39% to 2006)
Lukoil - rise of 2,5% instead of earlier prognosis of 4%
Slavneft - flat
Here is another oil expert predicting peak.
Charles T. Maxwell, senior energy analyst at Weeden & Co., known as the “dean of energy analysts"
http://www.weedenco.com/Research/max4.html
said in Feb 2008, in a four part series
http://energytechstocks.com/wp/?p=819
http://energytechstocks.com/wp/?p=824
http://energytechstocks.com/wp/?p=831
http://energytechstocks.com/wp/?p=834
http://seekingalpha.com/article/64765-peak-oil-the-next-5-years
For context, note that $300/bbl is about $240/bbl in inflation-adjusted dollars, which corresponds roughly to $7/bbl gasoline.
Which is less than the Brits and the Dutch already pay.
"Stomped", then, may be a bit of hyperbole.
Stomped is the appropriate term. The suburban sprawl in the USA dwarfs every other country. Britain is the equivalent of NYC and surrounding states. Cal, Florida, Arizona, Georgia, Texas-this magnitude of sprawl doesn't exist anywhere else on the planet.
The apropriate term is demand destruction.
Good one. Starving people without money no longer "demand" food.
Please explain how you get from "the US will see gas prices lower than what Europe already sees" to "people will starve".
As per the political correctness discussion, "demand destruction" is a classic politically correct term. The "want" or "demand" hasn't gone away in a magical invisible hand fashion-it simply cannot be satisfied. How about "dissatisfaction increase"?
You avoided answering my question.
I don't care what you call demand destruction; my point of contention is your leap from "people using less gas" to "people starving".
If your intent was simply to point out that "demand destruction" means people can't do things they wanted to do (which everyone already knows), unfortunately what you wrote didn't make that clear.
I got curious about how the driving habits of Brits and Americans compare, so I did a little digging.
Brits log 310B vehicle miles on a population of 60M, or 5,200 per person. Americans log 3T vehicle miles on a population of 300M, or 10,000 per person.
2/3 of the 1.8Mb/d the UK consumes is for petrol and diesel, or 7.3bbl per person per year. 65% of the 20.7Mb/d the US consumes is for petrol and diesel, or 16.4bbl per person per year.
Accordingly, if we assume that the price of petrol/diesel is the only factor in determining how much people drive, we would expect moving from $3/gal to $7/gal to remove 80% of the consumption difference vs. the $8/gal the Brits pay. Accordingly, the theoretical target is (16.4-7.3)*0.2+7.3 = 9.1bbl/person/yr.
First, note that US fuel efficiency standards will increase by 40% over the period in question. As those newer cars progressively work their way into the fleet and older (typically less efficient) cars are retired, the overall efficiency will increase, even in a business-as-usual setting. Taking into account only that and flat miles driven, US consumption per person is likely to be about 25% lower by that point, or 12.3bbl/person/yr.
To get down to the "target" of 9.1, then, US drivers would need to reduce their vehicle miles driven by about 25%.
Gas prices reducing miles driven by 25% over a 12-year period does not amount to "stomping on" personal mobility, in my opinion; it's just 2% per year, which is about the rate we're already seeing, at least in the short term. I suppose it's a pretty subjective term, though, so in terms of what constitutes "stomping", your mileage may vary.
Thanks for your latest update Ace. Do you include the work of the Oil Megaproject wiki in your bottom-up estimate of future production?
Given that depletion appears to be running at 4 MB/day per year, the Oil MegaProject wiki implies a substantial increase in capacity in 2008 and 2009, steady in 2010 and 2011, and a smaller increase in 2012.
What am I missing?
Yes, the Oil Megaproject Wiki forms an integral part of the bottom up forecast. However, the production profile of each project is used not just the peak production.
Please read this comment which I made yesterday in Nate's story.
http://www.theoildrum.com/node/3627#comment-305051
part of which is reproduced here
Thanks Ace. That clears up a point that has been bothering me for a while.
And thanks also for the very detailed work you put into building these models.
The UK Guardian is ringing more alarm bells about peak oil.
A Guardian journalist, Ashley Seager, on Feb 18, 2008, said that "I don't want to get into an argument about whether peak oil is upon us but you have to admit that it could be".
Reasons to see red over green energy - Government apathy sabotages Britain's shift to a low-carbon economy
http://www.guardian.co.uk/environment/2008/feb/18/energy.economy
I know this is going to sound a little callous but it appears to me that the only way to get people to listen to your views these days is by becoming stinking rich -at which point you can say "Well it was obvious to me and I followed my beliefs, look at my track record". A fat bank balance beats years of might-be might-not-be prognostications any time.
Then during the subsequant phases of energy decline (after $200+ oil is mincing peoples living standards) they will be more obliged to listen to any advice you may have to offer on a range of subjects...
I'm sure if Warren Buffet started talking openly about 'Peak Oil' and how he is shifting his asset allocation a lot more people would sit up and take note including governments -a lot more than listen to humble geologists or newshounds that is...
Nick.
Back at the time of the first Iraq war... I traded the petroleum futures.. using seasonals...
One of my best trades was to BUY crude on the mid-winter low.
The other was to BUY heating oil on the autumn low.
The last was to BUY gasoline on the mid-winter low.
The Midwinter trade was generally up through Memorial Day
The Autumn trade was generally up through New Years.
Well, we put in the mid-winter low at ~ $85 or so...
If we have normal seasonal factors... and the recession normally would reduce them... crude should be UP from here to Memorial Day....
I believe that the impact of TATA's nano car... and Chinese automobiling... and Russian automobiling... means less crude for the US and more for them....
Look out below.............
INDY