Saudi Arabia: An Attempt to Link Oil Discoveries, Proven Reserves and Production Data
Posted by Sam Foucher on January 3, 2008 - 10:32am
This article is
an attempt to apply the Hybrid
Shock Model (HSM) on Saudi
Arabia's oil
production. In a nutshell, the HSM is
trying
to model the observed production profile from the discovery curve by
simulating the different phases involved in the development of
oilfields (initial discovery,
planning, build, maturity). The HSM is a variant of the Shock Model
initially proposed by WebHubbleTelescope. One of the
byproduct of the
HSM is the
instantaneous reserve addition (noted R).
I based the following work on the assumption that the value for R should be
somewhat close
to available proven reserve figures.
Of course, for Saudi Arabia available proven reserves are highly
suspicious because of huge overnight reserve increase among OPEC
members in the 80s without any new discoveries.
Therefore, I will consider three increasingly conservative proven
reserve hypothesis: 1)
PR1: the official
numbers as published by BP; 2) PR2: spurious increase are removed; 3)
PR3: as
proposed by Euan here, cumulative production is
also
removed. The volume of recoverable oil from Ghawar is then inferred
from the HSM based on the discovery curve from IHS as the value that is
minimizing the error between proven
reserves and simulated reserve additions. My conclusions are
the
following:
- No reasonable value for Ghawar size (i.e. < 150 Gb) is supporting the official proven reserve figure.
- The most likely size for Ghawar is 109 ± 10 Gb and the simulated reserves are matching closely the corrected proven reserves (PR2).
- Production capacity could reach a maximum around 10.5
± 0.5 mbpd (crude oil + Natural Gas Liquids) between 2010
and 2013.
Discovery Data
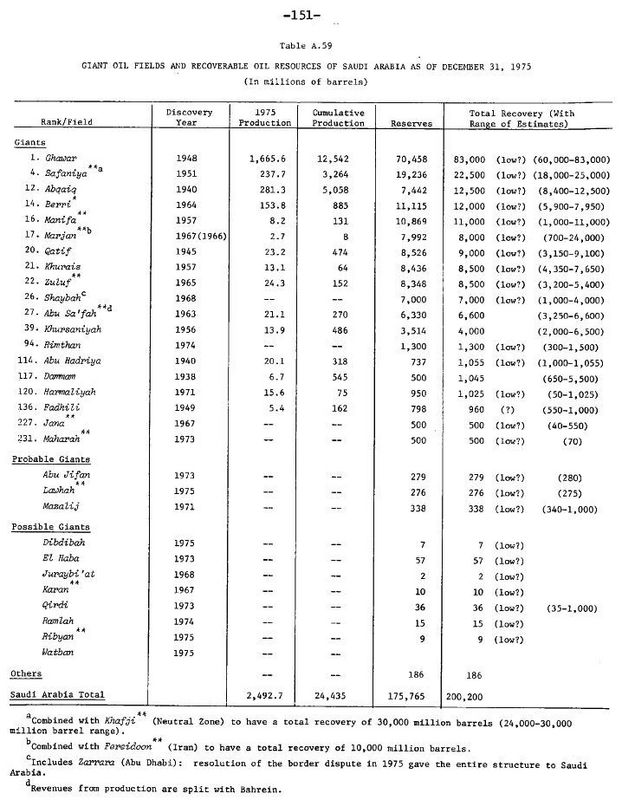
Complete and accurate discovery data for Saudi Arabia is impossible to obtain. However, because Saudi Production is coming from a handful of giants and super-giants (Saudi Arabia has only about 80 oil fields), we can reconstruct a rough discovery dataset.| Field | Discovery Date | Production Start |
(a) | (b) | (c) | (d) | (e) | (f) |
| Dammam | 1938 | 1938 | 1.05 | 1.045 | 0.325 | 1.5 | 1.5 | |
| Abu Hadriyah | 1940 | 1963 | 1.76 | 1.055 | 1.840 | 1.8 | ||
| Abqaiq | 1940 | 1946 | 12.8 | 12.5 | 5 | 13–19 | 12.8 | 15.0 |
| Qatif | 1945 | 1951 | 3.2 | 9 | 8.62 | 6.0 | 6.0 | |
| Ghawar | 1948 | 1951 | 83 | 83 | 85 | 66–150 | 82.0 | 105 |
| Fadhili | 1949 | 1964 | 0.95 | 0.96 | 1.0 | |||
| Safaniya-Khafji | 1951 | 1957 | 32.3 | 22.5 | 41.16 | 21–55 | 36.1 | 27.23 |
| Khursaniyah | 1956 | 1965 | 2.3 | 4 | 3.33 | 4.1 | 4.1 | |
| Khurais | 1957 | 1963 | 8.7 | 8.5 | 16.78 | 13–19 | 8.5 | 8.7 |
| Manifa | 1957 | 1964 | 17.1 | 11 | 22.79 | 11–23 | 17.0 | 17.1 |
| Abu Safah |
1963
|
7.81 | 6.6 | 6.15 | 7.5 | 7.85 | ||
| Berri | 1964 | 1967 | 7.3 | 12 | 14.94 | 10–25 | 12.0 | 14.0 |
| Zuluf | 1965 | 1973 | 10.64 | 8.5 | 18.23 | 11–20 | 10.6 | 14.0 |
| Fereidoon-Marjan | 1966 | 10 | ||||||
| Marjan | 1967 | 8 | 9.26 | 4.575 | 4.0 | |||
| Janan | 1967 | 0.5 | 0.5 | |||||
| Karan | 1967 | 0.01 | ||||||
| Shaybah | 1968 | 1999 | 5.71 | 7 | 14-19.82 | 7–22 | 7.0 | 7.0 |
| Barqan | 1969 | 0.5 | 0.250 | |||||
| Mazalij | 1971 | 0.63 | 0.338 | 0.675 | ||||
| Harmaliyah | 1972 | 1.03 | 1.025 | 1.81 | 2.0 | 2.0 | ||
| Abu Jiffan | 1973 | 0.5 | 0.279 | 0.560 | ||||
| Maharah | 1973 | 1.1 | 0.5 | 0.5 | 1.1 | |||
| Qirdi | 1973 | 0.036 | ||||||
| El Haba | 1973 | 0.057 | ||||||
| Rimthan | 1974 | 1.3 | 0.6 | |||||
| Lawnah | 1975 | 1.17 | ||||||
| Dibdibah | 1975 | 0.007 | ||||||
| Hawtah Trend | 1989 | 1994 | 1.97 | 2.0 |
The size estimates for the top 12 fields are shown on Figure 1.

Fig 1. Saudi Arabia Top 12 fields. Click to view a SVG image.
In addition, I will use an oil discovery dataset presumably from IHS (believed to be for crude oil + condensate + NGL) and kindly provided by Rembrandt Koppelaar and shown on the figure below. Ghawar is 120 Gb and the total resource base is 309 Gb in 2005.
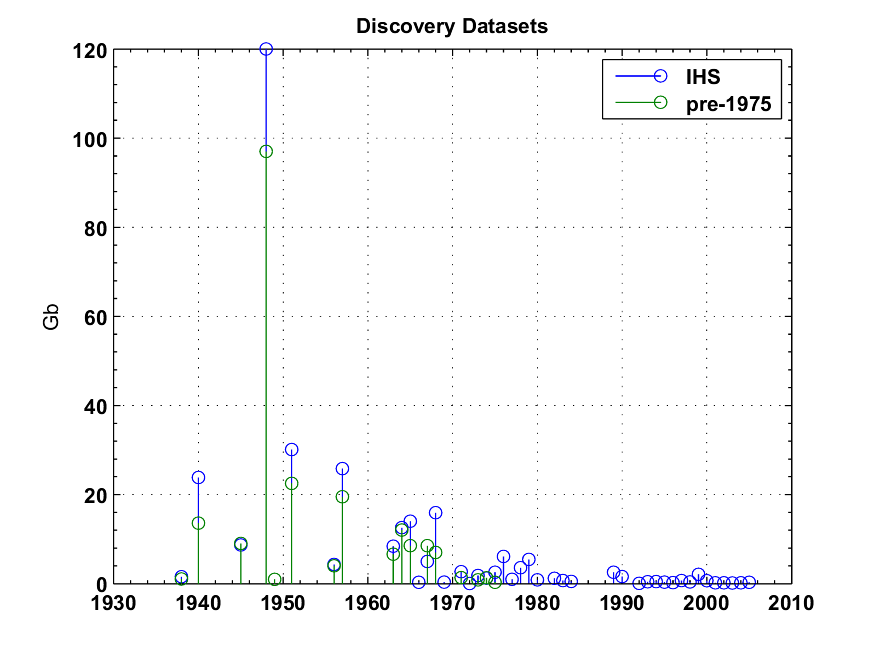
Fig 2. Discovery datasets for Saudi Arabia.
Proven Reserves
I will consider three cases for the proven reserves (a high case, a middle case and a low case):- PR1: Official proven reserves as published by BP in their annual statistical review.
- PR2: Official proven reserves corrected for anomalous reserve increase ((i.e. mainly removing the 85.4 Gb increase in 1988).
- PR3: Official proven reserves corrected for anomalous reserve increase and cumulative production as proposed by Euan here.
Model Inference
We are trying to answer the following question: What is the more likely value for Ghawar ultimate recoverable oil volume according to the Hybrid Shock Model? In order to answer that question, we will consider Ghawar size as a parameter of the model. The quality of the match between predicted reserves and actual reserve values under the different scenarios will be our measure of likelihood of our model parameters.In addition
to Ghawar size, the
main parameter of the HSM is the λ parameter
which is the sum of the three individual λ associated with
each
oil production cycle (i.e. λ=λbuild
+
λfallow + λmature).
This parameter is controling
the shift between the backdated discovery
curve and the actual reserve additions ready to be produced (see blue
and green curves on Figure 5). A small
λ value means that
new
discoveries are immediately developped and new supply is coming online
very rapidly. Conversly, a large value means that new discoveries are
taking a long time to be brought online and reserve additions will be
small and spread over a long period of time. For the case of Saudi
Arabia, it is difficult to put a prior on λ values, we can
expect a fairly large value because of the harsh environment
and the size of the projects (e.g. Haradth development in three phases
took nearly ten years (build phase) for a production capacity of 900
kbpd). Values for
Ghawar size were taken
between 50 and 150 Gb and
λ between 1 and 24 years, it results in the
following RMS surface:
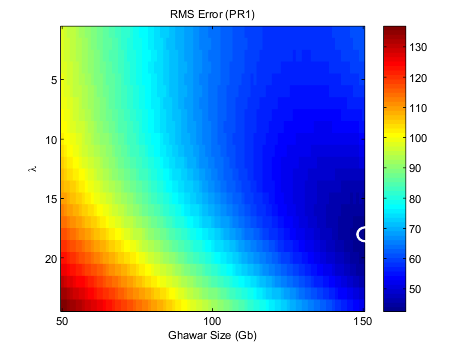
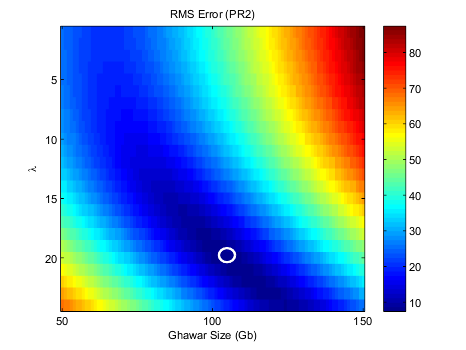
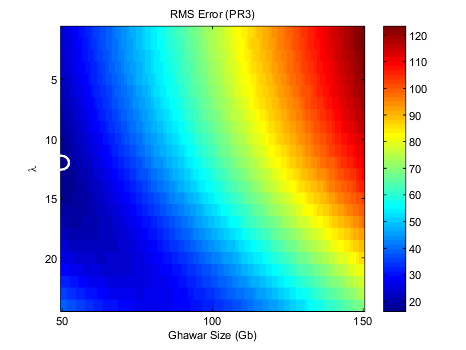
Fig 3. Minimum prediction error surfaces for reserve numbers as a function of Ghawar size and λ under the three proven reserve hypothesis considered.
We can observe a nice
valley of low RMS values for PR2 and a
minimum for
λ=21 years and Ghawar URR at 109 Gb. The error surfaces are
further summarized on the chart below by taking the minimum error value
along the λ axis. We can see that the PR2 hypothesis
generates
the smallest error values across all the parameter space. In order to
reach the same error level, the PR1 hypothesis would require an
impossibly high value for Ghawar (~200 Gb) and lambda
(λ>40 years) and PR3 a very small value (~30 Gb)
and λ~1 year. A confidence interval can be roughly
estimated by taking the values corresponding to 90% of the
minimum error which gives 109 ± 10 Gb.
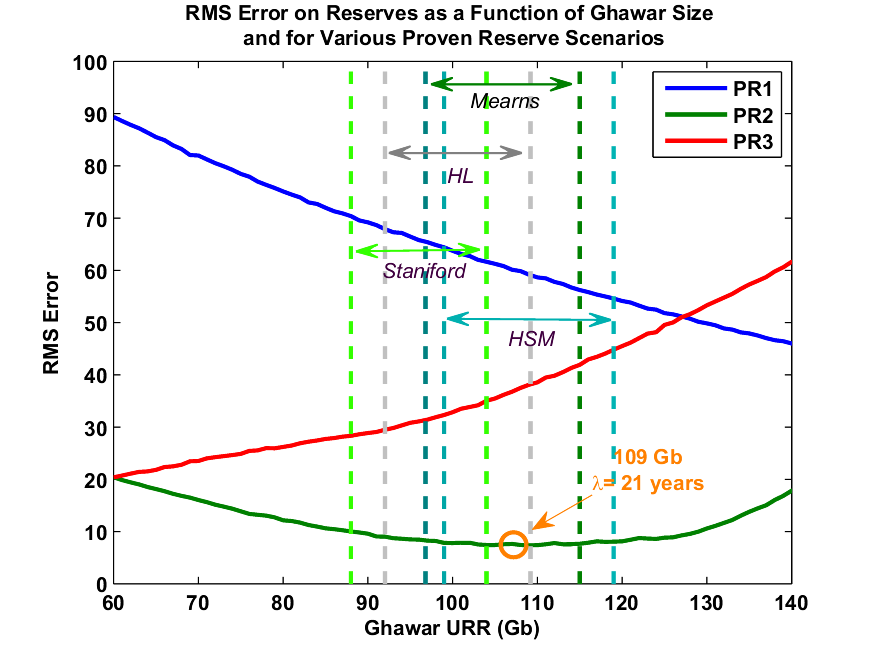
Fig 4. Minimum prediction error for the reserve values for each value of Ghawar size and different Proven Reserve scenarios. The minium error value is for Ghawar at 109 Gb and λ=21 years assuming the middle case (PR2) for the proven reserves. Various lower/upper bound estimates available are shown as vertical dotted lines. Click to Enlarge.
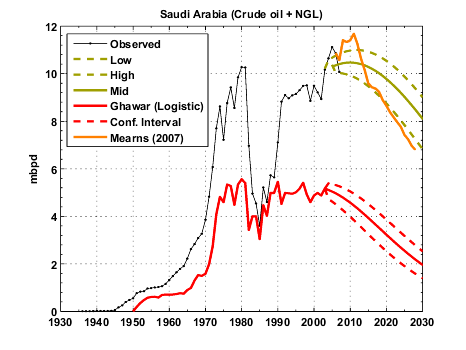
The corresponding HSM production capacity forecast is given on the Figure below and is fairly more optimistic than Euan's forecast for instance. The URR assuming no new discoveries is around 300 Gb (crude oil + NGL) and no decline in production capacity is seen before 2015.


Fig 5. HSM output for Ghawar at 109 Gb and λ= 21 years. Note the close match between simulated reserve additions (in red) and PR2 proven reserves (green dotted line). Euan Mearns's forecast is explained here.
Modeling Non-Ghawar Production
Because Ghawar is such a dominant (and old) feature of Saudi Arabia production, I will model separately the contribution from Ghawar (as a logistic decline as explained in a previous post) and the contributions from the other fields. We can see on Figure 6, that the contribution from giant fields is overwhelming. and amounts to about 170 Gb of the 190 Gb of non Ghawar total discovery volume.
Fig 6. Saudi Arabia giant field contributions, the IHS discovery dataset is used and giant fields contributions are identified using their discovery date (see Table I).
It's obvious that not all the small discoveries will be developped. Therefore, in order to simulate the non Ghawar production, I considered two cutoff values for the discovery size: 1 Gb and 5 Gb. This result in two different forecasts for the non Ghawar production (green and blue lines on Figure 7).
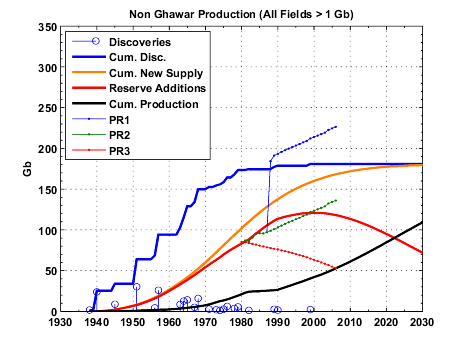
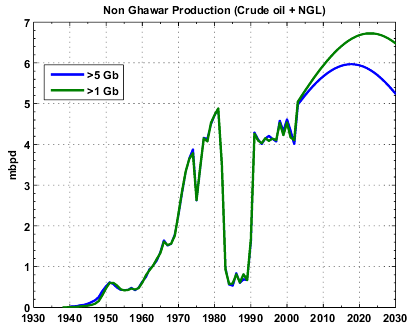
Fig 7. Discovery curve and various cumulative quantities from all the fields minus Ghawar given by the HSM (left or top) and the resulting production capacity forecast assuming a logistic model for Ghawar.
The result of the two stage modeling is shown on Figure 8 below (top or left chart). Compare to the previous result, we get almost a flat production line with a decline starting between 2010 and 2012.

Fig 8. Ghawar-logisitc + HSM (left or top chart) and HSM on total production assuming different field size cutoff values (right or bottom chart).
What's left to be discovered?
Volumes of new discoveries have been anemic since the 80s and there is no reason to believe that this trend will change in the future despite speculations that significant fields are waiting under the empty quarter. I quote Rembdrandt:The USGS noted a potential of 136 billion barrels of conventional oil + NGL to be discovered between 1996 and 2030 in Saudi Arabia (9% of the total of 939 billion barrels). Between 1 January 1996 and 1 January 2006 approximately 5 billion barrels have been discovered in Saudi Arabia. Since the nationalisation in the '70s foreign companies could not drill in the country. Only since 2004 have several western oil companies have been allowed to drill for gas in the Rub Al Khali Region (empty quarter), which is positioned in the south and south/west.Based on the IHS discovery profile for the years 1981 to 2005 and using a boostrap technique, we can expect the annual discovery rate to be between 0.32 and 0.81 Gb per year (95% confidence interval) which amounts to a total of 8-21 Gb of Yet-To-be-Find between 2006 and 2030.
In Summary
We proposed to apply the Hybrid Shock Model in order to retrieve the most likely Ghawar size value under different proven reserve scenarios:- The most likely range for Ghawar is 109 ± 10 Gb which is close to Euan Mearns's estimate.
- Among the three proven reserve scenarios, the PR2 (i.e. corrected for spurious reserve jumps) is the most likely. The official proven reserves seem to imply that Ghawar is around 200 Gb with a very high value for the mean production lag time ( λ>40 years).

Fig 9. Summary of various forecasts for Ghawar (derived from Stuart Staniford's original compilation, details here). Click to view a SVG image.
The table below is summarizing the different results:
| Proven Reserves | Ghawar size (Gb) | Non Ghawar resource base (Gb) | YTF (>2006) | URR (Gb) |
|---|---|---|---|---|
| PR1 (264 Gb) | ~200 | 190 | 8-21 | 402 |
| PR2 (174 Gb) | 109 ± 10 | 313 ± 17 | ||
| PR3 (91 Gb) | ~30 | 232 |
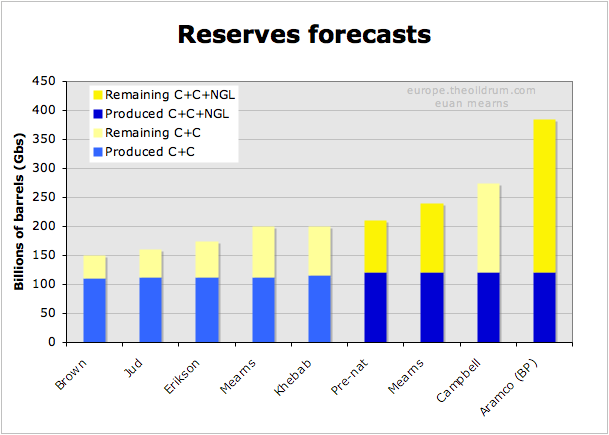
The URR is forecasted to be around 313 Gb assuming that all the small fields will be developped (field size cutoff at 0). However, if we assume that only fields above 1 Gb will be developped, we get an effective URR around 290 Gb. The chart below is summarizing different forecasts (it is an updated version of Euan's chart). The HSM is a little bit higher than Campbell which is for crude oil + condensate (C+C) only.

Fig 10. Summary of various forecasts for Saudi Arabia (derived from Euan Mearns's compilation). Click to view a SVG image.
The HSM applied on the total production (Figure 5) does not show any decline in production capacity before 2015-2016 with a maximum capacity at 11.5 ± 0.25 mbpd. The two stages production modeling where Ghawar is modeled separalely (Figure 8) is a little bit less optimistic and shows a decline in production between 2010 and 2013 with a maximum at 10.5 ± 0.5 mbpd. The model does not support claims that production capacity could go beyond 12-15 mbpd however it seems to indicate that production could be maintained around 10 mbpd for a long period of time. I find it intriguing that the HSM is confirming values derived from other orthogonal methodologies and seems to put together nicely different pieces of the puzzle (i.e. Ghawar size, corrected proven reserves and Saudi Arabia discovery data). Note that an eventual reserve growth contribution has not been taken into account in this work.
Further articles about Saudi Arabia:
by Stuart Staniford
- Saudi Arabia and Gas Prices
- Depletion Levels in Ghawar
- The Status of North Ghawar
- Further Saudi Arabia Discussions
- Water in the Gas Tank
- A Nosedive Toward the Desert
- Saudi Arabian oil declines 8% in 2006
by Euan Mearns
- Saudi Arabia - production forecasts and reserves estimates
- Ghawar reserves update and revisions (1)
- GHAWAR: an estimate of remaining oil reserves and production decline (Part 2 - results)
- GHAWAR: an estimate of remaining oil reserves and production decline (Part 1 - background and methodology)
- Saudi production laid bare
- Saudi Arabia and that $1000 bet
by Heading Out
- Simple mathematics - The Saudi reserves, GOSPs and water injection
- Of Oil Supply trains and a thought on Ain Dar
by Ace
- World Oil Forecasts Including Saudi Arabia, Kuwait and the UAE - Update Oct 2007
- Updated World Oil Forecasts, including Saudi Arabia
- Saudi Arabia's Reserve "Depletion Rates" provide Strong Evidence to Support Total Reserves of 175 Gb with only 65 Gb Remaining
- Further Evidence of Saudi Arabia's Oil Production Decline
by Khebab:
- The Hubbert Linearization Applied on Ghawar
- An Attempt to Apply The Parabolic Fractal Law to Saudi Arabia
by Luis:
Saudi Arabia: An Attempt to Link Oil Discoveries, Proven Reserves and Production Data
PDF version
43 comments
Saudi Arabia: An Attempt to Link Oil Discoveries, Proven Reserves and Production Data
PDF version
43 comments
“Any coward can fight a battle when he's sure of winning, but give me the man who has pluck to fight when he's sure of losing. That's my way, sir; and there are many victories worse than a defeat.”
—George Eliot
Contact
- Content: editors at theoildrum dot com
- Tech support: support at theoildrum dot com
License

This work is licensed under a Creative Commons Attribution-Share Alike 3.0 United States License.
Matt Simmons quoted a retired Aramco executive as saying that, in his opinion, there was no way that the Ghawar URR would exceed 70 Gb. Of course, Saudi Aramco is claiming that horizontal wells have boosted the recoverable reserves in the field, but that is what Shell though they had done at the Yibal Field, where they were expanding their surface facilities to handle an expected increase in oil production, when they were hit with an unexpected flood of new water, which is what I suspect happened at North Ghawar in 2006.
BTW, as an illustration of the conservative reserve scenario, could you post our updated Texas/Saudi graph (with 2006 and estimated 2007 Saudi data) on this thread?
The error bar on Ghawar is pretty high (almost 45% uncertainty!), even the cumulative production estimates differ significantly!
In attempting to come up with a correction for technical advancement I've come up with technology causing 50% higher extraction rates over a period of decades. Since Ghawar has been under water flood from the begining this would give a real URR of 60GB as the absolute minimum. Since the early water flood has probably also increased recovery say by 10% this gives 66 GB.
Which is inline with WestTexas's statements of 70 GB. Its my understanding that this can easily be modeled with the shock model if you add a depletion shock.
http://mobjectivist.blogspot.com/2005/11/can-we-delay-peak-by-upping-ext...
I think if you apply a few reasonable corrections for extra depletion then it will pull your URR estimates back in some. And as you can see steepens the post peak decline rates.
Note that at least in the case I showed the shock came late for Ghawar it was a early
shock and continued to date with the latest MRC well technology. That does not change the
analysis all that much.
Also it would bring the data in line with existing production but in this case the slowed declines right now are caused by technology not your reserve estimate. And the peak date is in the past and further more Saudi should be in steep decline by 2010 not just peaking.
But notice that if you do add in a technical extraction effect then you end up with reserve estimates probably being high. Especially reserve additions. Its a sort of chicken and egg problem newer technology has led to bolder reserve predictions yet has in general only increased depletion rates.
So I tend to go with the 70 GB for Ghawar and Saudia Arabia in obvious decline by 2010. And they could start down again any time within the next two years. I don't think the data justifies narrowing it down by much more but resumed decline by the end of 2008-2009 is quite probable.
Estimates for cumulative production for Ghawar (circa 2000) are already around 60+ Gb, so 70 Gb is awfully small for the URR. On the other hand, if we use the 173 Gb for the OOIP and an average of 40% recovery factor for giant fields, we get precisely 70 Gb for the URR. However, analysis produced by Euan and Stuart are suggesting that the average recovery factor for Ghawar is more likely around 60% due to the exceptional quality of the reservoir.
Khebab this is my point we are basically entirely dependent on technology.
And its a race between faster depletion rates and greater recovery.
How can we know that they will get a 60% recovery. The field is high quality but it has super K zones bypassed oil pockets etc. And furthermore we are really dependent on getting this extra 20% or a large portion of it at high flow rates.
In general the rate of production over the last several years and esp the coming ones will be very dependent on what we really have accomplished with advanced technology.
I'm very skeptical of the concept that we have both increased URR and gained the ability to get most of this extra oil out at high flow rates.
Basically todays production can be classified in three classes.
1.) New large fields ( small percentage of worlds oil )
2.) In field small field thin layer extraction mainly horizontal or smart completion on verticals.
3.) High water 90% cut what I call rock washing.
Ghawar is at the thin layer extraction phase. All my reading indicates this approach allows you to get the last of the oil out at low water cut and high flow rates for a short period of time.
Outside of tight formations not easily produced using verticals I've seen no evidence that recovery factors are higher.
Now for 3 you have two problems one the amount of oil you pushed out with water drive originally is dependent on the fractional flow of the formation along with physical cracking etc.
Ghawar may or may not have had higher recovery rates from the original water drive. I've not seen enough evidence to convince me either way on this.
Next for Ghawar the shear size of the the field makes moving to rock washing at high water cut a huge engineering project which the Saudis are not doing yet in all other fields a lot of the real URR increases are obtained at much lower production rates during this phase of the operation.
And I don't think they will unless oil remains in high demand for a long time. They are better off producing the other fields and coming back to the rock washing problem for Ghawar later.
What KSA is claiming is that the production mode of Ghawar magically moved almost 90% of the OIP.
One reason they are not in a hurry to wash rocks they don't believe they left a lot behind.
I don't buy it.
But thanks for your response I'm troubled that our future rests on our technical achievements which at least from my reading are subject to extravagant claims that don't match reality.
A lot of the work done on the oil drum really points out that the claims made by the oil industry are dubious at best. I've come to the conclusion that we have yet to fully determine how far off they really are. From what I can tell the current approaches are still giving numbers that can be up to 50% too high.
M King. Hubbert correctly predicted the peak of production for the US. He also predicted peak production for the world and a total URR of 1250 GB. Above ground factors around the peak year that Hubbert predicted of 1995 easily explain why we did not see peak production. The simplest is we hit peak production capacity but the world could not use all the oil. If you go back and try to figure production capacity around 1995 and remove the effects of preceding events like the Iran/Iraq war its obvious that the world could have hit close to 90-100mbd back in 1995.
No way in hell could we do that now.
But given technology and political factors our current high production even if the URR is around 1250 barrels is not unjustified. I'm 100% convinced that we are now able to produce a lot of the original URR estimates at high flow rates with current technology.
What I've not been able to convince myself of is that M K. Hubberts estimate for world URR is wrong. Ghawar points to the problem with even on field predictions of future production from about now on out are completely dependent on how much we have increased URR available at high flow rates.
Jeffrey, would you care to explain to our readers the difference between:
1) a horizontal well drilled into a thinned oil column in good quality reservoir late on in field life that is intended to lower water cut (e.g. N Ain Dar), and
2) a horizontal well drilled into a poor quality reservoir that may be impossible to develop using vertical wells (e.g. Haradh)
and then say if you think it is reasonable or not for Aramco to expand reserves of Ghawar in the latter case?
Of course there is some improvement in URR in the case of #2, but what will be the increase in URR from the entire Ghawar complex as Saudi Aramco is forced to produce a "poor quality reservoir?"
Why would Saudi Arabia be bothering with a poor quality reservoir if they didn't have to?
Estimates of URR involve a certain set of assumptions regarding the field itself (reservoir volume, perm., porosity, original water, residual oil), the technology to be used, and the developmental strategy. Few of those are known very well at the onset.
If the reservoir is well behaved (i.e. horizontal and vertical equilibrium is maintained), one would think it wouldn't matter if one used vertical or horizontal wells. Just phase out peripheral wells which are watering out, drill new ones updip, and drain it until all that's left is the residual oil. To get beyond that, you would need to do something to change the fractional flow characteristics.
Of course, none of their reservoirs are really well behaved in that way. With Ghawar, it is so big that it really didn't matter for awhile. Now, however, the real risk is stranding some of the oil due to uneven waterflooding. The developmental strategy is altered to mitigate that risk, employing new technologies along the way. If all goes well, they might get the original URR out after all. So, if you increase the reserves due to the technology, do you decrease the reserves before that due to the problems encountered necessitating the new technology?
Were any of their reserves (such as Haradh or Khurais) decreased after finding problems there, such as the fractures and Super-K in Haradh?
For example, this is from one of Saleri's presentations:
Abqaiq has produced more oil than were assumed to be reserves in 1950, so what was not known or assumed in 1950? What new insight did they have in the late 1970s and 1980s to justify the increase?
This is a good counter point to the technology effect and shows how it could be a large factor in the opposite direction. My best guess is what really happened with Abqaiq is addittional oil was found trapped in another level.
But Simmons has a great paper on this issue.
http://www.simmonsco-intl.com/files/Reserve%20Reporting.pdf
And another good one.
http://www.oilandenergytrends.com/ger/ger_saudi.asp
Note that if you read this second paper Oil And Gas Journal gives a reserve estimate of 64.8 for
Ghawar in the 1970's and it had been in production for some time at that point. This is inline with my estimate of 66 GB.
And of course Abqaiq at 7.5 GB note we have reason to believe the 1970's numbers are better than the 1950's these are very large fields and it takes time to delineate the field using traditional wells.
So does Abqaiq "Destroy" the concept ?
This paper
http://countrystudies.us/saudi-arabia/41.htm
Indicates to me that Abqaiq was in decline in the 1990's.
Its production profile with a URR of around 7-8 GB matches well with that of Phrudhoe Bay at 10-13GB. It's peak production was less. Also this is a old field and was under American production for a long time.
Now I've been unable to find any recent production data for Abqaiq. KSA does not seem to publish consistent per field production numbers if they do then I've not been able to find them.
To be blunt I don't believe this graph and cannot find any easy way to prove Abiqaiq could be this high given it was under American production control for most of its life history.
And whats know of its historical production fits with its estimated URR not with the one claimed in the graph when compared to similar sized fields.
Also note this paper was produced in response to Simmons work.
Another link about the paper.
http://saudioilproduction.blogspot.com/2007/04/fredrik-robelius-on-saudi...
I've read the Saleri paper in the past but cannot find a link to it now.
Overall its very optomistic.
Here is a link
http://www.csis.org/media/csis/events/040224_baqiandsaleri.pdf
And the Simmons paper at the same time.
http://www.csis.org/media/csis/events/040224_simmons.pdf
http://www.csis.org/component/option,com_csis_events/task,view/id,429/
Note the entire paper has been extensively discussed. And its not in agreement even with the results of the current posting.
I'll come out and simply say it.
The graph is pure bullshit.
I am a new poster on this site and I am definitely no expert on Ghawar, but the 64.8 billion barrel recovery estimate from the 1970's does not seem realistic at this point in time. Maybe I am confused here, but in figure 9 of Khebab's original post it looks like the average estimate for cumulative recovery to date is roughly 60 billion barrels and based on figure 8 Ghawar's current production is still roughly 5 million BOPD (or 1.8 GB per year), so unless the field entirely stops producing in the next few years it is easily going to pass the 64.8 GB ultimate reserve level. This does not mean it will not go into steep decline in the near future, but there will certainly be a very long production life left for this field although at a much lower rate.
The Abqaiq reserves plot above is just for Arab-D, so that wouldn't be the case.
From this plot, Abqaiq has produced some from other reservoirs and is predicted to provide a production bump in the future:
Both this and the previous plots came from Saleri's CERA Week presentation:
http://www.cera.com/aspx/cda/filedisplay/filedisplay.ashx?PK=29004
This chart is typical of reserve growth (i.e. better technology + better field knowledge/management), reserves have more than doubled since the 50s but have reached an asymptote since the 90s. If we believe the USGS model, Abqaiq reserves will grow forever simply because their empirical growth model has no asymptote. It shows also that reserve growth after 50 years is problematic unless the field has been mothballed or mismanaged for an extensive period of time.
But what goes into the original estimate?
By circling the thing with water injectors, they've effectively delineated the productive volume. Perhaps they obtained a better understanding of the contours of the Arab-D, but it's hard to believe they were that far off originally that would warrant a change. Perhaps they overestimated the residual oil and realized after watering out a few wells that more was extracted than predicted.
Most of the reserves increase predated extraction technology that would have made a difference, so it would seem to more likely to be reservoir geology issues as opposed to technology.
I can't figure out anyway to justify the numbers from this paper. Given the age of the field.
I can't find a history of production problems that could have been overcome later for example.
Abiaq seems to have a lot of above ground handling equipment not related to the field but piped in from elsewhere.
If you read the quotes I found about the field in the 1990's during the first Gulf War the indication was it still had producing wells but that that the production was not amazing.
Bingo :)
And the oil drum strikes again
http://www.theoildrum.com/story/2006/8/16/13213/1413
http://www.theoildrum.com/classic/2005/06/picture-of-depletion.html
Assuming I found the field in google maps. It looks like a lot of infrastructure is around but dunes seem to be covering a lot of the roads. I could be wrong.
Here is a map with the field
http://www.gregcroft.com/area1indexmap.ivnu
I think I'm in the right place here.
http://maps.google.com/maps?f=q&hl=en&geocode=&time=&date=&ttype=&q=Ghaw...
Probably. I posted an image with the field outline for Euan awhile back. Have a look:
http://europe.theoildrum.com/node/3100/252277
I am working on a post with a lot more satellite porn.
Looks similar can you post your google link for that image ?
I just noticed most of the roads where covered by dunes.
So HSM shows 2015 as projected peak for Ghawar and 2010/11 for KSA en total.
Does Mearns get his short term peak from the start of the 'new' projects coming on-line, and assume they will pump faster than desirable, resulting in reservoir damage?
So HSM shows 2015 as projected peak...
yes, the one-stage HSM is giving 2015 assuming that all the small fields are developed irrespective of their size.
Re: I believe you reversed the 5Gb and 1Gb legend identifiers in fig 7.
hmm... it seems right to me, only discoveries > 5 Gb means less production (blue curve).
Thanks, I realized what was meant a moment after posting and edited my comment, though not quickly enough. :-)
Any comment on my Mearns question?
UPDATE: Found the answer - Euan previously stated, "The new projects are all included at their nameplate capacity but are declined at a rate of 2% per annum thereafter" which seems to suggest damage of some sort, or else simply rules of thumb for secondary and tertiery methods. Euan?
http://www.theoildrum.com/node/2910
Euan has modeled Ghawar very differently (and probably more accurately) with three phases in Ghawar decline and a steep decline starting in 2012 related to a rapid decline of the South end.
Saudi Aramco itself has stated that normal decline in KSA fields is about 8% and with various techniques applied to existing fields, they lower this decline to 2% annually. I can't quickly find the reference for this on the computer I am currently using but this figure has been quoted and supporting URLs provided here at The Oil Drum numerous times in 2005 and 2006.
From want I've seen, the Saudis have to a large extent done everything within their power to take care of their reservoirs with the long term aim of maximising ultimate recovery. In between times there may have been exceptional periods when reservoirs were over produced, but its unlikely this will have caused lasting damage.
I think this over producing charge is a bit of a myth. It is in fact western companies that over produce in order to maximise short term profits at the expense of long term benefits. This is probably one reason why Saudi remains off limits to the IOC's.
http://science.reddit.com/info/64fyq/comments/
thanks for your support...
Khebab,
Not sure I understand what's being done here. At the beginning you state "the HSM is trying to model the observed production profile from the discovery curve by simulating the different phases involved in the development of oilfields (initial discovery, planning, build, maturity)". That looks like a discrete simulation. You go on to estimate URRs and remaining capacity from this model, via the RMS error plots.
But:
a) the method by which you estimate λ seems missing. How is any one combination of two independent factors more likely than another? Why would then be consistent? The error from what? The real production....which was governed by politics?
b) at no point, it seems, is the effect of Saudi voluntarily reducing production for years at a time factored in. Given the underlying assumption of URR, etc. are based on smooth geology-only constraints, how can the figures be expected to be right? Indeed, items like fig 7 ring alarm bells in my head - little production but continued addition of supply & reserves?
A good mechanism for sanity checking such a model is to unroll the input data to, say, 1970 and then see what the model predicts. Does it accord with reality and today's prediction?
I know I'm not always clear, I answer your two points:
a) λ is a parameter of the simulation as well as Ghawar URR, values for λ are taken in the 1-24 years interval. The error is the difference between simulated reserve additions (R) and actual proven reserve figures under various scenarios (PR1, PR2 and PR3). This error is our likelihood. Of course, published proven reserves are govern by politics that's why I assumed three different scenarios, both PR1 and PR3 lead to improbable values for Ghawar URR and λ.
b) how can the figures be expected to be right? don't forget, I'm talking about production capacity and not actual production. Nobody can predict how Saudi will constrain their production except that they have every incentives to maintain high prices and not to produce at full capacity. My main result is that 12 mbpd and plus of production cacpacity seems very unlikely.
a) My point is you have two independent factors which go to yield a third (reserves) that you then compare with published numbers. However, as you state, the published numbers themselves have potentially huge 'errors', or politics, associated with them, both in timing and magnitudes. Thus your derived minimum error point seems to measure how well you correspond to political statements, not what might actually be happening underground and when. As far as I can see, all you can really put a finger on is when actual production was greater than would be possible if particular factors were assumed - ruling those conditions out. You can set an envelope, but I still don't see how you can ascribe likelihoods within it.
b) But production capacity should yield a nice smooth bell curve (ignoring those political issues). However when reality is bought back into play actual production capacity should go outside this smooth bell shaped envelope on the tail side - as shut in production is available later than the model would predict. All of which raises a question on that 12mbpd statement doesn't it? If, say, Saudi shut in 4Mbpd of capacity, and then started it up again 5-10 years later, the peak capacity would look very different as would predicted reserves.
I think all we can really say with certainty is:
a) I agree that assigning a likelihood to a particular parameter require that you have some confidence in the observable (i.e. the proven reserve) which is not the case here. However, we have a rough prior knowledge on the parameter domain (e.g. Ghawar within the 60-140 range and the median value between discovery and onstream year deduced from 14 fields in Table I suggest than λ is greater than 9 years) and the PR2 scenario is the only one to produce reasonable value. This approach corresponds to a maximum a posteriori in probability or a model inversion in Physics. The PR3 and PR1 hypothesis are not supported by the available data and have a very low probability.
b) However when reality is bought back into play actual production capacity should go outside this smooth bell shaped envelope on the tail side - as shut in production is available later than the model would predict. This is exactly what the HSM is doing, the amount that is not produced in the past is pushed into the future and is extracted as an unconstrained production. However, It is very difficult to model shut-in production which is increasing the λ value for a particular set of fields.
the amount that is not produced in the past is pushed into the future and is extracted as an unconstrained production.
Good wording. It's kind of like extruding plastics or squeezing toothpaste out of a tube. The constraints are lifted once out of the tube but within the tube stricter constraints occur.
Hello Khebab, and a happy New Year. A great post to kick off 2008! Before I go any further, a couple of questions.
In Figure 5, what is the basis for the cumulative discovery curve? And what is the cumulative supply curve?
Thanks, Happy new year!
Cumulative discovery curve: is build directly from the Petroconsultants database (now IHS) send to us by Rembrandt (originally coming from Campbell). Check your email in date of 2007/07/24.
cumulative supply curve: or T(t) in the HSM model is the cumulative discovery curve filtered by the lag function of the HSM model (what I called the Instantaneous gross reserve addition in the HSM post ):
It looks more complicated than it is, it's simply a smoothed and lagged version of the original discovery curve. The parameter λ is controlling the degree of smoothing/lagging. This filtering process is modeling the fact that supply is a shifted/smoothed version of the original discovery curve.
Ah, its the top secret IHS data:-)
My feeling is that there is virtually nothing between us here. Your Figure 8b is probably the most significant one to look at. My forecast is based on scheduled projects and has a rather modest allowance for discovered undeveloped and yet to find resources which I think your model more fully incorporates than mine. But you do make the point that you are forecasting capacity, which will only happen if fields are brought on following some commercial regime which they most likely will not.
My URR is based on an HL of the production model you posted up thread, and as I argued in this post, this provides a minimum URR for the discovered developed resource. Another way of saying the same thing.
So its quite possible / likely that a number of new projects will become scheduled in the years ahead and I will need to adjust my forecast up somewhat, but at the same time full potential will never be reached pulling your "all" red line down somewhat and we meet somewhere in the middle. The balancing act will be done post 2030 when a large number of smaller fields may be developed that extends the tail.
It would be interesting to take the post 1980s reserve expansion and decline it for production - I think that leads to something close to 280 - 300 Gbs URR.
The most significant point is this:
That's pretty much my view, unless there are still some giant fields out there sleeping under the empty quarter, I don't see how production capacity could increase significantly. Small fields are probably economically viable especially at $100+ a barrel but they won't affect the production peak by much and they have a tendency to increase the dispersion effect of the oil infrastructure (i.e. small project additions need to be plentiful and in phase in order to produce a significant jump in production capacity).
If the Saudis keep claiming they have all this oil, but are unable to deliver, will the US invade on the premise that it is a hostile withholding?
Very nice post. And thanks for finalizing that discovery base, a very helpful resource.
Colin Campbell's estimate is almost equal to HSM – YTF. Your YTF model is giving below 1 Gb/year, meaning that the probability of finding a new field above 1 Gb is very low. In other words, that YTF is probably irrelevant because it represents residual fields that will unlikely see development.
The failure of applying HL directly to Saudi's past production is more apparent than ever. And the HSM is showing to be an interesting tool.
IMO, the reports of the demise of the HL method in regard to Saudi Arabia are premature. Looking at annual data, Saudi Arabia was down by about 400,000 bpd in 2006 and by about 600,000 bpd in 2007. We shall see what happens in 2008, but it's useful to remember what Texas did right around its peak (rounding off to the nearest 0.1 mbpd):
1972: 3.5 mbpd
1973: 3.4
1974: 3.4
What we do know is that so far Saudi Arabia is showing the same post-peak pattern as Texas: Higher Oil Prices + Increased Drilling = Lower Crude Oil Production (at least relative to the 2005 level)
I have the feeling that the HL is more appropriate in estimating the decline from the resource base which can be a good lower bound of future production only in case YTF is very small and future project additions are coming from small projects. Looking at the UK for instance, production erosion of the resource base (i.e. Fields In Production) is very well approximated by the HL at various point in time:
But countering the YTF effect is the probability of unusually steep--and sometimes unforeseen--declines when the horizontal wells water out, e.g. Yibal.
Ahh but this is why I'm arguing that a "technology" correction factor is needed for all our models.
I've not seen a HL on Yibal but I suspect it gets "tricked".
The big question is increased URR vs increased depletion rates for technical advancement.
My opinion is that increased URR may be valid but most of it is additional production in a long tail at much lower production rates very little additional URR happens at the plateau production rate and this is more than offset by higher depletion of the tail portion. In short the curve is asymmetric with the potential for a long tail. This is what all the "modern" per field production data I've seen show. Even with scatter its not unreasonable to be concerned that global production is asymmetric i.e scaling law wins.
And no I don't think its a black and white problem but its easy to build up evidence for extraction technology having matured by leaps and bounds while the increased URR esp at high production rates has very little support.
BTW, the post-1970 and post-1984 Lower 48 and Russian cumulative production numbers (through 2004) were 99% and 95% respectively of what the HL models predicted they would be, using only production data through 1970 and through 1984 to construct the models.
In Defense of the Hubbert Linearization Method (June, 2007)
http://graphoilogy.blogspot.com/2007/06/in-defense-of-hubbert-linearizat...
yes, the key problem with the plain old HL is as Khebab says "there is no notion of reserves, it implicitly assumes that all the available oil has been discovered and brought online during the first year (t=t0)"
In contrast, by continuously updating the reserve and using a logistic as a near term predictor, HSM definitely should handle forecasting more effectively.
Given the list of named Saudi fields contained in Khebab's article, I wonder if anyone out there has any light to shed on the accounting of the total number that have ever been developed, or which are currently in production. The statements which I am aware of seem somewhat ambiguous, and the truth of the matter seems particularly significant in a context which I will indicate momentarily.
At the April 2004 CSIS confab between ranking Saudi and U.S. officials in which all sides did their best to put a brave image on the situation, Saudi Aramco CEO Abdallah Jum’ah’s stated that
Now the 85 field total seems roughly in accord with the lists on pages 366 and 241 of Twilight in the Desert, if Neutral Zone fields and gas fields are subtracted out. The 23 field total for fields that have "to date" been developed - which seems to imply that this is the number of fields that have ever been developed by Aramco - also seems roughly in line with my own accounting, based principally on Simmons' book:
(1) Dammam, Saudi’s first producing field;
(2-7) the six major fields – Ghawar, Abqaiq, Berri, Safaniyah, Marjan and Zuluf;
(8-18) eleven sporadically-producing fields which are the focus of recent redevelopment projects: Manifa; the pair Qatif and Abu Sa’fah; the triad Khursaniyah, Abu Hadriyah and Fadlili; Khurais and three satellites (Abu Jifan, Qirdi, Mazalij); Harmaliyah,
(19-24) six fields developed post-nationalization: Hawtah and four satellites, and Shaybah.
Thus, I reach a total of 24 fields compared to Jum'ah's 23. The only ones which I haven't accounted for by name are the Hawtah satellites, where my number is based on Simmons' statement that "the Hawtah field and three satellites" began production in 1994, and the statement that another, apparently additional, small satellite began production in 1997 (Twilight, p 224).
Some of the ambiguities are as follows:
In Dr. Nansen Saleri's February 2004 CSIS talk (audio recording), he also makes the claim that about half the 260 billion barrels of allegedly proved reserves are contained in fields that are undeveloped, but then he specifically says that Khureis in this accounting is counted as being one of the undeveloped fields, even though it was developed before, and that it was currently not in production. Applying this logic to Jum'ah's statement might indicate that the 23 field total, despite the clear wording, is a figure for fields (then) currently in production only, and excludes a number which have undergone development in the past.
A further ambiguity is the statement which one occasionally reads alleging that roughly half of Saudi Arabia's reserves are contained in only eight fields. (e.g. www.slb.com/media/services/resources/mewr/num1/portrait_oils.pdf).
The issue of accounting for the number of fields that have ever been produced seems particularly significant in light of the 1979 Senate Foreign Relations Committee staff report The Future of Saudi Oil Production. In the context of concerns over possible damage to Saudi Arabia’s best fields from pushing them too hard, by 1974 the Saudi government, which that year assumed a 60 percent stake in Aramco, had affirmed a policy of bringing newly discovered fields into production at an accelerated rate. Quoting from the report:
So that was the plan. The outcome? If my accounting above is correct, only four fields were developed contemporaneously with these policy decisions: three small satellites of the Khurais field, and the light field Harmaliyah, off the eastern flank of Ghawar, all discovered in 1971-73. And subsequently, post-nationalization, the development of one cluster of small fields south of Riyadh (the Hawtah Trend), discovered beginning in 1989, the combined production from which may have already peaked, according to Simmons, at about 200,000 bpd, and one remote supergiant, Shaybah, in the Empty Quarter, amid enormous sand dunes, discovered in 1968 though not brought on line until 1998-99. (Significantly at least 19 additional appraisal wells were drilled in Shaybah "in the mid-1970s," according to information reportedly contained in the IHS database, but it was evidently decided not to develop Shaybah at that time. See message 49211 at InvestorVillage CWEI, 3/15/2007) That’s it.
About the four 1971-73 discoveries that have actually been produced, little information seems to be available. One can see why Harmaliyah would have been a good candidate for development, since it contains extra-light oil from the same geologic strata as the prolific areas of Ghawar, its near neighbor. (See the Senate report) But it seems to have been unable to sustain the rates of production that reservoir engineers must have planned for. At least such an inference is suggested by the fact that it reportedly peaked so soon after its first production – in 1974, which may actually have been its first full year of production – at about 124,000 b/d according to Twilight, citing Oil and Gas Journal reports. Reportedly “mothballed in the early 1980s,” says the source reporting on the IHS database (CWEI message 55981), “Harmaliyah was back on line after Gulf War I and producing 24,000 [barrels a day] in 2004 according to IEA.” As for the Khurais satellites, it’s not clear whether the production figures given for “Khurais” – for which the data end in 1981 or 1982 – include these fields. Either way, the conclusion is that they have not been notably spectacular. Only two of the three satellite fields are named as being part of Aramco’s current plans for the redevelopment of the Khurais complex.
So if these fields were the entire result of the frequently reiterated mid-1970s development policies, the result is rather telling.
So my question is, does anyone have any information indicating whether any of the other fields on Khebab's list, for a some of which no start-up date is given, have ever been developed, or are currently in production, namely: Janan, Karan, Barqan, Maharah, El Haba, Rimthan, Lawnah, Dibdibah?
Also I'm not clear about the status of Nuyyayim, in the Hawtah Trend, currently on Aramco's project list for an icrement of 100,000 b/d. Is it one of the already developed Hawtah Trend fields, as some sources seem to say (see e.g. www.slb.com/media/services/resources/mewr/num1/portrait_oils.pdf again), or is it the only genuinely new field among Aramco's current list of projects?