The Hubbert Linearization Applied on Ghawar
Posted by Sam Foucher on October 10, 2007 - 10:00am
The following analysis is based on a chart from Frederik Robelius (see Figure 2
below) from which I retrieved the production profile for Ghawar from
1950 to 2003 (xls file).
Using the Hubbert Linearization
method to fit a logistic curve, we get a size estimate for Ghawar close
to what other TOD contributors (Stuart and Euan) derived using advanced
analysis. A possible decline of Ghawar is happening in a
context of record oil rig
counts, record domestic consumption and record oil prices.
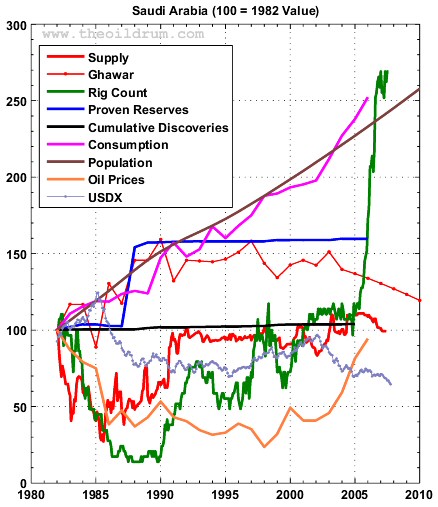
Fig. 1 Sources: oil supply from the EIA (crude oil + condensate); proven reserves, oil prices and domestic consumption from BP statistical review (2007); population from the UN; oil discoveries from IHS; the major currencies index from the Federal Reserve; Ghawar decline based on a logistic fit. Click To Enlarge.

Fig. 1 Sources: oil supply from the EIA (crude oil + condensate); proven reserves, oil prices and domestic consumption from BP statistical review (2007); population from the UN; oil discoveries from IHS; the major currencies index from the Federal Reserve; Ghawar decline based on a logistic fit. Click To Enlarge.
Executive Summary:
- The fitting of a logistic curve (Hubbert Linearization) on Ghawar production produces an URR around 100.59 ± 8.59 Gb with a possible decline rate around 2.6%/year (asymptotic decline at 7.41%/year).
- The fitting of a logistic curve on non Ghawar production (crude oil + condensate) produces an URR around 60.13 ± 12.78 Gb.
- The Hubbert Linearization on total crude oil + condensate production gives an URR at 200 ± 24 Gb which is 20-40 Gb higher than the sum of the two above components.
- If Ghawar is in terminal decline, supply growth from other fields has to be at least 2% a year in order to maintain a flat production and 4% a year in order to maintain flat exports.
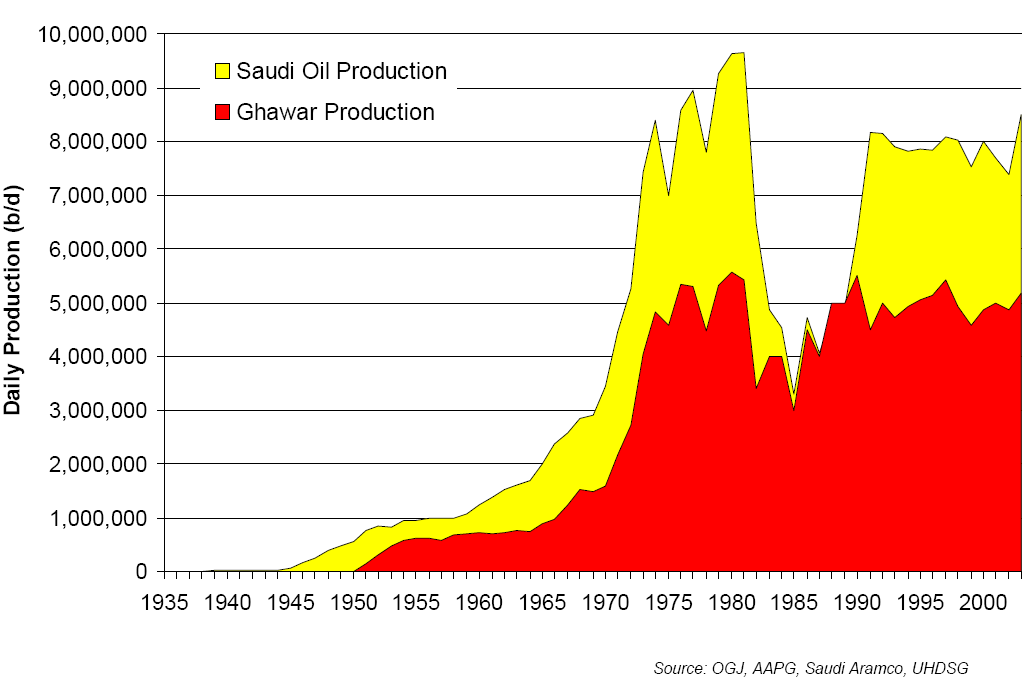
Fig. 2 Saudi Arabia and Ghawar production from a presentation given by Frederik Robelius (pdf here). Click To Enlarge.
Hubbert Linearization Applied on Ghawar Only
The Hubbert Linearization technique is applied on the curve profile above and we get the following result: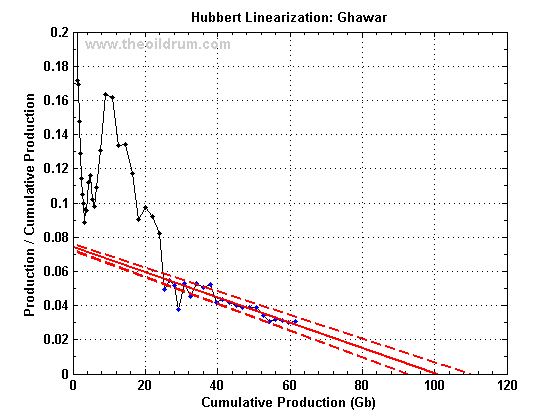

Fig. 3 Left or top Chart: Hubbert Linearization of Ghawar with the 95% confidence interval (red dashed lines). Only blue points are used in the fit.
Right or bottom chart: resulting logistic curve with the 95% confidence interval (red dashed lines). The green lines are Euan Mearns's base and high forecast for Ghawar (details here). The red circle indicates the year 2003.
Parameters of the logistic curve are given in Table I. We can see that the resulting URR as well as the future decline are close to Euan Mearns and Stuart Staniford estimates. Note also that the logistic growth rate (K) is relatively high suggesting that current yearly decline rate for Ghawar is 2.62 ± 1.30 %/year and could reach 3.65 ± 0.56% in 2010.
| URR | Q(2003) | K (%) | thalf |
|---|---|---|---|
| 100.59 ± 8.59 Gb | 61.49 Gb | 7.41 ± 3.65 | 1997.00 ± 3.25 |
What About the Rest of Saudi Arabia Oilfields?
Using EIA's numbers for Saudi Arabia (crude oil + condensate) minus the above logistic model for Ghawar we can estimate the oil production from other fields. The resulting production profile is much more tortuous with a big drop in production from 1982 to 1990. The resulting fit gives an URR around 60 Gb and has a wider confidence interval (almost 25 Gb). We can see a big rise in production in 2003 which probably has continued in 2004-2006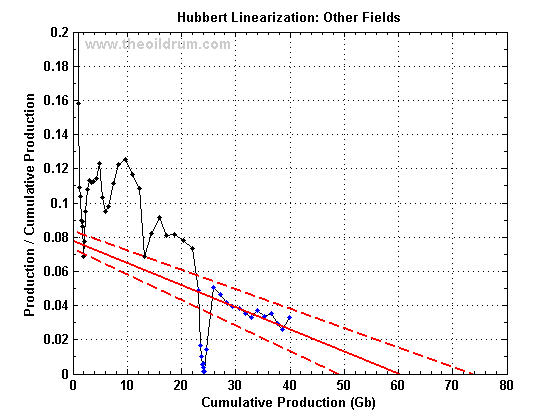
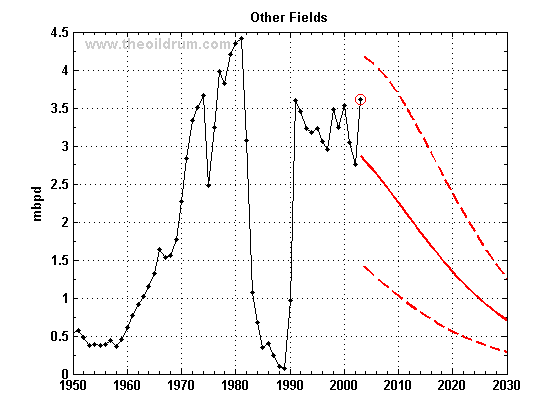
Fig. 4 Left or top Chart: Hubbert Linearization of Saudi Arabia crude oil + condensate (EIA) minus Ghawar production with the 95% confidence interval (red dashed lines). Only blue points are used in the fit. Right or bottom chart: resulting logistic curve with the 95% confidence interval (red dashed lines). The red circle indicates the year 2003.
| URR | Q(2003) | K (%) | thalf |
|---|---|---|---|
| 60.13 ± 12.78 Gb | 39.99 Gb | 7.79 ± 3.7 | 1994.25 ± 9.25 |
Hubbert Linearization on Saudi Arabia
Now, let's compare or previous two-stages result with the HL performed on the total C+C production.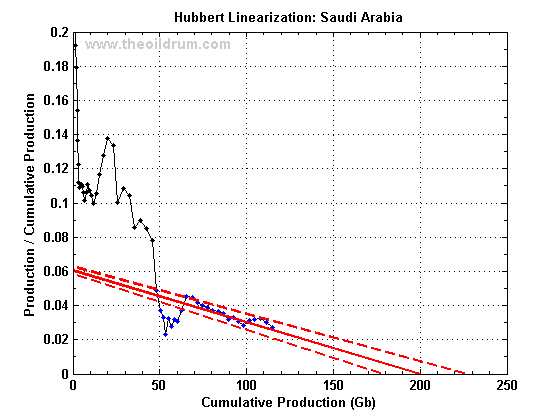
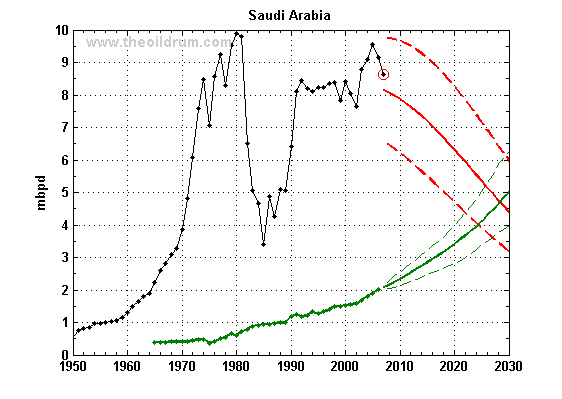
Fig. 5 Left or top Chart: Hubbert Linearization of Saudi Arabia crude oil + condensate (EIA) with the 95% confidence interval (red dashed lines). Only blue points are used in the fit. Right or bottom chart: resulting logistic curve with the 95% confidence interval (red dashed lines). In green, the domestic consumption (all liquids). The red circle indicates the year 2007.
| URR | Q(2007) | K (%) | thalf |
|---|---|---|---|
| 200.21 ± 24.12 Gb | 114.78 Gb | 6.06 ± 2.90 | 2002.25 ± 4.9 |
Summary
The URR resulting from the Hubbert Linearization applied on Ghawar is consistent with previous estimates.| URR (Gb) | Produced (Gb) | Reserves (Gb) | |
|---|---|---|---|
| Stuart Staniford (2007) | 90-102 | 42-62 | 28-60 |
| Euan Mearns (2007) | 96.8 - 115 | 69.8-79.2 | 27.0-35.5 |
| Logistic |
100.6 ± 8.6 | 61.5* | 39 ± 9 |
Different forecasts are summarized in Fig. 6 and Table V below. The two stages forecast is close to Ace forecast whereas the HL-SA forecast is closed to Euan.
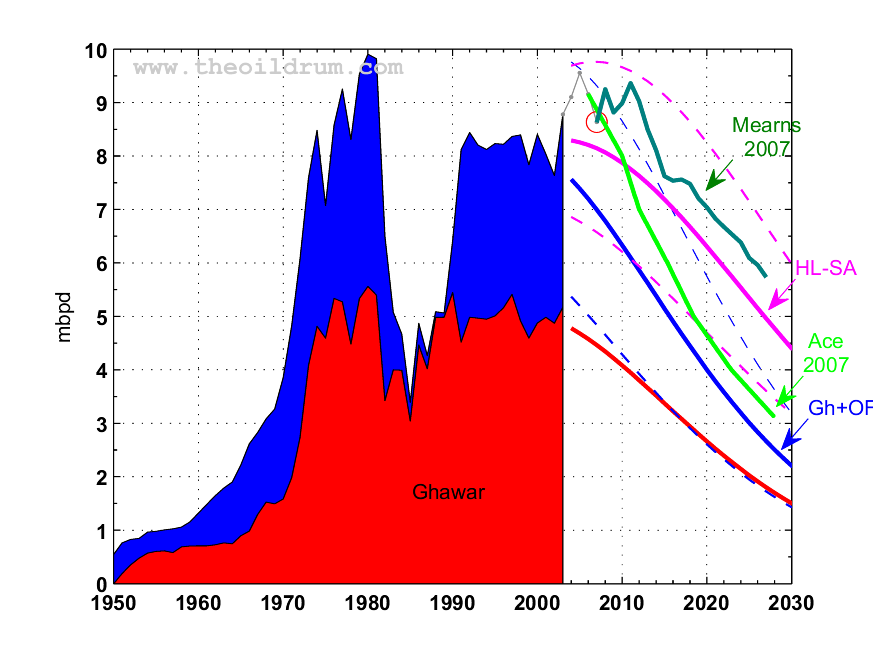
Fig. 6 The red circle indicates 2007 estimate. Click To Enlarge.
| 2003 | 2007 | 2008 | 2010 | 2012 | |
|---|---|---|---|---|---|
| Ghawar Only | 5.17 | 4.46 [3.64
- 5.34] |
4.34 [3.51 - 5.18] | 4.08 [3.26 - 4.92] | 3.80 [3.01 - 4.63] |
| Other Fields | 3.61 | 2.53 [1.20
- 3.97] |
2.44 [1.06 - 3.89] | 2.25 [0.95 - 3.68] | 2.06 [0.84 - 3.45] |
| Total (Gh+OF) | 8.78 | 7.99 [4.84
-
9.31] |
6.78 [4.57 - 9.07] | 6.33 [4.21 - 8.66] | 5.86 [3.85 - 8.08] |
| HL on Saudi Arabia (HL-SA) | 8.78 |
8.63 | 8.06 [6.40 - 9.70] | 7.87 [6.15 - 9.61] | 7.63 [5.87 - 9.44] |
Below is a brief summary of available URR estimates for Saudi Arabia initially compiled by Euan here.
| URR Gb | Remaining Gb | Recovery %2 | Notes | |
|---|---|---|---|---|
| Parabolic Fractal Law1 | 200 | 85 | 29 | C+C only |
| Ace | 175 | 63 | 25 | C+C only |
| Pre-nationalisation | 211 | 91 | 30 | minimum |
| Mearns | 240 | 120 | 34 | minimum, C+NGL |
| Mearns | 200 | 86 | 29 | minimum, C+C |
| Logistic | 200 ± 24 | 85 ± 24 | 25-32 | C+C only |
| Ghawar+Other Fields | 161 ± 21 | 46 ± 21 | 20-26 | C+C only |
| Campbell | 275 | 155 | 39 | C+C only |
| Saudi official | 384 | 264 | 55 | BP+produced |
Assuming that Ghawar will follow a terminal logistic decline as shown on Fig. 3, new supply growth from Yet-to-be-find or Yet-to-be-developed oilfields is unprecedented:
- Maintaining production flat at the 2004 level and compensating for Ghawar decline will require a new supply growth of 2-3 % per year.
- Maintaining exports flat at the 2004 level and compensating
for
Ghawar decline will require a new supply growth of 4-5 % per year.
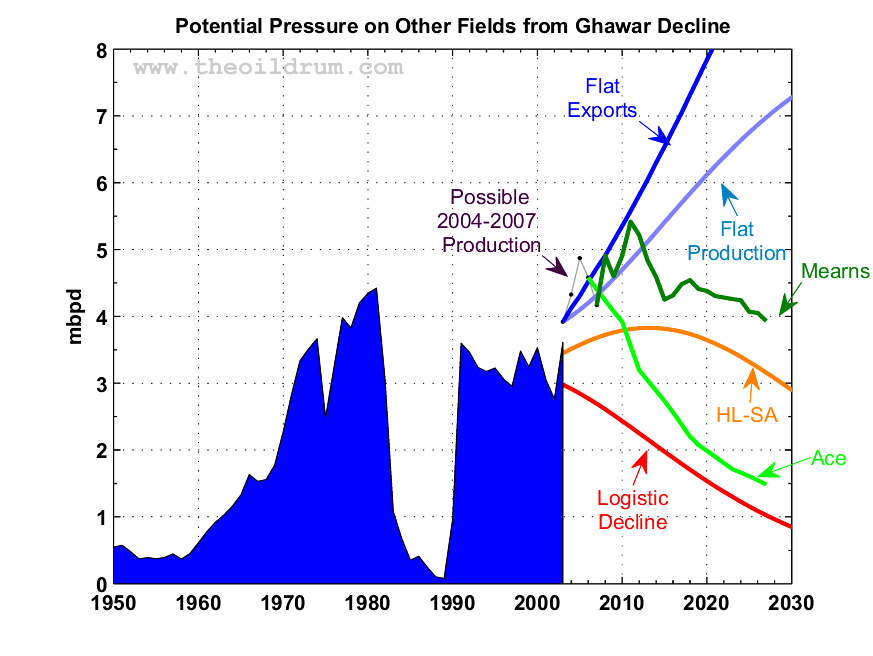
Fig. 7 The red circle indicates 2007 estimate. Click To Enlarge.

is the honeymoon over?
Further articles about Saudi Arabia:
by Stuart Staniford
- Saudi Arabia and Gas Prices
- Depletion Levels in Ghawar
- The Status of North Ghawar
- Further Saudi Arabia Discussions
- Water in the Gas Tank
- A Nosedive Toward the Desert
- Saudi Arabian oil declines 8% in 2006
by Euan Mearns
- Saudi Arabia - production forecasts and reserves estimates
- Ghawar reserves update and revisions (1)
- GHAWAR: an estimate of remaining oil reserves and production decline (Part 2 - results)
- GHAWAR: an estimate of remaining oil reserves and production decline (Part 1 - background and methodology)
- Saudi production laid bare
- Saudi Arabia and that $1000 bet
by Heading Out
- Simple mathematics - The Saudi reserves, GOSPs and water injection
- Of Oil Supply trains and a thought on Ain Dar
by Ace
- Updated World Oil Forecasts, including Saudi Arabia
- Saudi Arabia's Reserve "Depletion Rates" provide Strong Evidence to Support Total Reserves of 175 Gb with only 65 Gb Remaining
- Further Evidence of Saudi Arabia's Oil Production Decline
by Khebab:
“Any coward can fight a battle when he's sure of winning, but give me the man who has pluck to fight when he's sure of losing. That's my way, sir; and there are many victories worse than a defeat.”
—George Eliot
Contact
- Content: editors at theoildrum dot com
- Tech support: support at theoildrum dot com
License

This work is licensed under a Creative Commons Attribution-Share Alike 3.0 United States License.
Well, it's good to know that both ace and Euan are right..
----
Just remember the Golden Years, all you at the top!
My interpretation of this, which I drew clear back when Stuart and Euan were writing this, was that KSA would rapidly fall from producing 9.6 mbpd to around 5 or 5.5 mbpd and then stabilize there for several decades (assuming no other outside factors come into play). The logistic curves strongly support that perspective. This is how I like to see the logistic used - as a tool in conjunction with multiple other analyses that all come to similar conclusions.
"The greatest shortcoming of the human race is our inability to understand the exponential function." -- Dr. Albert Bartlett
Into the Grey Zone
Note that the middle case for production and consumption show that Saudi Arabia ceases exporting oil in 2028, in 21 years.
I will present Khebab's work on Saudi Arabia and the other four top net exporters in Houston, and the combined total for the top five.
BTW, has everyone else noticed that the MSM really didn't cover Jeff Rubin's report on net oil exports? After the shocked silence on CNBC, coverage of the report pretty well went to zero.
As I said a few days ago, I very, very, very strongly recommend that everyone take a hard look at the ELP recommendations:
ELP Plan (April, 2007)
http://graphoilogy.blogspot.com/2007/04/elp-plan-economize-localize-prod...
http://www.energybulletin.net/5673.html
Published on 22 Jul 2004 by San Francisco Chronicle. Archived on 25 Apr 2005.
Berkeley: Urban farmers produce nearly all their food with a sustainable garden in their backyard
Nabucco is dead.
No. One more Zombie/Undead pipeline resurrected
to isolate Russia.
Just an ex. of where US oil policy is today.
First Today's News:
" Kazakhstan Today. October, 8. BAKU. In the frames of forthcoming energy summit which will held on October 10 - 11 in Vilnius Azerbaijan, Georgia, Lithuania, Poland and Ukraine are up to sign energy cooperation agreements, said during the press conference on Friday, October 5, Lithuania Ambassador to Azerbaijan, Kestutis Kudsmanas, as reported by the KZ-today correspondent.
As the diplomat stated, the presidents of Azerbaijan, Georgia, Lithuania, Poland and Ukraine will sign agreements on energy cooperation. Besides, an agreement establishing the company responsible for oil pipeline Odessa - Brody - Plotzk - Gdansk project and an agreement between Lithuania and Latvia on energy bridge construction will be signed.
The ambassador underlined that Lithuania examines an option of Azerbaijani gas supply via NABUCCO gas pipeline."
March 2007:
"The €5bn Nabucco project was conceived to be the “anti-Russian” pipeline. Stretching from Turkey through the Balkans into central Europe, it would take some 30bn cubic metres a year of gas from Central Asia, the Middle East and Egypt into the EU. The European Commission, which instructed its development banks to finance the bulk of the project, prioritised the pipeline as key to reducing the continent’s dependence on Russian gas.
Hungary’s state energy company, Mol, is one of five companies in a consortium that was planning to develop the Nabucco pipeline. Mol might remain in the consortium – but without Hungary’s political backing for the project, it has no chance of proceeding.
That is because Budapest favours a rival pipeline project that would bring Gazprom’s gas through the Blue Stream pipeline – under the Black Sea between Russia and Turkey – and up through the Balkans into Hungary. It would target the same markets as Nabucco. Analysts rule out the possibility of both coming on stream. More likely is that the Nabucco developers will join Gazprom’s project.
In November (06), Alexander Medvedev, head of Gazprom’s export arm, told me that Nabucco posed no threat to Gazprom’s plans to extend Blue Stream. “Nabucco is a virtual pipeline,” he said. He even had time to make a joke at its expense. Referring to the opera from which it takes its name, he said: “Unlike the Verdi opera, there will be no execution of this Nabucco.” Europe’s problem remains the same: Gazprom keeps having the last laugh
Arkansaw of Samuel L Clemens
Can you please confirm and translate.
According to what I've read on news, yes, Nabucco could be just a virtual pipeline, if the gas to fill it cannot be secured from suppliers. Otherwise it's good to go ahead (?). This is at least the impression given to news agencies and which they pass on.
Also, what do you mean with your reference to US:
"Just an ex. of where US oil policy is today."
I need a translation :)
cheers,
samu
Very disturbing indeed. Clearly, the word is out to keep this guy off the news. Even more disturbing, listening to Rubin's presentation, was his view that only Canada had the resources to pick up the slack. I did not hear this view challenged.
And you haven't heard anything about US Casualties in Iraq either.
Arkansaw of Samuel L Clemens
hmmmmmmmmm!
Xeroid.
Isn't it a little early to conclude that a mere day and a half after his interview? Unless he was on tv every single day beforehand, there's no indication he's getting less attention than he was before.
Perhaps you should listen again, then - he also mentioned Angola, Venezuela, and Brazil as future sources of oil to replace Mexican production (3:17 into the interview).
Moreover, he flat out states that replacing conventional oil with non-conventional oil is not a problem (2:30 into the interview), other than keeping oil prices high, so it's not at all clear that his views agree with those of people here.
Isn't it a little early to conclude that a mere day and a half after his interview?
Khebab posted a Jeff Rubin interview from CNBC on October 2, which puts it at a week and a half ago.
Great work Khebab, I have a little graph I drew a few days ago that looks similiar to Fig5. 9 points of Intersection, 5 'average' cases. Some of these points are more likely than others IMO. The relationship between them and what it actually means for the country in question can be explored further.
The exporter countries will be able to maintain treasury revenue up to some point then income may collapse. Sensing this (and they would be blind not too) wouldn't these countries take drastic measures to curtail internal demand? At some point KSA, Russia and the others must end subsidies, tax fuel and probably invest in nuclear(Iran?)/renewables.
We already see KSA looking to invest heavily in downstream production of plastics, etc. :
"To increase margin, add value..."
-that's what the OECD importers do and they want a piece of the action. We are seeing huge petrodollar inflows to US Bonds and other financial instruments, is anything being destroyed yet? Perhaps the petrodollar recycling will keep the party going for a while yet.
The Net Oil decline rate is going to be critical in determining how ugly this gets. I look forward to your report.
Regards, Nick.
http://science.reddit.com/info/2ynfs/comments
http://digg.com/general_sciences/What_do_we_really_know_about_the_Saudis...
Thank you for your support.
Khebab, thanks so much for doing this. As I posted over at graphoilogy (under anonymous, too lazy to sign in), your graphs are highly useful in conveying and visualizing information.
Khebab - a good summary. A couple of points - and I'll try to get back with some charts later.
I don't think Ghawar will undergo a smooth logistic decline owing to the way the field has been developed in stages. Haradh, which is relatively newly developed will likely produce at plateau for decades to come. Ain Dar and Uthmaniyah on the other hand may die relatively quickly as last gasp horizontal producers water out and the dry oil areas are all used up leading to escalating water cuts. Its nevertheless comforting to see the HL supporting the conclusions that Stuart and I reached independently.
What is the origin of the data used by Robelius? I'm pretty astonished to see production shut down everywhere apart from Ghawar during the late 80s - can this be correct? For example, I found a chart for Berri displaying water cuts for the period 1980 to 1990 (SPE 79718).
I also wonder if part of the difference between the HL and my C+C forcecast is that I build in new developments - that the past production data does not yet see?
http://www.theoildrum.com/node/2689
In Defense of the Hubbert Linearization Method
June 24, 2007
My assumption is that the primary reason that the HL method works is that we tend to find the big fields first, e.g., Ghawar. The smaller fields that we find post-peak basically just slow the rate of decline in total production.
Re: I don't think Ghawar will undergo a smooth logistic decline owing to the way the field has been developed in stages.
I agree, the logistic is a very simple approximation however I was surprised to see that your forecasts were more or less within the 95% confidence interval.
Re: What is the origin of the data used by Robelius? I'm pretty astonished to see production shut down everywhere apart from Ghawar during the late 80s - can this be correct?
I don't know exactly the sources, it looks like a collection of various sources (OGJ, SPE, AAPG, Aramco, UHDSG), there are probably more details in his PhD thesis.
Re: I also wonder if part of the difference between the HL and my C+C forecast is that I build in new developments - that the past production data does not yet see?
your probably right but again I find it troubling that your result based on a orthogonal approach is within the 95% confidence interval of the HL.
Why? I think its encouraging when different approaches start to line up. Doesn't make them right of course.
I just noticed aswell that in my forecast I have discovered undeveloped and yet to find - and I'd view the 200 Gbs as a minimum estimate.
I meant "troubling" in a good way, it's always a good sign when multiple orthogonal and independent methodologies are converging toward similar results (eliminate wishcasting).
In that case, I think we should all look forward to troubles ahead.
In 2005, at an industry conference that I attended, the Texas State Geologist stated that while Texas may not be able to equal its peak crude oil production, it can, with the use of improved technology, significantly boost its production. Texas, with one or two minor deviations, has shown a pretty steady decline, at about -4% per year, since peaking in 1972.
While hope springs eternal, the reality is that Texas and Saudi Arabia both responded to their arrival at the vicinity of the roughly 55% depleted mark, on their respective HL plots, in the following way:
Higher crude oil prices + Increased Drilling = Lower crude oil production
We can and will continue to find oil fields in Texas. What we have not been able to do is to offset the declines from the old, larger fields like the East Texas Field.
The Saudis can and will find new fields. IMO, what they will not be able to do is to offset the declines from the old, larger fields like Ghawar.
The data that shows every field shut down except Ghawar must be in error! I was in Saudi Arabia from 1980 until early 1985. I don't know anything about any fields except Safaniya, where I worked in 83 and 84. We were producing heavily from Safaniya during those two years.
I worked an a newely developed comupter monitoring system. We monitored flow rates. I have no idea how many barrels per day all the Safaniya wells produced, I was simply not concerned with barrels per day in those days. But I know it was a lot. On the offshore platforms you could put your hand on the pipes but they were hot and you could hear the oil rushing through them. I don't believe any of them were choked off.
Ron Patterson
Do you know anything about the reservoirs in Safaniyah other than the main (Safiniyah) sand? There's a bunch of other reservoirs in that field, but we have no idea the areal extent of any of them. I assume wells were only completed in the main sand?
No, I don't know much about the Safaniya reservoirs. All the platforms I worked on were close to shore and in very shallow water. When we flew out to them on the helicopter you could see the pipelines lying on the sea floor.
You must remember that in the early 80's no one had ever heard of peak oil. We never discussed reservoirs or how much oil was there or how much could ever be produced. The subject simply never came up. I was involved with the computers on shore and the monitoring equipment on the platforms.
Ron Patterson
Which makes one wonder where Robelius got his data. How does the outcome of the analysis change, I wonder, if one assigns the observed production differently, such as maintaining the Ghawar/Other ratio observed in the 5 years before Aramco stopped telling people what it was doing?
From a correspondent on Wall Street. I don't have a link.
Persian Gulf Oil-Tanker Rates May Extend Drop on OPEC Cargoes
2007-10-10 04:08 (New York)
By Alaric Nightingale
The link to the Bloomberg source is here.
This bit was toward the end. Can this be right? FRO needs 2x the going rate to break even?
--C
Energy consultant, writer, blogger www.getreallist.com
The C+C forecast above compliments the C+C+NGL forecast presented here.
The HL plot, which shows past production (blue) and the forecast above (red) points to a URR of 200 Gbs for C+C. Khebab - strange that we are both looking at 200 GBs but that my forecast lies significantly above your logistic. I would expect another period of rapid decline in the 2030s as Haradh and Hawiyah begin to die?
Looking at C+C only makes quite a big difference to the overall picture, and since Saudi NGL seems to mainly comprise ethane and propane, including this in liquids production is a bit of a con IMO.
There is still upside potential in the sour oil fields of Safaniyah, Zuluf, Marjan and Manifa - once new refining capacity gets built.
Euan, Thanks for the charts.
Re: strange that we are both looking at 200 GBs but that my forecast lies significantly above your logistic.
I think it has to do with the way logistic curves are fitted with historical production using a match between cumulative production numbers whereas your forecast is matching the last available annual production.
WT likes to ignore the dogleg, you ignore all the points in the middle and draw a line with one end based on the highest point in the dogleg; in fact, the projected line would not be higher if any other two ponts had been selected. A middle position would be a line that has half the points (of those you think to be the important group) above, and half below, the line (least squares?). The result would be a higher URR than WT assumes but one lower than your current line extends to. Perhaps the graph would be most informative if it showed all three projections rather than a single one.
Your future points mostly look to be above what is already an optimistic projection... are these points based on a future production estimate shown elsewhere?
BTW... it seems clear that SA needs more infrastructure - experienced workers, rigs, steel pipe and pipelines, water injection, and specialized refineries - to produce a barrel than ever before. If this trend continues can we be sure that all bits will be available as and when needed, particularly considering that the shortages are world wide?
As I have previously noted, the most accurate pre-peak estimate of Texas URR came from discounting the prepeak "dogleg up." Since Texas was the prior swing producer, this seems significant to me.
And early last year someone did warn, using Texas as a model and using Saudi production data through 2005, of an imminent decline in Saudi production.
JK - my take on the strengths and limitations of HL are outlined in my recent posts The amazing power of King Hubbert and More on the systematics of the Hubbert Linearisation.
In short, in the period 1991 to 2003 KSA was producing below capacity and had a large number of fields lying fallow and the data in that period, IMHO, will tend to underestimate URR.
How do you define optimistic? Both the C+C and C+C+NGL forecasts I present show sharp falls post 2011 - what is optimistic about that?
The future points on the HL are taken from the C+C production model posted immediately up the page from the HL plot. This is based on a highly detailed bottom up analysis on Ghawar, decline for hertiage assets and new projects at nameplate + 1 to 2 years delay.
I'd like to hear more about the NGL's. If NGL's were forecast in BTU's rather than barrels, what would the production curve look like (Do we hit the yellow layer with a 60% or 70% factor, or what?)
How certain are these NGLs? Are the ethane and propane sold separately from oil? Are these in less short supply than oil?
Gail - I seem to recall Khebab saying that NGLs come in at about 70% of the BTU's per barrel compared with crude.
There is a substantial underlying subject here that deserves much more of our attention. My understanding is that much of the ammonia fertilizer production and plastics production that once took place in N America and Europe? has been "exported" to the Middle East - where they need a large amount of feed stock - nat gas and NGL's.
This has allowed North America and Europe to survive so far the downturns in nat gas production - but exporting these industries is a one off event - and decline eats into production every day that passes.
It seems that Saudi is also under strain from importing these gas intensive industries. Its something I don't know enough about. But when the US imports fertlizer, it is importing nat gas that once was produced at home.
Very true; viva la globalization! (sarcanol alert)
As Dave Cohen has elegantly argued in A Paradigm Shift, it's better for the major producers if they can take both the upstream and the downstream profits, and the end products (should) be smaller/lighter and less costly than shipping the nat gas or crude itself. Whether that is true or not for fertilizer, I don't know.
There is no doubt in my mind that North America is exporting the production of higher order oil & gas products as much as possible, back to their sources...given our decline, is there any other choice that allows continued growth?
From an investing perspective, these are boom times for plastics, chemicals, fertilzer, etc. in the Middle East. To the extent that such industries can scale up in the midst of shortages & skyrocketing costs for all the basic building materials, that is. But as awash in money as KSA et. al. are, I'll bet that the purchase orders will remain open.
--C
Energy consultant, writer, blogger www.getreallist.com
How much of Saudi's (and other exporters) net export decline is from relocation of petro-chemical industries? It's got to be a large share, and it's a one-off relocation. That suggests that once the relocation from US-EU stabilizes, net-export growth will resume again (or stop declining as quickly), and also that consuming countries' demand for crude will be lower.
Total dollars paid for oil products will rise, but total volumes may fall.
Yes, the off loading of Plastics and Fertilizer from North America HAS been a big one time event.
I would love to know how much that one off event "Put back on the market" of Natural Gas.
Euan,
as always you (and Khebab as well) bring valuable contributions into renewed and improved understandings of the URR and possible future production developments for KSA.
With respect to your chart showing actual and forecast productions of C+C+NGL, I wonder what the source(s) for KSAs NGL production is(are). Many natural gas reservoirs are normally also sources for NGLs (this is well documented for the North Sea).
KSA does not have a significant Nat gas production (according to public sources) which could suggest that NGLs are mainly associated with crude oil production.
For NGL associated with crude oil fields (or fields classified as crude oil fields) I have (based upon NPD data for Norwegian oil fields) observed that the NGL /Crude Oil ratio seems to stay very much constant throughout the fields economical life.
Based on this I wonder what is the reason for the increased NGL/Crude Oil ratio as suggested in your forecast for KSA?
I would expect NGLs to roughly stay at the same ratio (or even declining) as crude oil throughout the forecast period.
………………..
Euan, rest assured I have some spare fishing rods which you can borrow for fishing salmon, and if you bring some good malt whiskey…..I will bring spekemat (and aquavit; akkevitt).
Rgds
NGM2
Whereas the majority of Saudi gas production is still associated with oil production, a growing fraction is due to non-associated production from fields in Ghawar and surrounding areas (Tinat and Waqr). They have spent a lot of money on a new processing facility in Haradh (completed 2004) and expansion of the Hawiyah gas plant. They have announced intentions to "triple natural gas output (to 15 Bcf/d) by 2009". Who knows. And given that oil production will decline, the fraction of NGL from non-associated gas (and the NGL to crude ratio) will of course go up, even as oil production goes down.
I redid some of the Oil Shock Model projections based on a perhaps more proper reconsideration of world-wide NGL effects here:
http://mobjectivist.blogspot.com/2007/10/global-update-of-dispersive-dis...
I made the assumption that NGL production estimates were definitely not included in the crude oil discovery profile, and thus I had been pessimistic in oil production projections (as discovery is an important input to the Shock Model and the Dispersive Discovery profile fit).
NGM2 - I sent an email round the TOD squad with the same question - where is all the NGL2 comming from? I've also contacted the DTI this last couple of days to get data on UK NGL. They confirm what you say that most UK NGL is associated gas and would therefore by correlated with crude production. I only just got the data - but it seems clear that UK NGL is "wetter" than Saudi NGL. The former includes significant condensate whilst the latter (Saudi) seems to be dominated by light gas - ethane and propane.
The Khuff reservoirs in Ghawar (deeper than Arab D) are one likely source. I also wonder if allowing segments of supergiants like Abqaiq to de-pressurise might release wet gas? The Brent Field, by way of example, went from oil field to gas field with gas cap blow down.
Another thing that is clear is that many of the new projects are "gas plant" projects, extracting C2+ from production gas streams. And you have to be careful to not double count.
Time to run for the hills and fish for salmon. Next year sounds good to me. My wife (the she Wolf) is on sabatical in Bergen and Stavanger next year.
Joules and Euan,
Thank you for your replies.
According to BP Statistical Review 2007 KSA had a nat gas production of close to 74 Bcm in 2006, if this should increase to 15 Bcf/d, which equals approx 150 Bcm, by 2009 this is an impressive undertaking, according to BP data, the nat gas reserves are there, but will the infrastructure and market be in place to consume this increase in gas production?
NGLs (C2 - C5) are tricky as their production profiles may vary much among individual fields as observed on NCS. From what you describe Joules it looks very much as NGL production in KSA has a lot of similarities with production (drainage strategies) from the Statfjord field which soon will start to blow down the gas cap, and see an increase in NGL/Crude Oil ratio. From NPD data it looks like NGL drainage strategies sees great variations among the Norwegian fields, which makes it hard to generalize NGL production.
C2 as far as I understand is mainly used as feedstock within the petrochemical industry. The other thing, which I reckon was mentioned further up on this thread, is that NGLs have a volumetric BTU content that is approximately 70 % of crude oil.
Rgds
NGM2
Thank you for raising the question as to the origin of NGL production. I often wonder whether the NGL is responsible for a significant fraction of the reserve growth effects. If you think about it, early estimates of discovery volume probably did not anticipate significant extraction of NGL and thus this effect was only added later (was it backdated as well?). And thus if someone did not distinguish crude from NGL, they could fool themselves into thinking a huge reserve growth whereas it is likely just a miscount of a fractional estimate.
If you think that NGL amounts to rough fractional proportion of crude oil reserves on average, this could be a candidate for a discovery backdating heuristic.
Another rumour that Matt Simmons sent round was that Aramco had blown down pressure on Berri to help meet demand for gas. If true, that would have resulted in oil production falling from that field (another possible contributor to recent country declines?). Not sure what impact that would have had on NGLs - down with oil or up with gas?
cheers
Phil.
I was trying to translate the graphs in to an estimate of production in 2010. As I understand it, Saudi production (using EIA data) is currently about 8.6 million bpd.
If you use the separate projections, the midpoint for 2010 seems to be about 6.4 million bpd, with a range of 4.3 to 8.7.
If you apply HL technique to the total, the midpoint projection appears to be about 7.9 million bpd, with a range of about 6.2 to 9.8.
We are seeing enough declines outside of Saudi Arabia that we need a real increase in production in Saudi Arabia to hold world production up and prevent overall decline. See my article from yesterday, Did Katrina Hide the Real Peak in World Oil Production? and Other Oil Supply Insights.
Even at the top of the combined projection range (9.8 million bpd) , it doesn't look like Saudi production would be enough to prevent worldwide decline in oil production, unless Iraq or the arctic comes to the rescue.
I agree, IMO Saudi Arabia needs to bring 250 kbpd (i.e. ~1 Haradth phase) of new capacity every year (i.e. 4-5% / year growth for non-Ghawar supply) just to maintain exports flat (i.e. compensation for Ghawar decline and growth in domestic consumption). I don't think this is sustainable over a long time period.
I'm with you. 8D
And how about Smilin' Jack!
Preparing Smilin' Jack for his annual appearance requires more than 100 gallons of orange, black and white paint. According to refinery engineers, if the giant jack-o-lantern were filled with pumpkin meat, there would be enough to make 26,800,000 pumpkin pies!
The Great Pumpkin Returns to ConocoPhillips' Wilmington Refinery
Friday October 13, 2006 6:48 pm ET
More Than 30,000 Visitors Expected to Visit the World's Largest Jack O' Lantern
The Great Pumpkin Returns to ConocoPhillips' Los Angeles Refinery
Ideas: Great remote location for Halloween weather reports, TV
helicopter flyovers, Halloween segments, morning show
features, print photo opportunities, live radio broadcasts,
etc.
Great Visuals The world's largest jack-o-lantern.
Illuminated at night and visible for miles.
A 3,360,000 gallon storage tank with the eyes, nose and
toothy grin of a jack-o-lantern painted on two sides.
More than 30,000 trick-or-treaters dressed in their
Halloween costumes are expected during the two-night event!
You think they've had time to restart the refinery while painting Smilin' Jack this last week?
"How could you pull power on two major refineries?" said ConocoPhillips spokesman Andy Perez.
Arkansaw of Samuel L Clemens
Gail,
The artic is at least 20 years away and WW III looks like Iraq will be ground zero Condoleeza Rice was threatening Iran today.
Bob Ebersole
Why is that? According to EIA data, the trend over the last 36 months has been that non-OPEC oil supply has been growing at 15kb/d per month, or almost 200kb/d per year. Taking only the last 18 months (post-Katrina data), the trend is for 50kb/d per month, which is 0.6mb/d per year of non-OPEC supply growth, with a reasonable fit to the data (R^2 = 0.65).
Accordingly, the question of world decline looks like a question of OPEC decline.
Some OPEC countries are clearly in decline (Indonesia), but others are increasing production (Angola), so it's not clear that OPEC is going to decline strongly in the immediate future either. OPEC production is certainly down, but so are OPEC's quotas, so we don't yet know how much of that was involuntary.
For what it's worth, the 36, 30, 24, and 18-month trends for world oil production are all flat (+/- 10kb/d per month), with only the 12-month (-100kb/d) and 6-month (+80kb/d) trends outside that band.
I put a tooth under my pillow and the tooth fairy replaced it with a private report by a well-known oil & gas consultancy. Here is what it said about Ghawar.
Disclaimer: I put this up for your information, and I do not vouch for what it says. Figure 10, which is alluded to in the box, adds little to what is said here.
I put a tooth under my pillow and the tooth fairy replaced it with a column about the cofounder of a well-known oil & gas consultancy. Here is what he said about crude oil prices and production in November, 2004:
Digital Rules
Capitalism's Amazing Resilience
Rich Karlgaard, 11.01.04, 12:00 AM ET
Excerpt:
Even CERA appears to be changing their outlook a bit. But notice that they're still clinging to the prediction that prices will go down but not nearly as much as they predicted in 2004
Nice work. I always appreciate the extra effort of putting confidence bounds around an analysis.
OK. I'm lazy. But as I read through the article I was really hoping that there was going to be a net exports chart. I know Figure 5 shows production and consumption, but my automated visual subtractor isn't as good as my visual integrator.
Maybe I'll take a crack at it when I get home. Will someone remind me how to combine the 95% confidence bounds. Shouldn't the new bounds from the subtraction be something like the square root of the sum of the squares.
I have an article co-authored with westexas coming out about exports at the next ASPO conference. That's why I did not want to talk too much about exports.
Khebab - I spent a fair amount of time this evening staring at your Figure 1. A tapestry of horizontal lines, vertical ines, rising straight lines and squigly lines. The future of the world is in there - but what does it forecast?
Well, I was trying to put some context around the recent drop in Saudi Arabia's production and an hypothetical decline of Ghawar starting in 2003-2005 which seems well correlated with a strong jump in rig counts. You can also observe the exceptional growth in domestic consumption (+124% in 24 years) that is unlikely to slow down as it is tied to a strong demography whereas the production C+C is at the same level as in 1982. cumulated discovery is also flat.
The 60gb URR for non-Ghawar KSA isn't terribly plausible. We know OOIP for Ghawar is around 200gb, and OOIP for the whole country was estimated at 530gb in 1979 - it's likely that at least some growth in this number since then is legitimate. So non-Ghawar OOIP is probably somewhere in the 300-400gb range. So a 60gb URR implies a 15%-20% recovery rate of the oil in place. This compares poorly to global median recovery rates of 40% for supergiant fields.
So while it's impossible to rule it out, the number doesn't seem very plausible, and it's hard to have much, if any, confidence in applying HL to such a wildly non-logistic looking process as non-Ghawar production. A more likely scenario is that the HL will dogleg up as very underexploited reserves come onstream over the next decade (Khurais, Khursaniyah, etc)
I agree, the profile for non-Ghawar production is too immature to be reliable and the 60 Gb grossly underestimate future growth.
This original post criticized those numbers then I realized it was my mistake so I had to edit it. I sometimes forget that OOIP is totally different from URR. My mistake, sorry.
If URR is between 30% and 40% of total oil, (OOIP), then those numbers look pretty close, perhaps even a little low for the whole country.
Ron Patterson
Right - for any confused readers, OOIP = Original Oil in Place (sometimes also put as OIIP = Oil Initially in Place), and URR = Ultimately Recovered Reserve (sometimes also EUR = Estimated Ultimate recovery). URR = OOIP * Recovery Rate.
BP has a different interpretation for your last equation.
http://www.bp.com/liveassets/bp_internet/globalbp/globalbp_uk_english/re...
Your last equation implies that the URR is an output from OOIP*Recovery Rate.
BP's definition is that the the recovery rate is an output from "the ratio of reserves to oil in place for a given fields". Reserves are calculated prior to the recovery rate.
The reserves are an output, based upon geological, engineering, economic and operating data.
BP's definition of URR
"URR is an estimate of the total amount of oil that will ever be recovered and produced. It is a subjective estimate in the face of only partial information. Whilst some consider URR to be fixed by geology and the laws of physics, in practice estimates of URR continue to be increased as knowledge grows, technology advances and economics change. Economists often deny the validity of the concept of ultimately recoverable reserves as they consider that the recoverability of resources depends upon changing and unpredictable economics and evolving technologies."
Recovery factor definition
"The ratio of reserves to oil in place for a given field is often referred to as the recovery factor. The recovery factor of a field may change over time based on operating history and in response to changes in technology and field economics. The recovery factor may also rise over time if additional investment is made in secondary recovery techniques such as gas injection or water-flooding that augment the natural pressures within a given reservoir."
According to BP, the recovery factor is not used to calculate reserves, instead it is an output equal to reserves divided by oil in place.
For further info please see this thread
http://europe.theoildrum.com/node/2494/184832
So sub "final recovery factor" if you prefer.
Hi Khebab,
Thanks for your interesting analysis!
I was looking at your Robelius Fig 2 chart and also noted that from about 1985 to 1990 only Ghawar was in production which meant that all other fields were producing at zero or very low rates.
In the Feb 2004 presentation by Nansen Saleri of Saudi Aramco, this chart for Ghawar production is on slide 24.
click to enlarge
Source: http://www.saudiaramco.com/irj/go/km/docs/SaudiAramcoPublic/Speeches/Spe...
Slide 21 of their presentation states that the “Ghawar field has produced 55 billion barrels as of year-end 2003”. Your top chart of Fig 3 shows a cumulative production of about 62 billion barrels to year end 2003 which is equal to the area of the red Ghawar production from your Fig 2. Either Saleri has understated Ghawar’s production or Robelius’ data has been overstated. If lower cumulative production is used for your Ghawar HL then your estimate of URR for Ghawar might decrease.
Hans Jud from his presentation below has also estimated Ghawar URR using data from Saleri presentation
http://www.aspo-portugal.net/Articles/SA-Oilprod_field-by-field_V2.pdf
This chart from Hans Jud shows his estimate of Ghawar production until year end 2003 and the cumulative production from his chart is equal to Saleri’s 55 Gb.
click to enlarge
Jud’s source for the Ain Dar/Shedgum production is from slide 22 of Saleri’s presentation. I don’t know how he has estimated the production profile prior to 1993.
Here is Jud’s HL for Ghawar with my own dashed red line which ignores the beginning of the dog leg in 2003.
click to enlarge
Jud estimates Ghawar to have URR of about 75 Gb. If the 2003 data point is ignored because it is part of the dog leg, then the URR of Ghawar migh only be 71 Gb. However, these estimates of 71 and 75 Gb are based only on about a dozen data points which means that the confidence interval could be large.
Nansen Saleri has recently left Saudi Aramco and has started up a company called Quantum Reservoir Impact in Houston.
http://www.quantumreservoirimpact.com/
Maybe someone could contact him and ask him to do a guest post on TOD about Ghawar :-)
Thanks ace,
I did know this chart from Hans Jud. 7 Gb difference on cumulative production is pretty significant but 75 Gb for Ghawar seems pretty low. Have you tried a logistic fit on Ain Dar&Shedgun only?
I have not done a logistic fit of Ain Dar/Shedgum but Jud did an HL is his report and estimated a URR between 32 and 41 Gb.
Saleri, on slide 23 of his presentation stated than Ain Dar/Shedgum had total produced and remaining proven reserves of 40.8 Gb, which was a high 60% recovery factor of OIIP of 68.1 Gb. I suppose Saleri's proved reserves might be equivalent to a real world URR.
Here's another very rough method for calculating Ghawar reserves. Slide 22 of Saleri's presentation stated that Ain Dar/Shedgum has produced 27 Gb to year end 2003, which is about half of Ghawar's total production of 55 Gb to year end 2003.
As Ghawar's cumulative production to year end 2003 was double that of Ain Dar/Shedgum, it can be assumed that Ghawar's reserves is double that of Jud's URR high case of 41 Gb (or Saleri's produced and remaining proved reserves). Thus an estimate of Ghawar's URR is two times 41 Gb or 82 Gb :)
Taking this rough method one step further. As Saudi Arabia's cumulative production to end 2003 was about 100 Gb which is about 1.8 times that of Ghawar. Saudi Arabia's URR could then be estimated as 1.8 times 82 Gb or 148 Gb (close to Westexas and your low estimate of 150 Gb).
Add, say, 20% for workovers to come into production to get about 175 Gb URR for Saudi Arabia.
This will likely underestimate Ghawar reserves, and even more so Saudi reserves. The south of Ghawar is much less depleted than the north, and some fields have been barely exploited. It's possible that only Abqaiq is more heavily depleted than 'Ain Dar/Shedgum (of the supergiants).
I have yet to see any of you folks advocating for very low Saudi URRs (eg 150gb) give any plausible reason why the recovery rate should be so low.
In his "Twilight" book, Matt Simmons quoted a retired Aramco executive as saying that, in his opinion, there was no way that the URR for Ghawar would be more than 70 Gb.
This would be a good time for Fractional Flow to weigh in regarding the south end of Ghawar, but if memory serves the permeability drops off dramatically going from north to south.
Given the vast number of variables and our lack of hard data in many cases, the approach that I am taking regarding reserve evaluations is to count the forests--not the trees.
As I outlined in the "In Defense of Hubbert Linearization" article, the post-1970 and post-1984 Lower 48 and Russian cumulative production numbers have been quite close to what the HL models predicted (based on production data through 1970 and 1984 respectively). If the method, in retrospect, was that accurate for regions with two wildly different production profiles, why wouldn't it be reliable for Saudi Arabia? I respectfully submit that the HL method is discounted in many quarters because people don't like the answers it provides.
As I have also outlined, the most accurate pre-peak estimate of URR for Texas came from discounting the pre-peak "dogleg up."
Finally, in our (Khebab/Brown) early 2006 Texas/Lower 48 article, based on the HL method and on Saudi production data through 2005, we were pretty clear about what the HL method and the historical analogue suggested for Saudi Arabia:
Jeffrey, here's the two charts from your paper to which you have referred rather frequently.
http://graphoilogy.blogspot.com/2007/03/could-saudi-arabia-be-more-than-...
I've read the text of your paper and I'm afraid I just don't understand your logic. To my eyes, Texas does have in inflection / dog leg prior to peak year in 1972 and the HL then proceeds along a completely new trajectory post dog leg - to my mind this is exactly analagous to my interpretation of the Saudi data - which you have always disputed.
You have repeatedly said that you want to use the pre-dog-leg data in Saudi, even though you yourself show that doing so in Texas would yield a false result. Please explain the logic here.
Regarding the Texas/Lower 48 article:
I never argued that Texas did not have a noisy pre-peak HL plot, and I never argued that the pre-peak Texas HL data could accurately predict URR. I did argue that the total Texas HL plot could give us an idea of what stage of depletion that Texas peaked. We could then apply that to the more stable Saudi HL plot.
Subsequent to the Texas/Lower 48 article:
I have subsequently observed that the most accurate (still not very good) pre-peak estimate of Texas URR came from discounting the "dogleg up" in the HL plot, right before the peak.
Your Texas plot uses 2 out of the 14 years prior to the 1972 peak / dog leg. But you want to argue that in Saudi all the years prior to dog leg should be used and all the points forming part of the dog leg, leading into peak, rejected.
Hmm!
I'm afraid I'm adrift here.
Regarding the Texas/Lower 48 article, the HL plots (which Khebab did) were constructed using the green points.
OK Jeffrey, my mistake here - I'm a bit colour blind. But I now understand the significance of what Stuart has been saying.
So you need to explain why you include all those pre-dog leg off-trend points in Texas but not in Saudi. What are the objective criteria you are using here to select the points that are included?
On the same theme a couple of weeks ago you were claiming that as Saudi production has turned down this year the HL was returning to the pre-dog leg trend just like Texas - if my memory serves me correctly. Can you please expalin that - I can see no evidence of Texas production returning to a pre-dog leg trend post 1970.
The Texas data from about 1958 to 1964 showed a linear trend pointing toward about 50 Gb. From about 1965 to 1972, the slope of the line was basically zero, pointing toward infinite reserves. After 1972 the data fell into a pretty consistent linear pattern pointing toward 60 to 65 Gb. This was the basis of my contention that the most accurate (still not great) pre-peak estimate of Texas URR came from discounting the pre-peak dogleg up, which was really points showing close to a zero slope.
In a similar fashion, the 1973, 1974 and 1975 Saudi data points showed a pretty much zero slope, while the 2006 and 2007 data points are falling back toward the slope of the red line shown on the HL plot.
My contention is that these doglegs or zero slope points are just artifacts resulting from swing producers going to 100% of capacity.
Consider the alternative explanation--that after decades of production both swing producers suddenly and magically showed vastly greater recoverable reserve potential, with no new large field discoveries.
Uh, thank you. No enlarging will be necessary.
THE SCORE BOARD - SAUDI ARABIA RESERVES FORECASTS
The significant thing to look at is the size of the yellow band which are the remaining reserves. These vary from 40 Gbs (Jeffrey) to the left to 155 Gbs (Colin) to the right. A factor 4 difference is quite significant.
Does anyone have other forecasts that could be added to this compilation?
hi Euan
I combined the work you and Stuart did with data from the 1986 Carmalt & St John report (and recently presented my paper at the Australasian Transport Research Forum):
http://www.philhart.com/files/aspo/RP_Hart_82_TurningPointforTransport.pdf
In “Giant Oil and Gas Fields”, Carmalt and St John (1986) published a list of the largest five hundred oil and gas fields known at the time. This included field size estimates for 24 major fields in Saudi Arabia with a total of 221 Gb URR.
The estimates which you and Stuart produced for Ghawar and Abqaiq are 17% and 16% higher respectively than the Carmalt and St John estimate. You also identified that the reason for that increase is largely a result of an increased OIIP, through producing zones with higher initial water saturation and very low permeability.
The two fields analysed already cover 43% of the resources in the Carmalt and St John paper. If we extend the same 16% increase to the remaining fields, we get an estimated URR of 259 Gb for those 24 giant fields. To this we can add approx 6 billion barrels to allow for oil in smaller fields and those discovered since 1986 (of which Haradh is the only known significant find).
This yields a total URR for Saudi Arabia of 265 billion barrels (surprisingly close to their claimed Reserves). This is below the 3P URR of 280Gb based on the 1979 Senate Committee report, but well above the 2P (best) estimate of 212Gb. Again, the increased OIIP nicely explains where the increase in URR over those two decades has come from.
Taking away production through 2006 of 120Gb, leaves me with a 2P Proven plus Probable Reserves estimate of 145 billion barrels.
Claiming Saudi Reserves of much less than 100 billion barrels is entirely inconsistent with the robust evidence from pre-nationalised Aramco days. How and why would the data from that period have been so completely distorted? There was no CERA/MSN/Iron Triangle like motivation at that point in time?
Even more implausible though, is the Saudi claim to still have 265 billion barrels of reserves!
The increased OIIP in high water saturation and/or low permeability areas will necessarily be somewhat slower/more difficult to produce. It will also tend to drag down average recovery factors.
So while recovery factors in the high quality fields in isolation may reach high levels, as Saudi Aramco adds more low quality OIIP to their resource base, we need to temper any expectations for further increases in average recovery.
cheers
Phil.
Phil - thanks very much for this overview. I basically tend to agree with everything you are saying here - so need to be careful that I am not simply suffering from confirmation bias.
I do feel that the 200 Gb estimate from my production model / Khebabs HL is likley to be low - and my estimate is rated as minimum. I suspect some of the differnce lies in the northern sour oil fields - Manifa for a start at 17 Gbs - though that is included in my production model.
Are you able to send a copy of Carmalt and St John? Is this original work - or is it rehashing older figures - like Rand?
Your report looks interesting and I've not had time to read it in detail yet - I will get back to you on that.
I think this is spot on. Raising OOIP has to be at the expense of lowering average recovery - and in this regard the Saudis have been wanting to have their cake and eat - in applying unrealistic high recovery factors to a bloated resource base.
Best, Euan
Phil - I would broadly agree. My SWAG for Saudi EUR would be 275 +/- 50gb (subjective one sigma error bars). There's a lot of uncertainty remaining unfortunately.
Tony (and Jeffery) - you may recall that Stuart and I undertook a pretty comprehensive analysis of Ghawar using first principals and about 30 SPE papers and other sources earlier this year.
Whilst the details of our analyses differed, the overall conclusions were pretty similar. My base case scenario showed 70 Gbs produced from Ghawar to end 2006. So I'm wondering how this fits with your view of reserves. The whole of the lower half of the field is barely touched, and while reservoir quality is less good in the south - 50 to 70 mD - this is still a great reservoir.
Of course, you are not obliged to agree with this - but I think you need to provide an explanation of where Stuart and I have erred in your opinion - and not just ignore work that is inconvenient to your analysis.
The 70 Gbs is likely to be a bit high since I over estimated the depletion in Haradh - but still!
I'll let you guys fight out the difference in cumulative production numbers for Ghawar, i.e., counting the trees. I gather the difference is whether Ghawar has produced about 60 Gb or about 70 Gb?
From fossil fuel + nuclear sources, the world uses the energy equivalent of 10 Gb of oil in less than two months.
Fundamentally, this whole thing comes down to arguing over how fast the Titanic is sinking.
Well, if the Titanic sank less quickly, perhaps the Carpathia would have arrived in time to save everybody.
Your train of logic seems to be "Ghawar is crashing, thus KSA is crashing, and thus the world is crashing". And then when somebody questions whether Ghawar is really crashing, you just say "details, details..."
I don't think that anyone doubts that the north end of Ghawar is crashing, but as I noted up and down the thread, I really don't have the time, inclination, data or expertise to obsess over individual fields. If someone else wants to, the more power to them, and Stuart has done some very good work on the north end of Ghawar.
However, I don't think that I have focused on individual field performance in any of my published work--other than to point out that the East Texas Field is to Texas as Ghawar is to Saudi Arabia.
In any case, it takes decades to deplete a giant field like the East Texas Field, or Prudhoe Bay, or a super giant like Ghawar, while we consume, from fossil fuel + nuclear sources, the energy equivalent of the oil reserves in the Prudhoe Bay Field about every sixty days.
Meanwhile, as our mathematical model, recent case histories and recent production data show, net export declines tend to accelerate with time. The net export models that Khebab is working on are scary as hell.
Worldwide, we are going to see an epic collision between the expectations of exponentially increasing net oil exports, while the models and current data suggest an accelerating net export decline rate.
Huh? You're writing these comments under an article entitled
The Hubbert Linearization Applied on Ghawar
The production of one field (or one country) of course does not doom or save us in light of the "epic collision" that you refer to. The question becomes "well, then what?" What does the US do in light of declining exports. Use a lot less, obviously, but the die is cast such that doing that quickly is a problem. I agree with Bob Ebersol in that the "left behind oil" in the US represents our most promising source of new oil to make things less bad than they would otherwise be while we build Alan's railroads. I am interested in Ghawar because they have a lot of money and expertise that they can devote to squeezing the most oil possible from what will be the best we will ever see in an oil field.
Since you are in the business of finding oil, how can you not be interested in individual fields and recovery rates?
I am very interested in my oil fields. Regarding Peak Oil/Peak Exports, I don't have the time, inclination, data or expertise to focus on individual fields in foreign countries.
If you will go up the thread to my first post, I think that you will find that I focused on total Saudi production, consumption and exports.
...perhaps the Carpathia would have arrived in time to save everybody.
But in the case of Peak Oil, the Carpathia hasn't even been designed yet, let alone built or steaming to our rescue.
I think I'd rather fight about your tendency to throw out pieces of the data before applying HL to KSA, on the grounds that throwing out different pieces of the data in Texas would have produced the right answer there (if only one had known ahead of time which pieces to throw out).
Or alternatively, perhaps we could fight about your explanation of why a bunch of supergiant reservoirs in KSA are only going to have 15% or 20% recovery rates?
As noted above, I used the total Texas HL plot to determine at what stage of depletion that Texas peaked. I never argued that the pre-peak Texas HL plot could accurately predict URR. That the pre-peak plot is noisy is self-evident.
However, we could then take the total HL plot estimate of Texas URR to give us an idea of what stage of depletion that the prior swing producer peaked. We could then apply that model to the current swing producer, which has a much more stable HL plot.
I did subsequently observe that the most accurate (still not very good) pre-peak estimate of Texas URR came from discounting the pre-peak "dogleg up," which basically seems to be an artifact of a swing producer going to maximum productive capacity.
In regard to specific field recovery factors, I'll let you guys obsess over that. I just don't have the time, inclination, data or expertise to obsess over individual fields.
IMO, URR for Saudi Arabia will probably be between 150 Gb and 200 Gb.
Yes but you are arguing that the pre-peak Saudi data can. You got to expalin the logic here. IMO there is none.
Hmm!?
The Saudi HL plot is much more stable than the Texas pre-peak HL plot. As noted up the thread, the stable pre-peak HL plots that the Lower 48 and Russia showed were quite accurate in predicting the respective post-1972 and post-1984 cumulative Lower 48 and Russian production.
You guys can argue about recovery factors, relative permeabilities, etc., to your heart's content.
The bottom line is that the world is burning through, from fossil fuel + nuclear sources, the energy equivalent of the Prudhoe Bay Field about every sixty days, while the net export models and current data suggest that the ongoing net export decline is accelerating with time.
The KSA HL estimated URR has been increasing by about 6% per year over the last four years. So how many more years should we guess that trend will continue?
I'm not talking about individual fields. When the Senate staff writing the subcommittee report talked to a bunch of Aramco execs in 1979, they said there was 530gb of OOIP. ASPO estimates 600gb. If you ignore all OOIP growth (which I would argue was a mistake, but let me grant you that, and lets take the lower 530gb estimate) and if you want Saudi Arabia to be 70% depleted at cumulative of 120gb, so 170gb all in, and a (very lowball) EUR of 70gb for Ghawar, then that implies a final recovery factor for the non-Ghawar of 100/330 or in the high 20s %. You can't get higher than that, and it's not a terribly plausible number for a set of high quality super-giant fields. A more realistic 100gb for Ghawar, and you're at 70/330 = 21% for the non-Ghawar, which is even less probable. But you want us to ignore that in favor of a HL projection which is veering to the side like a truck with a blown out tire.
And if you don't have the "time, inclination, data or expertise to obsess over" that, then why are you holding yourself out to the public as any kind of authority on the subject, because such people should find the "time, inclination, data or expertise" to know what they are talking about - or at least be willing to go figure it out when challenged and change their opinion if the facts merit it.
The Saudi HL plot also showed that Saudi Arabia in 2005 was in the vicinity of 55% depleted, roughly the same point at which Texas--looking at the total HL plot--peaked. Thus, the above Texas/Saudi Arabia production plot.
And as one would expect, the last two years of Saudi production data have started reverting back to the HL slope shown in the Texas/Lower 48 article.
You have asserted that Saudi Arabia is in terminal decline--or least that it will never equal its 2005 peak production. I agree. Precisely what are we arguing about?
You guys--and anyone else--can argue about individual fields all that you want to. The more power to you. It's just not my cup of tea.
I have focused on using a simple, powerful mathematical tool to estimate the areas under production rate versus time graphs, especially for key oil exporting countries. As I warned in January, 2006, net oil exports have started declining and that net export decline appears to be accelerating.
BTW, in a 27 year career as an exploration geologist, I have studied quite a few oil fields in Texas, including the East Texas Field, but other than to note that East Texas is to Texas as Ghawar is to Saudi Arabia, I don't believe I ever focused on individual Texas oil fields in my published peak oil work. Individual fields were not really relevant to the model.
Again, I note that my argument was not about individual fields. Your answer is completely evasive.
As I said I remain baffled about precisely what we are arguing about, since we both assert that Saudi Arabia will never exceed its 2005 peak production. I guess it is about estimates of OOIP/recovery factors versus HL based estimates.
Insofar, as I can recall, in my published peak oil writings I don't think I have relied on estimates of OOIP versus recovery factors. And a key point that you should keep in mind is that Aramco estimates of OOIP from decades ago are just that--estimates.
To show you how wrong they can be, Shell had to write down their estimated proven recoverable reserves by something like 20% or so.
You are asking me to debate a position I have never taken, to-wit, I have basically ignored conventional estimates of URR in favor of the simple logistic method, which takes the two numbers that we have the most confidence in--annual production and cumulative production to date--to derive a mathematical estimate of the area under a production rate curve.
So again, I am not interested in debating recovery factors versus OOIP, for all of the reasons outlined above in multiple postings, but primarily because the large producing provinces--most recently Saudi Arabia, Mexico, and now the world--are showing production profiles which fit their logistic models.
If you prefer to discuss OOIP and recovery factors, good for you. Have at it.
The point is, a) The Saudi HL is not stable - it's increased by 25% over the last four years, and we have no real idea how much more it might increase - it could very well be off by a factor of 2. We also have good reasons to think the underlying assumptions that might justify the use of a logistic as a first order approximation are poorly satisfied in Saudi Arabia - rather than the oil industry spreading across the landscape and exploiting the resource as rapidly as it could, we have the Saudi authorities deliberately imposing practices (such as peripheral water injection) intended to maximize ultimate recovery and slow down extraction. This began from early in the life of the fields. So rather than a Hubbert type curve rising to 15mpd or 18mpd and then declining, we are likely to see a long low plateau that goes on for decades.
Therefore, there are strong reasons to doubt HL in this case, and it's relevant to look at all available evidence and ask what picture does it present in totality?
The reason I am arguing with you is a I feel that you consistently present a view which is biassed very negative with a tendency to ignore evidence which is inconsistent with that bias (such as the various OOIP estimates available for KSA, and your throwing out parts of the KSA production curve before doing HL). I would prefer that we attempt to determine the truth as objectively as possible by considering all available evidence rather than cherry picking the evidence we consider to support a particular class of conclusions.
It you want to go back and review the original Texas/Lower 48 article, we didn't throw anything out on the Saudi HL plot. Using the totality of the HL plot, Saudi Arabia in 2005 was in the vicinity of 55% depleted.
Regarding the stability of the Saudi plot, we will have to agree to disagree. I think that the recent data, through 2005--showing what is basically a zero slope (pointing toward infinite reserves)--is the same artifact that showed up in the pre-peak Texas plot, as both swing producers went to 100% of productive capacity. This is a not a point I raised in the original Texas/Lower 48 article.
In any case, as I noted up the thread, consider the alternative theory: that the two swing producers, after decades of production, suddenly and magically increased their recoverable reserves, with no new giant field discoveries.
In fact, Texas started declining after showing a zero slope on the HL plot, and so did Saudi Arabia.
Why? Because you want to throw it up there as a strawman? You can't imagine any other reason for maintaining a steady level of production? Your dubious interpretation of a horizontal (zero slope) line (a decade of KSA production) relies on nothing more than speculation about what KSA was capable of producing.
There is plenty of information suggesting that development of new fields was responsible for them being able to maintain flat production in the 90's. And that reference doesn't even mention Shaybah or Haradh.
Have they run out of things in their back pocket? We'll find out eventually. But your HL plot won't tell you much about that in the meantime.
A zero slope on a HL plot does not mean steady production. It means that production is increasing at a rapid rate. The zero slopes on the Texas and Saudi HL plots corresponded to the production increases right before they peaked.
I was referring to the actual production, which has been essentially flat to slightly increasing since 1991. Besides, even a zero-slope on an HL plot--given the stage that KSA is at, would not correspond to "increasing at a rapid rate".
That you can look at that raw data and only focus your attention on the latest little inflections--deciding that it signals impending doom while ignoring all previous (and more prominent inflections--speaks to your inability to do objective data interpretation.
http://www.energybulletin.net/16459.html
Texas and the Lower 48 as a Model for Saudi Arabia and the World (May, 2006)
by Jeffrey J. Brown & "Khebab"
Perhaps you have missed, although I think that I may have mentioned it about 10 times in this one thread, but the captioned paper was based on all available production data through 2005.
In regard to the Saudi HL plot, Saudi Arabia, from 2002 to 2005, showed about a 7.5%/year increase in crude oil production (EIA). Perhaps you don't consider this "rapid," but since it would double their production in about 10 years at this rate, I consider it kind of on the rapid side.
This rapid increase in production resulted in the flattening of the HL plot. So, take your pick. After decades of production, the Saudis were suddenly on track to double their production in 10 years--with no recent giant discoveries--or they were simply ramping up their production to pretty much maximum capacity.
Saudi Arabia, in 2005, was approximately at the same stage of depletion at which the prior swing producer, Texas, peaked. And like Texas, Saudi Arabia has responded to higher crude oil prices with a significant increase in drilling and a decline in production.
One can always choose a select data set to make a case, and here you ignore the fact that the local maximum in production just prior to the dot-com crash and 9-11 is not that much lower than the 2005 maximum. So, if someone slows production in response to declining demand and then brings it back up--you consider that an act of desperation?
It is true that there is a dearth of recent giant Saudi discoveries, but there were plenty of discovered but un(der)developed areas available, including Shaybah, Haradh, to account for added production during this decade.
This little vignette, which you probably have as a bumper sticker on your car, is only true if one believes that the HL plot is accurate for Saudi Arabia--which brings us back to the same flaw in your analysis.
We shall simply have to agree to disagree. Meanwhile, as I warned in January, 2006 (using the "flawed" analysis), world net exports are declining, and as our model indicated, that net export decline is accelerating.
"Regarding the stability of the Saudi plot, we will have to agree to disagree. I think that the recent data, through 2005--showing what is basically a zero slope (pointing toward infinite reserves)--is the same artifact that showed up in the pre-peak Texas plot, as both swing producers went to 100% of productive capacity"
Exactly - it's stable as long as you throw out all the inconvenient data which shows it isn't stable.
I am just making the point that both swing producers showed the same logistic behavior right before they peaked. If you wish, you can call it unstable. I call it an artifact of a swing producer going to 100% of capacity.
In any case, as noted above, we didn't throw anything out in the Texas/Lower 48 paper, in which we warned of an imminent decline in Saudi oil production.
Hi Euan,
Saleri, in his 2004 presentation, says Ghawar produced 55 Gb crude oil to end of 2003. If Ghawar produced 5 mbd for 2004, 2005 and 2006 that would be another 5.5 Gb to give a total of 60.5 Gb. 70 Gb seems high.
Came across this paper by Horn and Salvador.
http://www.searchanddiscovery.net/documents/2007/07032horn/images/horn.pdf
It estimates world URR by "linking estimates of ultimate recoverable oil and gas made by industry
experts over the last 60 years (Salvador, 2005) with current data on 945 giant fields (556 oil and 389 gas, Horn,
2003, modified)."
Amos Salvador's credentials are impressive
http://aapgbull.geoscienceworld.org/cgi/content/abstract/90/1/21
"Amos Salvador received his Ph.D. from Stanford University in 1950. After 30 years in the oil industry, the last 25 years with Exxon affiliates, he joined in 1980 the Department of Geological Sciences of the University of Texas at Austin, where he taught courses on stratigraphy, petroleum geology, and energy resources"
Here is part of table 4 from Horn's 2007 paper
click to enlarge
URR of Ghawar is 66 Gb! Safaniya 21 Gb. Manifa 17 Gb. Shaybah 16 Gb. Zuluf 12 Gb. Total of these fields is 132 Gb.
Hi Tony - I agree with your opening comments about Ghawar - as I noted I over-estimated produced - mainly by allocating too much production to Haradh - so what has not been produced yet has yet to come. I have no problem with 60Gbs produced. But need to suggest that you sit down with a map of Haradh, measure the area, multiply by net reservoir thickness, porosity and oil saturation, divide by FVF - and see what you get.
Horn and Salvador - an interesting new source. But you need to question the origin of their numbers - I have yet to read the paper. Are they simply recycling pre-existing estimates? Same applies to Phil Hart's Carmlat and St John paper. Its no good finding a source and beleiving the bits you want to. Though as I noted in my reply to Phil, we all suffer from confirmation bias.
Stuart and I actually measured the size of Ghawar and got figure of around 100 Gbs. Therefore I feel disinclined to accept the work of Horn and Salvador - they and you need to show where Stuart and I have erred if you want us to accept a figure of 66Gbs. I'm happy to accept a figure of around 60 Gbs produced to date - but believe the 6 Gbs remaining is wholly untenable.
Interesting to note some comparisons between Carmlat and St John and Horn and Slavador.
C&St / H&S
Shaybah 7 / 16
Manifa 17 / 17
Safaniyah 36 / 21
As already noted, C&St provide a figure for Ghawar that seems more rooted in the reality of the work Stuart and I have done - so I feel more inclined to believe that source. But in reality we should both be wary of accepting either source merely because they support our prejudicies.
66gb sounds like a 1P estimate from the 1970s. If memory serves (I don't have the docs with me), the 1P estimates were based on a recovery rate of 33%, and 33% of 200gb OOIP would be 66gb.
I'm on 52% recovery for north Ghawar, and while the south might be somewhat poorer, it's hard to see how it can be so bad as to drive the whole thing down to 33%.
What would your loglets model have predicted or added to your HL analysis.