Depletion Levels in Ghawar (Updated)
Posted by Stuart Staniford on May 19, 2007 - 11:30am
Introduction
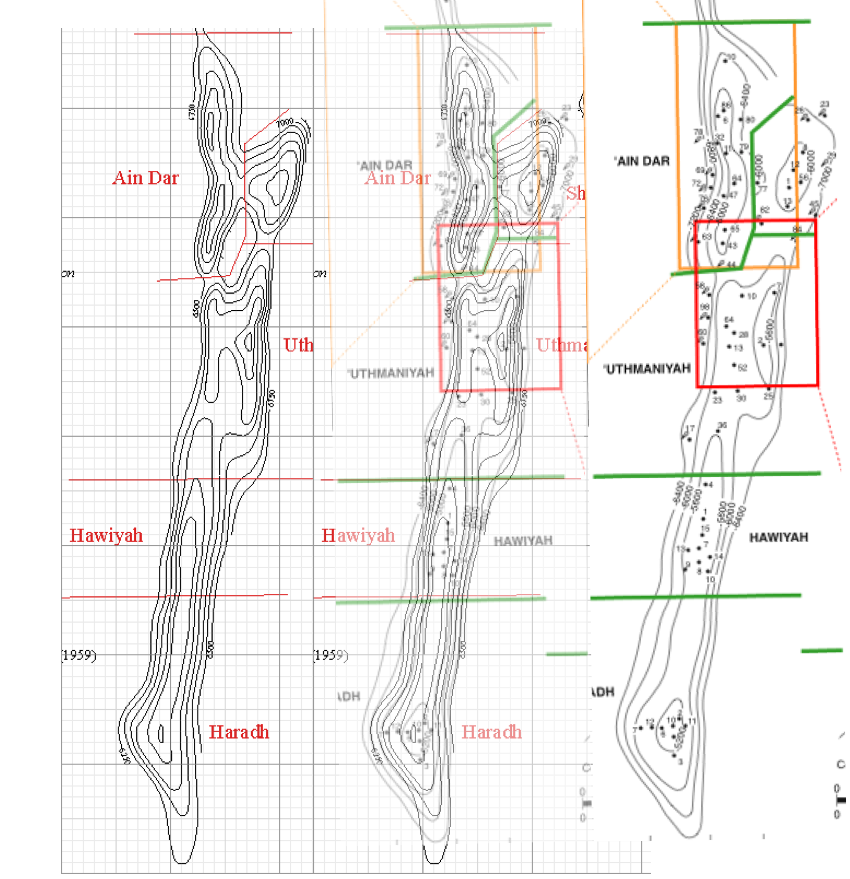
This analysis is a summary of my attempt to understand two pictures, which implicitly pose two questions.The first picture is this:
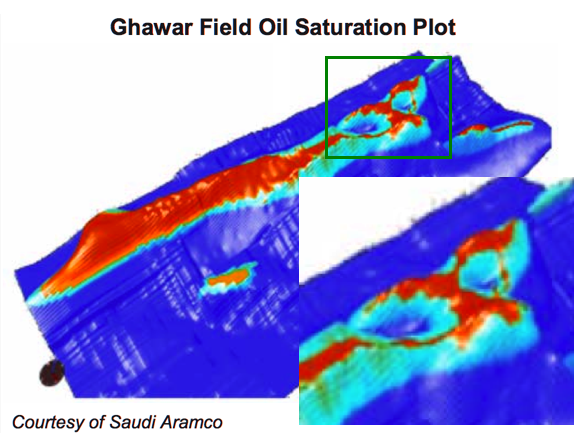
Here the question is: is this an accurate picture of the state of recent depletion of Ghawar? (Ghawar is the world's largest oil field, and source of over half of the oil produced by Saudi Arabia).
And if so, then the second question arises: does that depletion have anything to do with this picture?
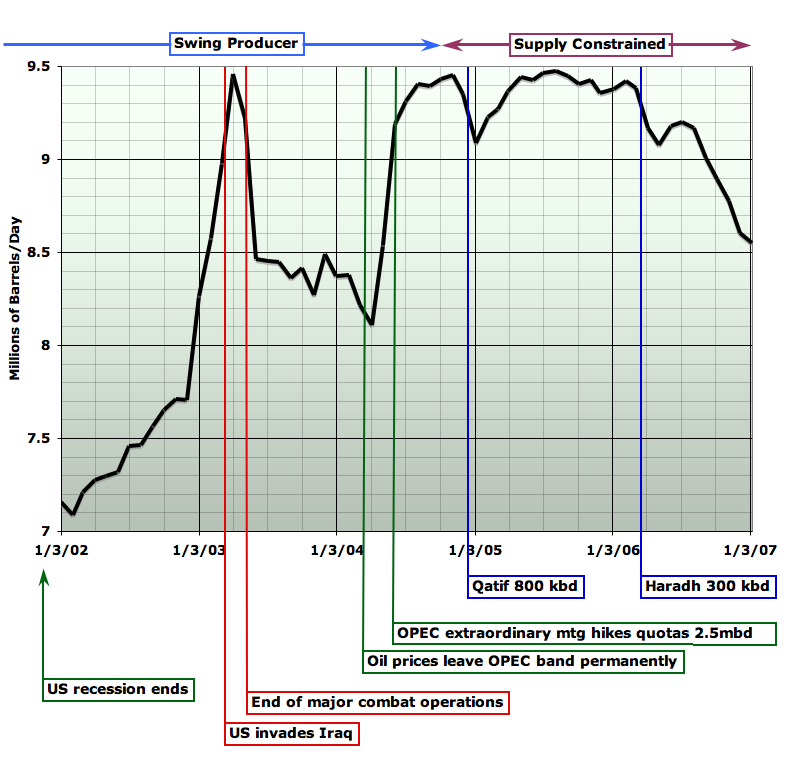
In particular, Saudi oil production has been falling with increasing speeed since summer 2005, and overall, since mid 2004, about 2 million barrels of oil per day in production has gone missing (about 1mbpd in reduction in total production, and about another 1mbpd in that two major new projects, Qatif and Haradh III, failed to increase overall production). That's 2.5% of world production and, if that production hadn't gone missing, gasoline in the US likely would still be somewhere in the vicinity of $2/gallon instead of well over $3.
I will analyze six or seven separate lines of technical evidence, and argue they all point to a consistent picture, which says that the answer to both questions is "Yes". Yes, the northern half of Ghawar is quite depleted. And yes, this probably explains at least part of recent production declines. Furthermore, it is likely that more declines in Saudi production are on the way.
The evidence in question comes from quantitative forensic correlation of hundreds of disparate pieces of data from dozens of technical papers about different aspects of Ghawar. Thus this analysis is very long and detailed - my apologies to the reader. It summarizes 300+ hours of work on my part, and probably similar amounts of work by several other members of the loose Oil Drum coalition investigating Ghawar and (most particularly Euan Mearns, who has posted his own thoughts and Fractional_Flow). It's just a lot of material to document. And in attempting to address both the detail needed by technical readers and the explanations needed by less-technical readers, the length has grown further. Given the importance of the subject, in a choice between being thorough and being brief, it seemed better to be thorough. I will at least do my best to be clear in my exposition.
The Linux Supercluster Picture
Let's first go over a little background to make sure we understand what we are looking at. We'll start with this schematic of part of Ghawar (courtesy of Euan Mearns):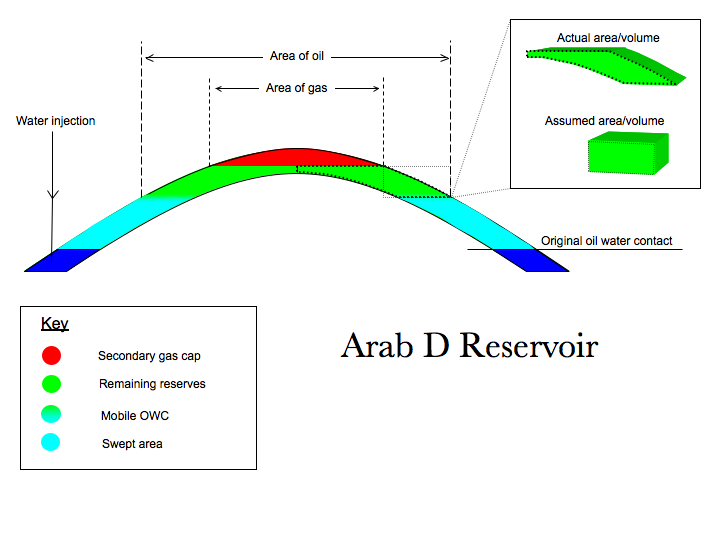
An oilfield consists of some layers of rock, the reservoir, which contain pores, spaces between the rock grains, which contain some combination of oil, water, and natural gas. Above the reservoir is a cap of some kind which will not allow the passage of fluid and which is shaped to trap the oil and gas from migrating upwards. This they otherwise would do because they are lighter and more buoyant than the water that tends to fill rock pores underground.
Roughly speaking, the green volume in the picture above is the oil, and the dark blue volume is the water that was originally below it. This is not quite true, as the oil region invariably has some droplets of water still trapped in the rock pores as well: this is the initial water which cannot move. There may or may not be a cap of natural gas above the oil, depending on which part of the field we are in.
Oil in Ghawar is being produced by peripheral water injection. In this case, in addition to the natural water below the oil, water is being pumped down special injector wells at the edge of, and thus below, the oil area. The pressure of that water is slowly forcing the oil up the structure to wells at the top, from where it flows to treatment plants. The pale blue area in Euan's picture above is the swept area that used to be oil, but now is mostly water. Unfortunately, it's not all water. Just as there was some water in the oil before we started, there will be some oil in the water when we are done. This residual oil, which will not come out from any amount more flooding by water, consists of little droplets of oil beaded up and stuck in small pore channels in the rock.
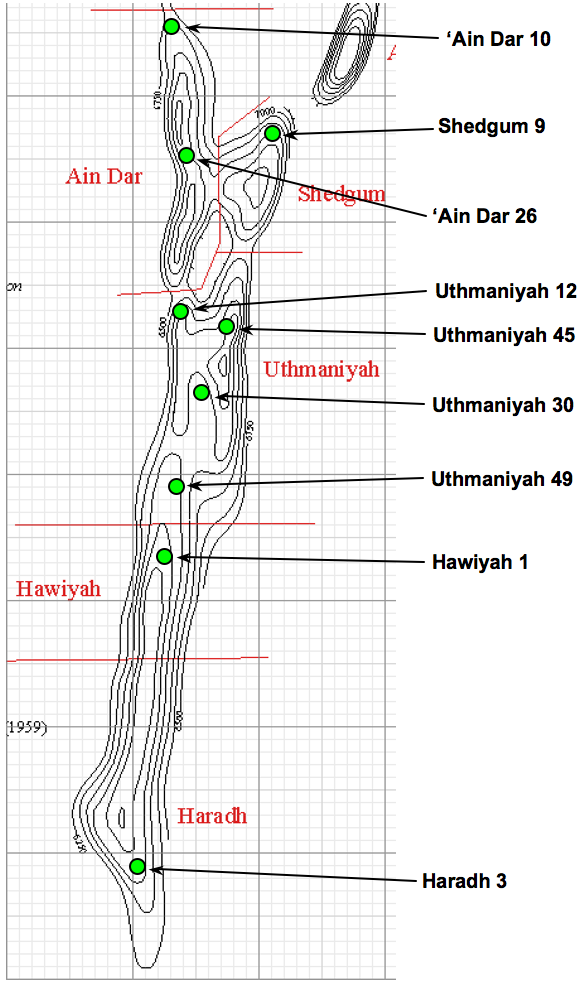
So with that understanding, let's look at the Linux supercluster picture again. By default (or if you click the "Region Labels On" button), we are looking at labels of the division of the field into major operating areas. For readers new to the subject, it will be particularly useful to take a minute to become familiar with these.
- 'Ain Dar is the northwestern operating area, divided into two crest structures - underground hills in the reservoir shape - North and South 'Ain Dar. This area is of very high quality reservoir rock (holds lots of oil and lets it flow easily) and was the first discovered and put on production back in 1951. The picture shows it quite depleted now.
- Shedgum is in the North East, and is also of very high quality, and also shown quite depleted in the picture.
- Uthmaniyah is in the center of the field. Northern Uthmaniyah consists of a distinctive dual crest structure (two north-south running ridges with a lower area between them. Northern Uthmaniyah is also very productive, but southern Uthmaniyah much less so.
- Hawiyah is the area below Uthmaniyah and is of much lower quality. It was put on production in the 1970s, and is not very depleted in the picture.
- Haradh is the southernmost region in the field. It was developed in three phases beginning in 1996, and concluding in 2006 with the bringing on stream of Haradh III (the southernmost portion). Haradh is the poorest quality part of the field and this will limit the rate of production. The picture shows it only slightly depleted.
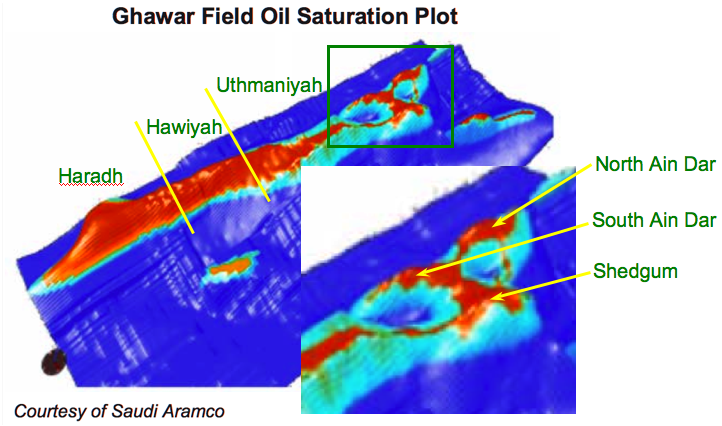 "Linux Supercluster" visualization of oil saturation in Ghawar, with focus region on 'Ain Dar and Shedgum regions at northern end. Use buttons to cycle labels. Source: Figure 3 of Linux Clusters Driving Step Changes in Interpretation Simulation. (pdf).
If you now click the "OWC Labels On" button, you will see labels that show, for the northern operating regions, where the contact between oil and water was before production started - the original oil water contact (OOWC). I've also shown as "OWC2004?" the approximate level of the oil water contact (OWC) at the time the picture denotes (perhaps 2004), and, in yellow, the crest of each structure, which is where the water will reach to when all production by waterflood is over. At that point, this picture would show those "hills" as all pale blue (at least if all oil could successfully be produced).
As you can see, the picture shows quite a lot of the "hills" already being free of oil. Although it's hard to estimate precisely, I don't think you could say that the average height of the top of the pale blue swept area has reached less than 55% of the height of the structure. Similarly, I think it's definitely less than 75% of the way up - overall it looks about 2/3 of the way up. I encourage you to stare at the picture and make your own subjective estimate to see if you think my range is reasonable - I will be comparing this to other estimates later.
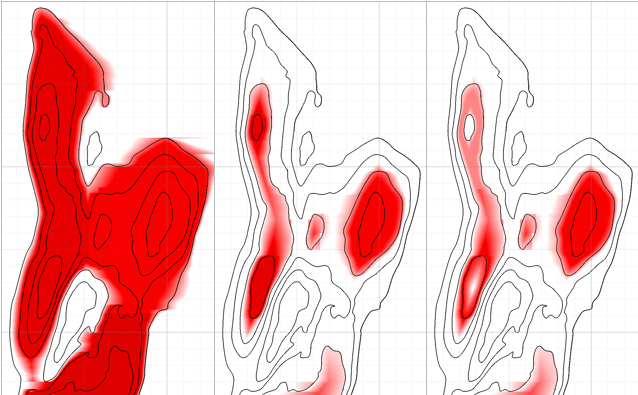
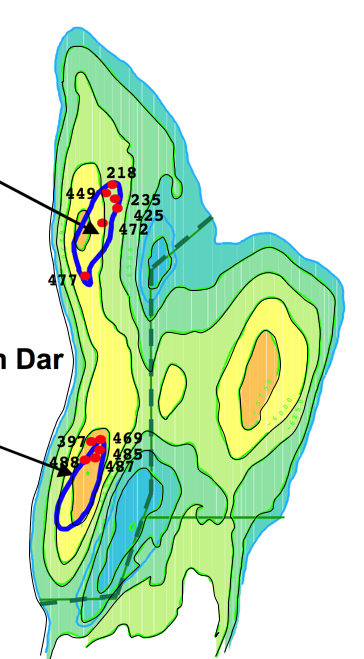
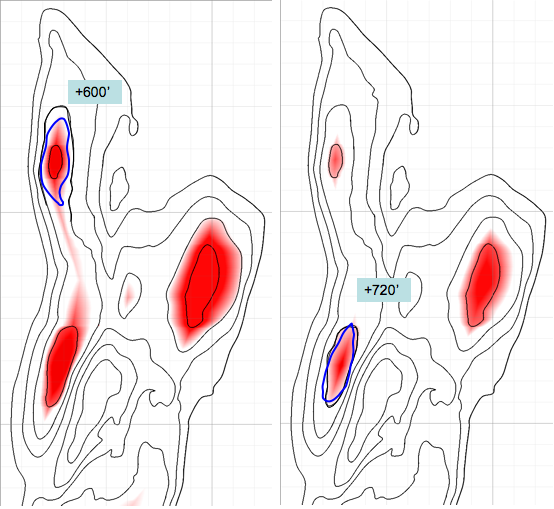
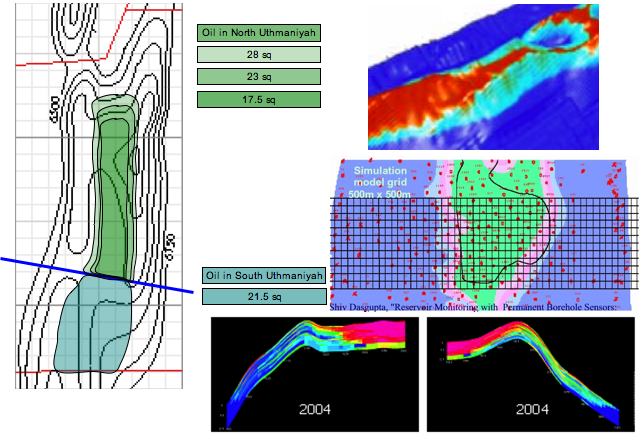
However, something that's important to understand about this picture is that the vertical scale is very exaggerated to make the shape clearer. Ghawar is really enormous and almost flat. It's about 175 miles from tip to toe (ie 2 1/2 hours driving at freeway speeds). And the structure slopes up to the center at only a few degrees. The effect of that is to make it so that 2/3 of the way up the structure is a lot more than 2/3 of the oil gone. This next picture shows a model estimate that I generated (explained later) of the effect of being two thirds of the way up in the 'Ain Dar and Shedgum regions. On the left is how much oil was there to begin with (darker red is more oil) and on the right is how much would be left (roughly) if the OWC were 2/3 of the way up the structure like that.
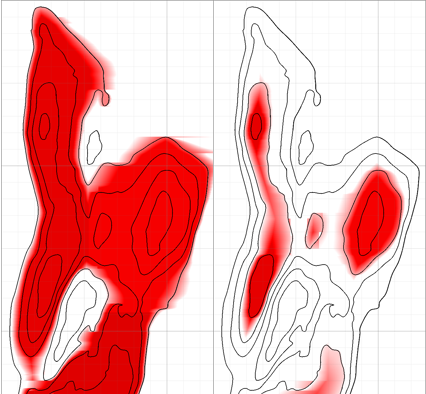
The model doesn't quite distribute the oil the same as the Linux supercluster picture, but it's in the ballpark, and because it allows you to effectively look straight down, you can see how much oil has gone. We will discuss exactly what this model is doing later. For now I just want to illustrate that 2/3 of the way up the structure is a lot of oil gone.
However, after all this discussion of the Linux supercluster picture, you might be wondering whether there's any reason to think it has any fidelity to the true state of affairs in Ghawar.
The paper from which the picture comes is a general survey for an industry magazine of the use of Linux superclusters for large scale computation tasks in the oil industry. The authors discuss as one of their examples Saudi Aramco's use of these types of massively parallel computing clusters to simulate oil and water flow in their reservoirs:
One approach is to not make the assumptions. Instead, brute force can be used to run very large simulations where the best geological understanding is rendered in detail. Already, models run at higher resolution than in the past. In the case of managing the world's largest asset, the Ghawar Oil Field, Saudi Aramco runs its POWERS simulator on a massively parallel HPC. As of 2004, this 128-node Pentium IV®-based machine had run full field simulations with between 10 million and 100 million cells and more than 4,000 wells, with larger runs pending. These simulations are run with multicomponent hydrocarbon models, waterflooding with varying brine chemistries, and dual-perm response to match fracture-flow history. Some runs include CO2 floods.And that's all the text covering Figure 3. So, clearly the picture is not intended as a report on the status of Saudi fields. Instead, it's intended as an illustration of how cool their simulators are. The question is, did Saudi Aramco a) accidentally publish to the entire world, in an obscure publication, a state of the art simulation generated picture that revealed very clearly the status of their biggest oil field as of 2004 (the year that the text references simulations as being done)? Or b) give away a simulation of some other year, maybe far in the future, or some hypothetical scenario that bears no relationship to current reality?This capability not only allows Saudi Aramco to run fairly large models with minimal or no scale up, but also to execute history matches extremely rapidly (in some cases, in hours to days). Saudi Aramco has used this capability for infill drilling, water cut management, breakthrough prediction and other basic reservoir engineering choices (Figure 3). New data can then be incorporated into updated geological models that underpin the simulations.
Clearly, the question cannot be answered beyond reasonable doubt from the text above. So now we will turn to other evidence. First, however, we will have to gain a better understanding of the nature of the reservoir, so that we can better understand that evidence.
Before moving on, I want to briefly draw attention to the mention that some simulation runs "include CO2 floods". This suggests planning for tertiary recovery approaches (low production rate, expensive, final resort ways to get the last oil out of a field).
Geology and Reservoir Properties
The structure of Ghawar is a large anticline - the compressive forces of plate tectonics have caused the almost level strata of sediments to buckle up very slightly. The reservoir rock, which is known as the Arab D layer, was laid down in a large shallow sea off the Arabian coast during Jurassic times. It is essentially limestone formed of the remains of countless marine organisms that lived in that sea, died, and fell to the bottom. In places where the sea was shallow, storms and currents stirred up the sediments and ensured that only larger grains could stay in place - these ultimately formed highly porous rock which could hold a lot of fluid (high porosity), and in many cases allow that fluid to flow freely amongst the pores (high permeability - related to porosity, but not the same thing as sometimes ample pores can be poorly connected to one another). In other places, deeper waters allowed the deposition of very fine particles which formed lime mudstones with limited pore space and even poorer flow properties.Overall, the sea rose at the beginning of the deposition of the Arab D reservoir, and so the rocks at the bottom are poorer in reservoir qualities throughout the field. As the sea gradually filled up with sediments over the course of 2-3 million years, it got shallower and the rock formed grew more porous. Thus the rocks at the top of the reservoir are generally better. However, the southern end of the reservoir was generally deeper water than the northern end, and the rocks there were substantially poorer even in these later stages. However, considerable briefer variations happened at one time and another and there is significant vertical and lateral heterogeneity in the rock. We can summarize the situation though by saying that there is about 250'-330' of total Arab D rock, with more at the northern end. Of this, 140'-200' were traditionally considered sufficiently permeable to allow oil production, and constituted the "net pay". The bulk of the net pay occurs in the upper half of the strata - generally known as Zone 2 - but the balance occurs in a number of thinner layers scattered through the lower zone 3, and even into the rarely discussed zone 4 at the bottom.
Eventually, the deposits climbed high enough and the sea retreated enough that the top of Ghawar became a large salt flat, which eventually formed into a thick impermeable layer of anhydrite. Thus later, when oil from slightly older deposits began to rise up through fractures in the rocks below the Arab D reservoir to replace some of the water there, it encountered the anhydrite layer and could go no further. Zone 1 is a transitional zone between the high quality zone 2 layers of reservoir and the overlying cap which will not support fluid flow at all.
To get a clearer sense of the zones have a look at this next picture (you might want to click on it to get a larger version in its own window). This shows the porosity, permeability, and rock type as a function of depth in one well somewhere in the Uthmaniyah region of Ghawar (the paper from which it comes does not give a more precise location).
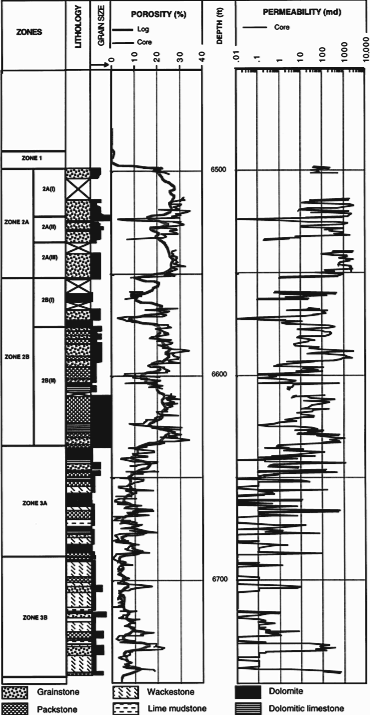
As you can see, there is about 250' of total (ie gross) reservoir in this well, and you should be able to see the clearly higher porosity and permeability in zone 2 versus zone 3, especially the upper part of zone 2 (we will discuss porosity and permeability more quantitatively later, but it might be worth noticing now that the permeability is on a log scale).
For another perspective on the situation, take a look at this next figure which comes from a 1962 analysis by RW Powers of Ghawar rock (with some reconstruction by me). This is how the figures were originally created from samples taken every six inches from an oil well, and then mounted on 1200 microscope slides:
A standard Leitz mechanical stage was converted to a point-stage by addition of a spring clip to engage notches filed in one of the traversing wheels. These notches were spaced to allow a linear slide motion of 0.8 mm between stops. Distance between point count lines was controlled by the second traversing wheel. Numerous experiments were tried to determine an ideal spacing between lines of points for obtaining acceptable results in a minimum of time. Initially a pattern with points 0.8 mm and lines of points 1.0 mm apart was used (about 600 points per slide). Compared with line integration results from the same slides, this point density gave no difference for any one constituent greater than 2 per cent. Using a 0.8 by 2.0 mm grid on slides with irregular particle shape and poor sorting, the maximum difference was 4 per cent. The difference increased progressively as distance between traverses increased. Most slides were finally counted on a pattern of 0.8 by 2.0 mm (about 300 points)...1200 slides, 300 points each, bent over the microscope, click, measure, click, measure, click, measure, day after day, week after week, month after month. Heroic science. All I did was cut and paste his figures together and then measure various things in them.Figure 3 shows the data recorded for each slide. To record this information, a battery of 24 individual hand counters was mounted in lines corresponding to size classes and types of components. For each stop of the point-count stage, a counter appropriate to the component or port type appearing under the cross hairs was punched. At the same time, the apparent long axis of each originally sedimented grain was measured with a micrometer ocular and the proper size grade recorded by counter.
This is a log from a well in Haradh (the southernmost, poorest part of the field):
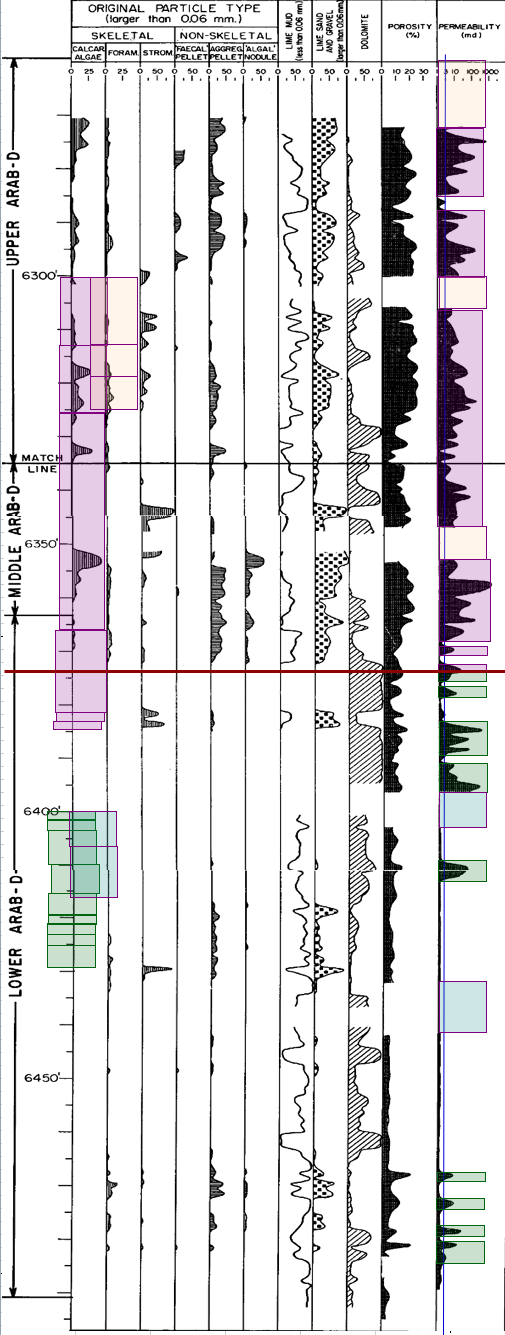
Here we have only about 205' of gross reservoir - significantly less than in Uthmaniyah. The colored boxes represent an analysis to determine the amount of net pay (defined here as rock of permeability 3 milliDarcies or better (anonymous industry experts assessed the boundary between "net" and "non-net" as anywhere from 10mD to 0.3mD, and report that over time the trend has been to count worse rock as included in the reservoir, a point we will return to). You can see that zone 2 has a lot more net pay (the pink boxes) than zone 3 (the green boxes). This well has an estimated 136 feet of net pay. (The "estimation" comes into it because we have to correct for missing data).
Hopefully, the gradient from Uthmaniyah down to Haradh is clear. Everything is somewhat worse - there is less zone 2 in total, less of both zone 2 and 3 are "net", the net there has worse porosity and permeability. Wells further north than Uthmaniyah are roughly of similar nature, but a bit better: they have more zone 2, more net pay in both zones 2 and 3, and the net pay is better (more porous and more permeable).
It's also worth noting the enormous variations in the permeability, which is shown on a log scale. Rock of permeability 1000mD will, at the same pressure difference, carry 1000 times more fluid flow than rock of permeability 1mD, and both extremes are common in the Ghawar reservoir rocks - the reservoir is not homogeneous at all, even in a single well. Porosity varies in the range 5% to 30%, though the upper end of that range is not attained in this Haradh well.
If you study this next picture, it shows a series of well summary pictures from Powers 1962 paper, with the Zone 2 and 3 net shown in overlaid colors (I determined the correspondence between the modern zone 1-4 scheme and Powers upper/middle/lower scheme by detailed correlation of wells in Uthmaniyah - the bottom of his "Middle" cuts off about 10' above the bottom of zone 2 in Uthmaniyah). I cut and pasted Powers pictures together into a north-south spectrum of just the wells he analyzes in Ghawar. Click on the picture to get a bigger version in its own window:

In addition to the trend in the amount of zone 2 to zone 3, you should also look at the "Calcarenitic and coarse carbonate clastic" component. That's the good stuff: big open grain structure that will let lots of fluid flow. You will see that there is far more of this open grained rock in the north than the south. There is also more in the upper part of the wells than in the lower. Thus it is that the rock in the south is significantly poorer than the rock in the north, though this is a continuum, rather than a fundamentally different kind of rock.
The largest depth of gross reservoir in any of these wells is about 270-280'. However, in the literature there is discussion of as much as 300'-330' of reservoir when the very poor quality Zone 4 is included (zone 4 is frequently not mentioned or studied, presumably because it makes a very limited contribution to production in most locations in Ghawar).
The approximate location of the wells in that last picture is as follows:
As you can see, they form a reasonable sampling of the field, though not as good in the south as the north.
Development History of the Field
Logically enough, the development of the field began with the good parts in the north and has gradually proceeded south. Ain Dar, Shedgum, and Uthmaniyah all began production in the 1950s, Hawiyah not until the 1970s, and although there was some limited development earlier, full injection supported production in Haradh has been bought on in three phases - Haradh I in 1996, Haradh II in 2003, and Haradh III (the "toe" of the "boot") only in 2006.An anonymous correspondent recently gave me a hard copy of the 1979 staff report to the US Senate Subcommittee on International Economic Policy on "The Future of Saudi Arabian Oil Production" (the report mentioned in Appendix C of Matt Simmons' book "Twilight in the Desert"). It has the first reliable figures for plateau production in all the operating areas that I have seen. At that time, production was as follows (either actual or planned):
| Operating Area | Production |
| Ain Dar | 1.0 mb/d |
| Shedgum | 1.25 mb/d |
| North Uthmaniyah | 1.9 mb/d |
| South Uthmaniyah | 0.4 mb/d |
| Hawiyah/Haradh | 1.3 mb/d (est) |
| Total | 5.85 mb/d (est) |
The figures for Hawiyah/Haradh were planning assumptions, not based on actual production. We know from a recent paper that Haradh produces 300kb/d from each of three operating areas, for a total of 0.9mb/d. Production of 0.4mb/d in Hawiyah would look about right as it has similar area to South Uthmaniyah, about half the area of Haradh, and quality intermediate between those two.
We will discuss more recent production history in a little while, but this gives a sense of the relative importance of different areas. The important point is that the northern end of the field, from North Uthmaniyah up, has historically been far more productive, with over 2/3 of the productive capacity on these figures. The combination of more rapid production and a much earlier start to production would certainly make it plausible that these areas of the field would become depleted first.
Evidence of Recent Flood Front Location in South 'Ain Dar
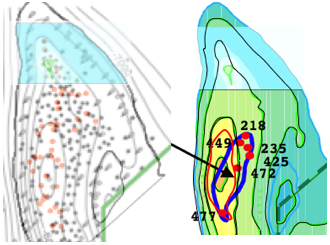
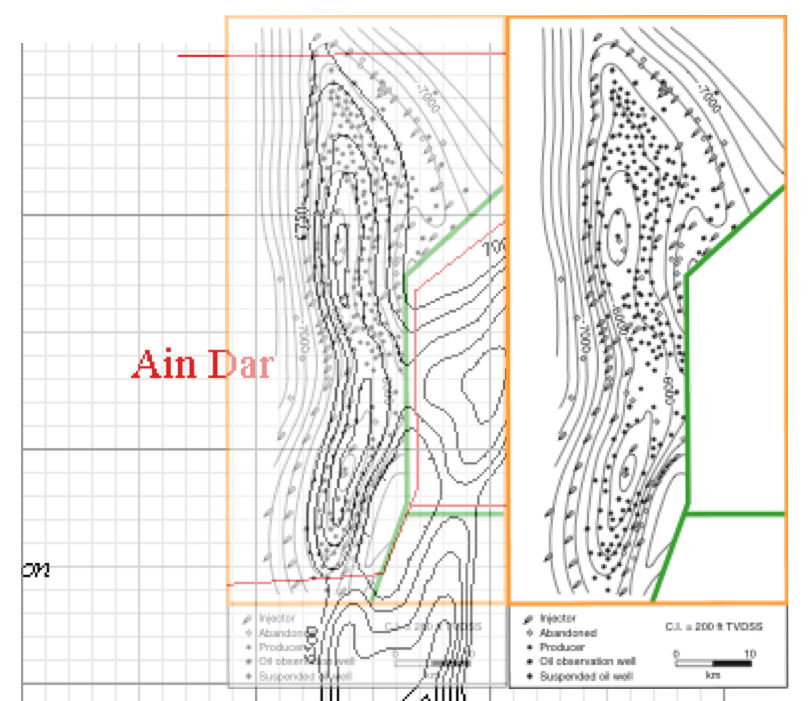
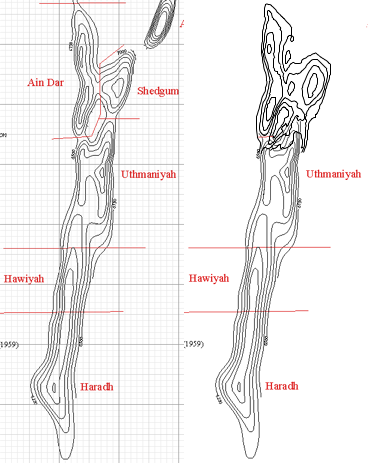
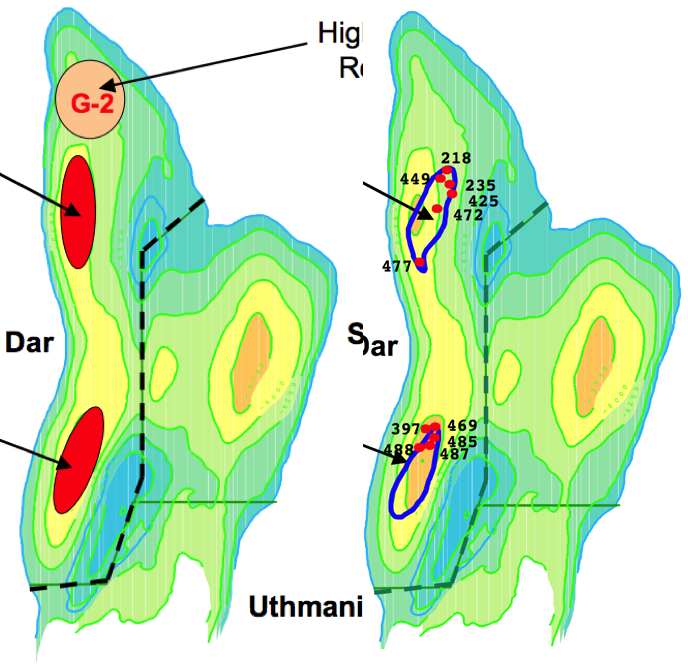
Now that we have a feel for what the reservoir rock layers are like, and the different operating areas of the field, we are in a better position to assess various other pieces of evidence for the position of the flood front in recent years.The first piece of evidence comes from a paper by Hussain et al Optimizing Maximum-Reservoir-Contact wells: Application to Saudi Arabian Reservoirs presented to the 2005 International Petroleum Technology Conference (IPTC 10395). The paper is a discussion of several well planning exercises in Ain Dar and Shedgum. Individual simulations were performed to assess the likely lifetime performance of the wells. However, our immediate interest is in a picture which shows the location of one of the planned wells:
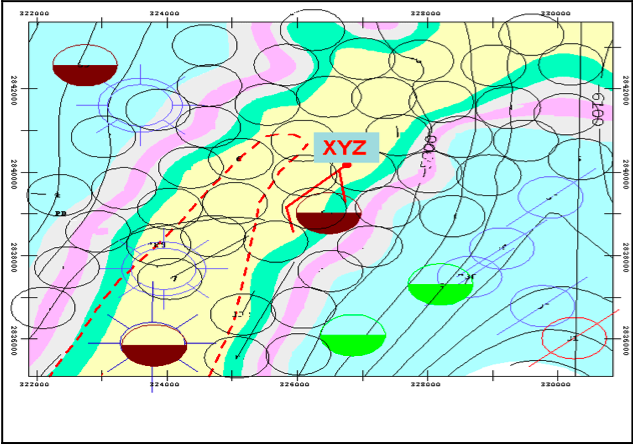
There is no key for this figure in the paper, and nor is the location shown in terms of the rest of the field. Thus, the first time I looked at this it seemed completely mysterious. However, after staring at it long enough, it turns out it can be decoded to determine quite precisely the state of the field in South 'Ain Dar and the saddle between South Ain Dar and Shedgum. The key thing is to look at the contours. I have labelled them more clearly, and shown the relationship to an overall map of 'Ain Dar/Shedgum, a key to the oil layer from Figure 8 of the same paper, and the relationship to the Linux Supercluster picture.
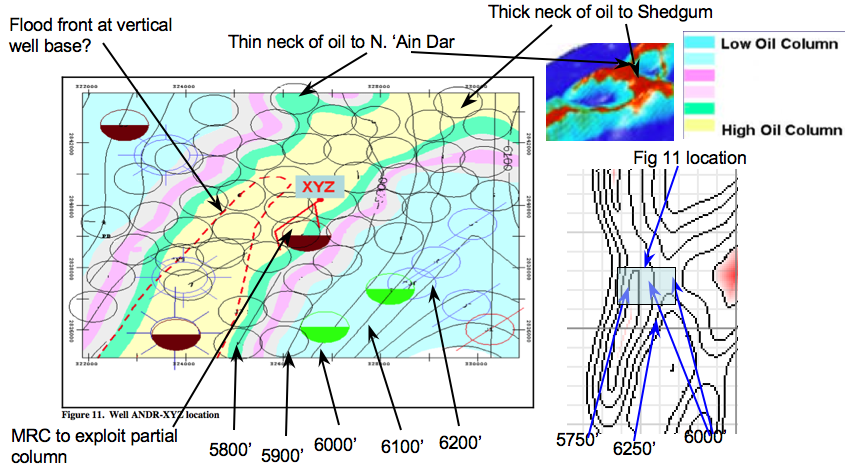
Let me try to explain what you are looking at here. Firstly, it's critical to understand what the contours mean. These are depths below sea level in both Figure 11 and the fragment of the map from Greg Croft's page (on which much more later). The contour heights refer to the top of the Arab-D reservoir. So when looking at a point on the 5800 contour, say, we are looking down on the top of a column of something like 275' (give or take) of reservoir rock. Since the top of the reservoir at that point is at 5800' below sea level, the bottom of it would be at 6075' (in round numbers). Of that 275' of reservoir or so, about 200' or is actually good productive rock, while the rest is marginal enough that, at least in the past, it would not have been considered, but the 200' of good rock is scattered in layers amongst the total 275' of rock column. Within the context of a small area like Figure 11, the thickness of the reservoir probably doesn't vary much. In particular, any variations in structure thickness probably don't have much to do with the variations in structure height, since the thickness is controlled by events when the rock was being laid down in the late Jurassic, while the height is controlled by tectonic distortion of the structure during the Cretaceous, 80 million years later.
Now, if you look at the location for Fig 11 (100' contour interval) I have proposed in the overall 'Ain Dar/Shedgum picture (250' interval), hopefully it is clear that there is really no other candidate location that could work at all. To get those contours to match, you have to be high up on the south side of a east-west saddle that tops out at a little below 6000'. There's only one place like that.
Once you've got your mind around the contours, the next thing to look at is the colored regions, which almost certainly represent the thickness of the oil layer, with yellow representing something close to the original thickness of the layer, and the other colors representing less and less thickness of oil (because water is intruding into that part of the oil layer as the water advances and the oil retreats up the structure to be produced out of wells up there). A key from Figure 8 of the same paper, which shows a well location in Shedgum is included above, and this figure likely has a similar color scheme.
So, given that, it should be clear that the picture above is similar to the Linux Supercluster picture. A relatively narrow ribbon of oil lies along the top of the south 'Ain Dar cap and goes across the saddle to Shedgum, while a much narrower ribbon goes up towards the North 'Ain Dar crest. On the crest, there is no oil column below the 5900' contour, and we don't have a full column below 5800'. However, the oil across the saddle dips down, and we have a full column crossing the saddle down at some level between 6000' and 6100' below sea level.
Back before oil production began, oil in this area went down a little below 6500', while the top of the South 'Ain Dar crest is a little shallower than 5600 feet. So overall, we are about 2/3 of the way up the structure on the crest here, but have some extra oil in the saddle. So this is very much consistent with the Linux Supercluster image being a 2004 image (given this Figure 11 is from a 2005 paper).
A Word on Uncertainties
Before we go much further, I want to say a few words about errors and uncertainties. One of the things I have attempted to do in this analysis is to make quantitative estimates of the uncertainty in all the important things I am analyzing, and you will be seeing more and more of this from here on out. Some folks who saw early drafts of parts of this analysis experienced some confusion if they don't think this way all the time, so let me stop here for a micro-lecture on that subject.When I say, as I will shortly, that I believe the ultimate recovered reserves (URR) of oil from Ghawar via waterflood (that is excluding tertiary recovery techniques) will be 96 ± 8 billion barrels (gb) of oil, that could be translated informally as follows:
- I don't know exactly what the ultimate waterflood recovery will be, but more likely than not it will be in the range 88-104 gb (this is known as the "one sigma" range).
- It's really quite unlikely that it would be outside the range 80-112gb, but it's not inconceivable (the "two sigma" range).
- If my estimate is right, it is for practical purposes impossible for Ghawar ultimate waterflood recovery to lie outside the range 72-120gb (the three sigma range). If it did, my estimation or error analysis would almost certainly be mistaken. In particular, if my estimation and error analysis are correct, then someone claiming that the Ghawar URR will be 130gb, as Saudi Aramco does, must be relying on something other than the waterflood for the last portion of the oil. Otherwise, their view and mine would be statistically incompatible, and one of us would be in error in some fashion.
More formally, in a wide variety of practical situations, the results of a complex calculation that brings together many different unrelated uncertainties will be approximately "normally distributed" - having a special mathematical form originally due to the German mathematician Gauss. If so, then we can say that the odds of the end result being no more than "one sigma away" from the estimate is 68%. The probability of being no more than two sigmas away is 95%, and the probability of being no more than three sigmas away is 99.7% - that is there is only 3 chances in a 1000 of being more than three sigmas from the estimate if that estimate and uncertainty were correct. If the assumption of a normal distribution is in serious doubt (which I don't believe it is here), then a pretty much universally applicable theorem called Chebyshev's inequality guarantees us that the worst case is that the two sigma range is at least 3/4 probable, and the three sigma range is at least 8/9 probable.
Where possible, I have estimated uncertainties in various quantities by using some type of sampling or statistical procedure. In some cases, that is infeasible. For example, we presently estimate the amount to oil in Uthmaniyah by combining three pictures visually. This is necessarily a somewhat subjective procedure. In those cases, I make three estimates: the value that seems to me most likely, the value that seems the least that could possibly be the case, and the value that seems the most that could possibly be the case. I then take the average of those values as my estimate, treating the range from the smallest estimate to the largest estimate as the two sigma uncertainty range. In practice, such estimates work well when combined with a number of other independent uncertainties. There are well established mathematical rules for combining uncertainties, which I have employed.
For example, let's look again at the picture above of South 'Ain Dar, and try to use the less formal procedure to estimate the average height of the oil water contact, and an uncertainty in the average.
My read on the picture is lowest conceivable: 6100', highest conceivable: 5900', likeliest, 6000', so I would quote 6000 ± 50'. Note the latter is intended as the one-sigma uncertainty in the average, not the range of variation which would clearly be greater.
To compare, I then took the first 20 in a list of randomly sampled locations in the picture, and, on the assumption that the color scale runs from zero to 275' ± 25' of gross oil layer above the water, I obtained an average and standard error of 6032' ± 38'. So the two estimates agree within error bars, though the latter is likely a little better estimate.
Flood Height in North 'Ain Dar
Next, we turn to a more complex line of evidence that comes from the 2005 paper on water management in North Ain Dar (SPE 93439). A number of figures in that paper provide data that we can interpret to constrain the position of the OWC in 2004 for comparison with what we have inferred so far.The first is this picture:
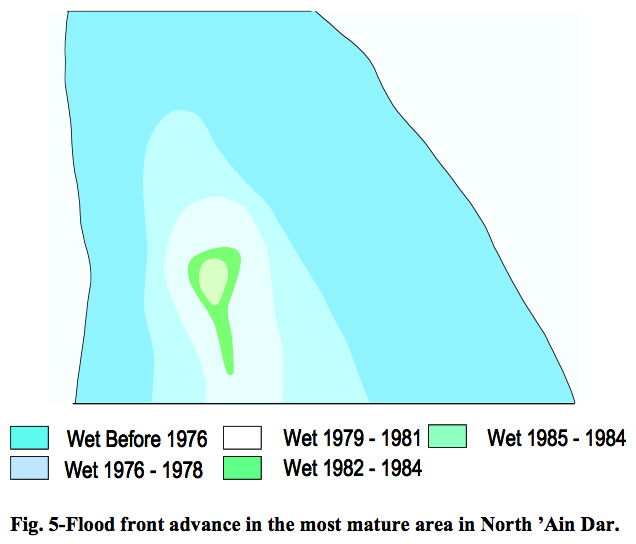
They don't spell out for us where this picture is, but the outline can be fitted nicely into better maps that have contours:
From this, I estimate the following heights for the OWC at different times:
| 1975 | -6550' ± 50' |
| 1979 | -6475' ± 50' |
| 1980 | -6450' ± 50' |
Next, there are several sources that, taken together, allow us to establish the rate that the OWC (oil-water contact remember) has climbed since. For example, there are flowmeter profiles for three different wells in Figure 8. Each of these shows the cumulative percentage of fluid as a function of depth in the well, with green being oil, and blue being water. As you can see, typically the water's contribution is in the bottom of the well, and the oil in the top. The dividing line is the oil water contact in that well, and it rises over time.
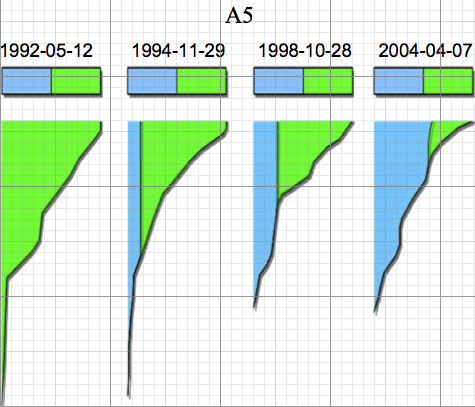 Flowmeter records for three wells in North 'Ain Dar (click buttons to switch wells). Position of flood front was estimated using grid and highest location in which water is emerging from well (as indicated by a right edge to the blue region that was not vertical). Source Figure 8 of SPE 93439
Now, we don't know the exact depth of these wells (no depth scale is provided), and we don't have an a-priori reasons to suppose they are all the same depth, but the form of the profiles, with copious production from the upper half to two thirds and much smaller production in the lower one third to one half suggests that we have all of zone 2 and most or all of zone 3. It doesn't appear we have zone 4 or the copious zone 2 production would make up less than half of the profile. If we thus assume we have 250' of depth in all cases, and then plot the resulting depths versus time on a common graph, the overall agreement is quite striking:

In addition to the three well curves (with linear fits), I have added a blue line, which is in an arbitrary vertical position on the graph, but the slope of which is determined by translating the average 5.096 feet/day horizontal flood front velocity from this next graph in the same paper to a 0.0505 feet/day vertical velocity by assuming the original velocity was a southward velocity up the North 'Ain Dar ridge. The agreement with the velocities determined from the well flowmeter profiles is excellent. This is a striking illustration of the power of correlation to extract useful information from noisy uncertain data.
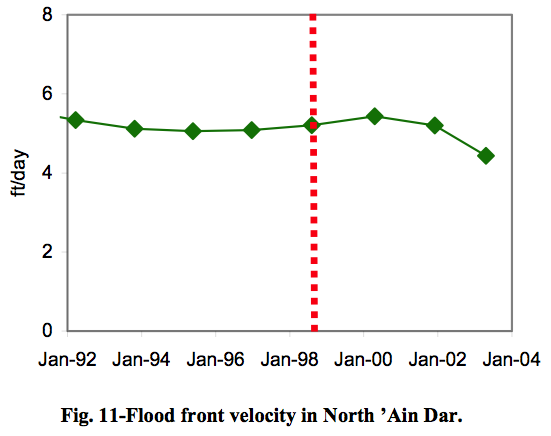
The combination of all this evidence gives an average vertical velocity of the flood front of 18.4 ± 0.7 feet/year over the period during which it was linear. So we can start at the locations back in the late 70s from figure 5, and extrapolate forward at this rate. This next picture summarizes everything we know so far about the level of the oil water contact over time in North 'Ain Dar.
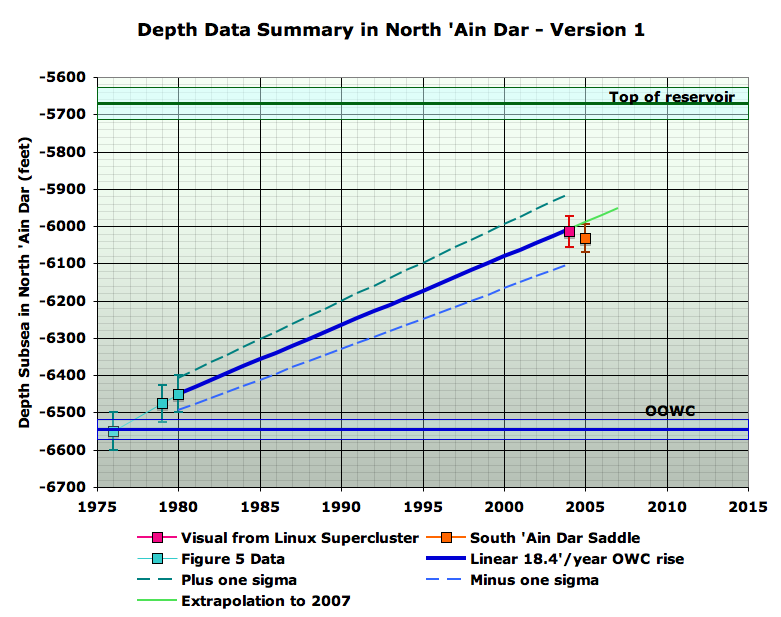
Starting at the left, we have, in turquoise, the SPE 93439 Fig 5 data for the far northern end of the northern 'Ain Dar ridge in the 1970s era. Then we have the fairly constant 18.4' vertical feet/year march up the ridge from the Fig 11 flood front graph and the Fig 8 flowmeter profiles in the same paper. Then, the pink point comes from translating the subjective visual estimates from the Linux Supercluster picture that I gave earlier. Finally, we have the orange point being the South 'Ain Dar saddle estimate from sampling the IPTC 10395 Fig 11. Hopefully, you will agree that a pretty consistent picture is starting to emerge from this various evidence.
I haven't told you yet why I think the OOWC (original oil water contact) is where I show it, and you might also wonder why the OWC was still at the OOWC in 1976, when production in this operating area began in 1951. Hold those questions for a couple of sections. It's time we started to talk about how to estimate how much oil is in these fields, and that will eventually clarify these points.
Framework for Understanding Volumetrics
So the procedure for estimating how much oil a given field might produce, or how much might be left at some point, is conceptually simple. We need to know the volume of rock in the reservoir, what percentage of that rock is pore space (the porosity), and what percentage of that pore space is occupied by oil, versus other fluids (the oil saturation). Porosities of the Arab-D reservoir rock in Ghawar can range from a few percent up to as much as 30% or so. One other wrinkle is that the oil will shrink as it comes out of the ground (due to natural gas coming out of solution in it), and we care about how much oil there is after it has done this. This shrinkage factor is known as the formation volume factor. So if we multiply these four numbers together: rock volume, porosity, oil saturation, and the inverse of the formation volume factor, then we will know how much oil is in the ground at some given time, if it were brought to surface conditions.Some more complications arise. The simplest way to assess the volume of rock would be to measure the area on a map of the reservoir, and then multiply that area by the average thickness of the reservoir rock. But to be more accurate, we will need to understand the shape of the reservoir in three dimensions. Borrowing Euan's nice picture again, we can illustrate the general idea in cross section:
In the case of Ghawar, the main complication arises from the triangular wedges where the oil runs into the water (ie the oil water contact), which can be several miles wide.
When I said "roughly speaking", one of the issues of interest is that not all the porosity in the green zone is full of oil that can come out. Firstly, it is never the case that pores are 100% filled with oil even in the reservoir at the outset. There is invariably at least a little bit of water in there too, clinging as tiny droplets stuck inside little pore channels somewhere deep in the rock. The fraction of such water is known as the initial water saturation. Better, more open rock, will have lower initial water saturation, particularly if it is a long way above the oil water contact. In that circumstance, the water saturation might start out as low as a few percent. However, in very poor quality rock in the transition zone near the water, water saturation can start out as high as fifty percent even in an area that is nominally oil. All cases in between occur.
Furthermore, after the flood front has passed by a given piece of rock, and water has been washing through it for a couple of decades, there will still be oil left in that piece of rock, again in the form of droplets trapped inside pores that cannot move. This oil cannot be produced by waterflood alone - if it ever comes out it will be because of additional (ie tertiary) recovery techniques, should such prove economic. The fraction of rock so occupied by oil at the end is known as the final oil saturation (and the fraction occupied by water is the final water saturation).
Thus, in a given barrel of reservoir rock, the fraction of the barrel that will end up as oil on the surface is given by the porosity percentage (how much pore space there is to hold fluid of any kind), multiplied by the difference between the initial and final oil saturations, divided by the formation volume factor that controls how much the oil will shrink by the time it gets to the tanker.
The remaining wrinkle is the net/gross distinction we briefly discussed earlier. Fluid in the reservoir during production moves because of pressure gradients. The injectors are increasing the pressure below the oil, and this is exerting force on the oil to move upwards and towards the producing wells. However, the amount of movement that the oil makes in response to a given pressure difference depends on the permeability of the rock. As we discussed earlier, this is related to the porosity, but not perfectly so. In some rocks, the pores are poorly connected with one another, and it is hard to force fluid through them. In others, the pores are well connected and fluid flows more freely. Now, some rock has such poor permeability that, even though it contains some oil, that oil will not come out of it in any reasonable period of time. Flow time is measured in centuries rather than the years-decades required to meaningfully contribute to the oil production. Oil geologists and petroleum engineers distinguish net pay from gross reservoir. The former excludes the not-sufficiently permeable rock, whereas the latter is everything. Typically, there are layers of pay interspersed with non-pay, and this is very much the case in Ghawar, as we saw in the well logs earlier.
However, the distinction between pay and non-pay has been shifting over time. The only data on this comes from Euan and I asking our networks of anonymous industry advisors. We got answers ranging from 1mD to 10mD for the 1980 timeframe, but also a statement that at least one company (that you've heard of) will sometimes now consider rock down to 0.3mD as pay, given better technology to access such poor rock (and, perhaps, lack of enough better reservoirs to drill into, meaning companies can't afford to be too picky). The main technology enabler has been precise geo-steered horizontal wells, allowing wells to be drilled horizontally along the low-permeability layers, from whence the oil will slowly drip.
These variables tend to be loosely correlated. Rock of higher porosity is more likely to be permeable, and more likely to have a low initial water saturation. In short, it is "good" rock. "Bad" rock has less pore space, poor flow properties even in the limited space there is, and high water content at the outset.
With that background, let's now turn to the available map data, which is one critical component of the volumetric oil estimation we will do.
Maps and Map Corrections
Unfortunately, the Saudi Oil Ministry neglects to publish complete and detailed maps of its oil fields. In lieu of that, we have a mixture of old maps, and incomplete maps from technical papers. The main thing we are looking for in a map is detailed and accurate contours of the top of the reservoir. As you will see, Ghawar is about 5000'-6500' below sea level.
Six maps are the main useful ones:
- the Greg Croft map
- A map from several Saudi Aramco technical papers, in particular Asphaltene Precipitation in High Gas-Oil Ratio Wells. Henceforth, this is the "asphaltene map".
- a map from an industry report that was supplied to us anonymously, but the component maps are based on other publications.
- the original 1959 Aramco AAPG publication map
- the map of well locations from the Voelker thesis (big pdf)
- this schematic from a USGS report (big pdf)
Euan reported the large industry report map to have a considerably longer Ghawar than the Croft map. Careful measurements based on same contour analysis do not support this. I find the distance from the bottom of the 6000' contour in Haradh to the 6400' line in North Ain Dar to be 143.7 miles in the Croft map, and 140.7 miles in the industry map, a variation of only 2%. My best reconciliation of the two maps, on identical scales, looks as follows:
This does not show an overall systematic scaling error between the two maps in my judgement, but many local variations in the exact structure (note to others trying to work on this problem: it's very important to compare contour-to-contour, not just look at the overall outline, since one map has contours going deeper than the other). Clearly, at least one of these maps is somewhat imperfect. An analysis of the more detailed map of 'Ain Dar turns up more serious problems however:
Even on a equal-contour basis, the industry report map has significant areas above the oil water contact line that are not in the Croft map. This is especially problematic in North 'Ain Dar, where I estimate the area difference to be about 50% (Euan suggested 25%). Euan's reconciliation of the well location map with the Croft map suggests the same issues apply to Shedgum.
For this reason, I decided to use the asphaltene map for estimates in 'Ain Dar and Shedgum. This map reconciles quite well with the industry report map:
Both appear to be more modern accurate maps. The industry report map has a scale, and this was used to establish the scale for the asphaltene map, which is not provided with a scale in Saudi Aramco papers I have seen. I did the reconciliation twice on different days and only came out 1% different in the resulting scale, an error which is negligible compared to other uncertainties in the problem.
In the rest of the field, I used the Greg Croft map. However, reconciliation of the Croft map with the asphaltene map suggests Croft is about 20% too narrow in Uthmaniyah. The approach I have taken to this overall problem is to correct reserve estimates for Uthmaniyah upwards by 20% and to view all regions estimated with the Croft map as having a 20% map uncertainty in their reserves. No corrections were applied to Hawiyah which seems to be about the right size. The special problems in Haradh are discussed later.
Modeling the Structure
As part of this analysis, I wrote a C program to parse an image of the map contours, and for each of the Croft map and the asphaltene map, used it to build a three dimensional model of the reservoir based on the map. This formed the foundation of my estimates of oil reserves and depletion. I linearly interpolated between contour lines, and where I had indications that the oil extended outside the structure in the map contours, I extrapolated from the last two contour lines on that edge of the structure. I placed the top of each crest midway between the lowest contour that no map showed for that crest, and the highest contour that any map showed for it, and linearly interpolated up to that point (ie my crests are conical in the last 75-125').While we will cover more aspects of this modeling as we go forward, this montage should give you some feeling for the kinds of things the code has to do, and hopefully provide visual evidence that it works correctly:

Since my code parses these maps and counts each pixel to estimate area, and since each pixel represents a small fraction of a mile, errors due to digitization of the map are negligible. The way I do linear interpolation introduces a small amount of noise between contours that is different than the noise the real structure would have. This is expected to be small compared to other errors (it's more a visual issue than anything).
Original Oil Water Contact
In order to estimate the volume of oil-bearing rock reliably, we don't just need the map, we also need to know where the oil is, and where the water is. That is, we need to estimate the position of the oil water contact, which forms a surface that intersects the base of the reservoir. You might imagine that the oil water contact would form a level plane, but in fact it is tilted and somewhat uneven. The main reason for this is that the water under the oil varies in its density because of large changes in salt content in different parts of the reservoir. The approach I took to this issue was to fit a tilted plane to available data on the position of the oil water contact. The regression (model fit) provided estimates of the uncertainty in original oil water contact (OOWC) position.Let's first take the case of the Croft map, which was used for estimates of original reserves in the south of the field. Estimation of the position of the OOWC (original oil water contact) was carried out as follows for areas other than Haradh. The map showing OOWC estimates in the 1959 Aramco AAPG paper was reconciled with the Croft map as follows:
The regression resulted in a plane that has the following characteristics:
- It reaches the neck between 'Ain Dar and Fazran at 6560 feet depth (64.7' standard error in the height constant)
- It rises by 2.45 feet/mile to the south (0.45 feet/mile standard error)
- It dips by 8.9 feet/mile to the east (1.9 feet/mile standard error)
- The model has an R2 of 83% (ie 83% of the data variance is explained by the model), the model is significant with p=0.03 (F-test), and the average deviation of data from model is 51.5'.
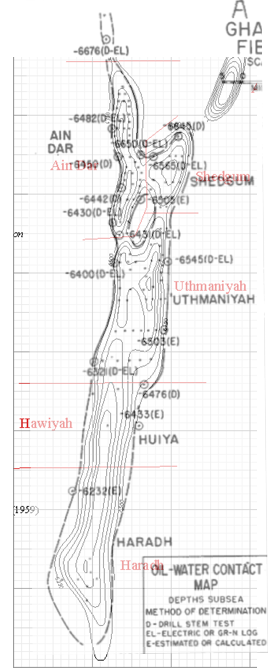
Haradh is known to have its own local OOWC tilt dynamics that are more pronounced than the rest of the field, and furthermore, the 1959 OOWC measurements constrain the Haradh OOWC only very weakly. The best available data come from SPE 71339 by Stenger et al and titled Assessing the Oil Water Contact in Haradh Arab D. The following is a reworking of their Figure 10, with a reconcilliation of the Croft map, and annotations in blue of the absolute depths based on the text of SPE 71339.
Estimation of the position of the OOWC (original oil water contact) was carried out as follows for areas other than Haradh. The map showing OOWC estimates in the 1959 Aramco AAPG paper was reconciled with the Croft map as follows:
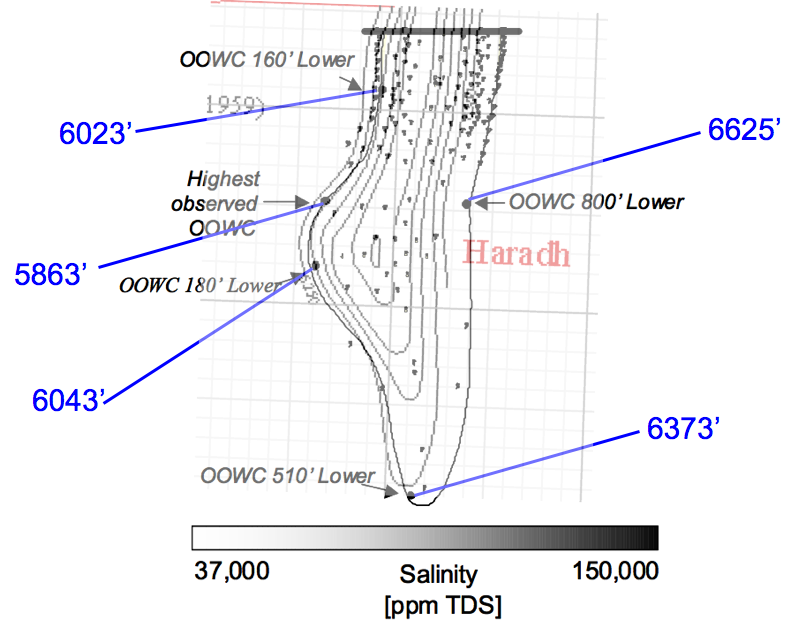
Stenger proposes that the main explanation for the uneven oil column is the presence of very saline water under the oil in the east, and a localized source of much fresher water in the west, close to the point of highest oil contact.
It did not seem practical to base an interpolation model for the depth on these data - clearly any linear model will fail badly, but the data are inadequate to suggest what kind of non-linear model would be suited. It appears that the main effect of the OOWC is to add to the oil filled area to the east of the Croft map. Accordingly, we treated this issue by adding a 20% upwards correction to the Haradh original reserve estimates, with ten percentage points of uncertainty.
Turning now to the northern areas of the field, we use the ashphaltene map shown to the right.
Splines were fitted to the contours, and these splines were parsed to generate a three dimensional model. The map shows the oil water contact as the blue line around the edge of the map, or in places, in the interior of the structure. The regression fitted to depths inferred from this blue line, has the slope of 2.5 feet downward for every mile to the north and 6.6 feet downward for every mile to the East. The r2 of the model was 48%, and the uncertainty in the vertical height was 23 feet (in other words, compared to the whole field, the regression in just the northern fields finds less systematic height variation, less uncertainty in the height of the contact, and so a larger fraction of the variation is noise, rather than systematic trend.
This map is believed to be quite accurate, but it did prove necessary to make some modest corrections to the model based on it, in a manner I document after I have gotten a little further in my development.
Gas Caps
North and South 'Ain Dar both have gas caps which are mentioned in two papers that we have studied (SPE 81567 and SPE 81425). The first of these papers (from 2003) explains the situation:
The Arab-D reservoir of Ghawar Field contains an undersaturated light oil. The bubble point pressure is ~1900 psi at the reservoir temperature of 215oF and the average gas oil ratio is ~570 scf/stb. The reservoir pressure at present is over 3000 psi. In the 1960s and 1970s the associated gases from part of the field were injected back into the reservoir at two locations due to unavailability of gas processing facilities and to avoid excessive flaring. The injected gases have formed two separate gas caps in the field (north and south gas-caps, Figure 1). In recent years oil production has started from these gas-cap regions.The two papers show these images of the gas caps:
Gas caps images from SPE 81425 (left) and SPE 81567 (right) compared.
The left image appears to be more schematic, whereas the right image, although hand drawn, appears to attempt show the actual shape and to be based on wells that have gas production. Both images show the gas caps as similar size, though the left image is about 20% larger in area.
We would strongly expect that gas in the very high quality upper regions of the reservoir in Ain Dar would be able to reach gravitational equilibrium quickly in a static environment. So the fact that the base of the gas is not level in the right hand image is in need of explanation. Fractional_Flow and I developed the following explanation: asymmetries in the amount of oil production in the fields are pulling the gas caps down out of equilibrium. In North 'Ain Dar, the north east flank is the largest and shallowest part of the structure, and production in this area has likely pulled the gas cap down towards it. In the case of south Ain Dar, the south west is larger and less steep that other sides (except for the saddle, which we know hasn't been produced as heavily as some other places since it still was shown as having a full oil layer in a 2005 paper), so that the southern gas cap has been pulled to the southwest, though not by nearly as much as the northern gas cap, the structural asymmetries being less.
The approach taken to estimating the size of the gas cap in this analysis was to create a spline copy of the gas cap outline from the right picture, and then move it to the top of the structure, as though it was in gravitational equilibrium, and then, using my 3D model of the field, find the amount of vertical offset in OWC required to create an oil distribution that just matched the gas cap. The lower boundary of this oil was then treated as missing due to the gas cap in further analysis. This picture illustrates the process:
The error in the size of the gas cap was estimated roughly from the 20% difference in size between the two images of the gas caps that we have.
Note, there is some not-quantifiable possibility that this approach to gas cap estimation is systematically wrong if the gas is smeared out in a much thinner layer than gravitational equilibrium at the top of the structure would suggest.
With the map modeled, the oil water contact modeled, and the gas caps estimated, we now know the large-scale geometry of the reservoir. We turn to the quantitative parameters for the reservoir rock.
Data for Reserve Estimation
Hopefully you have some qualitative feeling for the types of variations in Ghawar Arab-D properties from the earlier discussion, and so let us now turn to the summary data recorded by Greg Croft, but which come from Saudi Aramco, Oil Reservoirs, Table of Basic Data, Year-End 1980 which is the most obvious public basis for estimating how much oil would be under any given square mile of our maps. This data essentially comes from back when Aramco was operated by a consortium of American oil companies, and thus likely represents a best circa 1980 understanding of the field parameters, which would have been based on extensive operating experience and well logs from around the field done by professionals from major international oil companies. In short, this data is not to be taken lightly (as has been repeatedly emphasized to me by anonymous industry advisers).The data we need for this analysis can be summarized thus:
| Haradh | Hawiyah | Uthmaniyah | Shedgum | Ain Dar | |
| Porosity | 14% | 17% | 18% | 19% | 19% |
| Net Pay | 140' | 180' | 180' | 194' | 204' |
| Formation Volume Factor | 1.27 | 1.3 | 1.31 | 1.35 | 1.34 |
| Initial Water Saturation | 11% | 11% | 11% | 11% | 11% |
As you can see, we have almost everything we need now to estimate the amount of oil originally in Ghawar, given a 3D model of the field. But not quite. Specifically, this does not tell us how much oil is left behind after the flood (we need the final oil saturation, or equivalently, the final water saturation - the two together have to add to 100% in this system so if you know one, you know the other (with the exception of the 'Ain Dar gas caps)). And that, alas, will take us on a long digression. But just before we go, notice also that the 11% initial water saturation is a little odd in that it doesn't vary with operating area. We might have expected that number to get worse (ie higher) as we went south into poorer rocks that would trap more little water droplets that oil couldn't displace. So there is some suggestion that perhaps that 11% might be a whole field average, rather than measured in each subfield.
I amassed two general types of evidence that bear on the initial and final water saturations, and I shall give one example of each type.
The first type of evidence comess from looking at simulation cross sections. For example, here is a blown-up portion of a picture of a reservoir simulation cross section in simulated year 2004 in North Ain Dar from Fig 9a of SPE 93439.
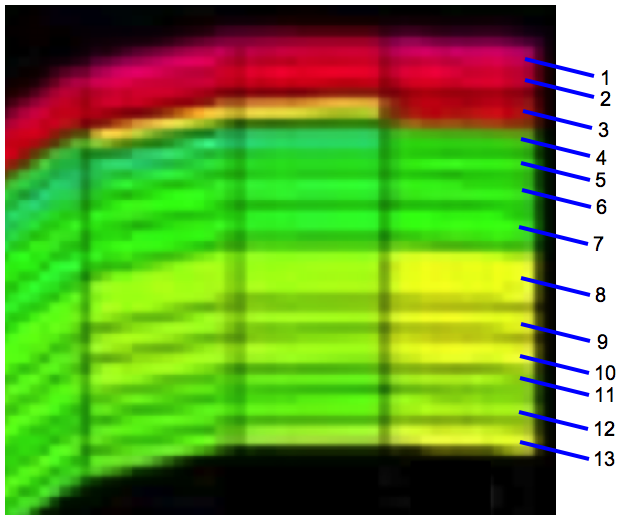
I have numberered the 13 layers that the simulation divides the rock into, and the lateral grid cell index can also be counted off (rather more easily). Once numbered, it is possible to generate a random sample of grid cell addresses, and, using the color scale, measure the saturation in each one. We avoid cells very close to the original oil water contact, and we also avoid cells which have not had the same color for at least a decade (ie where the simulated saturation might still be changing noticeably). In particular, we don't count unswept areas in the final saturation - if any areas are finally unswept we will take account of that in a separate sweep efficiency parameter. This allows us to form a random sample of what the simulator considers the population of block final saturations is, at least for this particular location in the field. Since Saudi Aramco uses state of the art simulation methodologies, has extensive well log data and production history to match to, and since a central point of the simulations is to estimate and maximize ultimate recovery we have reason to think that the simulation's final saturations will have some fidelity to the true situation in the reservoir.
The other type of evidence comes from studies of flushing particular samples of rock either in the lab or rock taken from the reservoir after flooding. For example, this next figure shows relative permeability curves for composite samples of rock from three operating areas:
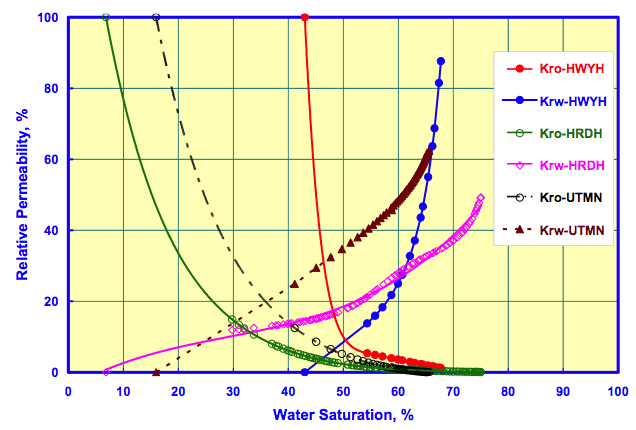
The relative permeability of oil (Kro) represents the ability of that oil to flow as a function of water saturation. When the relative permeability to oil goes to zero (where the oil curves hit the x-axis) then no further oil can flow and the rest will be left behind by the waterflood. As you can see, these particular rock samples had a final water saturation of about 66% in Uthmaniyah, 68% in Hawiyah, and 76% in Haradh. That is to say, that at the end of waterflooding these particular samples, 34%, 32%, and 24% respectively of the pore volume was left with oil that would not come out. Similarly, the initial water saturation represents the point below which water will not flow (ie Krw=0). It is not clear how typical these particular sample are of the areas in question however - there is no reason to expect rock in Hawiyah to be worse on average than rock in Haradh, and we know that in all areas the rock is very diverse and it would be possible to find both good rocks (with a large oil window between the initial and final saturations), and poor rocks with a very small window (such as the Hawiyah sample in the graph above).
Hopefully these samples will illustrate the kind of evidence available on saturations; there is too much data to show all of it, but this next figure summarizes the evidence I was able to gather from Saudi Aramco technical papers.
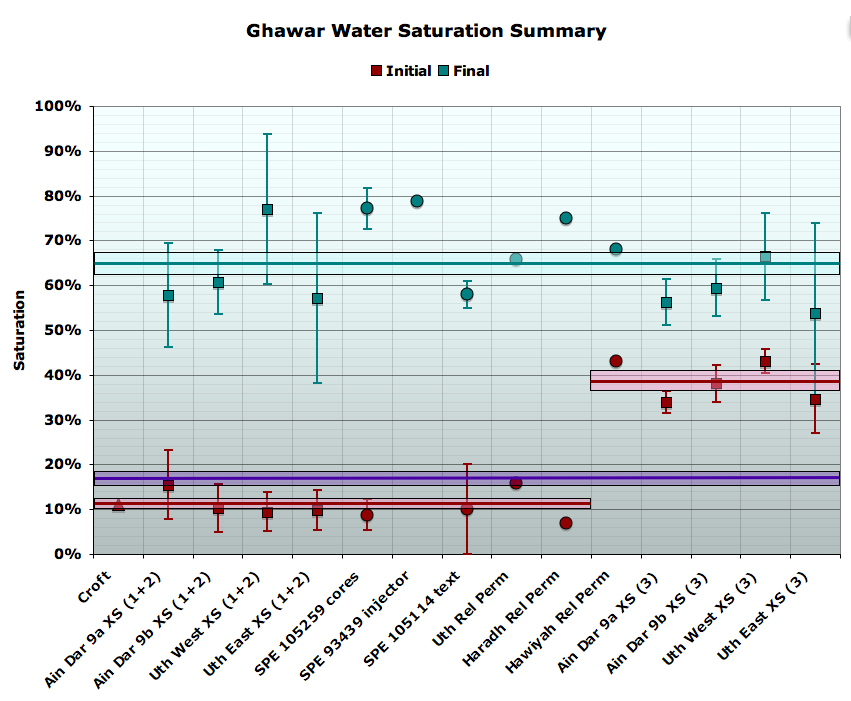
Note that the error bars shown are not the standard error in the mean of each population, but rather the standard deviation of that particular population (whether it be a sample of grid cells in a simulation visualization, or a family of experiments) to better illustrate the variability at a given location, as well as the variability between locations) .
As to the final saturations (turquoise data), although there is significant variation from one place to another, there is no obvious trend in the data. Thus, the approach I took was to treat the points on this graph as equally weighted individual observations around the field average for the final saturation. The spread in these observations allows me to constrain an uncertainty for that average. That gives a final water saturation of 65.1% ± 2.4% (percentage point error, not relative error). This is shown as the pale blue box around the 65% point. The only potential problems with this are if either the Saudi Aramco simulations and experiments lack fidelity, or if this sample of observations is somehow too biassed. Overall, there is quite a lot of geographical spread in the field, but it is somewhat weighted towards north Ghawar. So it may not extend quite as well to the south. However, the data points that we do have for the south do not appear at all anomalous relative to the northern observations.
The initial saturation data (red) is more interesting and gave rise to an extended debate between Euan and I which ended up delaying this post a week. The first thing to note is that the data appear quite bi-modal. There are a number of observations which cluster around the Croft value of 11% (in fact they average 10.9% with a standard error in that average of only 1.0% (percentage points). There are also a number of much larger values that are closer to 40% (mean of 38.6% ± 2.0%). There are no observations in between. In analyzing the initial saturations in cross sections of simulations I divided the cells into separate observations on zone 2 and zone three, since it was obvious the two were very different. The division between zone 2 and zone 3 is based on layer counting and the following scheme from SPE 84371 (A Scalable Massively Parallel Dual-Porosity Dual-Permeability Simulator for Fractured Reservoirs with Super-K Permeability):
The reservoir model is characterized into four zones. Zone 1 is in layer 1, zone 2 is in layers 2 to 10, zones 3 is in layers 11 to 13, and zones 4 is in layers 14 to 17.If the 'Ain Dar simulation pictures came from a simulation with the same layering scheme, then it suggests that, as there are only 13 layers, zone 4 is not important to production in this area (in general, it is rarely mentioned in the literature). It further suggests the interpretation that the bottom three layers are zone 3. If we now look at an example from 1940, i.e. before production, then we can clearly see the difference in the initial saturation in these layers.

As you can see, the lowest three layers are yellow (40% water) or almost so. The picture in Uthmaniyah is similar. It is plausible that water saturations in the poorer rock of zone three would be higher than in the zone 2 rocks above. However, Euan felt strongly, based on his experience, that 40% water saturation was unrealistic in net rock. He argued that those layers must include rock that would not have been considered net in the Croft numbers, i.e. rock of single milliDarcy permeability or sub milliDarcy permeability. He and I explored data from carbonates in other fields were indeed he would be correct, but didn't find dispositive proof that net pay in Arab-D couldn't have initial saturations that high. Hold that potential issue in the back of your mind for a moment. We have a lot of data on saturations, but we might not know quite how much of the oil they are being applied to.
If we average the zone two and zone three values for initial saturation and compute a combined average (using a ratio for net pay based on analysis of the well logs from Powers 1962 paper and simulation cross sections) we get an initial saturation of 16.9% ± 1.2% (percentage points). This gives a saturation change of 48.2% ± 2.6% (percentage points), and a recovery rate of 58% ± 3.2% (before applying any correction for sweep efficiency - blocks that end up unswept). Remember that recovery rate. And remember it just comes from averaging together simulation cross sections and experimental observations that Saudi Aramco has published.
Unfortunately, little public data is available to support estimates of sweep efficiency (how much oil that in theory might have been producible but is left behind because the waterflood moves unevenly and leaves some areas unswept). Based on advice from our various pseudonymous and anonymous industry advisers, I adopted an outer range of reasonableness for this well managed waterflood in north Ghawar of 80% to 100%. Thus my central value is 90%, and I take 5% (percentage points) as the 1-sigma error bar. In the south, with poorer rock and heavy fracturing, I used 80% ± 10%.
Next, an exercise to validate the original reserve model with the asphaltene map was undertaken. This identified one major area where the linear OOWC model and the broad contour interval combine to miss a low-lying area that is above the oil water contact, and which has a modest number of producing wells in the Voelker well distribution, and industry report maps. Based on estimation of this volume, a 5.5% upward correction was applied to North 'Ain Dar, and 4.5% to Shedgum. No issues were identified in South 'Ain Dar.
I compared these estimates with this figure from a 2004 presentation by Baqi and Saleri of Saudi Aramco, endeavoring to refute the concerns of Matt Simmons:

There are a number of very interesting numbers in this graphic. But let's first talk about the recovery rate data. On the one hand for proven reserves we see a claimed recovery rate of 60%, compared to the 58 ± 3.2% we observe by averaging various individual observations in Saudi technical papers. So these numbers are potentially in good agreement (within one sigma) with the exception that proved reserves would be assuming 100% sweep efficiency- a fairly aggressive assumption. More troubling is the estimated ultimate recovery of 75 percent of original oil in place. It does not appear that this ultimate recovery could come from the present peripheral water flood alone. All simulation cross sections in Ain Dar and Shedgum end up at about 65% water saturation - ie 35% of the pore volume is left as oil following the water flood, even in areas that were first swept decades ago. Given that not all the pores began as oil, recovery rates from the flood must be somewhat below 65% under any reasonable assumption. (It's very hard to see how the simulations could be badly wrong on this point, since they would show far more historical production than the actual wells if they were so wrong, making them useless to their owners). If indeed ultimate recovey ends up as high as 75%, it would appear to have to be as a result of extended recovery techniques of some kind, which would of course produce oil at much lower rates.
Now let's take our initial and final saturations, together with Croft porosities and pay heights (which recall are circa 1980 Aramco average estimates). I applied those assumptions to the map based model discussed earlier. Doing so resulted in estimates of original reserves for Ain Dar and Shedgum of 28.3 ± 2.1gb, with an estimate for original oil in place of 54 ± 4gb. (The estimate of original reserves for the whole of Ghawar would have been 83 ± 9gb).
So there are two discrepancies between the numbers I just mentioned and the Baqi/Saleri slide above. Firstly, they reported cumulative production for this area in 2004 of 26.9gb. If the original producible oil was only 28.3gb, then we'd be left with only a couple of billion barrels by 2004, which would imply the field would have had to be already declining, inconsistent with other data showing it on plateau then. Furthermore, they are reporting far more OOIP - 68.1gb, versus 54 ± 4gb. That's a discrepancy over the central value of more than three standard errors - a pretty material discrepancy. Their value is 25% ± 9% higher.
Now, we also have the following graph from the 2004 Aramco presentation concerning the growth of OOIP in the country as a whole:
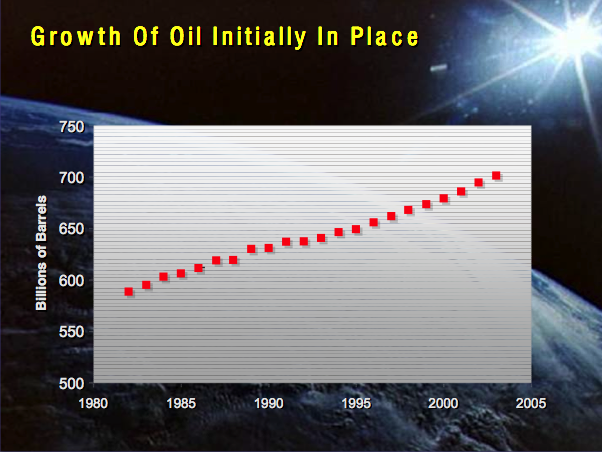
Careful measurement of the first (588.5gb) and last (700gb) data points gives us a whole-country OOIP growth of 19%. So, it would appear the growth in 'Ain Dar at 25% ± 9% is consistent with the whole country OOIP growth. This raises the question of were this extra oil could be? Ain Dar and Shedgum had been in production for three decades by 1980. There would be no potential for growth in the known oil at the edges of the field because the edges of the field had been drowned long ago. In principle, there could have been discovery of additional reservoirs, but this isn't very likely in such an extensively produced and characterized field, and nor is there any discussion in the literature of new reservoirs in Ghawar being studied (though there is ample discussion of deeper Khuff gas reservoirs). This leaves only one real possibility which is that the growth in OOIP is coming from rock that was not previously considered net pay, that is, rock of very low permeability in which oil flows very poorly. Let me at this point remind you of Euan's concern that in the simulation cross sections, the zone three saturations were too high to be net rock.
Could there be enough oil in the poor, formerly non-net, rock to account for this OOIP growth? Well, take a look at this next figure:

I have added the blue line as a visual fit to the trend of the data. Our industry advisers, asked about the likely permeability cutoff for net rock suggested values from one milliDarcy to 10 milliDarcy circa 1980. In my log analysis I used three milliDarcies. As you can see, in the plot above, these cutoffs would leave rock with a significant amount of pore space and a sizable fraction of the rock would be below these cutoffs. for example, the 3 milliDarcy line hits the trend at 14 percent porosity. Overall, this suggests that including all of gross rock in OOIP could lead to about the right amount of growth, though it's hard to be certain based on one well.
At any rate, the stance taken here is that we should give Saudi Aramco the benefit of the doubt wherever there is any, and see if we have established a problem notwithstanding that. Thus, I assume that the saturation figures derived above (from Saudi Aramco simulations and experiments) should be applied to the "grown" OOIP that they say they use, and I use the 700/588.5 change as a basis to estimate that growth factor. As we will see in the sequel, once this is done then all evidence forms a consistent picture of the state of the field.
To begin with, we can examine the implications of the 26.9 gigabarrels of cumulative production to date. Because my model allows me to estimate the volume of rock in the field I can infer how high up the structure the oil water contact must have risen in order to produce 26.9 gigabarrels of oil. It turns out a 511 foot rise is the number required, which can be the basis for comparison with other estimates of the OWC height.
Let us take one more step before we do that. We know the production history in North Ain Dar through 2004 from Figure 1 of SPE 93439 (the North 'Ain Dar water management paper):

With my 3D model and the above assumptions about saturations, etc, I can figure out how much change in the average OWC in North Ain Dar is required for each unit of production. So I can take the 511' offset in OWC inferred from the entire Ain Dar/Shedgum cumulative production by 2004, and then back it down the North Ain Dar structure to give the right production history for that subregion. If I then plot that with all the other data we have on OWCs in this region, it looks like this:

In addition to the data described earlier, I have added the gas cap base (treated as though it was at the top of the structure, which it isn't actually), and the OWC curve inferred from reversing production as just described.
The level of agreement on the state of the field circa 2004, and over the last 15 years or so, strikes me as extraordinary. Given the diversity of approaches summarized in this graph, it seems very unlikely that the conclusions about current OWC could be badly wrong.
Unless the gas cap model is systematically wrong, it's hard to see how production in North 'Ain Dar could not be affected by now.
The production based OWC estimate was divergent from the linear 18.4 foot/year vertical rise line prior to the late 1980s, and follows a more physically realistic track for average OWC. My interpretation of what happened is that during the 1960s and 1970s, under heavy production, water crossing the broad very shallowly angled plateau northeast of the north 'Ain Dar crest was in poorer gravitational compliance, with oil piled up before the advancing water, and water not penetrating the less permeable lower strata of the reservoir as fast as static gravitational equilibrium would have dictated. Thus the ridge areas studied in SPE 93439 did not get water until a relatively late date in the second half of the 1970s. However, in the 1980s, as the OWC got into areas where the structure is steeper, and as production was sharply reduced due to the demand destruction following the 1979-1980 oil shocks, gravitational compliance improved and the OWC in the north ridge area began to track the average OWC based on production quite well.
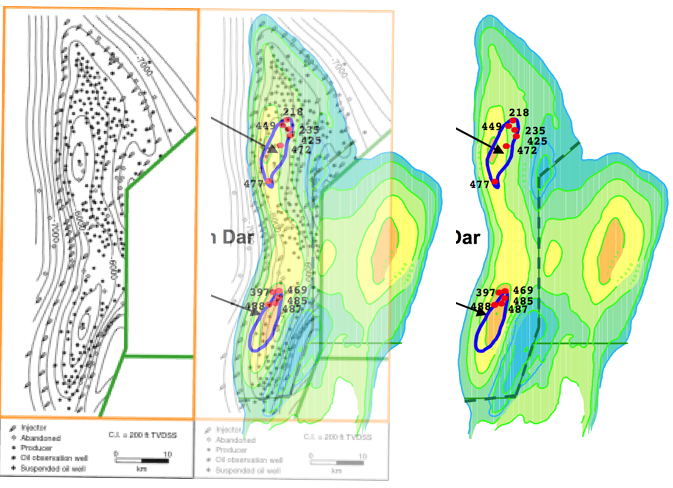
From the 511' offset, I can plot what the distribution of remaining oil would look like. (Note that this is just moving the original OWC plane up 511' without changing its tilt in any way - this is not likely exactly what happened, but is as good an assumption as any, and the Linux supercluster picture suggests it is not very wrong) Here is a comparison of the original and remaining reserve distribution under that assumption:
For comparison, here is the Linux supercluster picture again. Clearly, the Linux picture is either not simulating the gas caps, or is actually plotting "hydrocarbon saturation"
To my eye, this picture is generally compatible in showing oil mainly up in the crests, roughly in compliance with gravity, though with some deviations where the supercluster picture has more oil in the saddles between the crests, while my model has a little more on the crests. However, it is hard to make a more precise comparison than given above, given the different view angle and the small scale of the Linux picture.
This concludes the detailed analysis of the 'Ain Dar/Shedgum regions. I now turn to the simpler treatments I used in the other regions.
Uthmaniyah
Original reserve analysis in Uthmaniyah is based on the Croft map and the global OOWC plane for the whole field, Croft table parameters, the same saturation end points and OOIP growth as in 'Ain Dar/Shedgum, and a 20% map correction as discussed above.2004 reserve analysis in Uthmaniyah is based on visual estimation of the full-oil-layer equivalent area implied by three sources: the Linux supercluster visual, 2004 simulation cross sections from SPE 98847 (the water management in Uthmaniyah paper), and a partial map of the thickness of the oil layer from here.
Based on visual examination of the cross sections, it seems clear that with the dual crest structure in Uthmaniyah almost all the remaining oil is in the saddle between the two crests, and the approach based on gravitational compliance, which worked so well in 'Ain Dar and Shedgum, would fail here. Thus 2004 reserve estimates in Uthmaniyah were based on the area analysis above, Croft table parameters, the same saturation end points and OOIP growth as in 'Ain Dar/Shedgum, and a 20% map correction as discussed above.
Southern Ghawar
Less effort was made to characterize Southern Ghawar as precisely as the north. In general, it is clear that the southern regions will be on plateau for decades at current production rates, and are unlikely to be an important factor in recent Saudi production declines.Original reserves were based on Croft map parameters, the global OOWC map (with correction for tilt in Haradh as discussed above), and a slightly lower 80% sweep efficiency.
2004 reserves were based on the above, plus visual estimation from the Linux supercluster map that oil was 1/8 of the way up the structure in Haradh, and 4/15 of the way up in Hawiyah.
Summary of Uncertainty Analysis
In this section, I summarize all the various strands of uncertainty reasoning discussed above, and combine them into my current quoted error bars.The overall reserve estimates are of the form of a product of six factors:
- An area
- The average remaining net pay height in that area
- The average porosity of the remaining net-pay
- The change in oil saturation from the unswept to the swept condition
- The sweep efficiency
- The inverse of the formation volume factor
Uncertainties in Original Reserves
| North Ain Dar | South Ain Dar | Shedgum | Uthmaniyah | Hawiyah | Haradh | |
| Map | 5.0% | 5.0% | 5.0% | 10.0% | 10.0% | 10.0% |
| Sweep eff. | 5.6% | 5.6% | 5.6% | 6.7% | 10.0% | 10.0% |
| Sat. change | 5.4% | 5.4% | 5.4% | 5.4% | 5.4% | 5.4% |
| OOWC | 4.5% | 4.5% | 4.5% | 5.0% | 4.9% | 10.0% |
| OOIP Growth | 10.0% | 10.0% | 10.0% | 10.0% | 10.0% | 10.0% |
| Combined Uncertainty | 14.3% | 14.3% | 14.3% | 17.3% | 18.8% | 20.7% |
Uncertainties in Current Reserves
| North Ain Dar | South Ain Dar | Shedgum | Uthmaniyah | Hawiyah | Haradh | |
| Map | 15.0% | 15.0% | 15.0% | 15.0% | 15.0% | 15.0% |
| Sweep eff. | 5.6% | 5.6% | 5.6% | 6.7% | 10.0% | 10.0% |
| Sat. change | 4.5% | 4.5% | 4.5% | 4.5% | 4.5% | 4.5% |
| OWC | 52.1% | 26.4% | 17.4% | 25.0% | 25.0% | 25.0% |
| OOIP growth | 10% | 10% | 10% | 10% | 10% | 10% |
| Combined Uncertainty | 55.6% | 31.2% | 24.1% | 30.2% | 31.1% | 31.1% |
The relative uncertainties are largest in 'Ain Dar/Shedgum in 2004, especially North 'Ain Dar. The reason for this is that there is not much oil left there, so small changes in the position of the OWC make large proportional differences in the estimated reserve remaining.
Comparison with Euan Mearns
The other week, Euan Mearns presented his latest thoughts on the status of Ghawar, and its production prognosis. In this section, I compare my subfield estimates to Euan's. Note that Euan's estimates were revised based in part on seeing some of the reasoning behind this post (particularly the 'Ain Dar saddle decode). The largest remaining points of difference in how I estimated original and remaining reserves versus Euan are:- Euan estimated the area based on the boundaries of the Croft structure map. I explicitly modeled the oil-water contact in three-dimensions and used that to bound the area where oil was to be found (this tends to reduce my estimates since the Croft map has contours that are substantially below the OWC in places).
- Euan took the Croft map scale at face values. I, finding the Croft map rather inaccurate, used the asphaltene map in the north, and applied correction factors based on discrepancies in the scaling of the Croft map where I did use it (this tended to increase my estimates).
- Euan used a significantly larger saturation change than my estimates, based on picking the best cells in simulation cross-sections, rather than averaging the cross-sections and other estimates (this tends to reduce my estimates relative to his).
- Euan treated "wedge" effects were the oil reservoir meets the water via corrections. I explicitly model wedge effects (the overall effect of this is unclear).
- Euan relied on visual estimates from the Linux supercluster visualization to establish the 2004 oil-water contact. I relied on data from the SPE papers, gravitational equilibrium, as well as the supercluster visualization. These procedures probably produce roughly comparable estimates - a central result of my work is that the Linux supercluster picture appears to be quite reliable.
- Euan unilaterally moved some of Uthmaniyah into Hawiyah. This doesn't change the whole field estimates, but does move oil from the one region to the other. (Note in Euan's tables I believe he had Haradh and Hawiyah switched accidentally - I have reversed that in what follows).
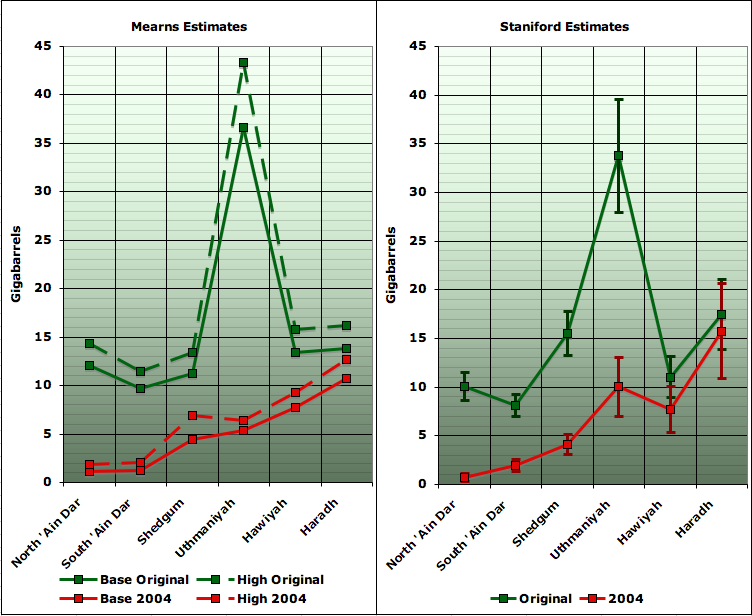
Overall, you can see that our estimates are in fairly good agreement. One of the wonderful properties of independent errors is that they tend to cancel to a significant degree, and here we see the varying effects of our different procedures mostly canceling.
Here is a more direct comparison of our estimated ultimate recovery estimates:
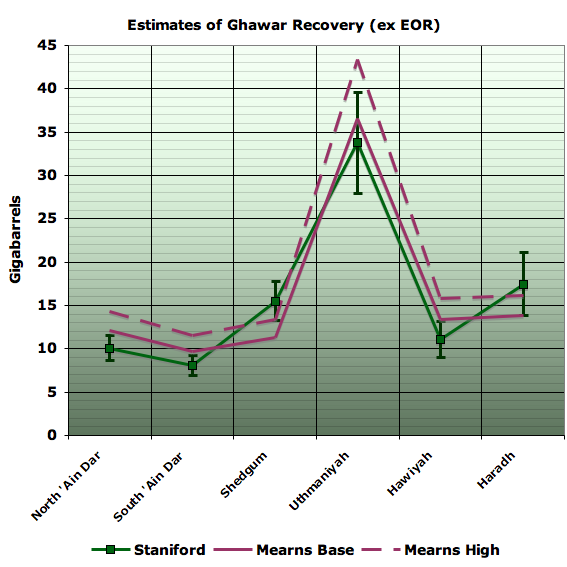
Whole Field Comparisons
Both Euan's and my estimates can be compared to that of others on a whole-Ghawar basis. For comparisons of Ghawar as a whole, the following figure gives estimates by a variety of organizations of original reserves and remaining reserves. Where necessary, I have adjusted from the estimate date to a common 2004 date by adding or subtracting production in intervening years.

- The Jaffe/Elass/Saleri column is an estimate of the Saudi Aramco official position. It is based on combining the 70gb of remaining reserves from the Jaffe/Elass paper with the 48% depletion number from the 2004 Baqi/Saleri presentation 50 Year Crude Oil Supply Scenarios: Saudi Aramco's Perspective. It is unknown how much of these reserve estimates might be attributed to tertiary recovery.
- The "79 Senate 2P" estimate comes from assuming that the "37% of reserves" attributed to Ghawar can be applied to the 177.6gb of remaining probable reserves at the time, and adding an estimate of cumulative production to then. These numbers are all based on Aramco estimates during the period when it was run by American companies and disclosed details to the US government.
- The "79 Senate 3P" estimate comes from adding an explicitly mentioned 17gb of additional possible reserves to the 2P estimate.
- The "Croft" estimate is for cumulative production (quoted on his web page as 51gb at year end 2000, and corrected for 5mbpd production to year end 2004).
- Euan's estimates are his base and high case corrected to 2004. These exclude tertiary recovery.
- The "Staniford" column is the "charitable" method in which we apply average initial and final saturations from various Saudi Aramco publications to OOIP increased as much they say it has increased. Notwithstanding, this is for waterflood recovery only. Note also that the "produced" column here is estimated from "Original minus Remaining" and thus has the combined error bar of both.
- The "W/O extra OOIP" column doesn't grow OOIP at all, but uses the same saturation estimates. This procedure fails to find enough oil in 'Ain Dar/Shedgum to cover cumulative production through 2004, so is unlikely to be correct. I do not include it as an estimate I believe valid, but rather for comparison as it appears to match the "79 Senate 2P" estimate quite well.
Implications for Production
In my view, the best way to assess the implications of the depletion status of north Ghawar as shown in this analysis is to look at the reserve/production ratio. If we assume that declines are uniform after a field goes off plateau, then there is a mathematical relationship between the final R/P at the end of plateau and the decline rate. In essence, the closer to empty an operator can keep the field on plateau, the worse the decline will be when it comes:

In the 1979 Senate report, it was anticipated that Ghawar declines would begin between 1993 and 1995, based on being unable to maintain plateau once R/P was less than 15 or 20 (corresponding to a post-plateau decline rate of 5%-6%). This was based on all vertical wells. Modern technology has allowed maintenance of plateau to R/Ps below 10, and perhaps even below 5 in some cases. This gives rise to very aggressive declines of 10% or 15% or so respectively once plateau is lost.
This next graph gives my estimates of R/P for the Ghawar operating areas. The assumptions made here are that the split between South 'Ain Dar and Shedgum of the 1.5mbpd they are known to share on plateau is 0.5mbd to South 'Ain Dar, and 1mbd to Shedgum. Also, North Uthmaniyah's plateau is assumed to still be the 1.9mbpd documented in the 1979 Senate report. Either or both of these assumptions could be slightly off.
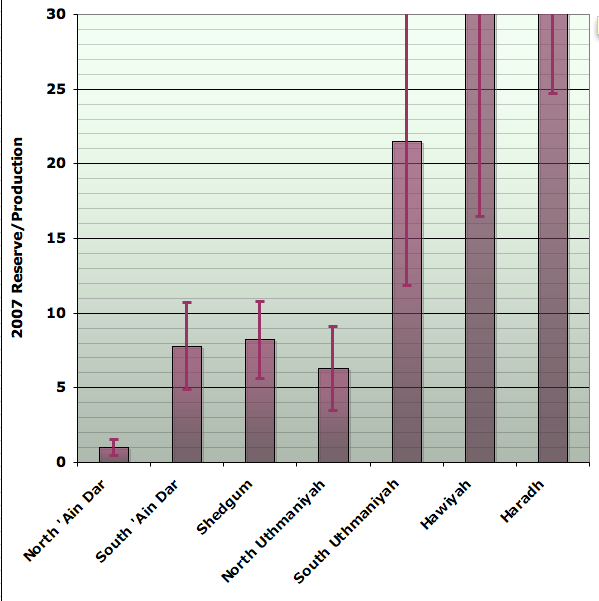
As you can see, the whole of North Ghawar is either off plateau already, or getting close. That is something like 3.9mbpd of production based on last known figures. Whatever of this decline has not already occurred will mostly occur during the next decade.
Southern Ghawar, by contrast, can maintain plateau for decades to come, but there is only 1.7mbpd of production there on last known figures.
While we cannot attribute an exact fraction at this time, it seems likely that not-altogether successful attempts to maintain the north Ghawar plateau to the bitter end explain a significant fraction of the sharp increase in oil rigs that began in 2004, as well as the production declines since that timeframe:
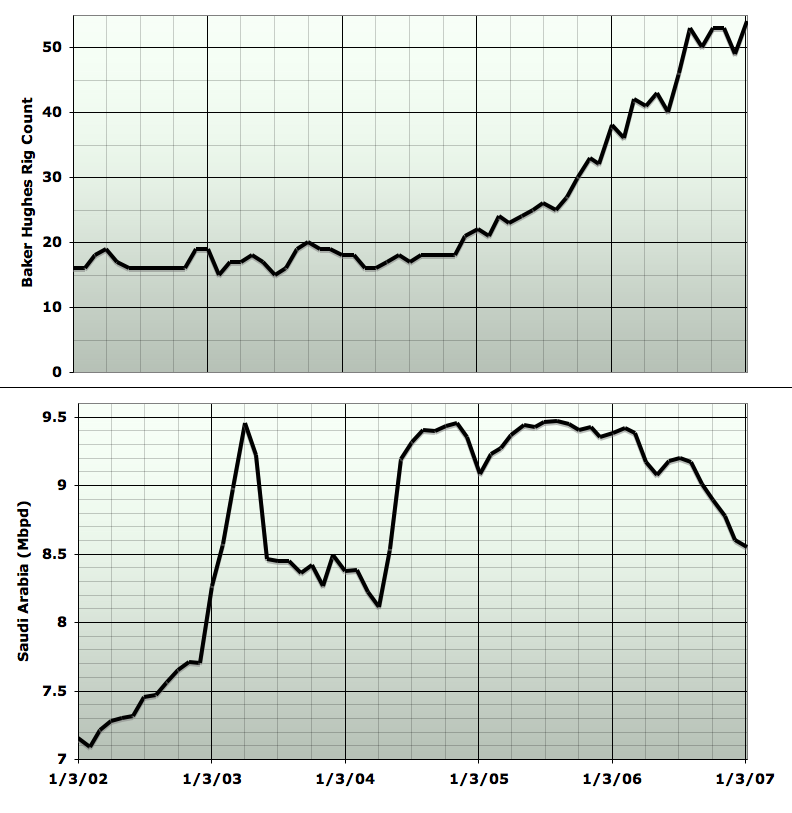
Acknowledgements
It is a great pleasure to acknowledge the enormously fruitful collaboration I have had with Euan Mearns on this issue, as well as with Fractional_Flow. We have exchanged literally dozens of emails a day for months. Euan's deep and original thought, and his insistence on my proving every point of my contentions has immeasurably improved the product - indeed the project likely would not have existed had Euan not challenged my views. Fractional_Flow led us into the Saudi petroleum engineering literature and has been a consistent source of provocative new ideas, professional experience, and references.Additionally, a now sizeable group of oil industry professionals have reviewed parts of this material, helped us understand and debate the issues, and provided key references. Several have contributed quite large amounts of effort to assisting us. They prefer to maintain their anonymity, but their contributions are greatly appreciated.
Finally, numerous commenters at The Oil Drum have contributed critical references, ideas, and valuable critiques over the last two months. Their contributions have been essential.
Notwithstanding, this piece expresses my views alone. Please bring any errors to my attention and I will attempt to fix them.
Recent Oil Drum articles on Saudi Arabia:
Stuart Staniford
- The Status of North Ghawar
- Further Saudi Arabia Discussions
- Water in the Gas Tank
- A Nosedive Toward the Desert
- Saudi Arabian oil declines 8% in 2006
by Euan Mearns
- Ghawar reserves update and revisions (1)
- GHAWAR: an estimate of remaining oil reserves and production decline (Part 2 - results)
- GHAWAR: an estimate of remaining oil reserves and production decline (Part 1 - background and methodology)
- Saudi production laid bare
- Saudi Arabia and that $1000 bet
by Heading Out
- Simple mathematics - The Saudi reserves, GOSPs and water injection
- Of Oil Supply trains and a thought on Ain Dar
by Ace
Contact
- Content: editors at theoildrum dot com
- Tech support: support at theoildrum dot com
License

This work is licensed under a Creative Commons Attribution-Share Alike 3.0 United States License.
This is a new URL for this post. The old one still exists (with its comments) here. With the new URL, you may re-reddit/re-digg/re-/. if you are so inclined.
If this is an update to the previous post, which are the bits that have changed? I can see one or two difference, but are there any key number changes hiding away?
Is the bottom of the reservoir flat? I thought that oil had migrated thru porous rock from below and become trapped under a curved inpermiable layer. In such case i think that the bottom should be flat and the top curved. The cross sections show both the bottom and the top curved. Is the oil pushed towards the middle or upwards and towards the middle so that the bottom is still flat?
No, that is not correct. When the sediment was deposited many millions of years ago, everything was flat, as flat as the bottom of the shallow sea anyway. Geological activity deep in the earth has since buckled and curved everything. Nothing is flat anymore, certainly not the bottom bottom of the reservoir. The bottom of the reservoir, with a few exceptions, should resemble the top of the reservoir. It is an anticline. An anticline resembles a mountain beneath the surface with all sediment layers curved.
And the oil does not push up from below the middle of the reservoir. The oil, which originally came from source rock below the reservoir rock, rose up through cracks and fissures to the reservoir rock. The oil settled to the top of the anticline. The oilcame from a much larger and likely thinner area but settled at the very top of the anticline.
Ron Patterson
Like this? from top to bottom:
I have looked at everything again and noticed something important. The simulations for 'Ain Dar in the figures show that the areas of oil are getting smaller and thinner.
If the areas are long but narrow i guess the area of the remaining cross sections not to close to the ends could be approximated with a triangle. The volume for each section could then be calculated by multiplying with the distance halfway to the next section.
l Distance halfway from section before to halfway to section after
w Width of cross section
h Height of cross section
v Volume
c Constant
Formula for the correlation between height and width: h=c*w this is crucial, but is it approximately correct?
Formula for the volume:
v=l*(w*h)/2=[substitution h=c*w]=l*(w*c*w)/2=l/2*c*w^2
This is a quadratic function which means that the remaining volume is proportional to the width w in square. If the width is multiplied by 2 the volume gets 4 times higher!!
If the length and width is approximately equal the function becomes qubic and multiplying the width with 2 will make the volume 8 times larger.
Cool repost. With this second post I hope it would be appropriate to look at the political and social ramifications of the peaking of Ghawar to KSA and the house of Saud in particular. For example how much of the oil profit revenue is diverted to support the royal family how much for social programs what is projected changes. Internal oil consumption alternative economic growth not based on oil. Thus given the decline in Ghawar coupled with increasing prices for oil does KSA face in a sense a day of reckoning ?
The general picture as I understand it consists of a ruling class that gets first access to the oil money. Next you have ARAMCO itself and its needs. ARAMCO is half oil company and half public works. Next I've heard stories that the Saudi's loath to do real work and have and attitude like Americans on steroids. This social situation is important.
Next of course KSA has had a population explosion and has a large population of young and relatively citizens. This is coupled with a large population of "slaves" that do the menial work.
Does KSA pay direct subsidies to its citizens ? If so how much in general how is the oil revenue distributed internally ?
My take on the matter is that KSA seems to have been heading to an internal crisis even without peak oil and in particular the peaking of Ghawar. We have focused on the effects of Ghawar peaking on importers but it seems to me the biggest effects will be inside KSA and money has to be redistributed and overall decreases this will cause power struggles which can easily turn bloody.
Recently in the news for example we have heard several news releases from various public figures in KSA that often go against the main government and seem to not follow the party line. This indicates that power issues are already happening inside the Kingdom. So hopefully others may be able to comment on how they think Ghawars peak will effect KSA.
My opinion is bleak I see the Kingdom torn apart fairly quickly once revenue flow begins to decline leading to disturbances that will effect the oil industry leading to lower oil production ....
Even before this happens their will be enormous pressure to divert more funding into social programs to stem discontent which will for cutting ARAMCO's funding as cost rise. Venezula/Mexico can be used as a template for this effect.
I can envision a number of scenarios effects and feedback loops all point towards above ground factors ensuring production is less than possible and dropping rapidly to zero long before the remaining oil is pumped. Iraq could be used as a model for a late stage turbulent oil exporting nation. When the American pull out or pull back oil production will drop and only if mercenary forces are sanctioned will we see any oil out of Iraq. But protecting oil infrastructure is a losing proposition I've not seen EROI numbers for Iraq but the actual real additional oil exports is probably negative once you remove the military/industrial costs associated with extracting that oil. So oil production in a hostile environment can have a significant impact on the real EROI.
Can we actually discern when peak exports and decline will force KSA into the abyss ?
jbunt
I do not think that you can have in both ways. First, PO will cause the price of oil to go up. I think that, best case, if peak oil occurs and becomes a known fact, the price rises to $100 minimum. Then, second, SA revenues rise substantially for the forseeable future. That is, even under a worst case, their production will not go below 5 million bbl/day for 15 years. Fifteen years after PO, the price will likely be $200 bbl and they will be producing the 5 million bbl/day. If that puts them in the abyss, I want to be that abyss. But, no, I'll be walking to my own funeral to save energy.
Your not considering internal consumption. This is important net exports will drop faster than net production. With KSA demographics it should drop fairly quickly as the large teenage population enters its 20's and 30's. And of course this wealth effect will itself cause increased consumption from simple wast. Next of course they will have to diversify their economy this will increase consumption. Currently oil consumption is very high in the ME states because of subsidies and this is with most goods and services imported. Adding a real economy on top of this will only further strain export capacity. As and example look at Iran it faces the prospect of no exports within 5 years at its current consumption rates.
Next on the monetary side KSA does not control the financial system the western nations control the money supply in general you can expect rampant inflation which will rapidly erode the real value of money that KSA receives for oil. So
any long term strategy based on slow investment of oil revenue has a problem as the value of the money itself will drop rapidly. Since they are and will remain large importers of basically everything KSA will see a bulk of these paper profits disappear in skyrocketing costs for food cars and other goods along with simple devaluation. In general rising prices coupled with fiat currencies based on growth results in purchasing power spiraling downward. The only real wealth is held by those that control the means of production since they are in a position to keep margins constant.
Look at it this way. KSA exports a barrel of oil for 100 dollars it takes say 3-6 months for this 100 dollars to reach the average KSA citizen on the street. In a hyper inflationary scenario this 100 dollars is say devalued by 10% real purchasing power. The end result is KSA did not make 100 for a barrel in real terms. This is exactly the situation they are facing now as the petrodollar collapses.
The only way out is to take control of the fiat currency used to price oil and effect back it with oil itself.
Finally of course the equation is supply and demand not just supply at some point demand must drop in the face of finite and decreasing oil supplies. So the consuming economies must adjust and this will mean price will be volatile at best. Since economic collapse at least in the poorest countries is all but certain. As a economy collapses it frees oil for use by other functioning countries lowering the price briefly.
This is extreme but supply/demand must balance in general post peak this is via demand destruction.
Oil is used to produce value added goods with the price of oil exceeds the price you can get for goods produced from the oil you don't sell the goods. The net effect of rising prices for base commodities like oil is intrinsic inflation that erodes real wealth transfer.
Until recently KSA expressed a deep concern over the effects of high oil prices on the world economy. I think they are under the mistaken believe that these concerns where unjustified and this expensive oil economy is possible. I see no reason for this to be true and in fact their original concerns are indeed justified as we see the wheels start to fall off the global economy.
So I don't think the simple argument of 5 mbpd of exports forever and all is well is possible. This leads back to the internals of KSA and how it will react to real diminishing purchasing power. And this in turn leads back to the internal political climate in KSA. As a counter example Norway will power down peacefully and with grace. Your assumption is that KSA will behave the same as Norway by comparing and contrasting the two countries I cannot see how.
jbunt
I do not think that you can have in both ways.
I think that's an excellent observation, very perceptive. We must also consider the recent developments KSA is making towards becoming a finished petroleum goods exporter. Chemicals, plastics (a Saudi firm is even looking at buying GE plastics!), fertilizer, gasoline and Diesel refining.
Saudi Arabia may come unhinged in the future, but "peak oil" per se will not be the cause.
RC
Remember, we are only one cubic mile from freedom
Is their any way to find out about the profitability and size of this chemical industry ? My understanding is that crude production by far the most profitable part of the oil industry. Next chemical plants are fairly automated or higher highly skilled workers they are not exactly the best industry for employing large quantities of people. Its certainly a smart move for KSA and should be a increasingly important part of their economy. Even if the world moves away from oil based transport the rest of the petrochemical industry should remain profitable. But using the simple investment cost per employee metric I don't see the petrochemical industry as a way for KSA to reinvent its economy. Just guessing but I'd figure the employee to investment ratio for a chemical plant is on the order of 10 million dollars to one employee.
The problem is the next step in the chain which is lets say making plastic widgets uses more labor yes but its very cheap labor which is not what I suspect a lot of Saudi's aspire. Investment banking property management ?
Dubai seems to be taking this approach. To be honest I've never even heard a real plan from the ME for the post peak world I have heard lots of talk about diversifying the economies but action seems thin.
What is KSA?
What is KSA?
Kingdom of Saudi Arabia
Sometimes called "The Kingdom", "SA" (Saudi Arabia)
or more loosely, the biggest player, the lynchpin of OPEC, the big dog in the yard, the swing producer, the boss, grand poobah, the most important place on Earth, and #!!*&^%*&^%!!
:-)
RC
Remember, we are only one cubic mile from freedom
Thanks.
A political crisis in KSA will occur, if the mainstream get to know, that total oiloutput is in decline amid depletion.
That is the main reason, in my opinion, why the Saudi oil minister recently tried to convince the world with "new discoveries". One of these discoveries being right next to Ghawar. The same story in tiny Kuwait ("huge new oil field") He also said, that SA will add about 200 mb of reserves.
On the same time, OPEC declared, that they will postpone further projects amid upcoming biofuels in the consuming countries.
Come on: this fish is stinking to hell.
The optimal PR for a company, whose opponents
will at best tax them or sell their shares:
*) we are growing production, revenues, and profits at a fast and sustainable rate, and look at our good environmental offsets.
Optimal PR for a country, whose opponents will at worse murder them and their families and seize all their assets and control of the nation and turn it into a medieval hellhole with automatic weapons:
*) We have plenty, plenty, tons of oil left and we're finding lots more every day, but we are voluntarily restricting production so that all of you will have a bright future in front of you forever, so please don't cut off our heads.
A lot of the recent public statements coming out of KSA are simply ridiculous beyond any cultural bias. This attempt to assert hyperbole as truth says that KSA is very concerned about internal opinion. We assume that these statements where made only for the consuming nations but if you look at them as propaganda for quelling internal dissension that may a lot more sense. They were made primarily to be reported back internally in KSA where they hold a lot more weight. Once I started thinking this way I've become convinced that KSA public statements are now primarily directed to cool internal issues and have nothing to do with reality or with the outside world. If this is true it means the Saudi's are very concerned about internal stability now and if so it would be interesting to assess exactly what has them so afraid. Thus tying this Ghawar report together with this view of KSA we have the prospect that something deeper and more troublesome is already brewing in the Kingdom.
Kuwait is not better. Since everybody knows, that oil exports are falling instead of rising (oil is 65 $!!!!!)the so called oil minister is telling the world, that actual reserves are only 48 bb instead of 98. this is bad news. But the good news is coming: POSSIBLE oil reserves in that tiny country are now 150 bb. More than double as assumed earlier.
Dealing with these Arabs is like beeing on the Bazar at its best!
According to the EIA, Kuwait's net exports (Total Liquids) fell by close to 9% (annual average, 2005 to 2006)--from 2.3 mbpd to 2.1 mbpd.
how many readers do we have in KSA?
Hopefully I can sleep tonight
Ed
In time the truth will force our governments based on lies and deceit to either act in the best interests of their people and the people will sacrifice for the common good, be overthrown and fall into anarchy or worse become true tyrannies. Given the stupidity and greed of most people the latter two while probably win. I think the chances of KSA becoming the next Greece is slim to none. The extremism we have seen recently is probably just a small taste of what is to come. In my mind for KSA the only real question is will the be able to convert to a real vicious repressive regime and continue to pump oil or will they call into anarchy. The problem is this would involve a strong military police basically transfer of power to the military.
This snippet of information suggests a conversion to a repressive state.
http://www.foreignaffairs.org/20040101faessay83105/michael-scott-doran/t...
And in any case does not paint a rosy picture of KSA.
Having read to the end of the article I posted throwing awareness of peak production into the KSA political climate is akin to dropping and atomic bomb on Jerusalem. If this analysis is even halfway reasonable I cannot see KSA surviving long after peak production. I had no idea the country was that brutal and so close to exploding. I can barely imagine how knowledge of declining production will effect the politics of this crazy place.
Hopefully someone knowledge of the KSA can post a credible reason why this country won't destroy itself.
I see none.
Now the bigger regional picture In my mind would be a massive war between Shia and Sunni initiated by a ethnic cleansing in KSA. This whole region will be a bloodbath.
I've come away with the feeling that Saddamn was actually a man of peace and stability for the standards of the ME. No wonder we supported him for so long. With the buffer of a powerful Iraq gone and peak oil a major regional war seems certain.
Yesterday's posting by Robert Rapier made a pretty good case that the price of gasoline is really a function of refinery issues and demand rather than oil.
"In particular, Saudi oil production has been falling with increasing speeed since summer 2005, and overall, since mid 2004, about 2 million barrels of oil per day in production has gone missing (about 1mbpd in reduction in total production, and about another 1mbpd in that two major new projects, Qatif and Haradh III, failed to increase overall production). That's 2.5% of world production and, if that production hadn't gone missing, gasoline in the US likely would still be somewhere in the vicinity of $2/gallon instead of well over $3."
Which is it?
Despite the bad press refineries are getting right now. I suspect a lot of this loss is being made up via conversion to more complex refining processes with the attendant pain. As far as I can tell from the thread refineries in the US have gone major upgrades I'm not sure how many simple refineries are left in the US and the world. Post peak light sweet crude you have to look at the complexity of the refining process. Robert has mentioned that refineries that can handle heavy/sour crudes tend to do fairly well because of the crack spread. A complex refinery will be able to produce more gasoline from a given barrel of oil so its worth determining if refineries have become more complex over the last few years and if this is covering the volume loss from crude.
We know that the tar sand upgrading process produces light hydrocarbons from asphalt but you would have to ask Robert how this technology works and how much is being used at normal refineries. Google gives me to many generic links that are not relevant too the state of the art today. Certainly the technology exists to upgrade almost any oil given enough NG. Costs would be the issue but if mining tar and processing it is profitable I'd have to imagine refineries today can comfortable invest in some fairly sophisticated processes. The end result is we are probably getting a higher percentage of gasoline per barrel today than we did even in the recent past. I have no easy way to verify exactly what the capabilities are and what the product mix is for advanced refining. I suspect they now have enough control that they can pretty much target a narrow range of products profitably but I'd have to imagine the choice of products vs effect on equipment etc etc is a pretty complex calculation with additional economic factors playing a big role. Again Robert is the best source for all this information but extrapolating from the oil sands makes it reasonable.
At the moment the situation seems to be that refiners are upgrading the complexity of their refining processes and this is causing problems along I think with sulfur handling issues and maybe more important deferred maintenance issues. Next with the drop in price of asphalt it seems the most profitable mode is to live with a lot of side products to get gasoline. This would make sense with the price of oil being low compared to gasoline. Thus inefficient refining is actually profitable for now. This would explain the build op of residual products and price drop in the short term.
The gasoline to oil to asphalt pricing ratio seems to give a lot of information on the refining process. Economically high gasoline prices should help spur investment into more efficient and targeted refining abilities which gives us a bit of a breather in the short term as we get more targeted product per barrel. Hypothetically a perfect refinery would be able to take any hydrocarbon plus hydrogen and output a single product. A large spread between oil and gasoline will spur investment to move towards this hypothetical refinery. This seems to be the current market signal i.e complex refining is now profitable.
If you knew oil production was going to go into massive decline in the forseeable future, would you build any more oil refineries? No, probably not. You would keep what you already had going as long as possible. If you knew oil production would continue on a plateau for the expected lifetime of a new refinery(starting back when the last of the refineries were built)would you not build to replace those in place when needed. Of course you would. Which has happened? The writing is on the wall, written by those in a position to know, whose bottom line was dependent on that choice. (And I don't buy Robert's argument of excess refinery capacity at the time the decision was made. The decision would have been made based on FUTURE considerations.) They knew back then, they know now.
I don't agree first never forget the market has a sort of built in intellect that is amazing.
Wolfram published a book that was supposed to represent physics.
http://www.wolframscience.com/
In reality it represent a sort of self programing media that can be used to represent any sort of concept. Physicists correctly dismissed it as not physics but I think missed that its a merger of programing and traditional mathematics and thus is a door to a sort of self cognitive mathematics thats seldom seen.
Sorry to bring up such a wacko example the other choice is quantum computing which works on a similar principal. The point is most people don't realize that markets are cognitive in the sense that a market is itself a sort of computer you could consider it a wolfram automaton or a quantum like computer. The output of a market is the price of a good at certain times but the market itself is a semi-intelligent computer. That uses wetware and silicon processors. Note that the market computer fails when the sub programs i.e humans or computers programed by humans cannot conceive of a outcome contrary in general to the existence of the market itself. Thus the oil market intrinsically cannot conceive of the end of oil unless a large number of participants program the concept into the market. In general the market mainly because of the history of its participant is incapable generally the response is by extrapolating business as usual.
Whew now with that behind us I see no indication that until recently refiners considered peak oil in their calculations.
I think the last few years contain indications of peak oil concepts but I don't see what your saying since it easily can be "proved" to be based on market forces if you assume my semi-intelligent market. In fact the bulk of conspiracies can also be placed under this sort of cognitive market with individual discovery and response. In short most rich bastards think the same way thats why they are rich bastards no conspiracy is needed. The earliest hint that the peak oil concept was making it into the "market" computer is the 1990's the first gulf war for example. This would correspond to when indication that Ghawar would decline would have been available to insiders. And also its the time that many oil fields would have started to decline if produced at maximum rate. And finally we would have known that no huge discoveries where probably going to happen.
So its not till the early 90's at the earliest that we had a complete set of discovery data to determine that global peak oil was on the horizon.
Back to earth...
The refinery decisions where obviously made before this time and thus focused on other issues i.e fairly short term market issues.
Now the we are reasonably certain the peak oil is near or in the past its fairly obvious to me at least that a lot of very powerful people have been gaming peak oil since at least 2002 if not a bit earlier. So yes you can discern the pattern of peak oil awareness in the markets and actions of powerful people but not back in the early 1980's the signal came much later. Hopefully this makes sense ? Do the rich bastards know about peak oil now you betcha.
(And I don't buy Robert's argument of excess refinery capacity at the time the decision was made. The decision would have been made based on FUTURE considerations.) They knew back then, they know now.
I don't understand the first part of your statement, but I can promise you that oil companies in general don't believe we are about to peak. They believe what they are saying, and there are quite a few expansions being built right now (and there was 2 million bpd of capacity built in the past 10 years). So if they know, why are they spending money to expand? (I am not saying they are right; I am just telling you what they actually believe).
They are still investing in expansions because they will still make a healthy profit in the foreseeable future. They will probably be doing better than present until worldwide demand destruction really kicks in say in 5-10 years.
The crude will NOT stop flowing, it will just become more precious. Those refineries that can refine heavier grades will make a hefty profit. Am I incorrect here, Robert?
The first half is pretty simple you work for a refiner and your job is to maximize profits you put a lot of thought ( computation into this decision) Your decisions are shared via the market with the rest of the refiners influencing their decisions etc. The point is the market itself is a computer.
You can consider it a shared messaging system with price as the basic message.
Next I said that the earliest that I would think peak oil awareness would have entered lets call it the oil industry is 1990 or so. So yes refiners in general would have continued to expand capacity if they needed to over the last few years. But you can also look at decisions by companies such as Valero which focused on heavy sour crudes. Why ? They could very well have considered the supply of sweet light crude in making this decision. They bet billions on the crack spread.
http://www.valero.com/AboutUs/History.htm
If you look at their history they did not make big bets on heavy sour until 1998 and later.
So reasonably credible world peak knowledge was available and the peaking of sweet light would have been a big part of this knowledge base. And a refiner bet the farm so to speak on the crack spread after credible peak oil information became available.
We probably will never know if this overlap is a coincidence
but it makes me question your assertion that the oil industry and even the refining industry is not peak oil aware. The peak in oil production in the US is well in the past at this point and was predicted so I just can't believe that 100% of the decision makers in the oil industry refused to consider peak oil.
With this said companies that take multi-billion dollar positions based on knowledge of peak oil probably don't want to advertise the fact. In the case of Valero if other companies had had their foresight they would not have made the profits they made. Valero made the right decision at the right time when the right information was available to fairly safely bet billions. If I had peak oil info and was running Valero at the time it would have been an obvious decision. The alternative that your suggesting is that they were simply lucky on the crack spread seems less appealing since the only way to know the crack spread would remain and widen is to know that peak light sweet was near. The coincidence is simply to strong to dismiss with assertions facts are needed.
Feel free to chase down all the connections but I think its blatantly obvious if you read this.
http://www.businessweek.com/magazine/content/05_43/b3956037.htm
Hmm in his home not spy devices thus a very private conversation off the record...
Since Valero's CEO all but says light sweet has peaked and they don't seem to be surprised in the least I think we have some smoking cannons that suggest a lot of powerful people are using peak oil to their full advantage.
Robert I believe you believe what your saying but I don't think your high enough in the business accesses this insider info. And the actions of TPTB indicate that they are working to keep some information secret.
Robert I believe you believe what your saying but I don't think your high enough in the business accesses this insider info.
As of my move to Scotland, I am closer to the top than I am to the bottom. And I am right where these decisions to do expansions are being made. Believe me or not, I do know. There is no general belief that we are at a peak in oil production (worldwide).
So are you encouraging your company not to expand its capacity in the face of peak?
Before he can even get that far, he would have to make them consider the idea of peak (either right now or near term). I suspect that this is one of the drivers for Robert's insistence on the most meticulous data - he needs an airtight case to present to other management. Without an airtight case, he cannot attempt to make that "sale" lest he be hounded out of the field of work he loves.
Ghawar Is Dying
The greatest shortcoming of the human race is our inability to understand the exponential function. - Dr. Albert Bartlett
Robert, I think you're correct. Hardly anyone in the industry called the N Sea peak correctly. Back in 1995 Matt Simmons was more or less a lone voice advocating an early peak whereas most in industry did not see a N Sea peak before 2010. Actual dates were 1999 (UK) and 2001 (Norway).
Why oil ?
Why so much controversy about intentions?
coal vs. oil = solid vs. liquid/gas = slow vs. explosive burn PROPAGATION
It all comes down to energy-release PROPAGATION rate
Flame rate or burn rate or oxidation rate = reaction rate = reaction PROPAGATION rate
ENERGY as coal vs. oil:
Coal works slowly, via a steam intermediate, to yield expansion..led to energy consumption via steam-ENGINE development [Industrial Age]
Oil/gas = petroleum = works directly via atomization to yield EXPLOSIVE expansion = gas ENGINE = unique RATE of WORK produced relative to any other commodity fuel, and as liquid it is a uniquely MOBILE fuel
cars and planes cannot work on coal/wood without [steam] intermediate to produce explosive energy release, and so are impractical. A boiler is required to achieve the high rate of energy release. Even NUCLEAR requires a boiler to create the expansion needed to to do work [No practical ENGINES have been developed to work solely on heat, but there are possibilities such as thermo-electric, ion-electric, photo electric, etc.]
Cheney 1999 speech:
--Oil is unique in that it is so strategic in nature.
--Energy is truly fundamental to the world's economy.
--The degree of government involvement also makes oil a unique commodity.
--Oil remains fundamentally a government business.
--It is the basic, fundamental building block of the world's economy.
--It is unlike any other commodity.
--The Middle East with two-thirds of the world’s oil and the lowest cost, is still where the prize ultimately lies
--The Middle East and Africa have over one hundred year’s supply of gas reserves at current low usage levels and the former Soviet Union and Latin America have gas reserve-to-production ratios which should last over seventy years.
Actually recent gasoline yields have been near 57% vs as high as 65% in the not too distant past. My guess is that the main reason is decline in light sweet crude feedstock. Murray
Correct - it is because of refinery issues and an inability to import more gasoline. The second issue is most likely connected with changes in the mix of export crude to heavier grades and changes to refinery output in Europe(more diesel).
PO is therefore involved, it seems that the flat production of ±84mbpd since 2004 masks (by now) a not insignificant shift in the mix of production toward heavier and sourer grades. Anybody - is there some information on this anywhere?
This results in the low price of asphalt. It also puts the frequent Saudi and OPEC comments that the market is well supplied in context. The market is well supplied with heavy sour crude. It is the lighter grades that are short and many refineries prefer lighter grades and are not equipped to turn it into gasoline (RR - that is a guess). Nigerian output is particularly valuable, but MEND (who I believe have a reasonable case) are ensuring it is not available. The net result is a shortgae of gasoline and high prices.
This raises what is perhaps a naive question - why bother with the tar sands in Canada? Why not convert the tar produced at refineries into lighter grades? Surely it would be cheaper?
This post links to a excellent article that shows a tie between peak oil and gas prices.
http://www.theoildrum.com/node/2562#comment-191866
I'm sure others exist. This is the sort of complex peak oil induced changes that will happen over the next few years.
Its a perfect example of the coupled positive feedback loops that I claim will cause the oil industry itself to fail quickly from peak oil. Kudo's to the reporter that puzzled this out. We will see more butterfly effects going forward.
It is the lighter grades that are short and many refineries prefer lighter grades and are not equipped to turn it into gasoline (RR - that is a guess).
After I watched the senate hearings from this week, Paul Sankey put this in perspective. He said that BP has 2 of the 5 largest refineries in the U.S. running at half capacity. Furthermore, the units they have down are the ones that allow them to process heavy crudes, which has forced them to run light crudes. Clearly this puts pressure on light crudes that would not have otherwise been there, helping to tighten up the supply.
Hi Robert - nice to make contact again. Why would the heavy crude units be down? Surely it would be the other way round?
Heavy crude units would be down because they are making longer term investments in those units. This places, as Robert notes, a short term pressure on light crude units and since light crude appears to have peaked in 2004, supplies of light crude are tighter.
I suspect that this is partly why Robert and others still believe peak is not quite here yet - there remains a significant amount of heavier crudes to be exploited fully. However, as those come online a large part of that capacity will just go towards offsetting light crude declines leaving only a small amount to grow overall capacity. This leads to the various expectations that peak is going to be somewhere between 87 and 90 mbpd.
That is a very plausible point and one that I can understand even if I do not agree with it. My difference of opinion comes from the fact that 60% of the oil comes from 1% of the oilfields (the 507 "giants"). And worse, almost 20% of the oil produced today, worldwide, comes from the top 20 giant and super-giant oil fields. It is my personal belief, after watching Yibal, Cantarell, and the North Sea, that declines in the very largest oil fields will exceed the capacity brought online from a host of smaller, heavier grade fields leading to an overall decline. As Stuart noted many months ago in Speaking of Bumpy Plateaus, Exxon has shown ZERO response to a tripling in price. In other words, supply has not increased one bit for Exxon even though price tripled. (This is largely true of most IOCs and NOCs too.) Stuart dissected this in more detail in Exxon and the Implications of 8%. In short, Exxon has for years told the world that they would increase supply. But decline overcame all attempts to do so and ended up with them only maintaining plateau as 8% declines destroyed all efforts to increase supply.
Thus, in my opinion (purely my opinion so direct all barbs at me), Robert, Rembrandt, and others are discounting the production declines of the very largest fields and thus placing too much hope in smaller fields coming online (the mega-projects list). I believe that the world, at best, can maintain plateau a few years more. Now this is talking strictly about C&C, not all liquids. All liquids I expect to grow about as Ace has documented, to a peak near 87 mbpd in early 2009. Most of this will come from tar sands and biofuels, but as biofuels begin to meet their limits to growth and as tar sands find they cannot increase the required amounts of water and natural gas, their collective ability to fill the gap will cease and declines will begin thereafter.
Anyway, back to the refineries - this is good news, at least for the slightly longer term. It doesn't do squat for us today and early in the summer so for this summer, at least into June, we best hope for mild demand and no unexpected gotchas.
Ghawar Is Dying
The greatest shortcoming of the human race is our inability to understand the exponential function. - Dr. Albert Bartlett
I think your analysis is spot on. But note in a sense its a bit rosy still. We have to expect that the strained oil industry will continue to fail and under perform over the next few years. And your not accounting for EROI which increasingly undercuts any real gains and of course Export Land.
The additions of these concepts shows that the final conversion to handle heavy sour will probably be to little and to late as these other factors swamp additional heavy sour capabilities. Also one of the major sources of heavy crude Cantrell is crashing so its not clear we actually have a glut of heavy sour oil now but instead a string of unfortunate events which have taken a fair amount of heavy sour refining ability off line. Many have pointed out that if the refiners where operating correctly we probably would not have a glut right now thus its not clear that excess heavy sour even exists right now once the refineries are online.
All of this adds up to demand destruction being the dominant factor from now on out. Supply given the above factors will not meet demand. And we have already seen that real demand destruction requires very high prices and supply imbalances as the markets simply cannot respond fast enough. The intrinsic problem is your trying to redirect tanker loads of gasoline or oil or other products based on the market price when bought. I don't think our current markets can actually handle demand destruction coupled with the physical issues of actual delivery. So I suspect the oil based commodities markets will suffer a meltdown. As and example we see the inability of the gasoline market to predict the need for significant imports into the US which has pushed us into the danger zone. The problem is of course speculators playing the market in a sense interfere with the core need of buying and selling commodities. These speculative bubbles on top of a demand destruction situation are dangerous to say the least and distort the pricing signal needed to efficiently move our remaining oil as the taking of paper profits hides the need for real shipments.
So the issue is when are we in a demand destruction controlled market I think its now and I don't think it will end.
You are welcome to your opinion but you appear (to me) to be excessively pessimistic in the short term. The mega-projects will come online, even if they are late by a year or two. The refineries will get expanded. At the very worst, decline over the next few years should be no greater than 0.8% and probably less. Since all liquids are increasing though, we should actually gain some breathing room (which will be misinterpreted as the good times returning again). Yes, EROEI is declining but that will not become transparent to the world overnight. It will take time.
I agree with Bhaktiari that the current phase will be semi-stable and last a few more years. And I agree that the following phases will be more turbulent. The world may muddle along blindly, still believing in more oil whether we stay right where we are or whether increase some small measure. What the world will not be able to ignore is continuous decline, year after year after year, once it begins. The key question looming before us is what will the decline rate actually be? Stuart has documented his reasons that the US (and probably Europe) cannot adapt any faster than 3%-4% annually. Over that brings trouble. The only question is how much over that.
Now the good news is that early decline rates would seem to be low and expected to stay low. The great unknown though is what has EOR techniques done to the giant fields of the world? This is a wildcard. Initial evidence is frightening (Yibal, Cantarell, North Sea) but not completely conclusive either. However, if that model holds for all fields that have been produced by EOR techniques, then we might see decline rates so high that society cannot adapt at all. How high is too high? We really don't know right now.
As for right now, this summer, I am not convinced there is any oil market meltdown in store. The poor will get poorer. The rich (which includes about 98% of the USA - very few truly poor here) will flippantly continue to consume. So long as the US, China, India, Japan, and Europe continue to buy oil, even with zero growth in demand, the oil markets will stay afloat. In my opinion, the oil market will not melt down until the economies who are the largest consumers of oil begin to badly falter and that is still out there in the future somewhere, almost certainly beyond the end of this summer.
Ghawar Is Dying
The greatest shortcoming of the human race is our inability to understand the exponential function. - Dr. Albert Bartlett
Well to narrow the reason for my pessimism its simple positive feedback loops. We know for a fact that the last time the system was stressed in the 70's it did not behave well. EROI is only one of the feedback mechanisms in play. All of them outside of demand destruction are positive feedback i.e. serve to decrease the usable or net oil supply or to define it better the amount/net of final oil based products not used by the energy industry itself. The only negative feedback mechanism in place going forward is demand destruction. My position is we will have to hit the demand destruction break far faster than most people are willing to believe. Since a lot of the positive feedbacks are exponential with short half life's I contend this will happen very soon like now.
Thanks for that Greyzone. For what it's worth I agree with your analysis, esp. regarding biofuels and tar sands syncrude.
When I calculate world oil supply using IEA data (I send a spreadsheet round to a few people with comments), I always show biofuels and syncrude separately. These amount in IEA data to approx 2mbpd. (Venzuela 0.6m, Canada 1.0m and Biofules 0.35m).
Using the adjusted figures C+C+NGL's have declined approx 1m bpd since late 2004. As discussed in previous posts this may mask a significant shift in the mix of crudes supplied toward the heavier grades; and goes to explain why BP (and others) is/are investing in that upgrade.
I think everybody, even the PO community, are suprised by the high decline rates when they hit. Canterell seems to have surprised everybody. The same may be true for Ghawar, except that the impact will be double or more that of Canterell.
Stuart, Euan, FF, Robert et al, thanks very much for the great posts. We at least will be less surprised when Saudi production data continues to show rapidly declines.
Hi Robert - nice to make contact again. Why would the heavy crude units be down? Surely it would be the other way round?
They are down for mechanical issues - not because they want to have them down.
An article I just read (and which I cannot find, alas) indicated that at least 2 of the refineries down on the west coast were down for upgrades to heavier crude. Not that this is bad - you have to do a conversion sometime if you are going to do it at all.
Ghawar Is Dying
The greatest shortcoming of the human race is our inability to understand the exponential function. - Dr. Albert Bartlett
Robert...now I'm confused. I brought up the idea that the refinery issues we are seeing in the US could be linked to the grades of crude being run, but what you are saying here contradicts this. You said that the grades of crude being run these days is no different than 10 years ago. Are we trying push more runs of heavy crude through the existing refineries that can handle it at present? Is this causing problems for those refineries?
Just trying to get a handle on the picture here.
This maybe helps http://www.thereporter.com/ci_5887968?source=most_emailed It would be interesting to know where the US west coast get the oil from.
OK, so some companies are seeing the writing on the wall? There will be a growing need to refine heavier crudes.
THIS is in line with the logic I have seen come out or TOD and Stuart et al. specifically. If we see more and more refineries going this route, there is still MUCH profit too be had, even in face of going over the tip of the peak.
I feel in my gut that the uptick in refineries problems we have been hearing about are due to less (and more expensive) light, sweet crude around, but plenty of the heavy, more difficult to handle crude.
Robert does not see this at all and has quoted stats to back it up. I say to Robert, if this is true, then why are any companies willing to pay the price to upgrade/expand refineries for heavier crude processing at all?
Robert does not see this at all and has quoted stats to back it up. I say to Robert, if this is true, then why are any companies willing to pay the price to upgrade/expand refineries for heavier crude processing at all?
That's not accurate. I believe that light sweet crude probably has peaked. I have said as much before. But even if it hadn't, the spread between heavy and light crudes has been huge - enough to justify the economics of spending the money to upgrade. That alone explains why they are willing to pay the price.
You said that the grades of crude being run these days is no different than 10 years ago. Are we trying push more runs of heavy crude through the existing refineries that can handle it at present? Is this causing problems for those refineries?
No, you can see a clear trend toward heavier crudes over time. It's just that they have been stable for several years, which is why I say that the argument that refiners are suddenly finding themselves buying heavy crude that they can't process well doesn't wash.
Am not sure if South Ghawar will be on a "production plateau for decades to come". Burgan was supposed to go to 2 mbod and produce on a plateau for decades to come. Then we got the word they tried to go to 2 mbod got to 1.9, then declined to 1.7 mbod. In November the EIA indicated Burgan production was 1.6 mbod. If I am correct they may have cut from 1.7 mbod back to 1.6 mbod due to OPEC cuts.
A Saudi spokesman indicated the Kindom of S.A. could, "If called upon, sustained daily crude production levels of 10, 12 and 15 million barrels per day can be readily maintained through 2054 and beyond." (From Mahmoud Abdul-Baqi and Nansen Saleri's works 2004)
http://www.saudi-us-relations.org/energy/saudi-energy-reserves.html
Already they have recanted of the 15 mbod a day for 50 years statement.
Cantarell dropped from about 2 mbod to close to 1.5 mbod in a short amount of time. They were shutting wells due to gas breaking through the oil ... gasing out. I think they may have done some redrilling vis-a-vis horizontally to try to delay the inevitable.
That green, pink, and blue grid map of Uthmaniyah shows about 7 kms of oil across the middle based on 500 meter squares, two squares = 1 km. That is less than 4.5 miles. Ghawar was given as a 25 mile wide oil field and if all you got is 4.35 miles in the middle then you got about 17% of the oil field surface area some years ago. If you look at it again you see the oil water contact moving in from north and south, east and west; like you got a big oil bubble somewhere in Uthmaniya with water fingering in from below and from all sides in an old report. That cross section is probably expired due to lack of freshness. Not sure what file it was pulled from or what section it may have once depicted. There was a report of 30% water cuts across the field and rapid switching to horizontal wells to delay the inevitable, why did I write that? Because I read in TOD the GOSP's were designed to handle a 20% water cut. The people got a hold of some of these reports and figured it is not the end of Ghawar, but it is like the end of Ghawar as we know it is not some distant event decades away. There was a report they were driving along the crest of the Uthmaniyah anticline setting up drilling pads to try to get the oil out before the water might arrive. There were 20,000 HP pumps working 24 hrs a day to push the oil. Ghawar is full of billions of barrels of water, some gas, and tons of oil.
Plateau does not indicate production rate. A plateau also does not have to occur at the peak. It can occur before or after a peak.
I suspect that what Stuart means in this case is that plateau might be anywhere from 1-2.5 mbpd, and if I had to guess, I'd pick 2mbpd myself. So if Northern Ghawar collapses that means a loss of anywhere from 2.5-4 mbpd (about 3mbpd by my guess). So Southern Ghawar might very well run along on a plateau but the impact on production of Ghawar overall is going to be a net loss of oil to the world on a daily basis.
I also suspect that the capacities announced were nothing more than fantasy used to manipulate the market and potential adversaries (like Iran) in a game of "who controls the oil market". So long as there clearly was surplus capacity, the other players would be unwilling to test KSA's statements because they had successfully backed up those statements in the past. But as evidence builds that KSA lacks swing capacity, we may see other OPEC nations flexing their powers in new and unexpected ways.
Ghawar Is Dying
The greatest shortcoming of the human race is our inability to understand the exponential function. - Dr. Albert Bartlett
I've been meaning for some time to draw a parallel between the reconstructions of KSA's actual status, and the work of Z. A. Medvedev in his book Nuclear Disaster In The Urals. Medvedev showed, using only public sources, that a then-secret serious nuclear waste accident had occurred. The key was an extensive set of scientific papers in radiation ecology which had been individually censored; when they were viewed as a whole, ommissions and distortions in individual papers were easily corrected.
So, I applaud this public search for truth following the great tradition of open publishing and independent commentary. Many thanks to everyone whose effort went into this careful analysis.
I have sometimes wondered what answer could be made if the Saudis were to publish completely fabricated technical data to support their production capacity claims; however, obfuscation alone has served well enough to date, and if the above analysis is accurate the game'll be up soon anyway.
Thanks for all your fantastic detective work Stuart. I'm convinced now that SA is in decline.
Are the Saudis really telling us that the M in Aramco stand for mining? Ghawar isn't that deep, ~6000ft. I'm wondering if it's possible to take the top off an oil field and use open cast mining or sink shafts for underground long wall mining. I guess you crush the reservoir rock and separate out the remaining oil. There is plenty of processing water down there!
One of the interesting things about the Canadian tar sands is that mining takes the recovery factor out of the equation%. Mining can open up tight rock including Arab 3. It looks better every day although I haven't a clue what the EROEI would be.
Are there any TODers in the mining industry who could comment? Many oil fields are 3000ft or less so you could start small.
I clutching at straws here... Sorry.
Alan, a couple of great big problems.
First is water, water and more water. 6000 feet down, you are into / through mulitple aquifers including the high flow rate aquifer that is the the reservior rock of Ghawar. The water would flow. The oil mostly wouldn't. Consider the water problem at Cigar Lake [google this uranium project -- hard to call it a mine at this point] and project that sort of situtation to something like Ghawar.
In addition 6000 feet is a big long way to get down to a pay streak. Open pit mining is out of the question with even a few hundred feet of overburden in almost all cases. Sinking a shaft, is perhaps possible, but now you are mining a lot of rock with a little contained oil [flamable and very gassy] and still pumping water on an almost unimaginable scale. The ecomomics and energy investment are horrible.
BTW, driving drifts back a few feet into hills to recover oil seepage has been done on a very small scale and probably with some local successes, but that was mostly back in the late 1800 or very early 1900s.
Oil shales and marginal coal seams are a lot more likely candidates for development.
What criteria are used to decide where, in the vast expanse that is Ghawar, to drill wells? In other words, why are the wells laid out (# of wells, spacing) the way they are?
Thank you and all contributors very much for all the hard work that goes into pieces such as this.
I have been lurking almost since the inception of this site and consider it one of the best places on the web for info and informed speculation on the oil situation.
I have refrained from contributing in the past, for the most part having not much of import to add that someone else has not already said. But one detail I would like to comment on.
The MSM have been touting the current link between high gasoline prices and refining capacity. Sure, there is a short term problem here, but only short term.
I began my career with Conoco in 1971. I distinctly remember meetings in the mid 70s in which it was stated that no more new refineries were going to be built in the U.S. We had enough existing capacity along with future upgrades to existing refineries to take care of foreseeable production. Small wonder that no new refineries have been built here since 1976.
Most of the world had been well explored for quite some time already, the U.S. peak was finally accepted, and the big question was where to risk capital next? Offshore, yes, North Slope, of course. The North Sea was a pleasant surprise. Nigeria was the last place in the world Conoco wanted to go, lol. One of the countries they considered 'relatively' stable was Venezuela. Well, that worked out ok for some time, but now look, nationalized.
The early 80s saw a mini-repeat of 73, rumours abounded that it was actually caused by an unexpected high water carry-over in North Ghawar wells. These rumuors were quite interestingly ignored by the MSM.
I switched to Amoco in 1985. Interesting difference in corporate cultures and direction. In 1989 all of us in the ivory tower in Chicago (some 5000 people) were treated to a series of presentations based on decisions that resulted from years of analysis in tandem with some outside consultants. The big takeaway from this was the fact that they stated that Amoco would most likely not exist as an independant concern by the end of the century due to the need to Get Big in order to afford the risk entailed with going Deep Water.
In 1999, 10 years later, they 'merged' (lol) with BP. One of the stipulations of the takeover was that BP would no longer stand for British Petroleum, thus the moniker Beyond Petroleum. (This was a hint, lol.)
I mention this only to point out that the majors have not just been blindly running around with no clue.
It is my belief that at least some people in virtually ALL of the majors have a very good idea of what the future holds, at least in a general sense. It is the details only that defy prediction.
Virtually all of the majors have investigated the alternatives, biofuels, wind, solar, geothermal, tidal, you name it. Amoco owned the then largest manufacturer of Solar cells- Solarex. (There's tha Beyond part, hehe.) Back in the 70s Phillips, along with the Feds, built a commercial scale plant for oil extraction from oil shale in Colorado. Too expensive and energy intensive was the conclusion.
There are numerous examples within the industry. When I hear Congressmen call for the oil companies to plow profits back into research I just have to laugh. Who do they think has done the lions shares of the research fo far?
Personally, I am very much impressed with how closely they
tagged our need for refining capacity. We are bumping up against our max present capacity just as production plateaus.
I am dismayed at RR talking about no awareness of Peak Oil within the industry. The clues have been there for at least 30 years, longer if you stretch.
I liken it to a good game of Chess, the opening is long past, the players have developed their strategies and developed their positions as well as possible. A few combinations have been attempted, some fients here and there. Serious mis-direction now and then. We are now deep into the mid-game, who are the survivors going to be?
Thanks for your post. What troubles me deeply is why the American people where allowed in a sense to make all the wrong decisions. The SUV's and McMansions etc. Given that the knowledge existed which indicated that the splurges of the last ten years where damaging to America if not deadly. Especially recent actions as we approach and probably pass peak oil. This is the part I really don't understand. Why did our government and power makers decide to effectively destroy the American middle class. I just don't understand greed/power at this level I guess. Even when oil was cheap the problems with a dependency on the ME where obvious and could have been used to rally support for tighter standards. Americans are incredibly gullible and easy to control the decision to send them in effect and in reality to the slaughter house bothers me to no end. We could have easily taken Frances approach and protected ourselves.
I sense you have seen a lot and probably know a lot maybe your willing to answer they why question is it really just greed ?
Just a personal note for people. I've been alerted that my posts are scrambled. I have sever dyslexia and have been a bit lax in reviewing my writing. Feel free to either send a private email or post when my writing is to garbled. I'll add this to my profile.
Your honesty and candor is much appreciated :-)
Best Hopes,
Alan
I assure my time as a dyslexic synthetic chemist was exciting.
I emailed Bob Shaw one of the stories the rest are only available under the influence of ethanol.
It was one of the factors that made me choose theoretical chemistry later since it was not clear I'd live long as a real chemist. However I was offered the job of destroying all the chemical weapons at the Pine Bluff Arsenal with monster ICP and they would have let me fly around in my own private plane with samples to dangerous to to ship.
You people have no idea how lucky you are I turned them down :)
Also I almost chose nuclear engineering I was very poor and looked into the Navy ROTC they pressured me hard to do become a nuclear sub engineer. Imagine ...
Rest assured that if I knew I would have posted it long ago. I never achieved a position high enough to be included in the schemes of the high and mighty, lol. Just hints, clues and paying attention to what everyone was doing as well as possible. It didn't really click for me for sure until March 17, 2005. Again, all the clues were there, but only if you were looking I guess.
I am out of the oil business now, being caught in the aftermath of the BP/Amoco rationalization in 2002 and now am in the hazardous waste business, how fitting, lol. 'Oil man attempts to expiate for lifetime of sins', rofl.
Yes, the entire situation rather boggles the mind doesn't it. I recall the SUV/light truck exemption thing (late 80s was it?). Could simply NOT believe it... By that time I had managed several different facilities and watched untold millions of gallons of product pass through. All of the majors were going farther and farther afield for the next batch of product. It just did NOT take any deep thinking to realise that this couldn't go on forevor.
And then they go and do this... Pretty much puts and end to the oil company/car manufacturer conspiracy theories. GM, Ford and Chrysler go bonkers building these behemoths and pretty much neglect the bottom end of the market place, giving up huge market share in the process. Can you say bad management? And they have the gall to blame their problems on unions and entitlements, omg.
I can only chalk it up to multiple cases of the rich and powers-that-be looking out only for themselves, a supremely human condition it would seem. How much communication is there at that lofty level of society?
Let's face it, the oil companies themselves have known for decades that oil wasn't forevor. They all have had R&D divisions working on alternatives for decades. The ones that I have worked for have, internally at least, touted themselves as Energy Companies, not just oil companies, once again, for decades now. Only recently have you seen some of them proclaming this publicly.
Were they all thinking that technology would have the solutions when it became necessary? And now here we are on the edge of the precipice and nothing has presented itself, in spite of Big Money having been thrown at it already.
Some of the players, if not all, at the top of the oil companies have to have ideas and plans for further personal prosperity. Do these plans include us? Do they talk to their peers outside of the industry? How far and wide is the knowledge spread?
It may be telling that we have oil men in the White House now. I hope they have better plans than what I have been able to discern so far.
Just look at the players and what they say.
BP- all is well says CEO Sir John Brown, oops, got caught lying to a judge, yer outta here says the Board of Directors, valiantly trying to cover their butts. But governments and media continue to base plans for the future on the BP statistical revue. Meanwhile 12 BP traders indicted within the Natural Gas Liquids department for LPG futures manipulation.
Exxon CEO says no such thing as Peak Oil, well for 50 years at least. But somehow has not been able to increase reserves.
Pickens and a few others are not afraid to tell the truth. CNBC has Pickens on for an hour as a guest host one morning in May 2006. He says several times that Production is peaked. He also states Ethanol is a non-starter and even explains, in an easy to understand way, why. When he is gone CNBC goes back to their regular programming and does not mention the salient issue of our lifetimes again that day.
Chevron CEO probably the most honest of the Major bigwigs so far. He is on record, within the last month or so only though, as stating it's a problem of scale. Any decent % reduction in a 21 million bpd habit is a pretty tall order. There, we have it, the truth is out. But did anyone notice? Pretty brave statements actually in light of his position.
This refining capacity talk is just another red herring thrown out in a long line of mis-direction for the masses imvho. I am not going to be distracted by it.
Yes, I agree the middle class is toast soon. We should have been working on population reduction and per capita energy use reduction a couple of decades ago.
Sorry for my rambling, but I have worked over 30 years in the business and can not help but be fascinated by the developments and machinations as they become apparent.
The worst part is that my youngest son is 9 and I struggle with how I can best prepare him for the future.
relayer- awesome viewpoint and observing what is right there to be seen. Thanks your ability to compose the prime scenario that connects the dots and share it vividly.
I repeat here s/g you and others might find refreshing, [and note Cheney's attempt to inform, too]:
Why oil ?
coal vs. oil = solid vs. liquid/gas = slow vs. explosive burn PROPAGATION
It all comes down to energy-release PROPAGATION rate
Flame rate or burn rate or oxidation rate = reaction rate = reaction PROPAGATION rate
ENERGY as coal vs. oil:
Coal works slowly, via a steam intermediate, to yield expansion..led to energy consumption via steam-ENGINE development [Industrial Age]
Oil/gas = petroleum = works directly via atomization to yield EXPLOSIVE expansion = gas ENGINE = unique RATE of WORK produced relative to any other commodity fuel, and as liquid it is a uniquely MOBILE fuel
cars and planes cannot work on coal/wood without [steam] intermediate to produce explosive energy release, and so are impractical. A boiler is required to achieve the high rate of energy release. Even NUCLEAR requires a boiler to create the expansion needed to to do work [No practical ENGINES have been developed to work on solely on heat, but there are possibilities such as thermo-electric, ion-electric, photo electric, etc.]
Cheney 1999 speech:
Oil is unique in that it is so strategic in nature.
Energy is truly fundamental to the world's economy.
The degree of government involvement also makes oil a unique commodity.
Oil remains fundamentally a government business.
It is the basic, fundamental building block of the world's economy.
It is unlike any other commodity.
The Middle East with two-thirds of the world’s oil and the lowest cost, is still where the prize ultimately lies
The Middle East and Africa have over one hundred year’s supply of gas reserves at current low usage levels and the former Soviet Union and Latin America have gas reserve-to-production ratios which should last over seventy years.
Here is the overall scene, The Petrogame, that rules events. This draft scenario is crude but, for example, clearly shows that OIL is a GOVERNMENT matter, and failing to see that will leave one spinning with data and mystery.
And those who govern lie. All governments.
Part 1 of 2:
Perhaps the following scenario will help explain events and predict others.
These are core facts of the Petrogame that drive events:
Consider: A desert chieftan in the 1930's discovers that his territory has tons and tons of gold laying in countless veins just 100 meters under the sand. Almost unbelievably easy to access it merely with big shovels. As such desirable treasure is impossible to exploit secretly, what would be the single, over-riding consideration dominating his thoughts...from the moment he verified the fact of that gold?
Clearly his next-tentflap neighbors will be at once dazzled and obsessed with plans to make him the main course for their dinner .
As the lucky chieftan, he has certainty that he must obtain an overwhelming military force to squash the appetite of neighbors, before their plans mature and overwhelm him. All his attention goes to securing both the new wealth and his ownership of it.
Here lay apparent contradictions. Until late 1970's, Saudi Arabia had no real military forces at all ! No Army...No Navy...No Air Force...Only police and internal security forces. That defies sensibility because the chieftan in the late 1930s, and surely by 1941, had Standard Oil engineers verify the data demonstrating that huge pools of oil were in fact there. Knock a pipe into the sand, screw on a valve, make lots of new friends. Does not even need a pump.
It is impossible that there was no huge, military force immediately established to protect those deposits. But there was none...or was there?
There had to be, but it was hiddden. A powerful partner was there. There was a quid-pro-quo created where each partner held exquisitely equal leverage. If either party renegged, the other could cause disaster. The key to workability was the equal leverage which ensures durability of the arrangement.
The Oil Powers [dominated first by Standard and soon RoyalDutchShell and later BP ] were able to guarantee that the now RoyalChieftanFamily stayed on the Royal Throne, in exchange [1] for the Chieftan depositing his oil revenue monie$ into the Oil Power's banks; and equally strategically, [2] the Oil Powers led by Standard would retain overriding control of wholesale and retail distribution policy to extent of who would/would not receive the ultimate use of the petro products [oil and gas] and at what terms.
What was the OilPowers' guarantee? The US Military was [somehow under the control of The Standard] to be made available to guarantee continuity of the Royal Throne as long as the Throne deposits the bulk of their revenue$ in OilPowers, banks and does not withdraw said deposits; and obeys any production/distribution/marketing directions. Oil became denominated in US Dollars. As for the Throne's leverage, just their mere hint that $ deposits would be withheld or withdrawn would undermine credibility of banking systems. As the magnitude of flowing oil rose, the partners next agreed the USDollar would be the exclusive trade-currency. Each party had equal and credible leverage to enforce its position.
That is what happened in Saudi Arabia.
"Oil Powers" identities change over time, but are essentially Anglo-American. "Oil Powers" are not companies; they are individuals with similar goals who use oil/gas as a tool to enable strategy.
Petro-oleum = Rock Oil. Until 1859, it was thought to exist only as slow seepage from inside rock, in non-commercial quantities. By 1859 petroleum was discovered to exist in underground pools. This was quickly recognized by some as the ultimate source of Heat/Light/Power [HLP], in terms of cost, quality and efficiency.
Silliman at Yale University had done the first major chemical analysis of crude oil within months of its being found to exist in commercial quantities. Note the first use for petroleum, in commercial quantities, was lamp-oil for light [nearly white, non-smoking, portable and cheap] and the demand was worldwide, overwhelming even from Asia. Demand for light was later followed by demand as lubricant. Still later as fuel for steam production [e.g. ships]; later still as source fuel for combustion [gasoline] engines, space heating and electrical generation.
Wherever oil was made available, it could easily dominate as the source of HLP demand. Thus he who controlled its distribution could control whoever needed it...or whatever nation needed it. You want Heat? You want Light? You want Power? Either be compliant or be coldly in darkness and powerless.
A super tool to compel cooperation from any ruler. Or to find another who will. Control the ruler or create the new ruler, and let the ruler control the population. Best to select a Royal Family, as that means a predictable line of succession. The plan is old, but the plan has had many successes.
Early on, Standard's Rockefeller and Royal Dutch' Dietermann and the English Crown understood all of this. [England's Shell and RoyalDutch merged about 1900.]*
It is critical to include the fact that the OIL-game was merged with the BANKING-game. * *
As with Saudi Arabia, the similar deals made with Kuwait and other ruling-family-type governments. He who partners with the family controls the oil/gas as long as that family stays on the throne.
The deals all involve Standard [American] and Royal DutchShell/BP [Anglo] et al, who have similar, effective, covert control over their respective governments' forces [military and/or other contributions to the required force] to guarantee longevity of the ruler's status and similar production/distribution/marketing rights from the ruler.
So explains the saga of Iran's Shah. Democraticly booted out in early 1950's, quickly reinstalled by Anglo-American force, then booted again 25 years later. No more Royal Line = end of deal = OilPowers attempt in ANY WAY to stop/ruin any oil production/marketing they cannot control.
So explains the saga of Saddam. Non-cooperating [e.g. not denominating exclusively in USD] and no Royal Line.
So explains the saga of Kuwait when Saddam briefly took over. Who reacted very forcefully to put the Sabah family back on the Royal Throne? You can bet the Saud family was watching nervously to see if, in fact, Standard et al would make good the guarantee; after all, the Saud clan held the same guarantee with the same partner. The Saud clan breathed easy when Kuwait's Sabah family was returned to their throne [followed by abrupt end of military operation].
So explains some of the Czar's troubles. The Czar would not relinquish control of Russian oil [e.g. Baku] which really crimped Rockefeller's [Standard] and Dietermann's [Royal Dutch/EnglishShell] world-monopoly dream, and not-so-oddly, WW I did not end in Russia until 1922/1923; then government that followed the Czar was not ruling-family type, thus no predictable line of succession.
WW 1 ? Have a look at the territory of the Ottoman Empire at that time. Then, locate the known oil resources within that perimeter, factor in England's Lawrence of Arabia and promise of self-government to their Arabian allies for expelling the Ottoman rulers. Then watch what happened when the the Ottoman armies were expelled.
WW 2 ? Surely Krupp, I. G. Farben et al in oil-less Germany knew well the prize of Baku/Caspian. There's an old bio of Dietermann who, in 1920's, was quoted in English newsmedia, claiming that the resources of Russia would be the "greatest commercial prize in history", and that "Baku is the finger that points East" as he promoted another war. But the world depression from 1930 delayed the acquisitive Dietermann's-and-others' plan to jointly invade Russia.
So explains the saga of Vietnam. Offshore, oil/gas deposits were surmised because the geography fit the oil industry's working model of Continental Shelf theory*** [just GOOGLE "vietnam + oil" to see who/what is happening post-1975] but, after the French left, there was no possibility to control a petroleum industry. And certainly no ruling family after failed attempt to create a Diem clan. The thought of oil being independently developed and marketed was indeed a threat.
So explains the saga of all non-ruling-family-type governments' attempts to develop and market their oil. In the case of Mexico, albeit without a ruling-famly, Marines were sent into Veracruz and the oligarchs coalesced to rule extended-family-style since then; and being right on US border facilitates control. Those oligarchs who did not agree were visited by unlucky events.
So explains the saga everywhere a ruling-family has oil that can be produced and potentially marketed.
So explains a lot of other observations from circa 1880 to present time.
So explains why the petrogame of "I hold you by your heat/light/power arteries" is getting interestinger and interestinger. And wilder.
So explains the addiction. Oil addiction was created by low-cost, high quality, efficient and readily available fuel supply. The addiction was/is maintained by intense suppression of alternative HLP sources [e.g. by legislation; denial of funding; misdirecting R&D], along with the OilPowers closely monitoring all aspects of their game.
[end Part 1]
Part 2 of 2 The Petrogame:
The petrogame is the means to World Domination by a small group who coincidently share similar goals.
Only petroleum [as oil and gas] can be harnessed in a way that precludes unwanted-others from joining the group.
No other HLP resource can be globally monopolized; or exists in sufficient quantity. The others are merely technology based, and technology cannot be monopolized. [E.g.-- a nuclear club to monopolize enrichment/extraction is a work-in-progress, but has only short-term and spotty workability that can be bypassed. Also there are local monopolies, such as control of hydro-power, that are not scaleable to global scope. As for coal, technology has not resolved enormous pollution aspects, and coal has potential only to crimp or tweak the petrogame.]
The above is a minimal framework to make sense of many events, especially since late 1800's, that otherwise seem crazy-quilt.
* In late 1500's, the English Crown realized its very survival was as seafaring-traders/sea-controllers and began (1) building a global navy and (2)collecting data, in earnest, of all known, global resources, first compiled by England's Hakluyt team. [Just 1 example so the reader gets the urgency: On 2,500 mile voyages across open ocean, lack of potable water caused entire crews to die and their ships become derelict. Thus sources of potable water in mid-ocean and the route for longboats to get safely ashore on the "unknown" islands, became vital secrets to be learned.] That viewpoint and project primed many subsequent adventures from gold-buccaneering, fleet-building and wiping-out the Spanish Armada on up to The East India Company and into more modern, more covert tactics. Long-range planning always evolving by trial and error and very covert. The small island-nation of England learned well its limitations as its Empire collapsed. Surely by the 20th Century, survival depended on correctly analysing its failure to control that Empire. The island-nation needed a giant proxy-nation to front for its Empire rebuild. Whoever might it be?
** By 1890, it was apparent that Big Oil, primarily Standard's combine, had the cash volumes and cash flows to actually rival and threaten the banking game. In late 1890s, Rockefeller and JP Morgan teamed to buy Carnegie's steel behemoth and form the US Steel combine. The cash price was about $490 Million, in 1890-era dollars ! The peculiar nature of the petrogame's grip on HLP offerred real assets versus the paper of banking, breaking the banker's peculiar clout that depended on being allowed to monopolize paper money. Further, while paper money dealt with sovereign currencies on a nation-by-nation basis, oil was a global tool.
***Continental Shelf theory is able to predict fairly well the liklihood of finding commercial deposits of petroleum [liquids or gas], even at what likely depths, in coastal regions. That theory is apparently closely held and rarely mentioned with any detail. My own sources were engineers who perform specialized, technical and sophisticated component- reliability testing. That work was mandated in Federal regulation of nuclear power stations in response to the failure at Three Mile Island of valve instrumentation, in response to which the unique testing was first developed. Oil/gas field management were quick to use the same contract personnel for oilfield vital components. Consequently,and globally, all coastal regions have been surveyed for potential. E.g.- The Caribbean region, of course, would be of interest and petroleum might account for the strange international politics there, as well West Africa.
[END]
jbunt
KSA did not need armies to protect them. The US major oil companies found the oil, which was followed up by President Roosevelt (I believe that he actually went to SA) signing a treaty with SA whereby we would defend them. This was not a "secret" agreement, but was well publicized - i.e., do not mess with SA because the US will not permit it.
Interestingly enough, it was some time in the 70s that Conoco sent out copies of 'The Seven Sisters' to ALL employees and made it virtually required reading. I have to admit it was very engaging and illuminating.
Very interesting, relayer. The 7 Sisters is a knockout work. I got my appetite for the Petro scene as result of Ida Tarbell's History of the Standard Oil Co ca. 1900 much of which was based on sworn testimony of JDRockefeller given in person in court.
With the crude communications at that time, his testimony was given at many courthouse appearances involving many lawsuits against Standard, around the US. The data was mostly reported only at the local town level and usually not beyond. And often not at all.
Ida organized searches of courthouse records to find JDR suits, and then gathered the testimony, often using interested college students around the country.
The use and abuse of oil has been a 140-year slingshot of progress, unfortunately skewed and biased in favor of an acquisitive minority obsessed with the fear of losing their status. Thus their drive to control others. "Human nature" can, I hope, evolve further to handle the acquisitive, cannibalistic trend.
Look forward to catching more of your posts. Glad you found the TOD forum. In the months I have been reading here, seems TOD is on leading edge of vital data dissemination.
Stuart, Since you only put in 300+ hours and counting so far in this article, care to do a little thinking on the implications of your latest efforts?
In your September 6th, 2005 article, 4%, 11%, Who the Hell Cares?, you lay out three scenarios of worldwide oil decline rates: Adaptation and Economic Growth (above 4% decline), Orderly Decline (between 4 and 11%), and Collapse (>11%).
Given what you have written in your recent posts, do you still see us in the least dire category?
This quote is still very central to your 9/6/05 paper:
Hi Stuart,
The superb analysis, by you and Euan, indicates a high probability that light crude production from North Ghawar must now be in steep decline. Aramco’s other high quality extra light crude production sources, from Abqaiq and Berri, are probably also in decline. Safaniya may have surplus capacity but it is less marketable high sulphur heavy crude. Conclusion: Saudi Arabia’s crude oil and lease condensation production continues to decline.
Having read your analysis again, I thought I would attempt a comparison between North Ghawar and the North Sea.
The North Sea: An Analogue for North Ghawar?
The North Sea oil fields have significant differences to North Ghawar, which include reservoir structure/composition, geographic field distribution, location (offshore/onshore), recovery rates and production constraints (ie OPEC quota for North Ghawar). However, there are many similarities:
The chart below shows further similarities for North Ghawar and North Sea. The red line is an estimate of North Ghawar production. Production rates for both regions were about 4.5 Mb/d in 2005 and forecast production rates are less than 4 Mb/d in 2007. The remaining reserve depletion rate for North Sea is about 10.5% in 2006. Stuart’s chart above indicates 2007 reserve/production ratios of close to 10 for most of North Ghawar, of which the inverse, 10%, is similar to the North Sea depletion rate.
The chart also shows 1999 as the peak of North Sea C&C production at 6 Mb/d. In the same year, North Ghawar’s production was still on an estimated 4.5 Mb/d peak plateau, due partly to OPEC quotas. North Ghawar production drops from its plateau in 2005 which is the same year that Saudi Arabia's total production passed its peak of 9.6 Mb/d.
It is interesting to note that, in 2000, the North Sea depletion rate was just over 12%. In 2006, this depletion rate had declined to 10.5%. Subsequently, it is assumed that this depletion rate will continue its declining trend to a 2020 target of 7%, which is still greater than the depletion rates of USA and Russia. This decline in the depletion rate is an attempt to quantify the technical difficulties associated with extracting the remaining reserves.
The forecast production decline rate for North Sea is a maximum for 2007 at about 13%. This represents an inflection point for the production rate curve, as the production decline rate decreases after 2007.
North Sea with North Ghawar estimated Production Rate Curve - Click to enlarge
North Ghawar and North Sea have similar remaining reserves of about 13 Gb. Furthermore, assuming similar forecast reserve depletion rates and implied forecast production decline rates, the production rate of light crude from North Ghawar is expected to decline further down from its previous plateau rate. Consequently, as Ghawar is Saudi Arabia’s largest contributor to national production, the declining production rate forecast for Saudi Arabia below remains unchanged.
Saudi Arabia forecast to Dec 2020 (Note that the inverse of the 5.5% depletion rate of remaining reserves corresponds to a reserves/production ratio of 18) - Click to enlarge
Let me preface this by saying that I am not a petroleum engineer, but I am a chemical engineer who was employed for 13 years by Aramco as an advisor to their crude oil marketing program, leaving their employ in 2005. Your analyis needs some inputs from the marketing and supply side, with which I was intimately involved. I worked with Nansen Soleri and Mike Shihshakli before him in developing the 5 year production plans which directed investment to various fields. In addition, I worked on a monthly basis with the Marketing staff who were responsible for selling the right overall volumes (as directed by OPEC) and the specific streams necessary to maximize the Kingdom's revenues, based on the contracts and available production capacities. Let me make a few observations:
First, in order to maximize revenues when operating below the system-wide production capacity, one would produce all of the lighter higher revenue crudes and selectively shut in Arab Heavy. In general, that is what they do, but it's not that simple. They have contract committments to a number of customers who want those heavier crudes, so they must provide some of those grades.
Next, the Kingdom has NEVER had a problem marketing Arab Super Light from the Hawtah reservoir. In fact, they have sold the entire capacity to Far Eastern customers who highly prize it for its low sulfur and high kerosene yields. Atlantic Basin refiners could not match the prices paid by the FE customers. There is more capacity in a nearby reservoir, but the high costs for dealing with the high gas/oil reservoir has pushed that development down in the investment queue until recently.
The next high revenue in the dispatch order is Arab Extra Light and that was also always sold out, every month. Expansions at Shaybah (from ~ 500 to 700 kbd in the next few years) will only partially offset the declines in the Abqaiq and Berri reservoirs, with which this stream is blended. Total AXL sales will stay flat to slightly decline in the next 5 years. Could Shaybah do more? Sure, if you chose to take a more aggressive approach to reservoir management than does Aramco.
Regarding Arab Light, it should surprise no one that a field brought on production in the '50s would show some depletion. Further, it is entirely rational that one would start with the most prolific, highest quality section of the field (Ain Dar/Shedgum) and then proceed to the lower quality sections as one depleted the prime areas. Does this mean that the entire Ghawar is near depletion? Heck no. If fact, as you pointed out, Ghawar was developed on an as-needed basis over the last 60 years. They aren't done yet. Aramco has stepped up their drilling rig count from 25-30 5 years ago to > 100 rigs today. Some of this is wildcatting for gas but a lot of it is drilling & workover for Ghawar as they water injection program sweeps oil.
From time to time, Aramco has cut back on allocations of Arab Light, but that has more to do with a fairness issue in the complicated contract deck which they must manage. That is, it was not always possible or entirely fair to just eliminate all AMedium or AHeavy and shove ALight at customers who had high conversion refineries. Marketing is sometimes about compromises and understanding customers needs, not just serving your own short-term objectives. There's pleny of oil in the southern Ghawar and they have mobilized the rigs necessary to liberate those reserves. I'm not the guy to discuss reserves in place however.
Khurais is another Arab Light reservoir which is hardly touched yet. It was produced at ~100 kbd in the early 90's to supply the nearby Riyadh refinery. That production level was limited by the ability to reinject dissolved gas, not because of lack of resource. In order to efficiently produce that field one needs to reinject gas or inject water to maintain reservoir pressure. As the Kingdom now has need of more gas, it has opted to inject seawater. This water injection scheme has made this development expensive, which is the reason this reservoir has lain fallow for all these years. A policy decision was made to diversify production which moved this project up the investment queue alongside more Ghawar in-fill drilling.
There are several on/offshore Arab Medium fields which have rarely gotten investment money because of the low sales revenues. Most of those volumes are committed to Joint Venture customers in which Aramco has invested in their heavy crude refining capacity. In effect those JV refining margins add to Aramco's sales revenues for these heavy crudes. Still, these fields run below capacity most of the time that OPEC demands capacity be shut in.
Finally, the Arab Heavy field Safiniyah is almost always operating at the minimum level necessary to serve JV customers. At one time I estimated the R/P ratio for Safaniyah field and got a triple digit number which said that the world isn't going to run out of that stream anytime soon. Recently, Aramco has have invited companies to build refineries in-Kingdom which will process Arab Heavy, so they needed more A Heavy production capacity. The most convenient source was Manifah, part onshore, part shallow water area south of Tanajib. This was another long known reservoir which was always low in the queue, but was cheaper to develop than Safaniyah. Again, the prospect of sharing those refining margins has added to the net sales revenues of a crude which might not be in the development plan otherwise.
Hi Carl,
Interesting insights. I hope you hang around here, because it would be very good to have someone with a bit of inside knowledge as we try to read the tea leaves as to what's happening in Saudi.
So, what's your view? Do you think they could raise production right back up to 9.5 million bpd within a short period of time if they wanted?
Thanks, RR
Yes, but in the short-term it would have to be AM and AH via Zuluf and Safaniya.
Carl:
Thanks for your interesting observations.
Do you know whether Saudi Aramco was starting to switch to using infield injection in the southern half of Ghawar to accelerate production?
Should be injecting water down there too. However, they would not characterize that as a method to "accelerate production". They view water injection as a way to preserve pressure keeping the gas cap from expanding and water sweeping oil forward. Both effects maximize reservoir recovery and are not used to increase the depletion rate. They try to keep the depletion rates very low ~ 2%/yr to maximize reservoir recovery. That's how they got from 18% recovery to 36% recovery in the northern Ghawar.
Hi Carl,
Thank you for your valuable info! Your statement about North Ghawar appears to confirm its high depletion level which will be followed by a steep decline rate.
I get the impression from you that Aramco has significant reserves left but that they are either hard to market heavy/medium crudes or hard to extract light crudes. These factors imply that Aramco's production rate is in decline. Aramco's easy to market and easy to extract oil has been sold.
Based on your feedback, my estimate for Aramco's marketable 2008 C&C production capacity by grade is about 8.7 mbd, allowing for further decline in North Ghawar/Abqaiq and for new capacity from Shaybah expansion and Khursaniyah.
Super light: 0.2 mbd - Hawtah, 0.2 mbd
Extra light: 1.2 mbd - Shaybah, 0.7 mbd; Berri, 0.3 mbd; Abqaiq 0.2 mbd
Light: 4.8 mbd - North Ghawar, 3.0 mbd; South Ghawar, 1.0 mbd; Qatif, 0.4 mbd; Khursaniyah (AFK), 0.4 mbd
Medium: 1.3 mbd - Zuluf, 0.6 mbd; Marjan, 0.4 mbd; Abu Safah, 0.3 mbd
Heavy: 1.2 mbd - Safaniyah, 0.9 mbd; Neutral Zone share, 0.3 mbd
You left out 1.2 mmbd of Khurais (AL) available by 2009 and 0.9 mmbd of Manifa (AH) by 2011
RE: "hard to market heavy/medium crudes or hard to extract light crudes"
Arabian crudes are never "hard to market" as most of the world's refining capacity was designed to process them specifically. It is a matter of the appropriate price and for the Saudis, a matter of optimizing revenues. Aramco markets crude at the values the market determines. That is, as a feedstock, the products values determine the prices of any crude. Heavier crudes make less high value clean products and cost more to process, making them less valuable than lighter crudes. As a swing producer, they make decisions to shut-in production that no non-OPEC producer must face. Consequently, if they are shutting in production, they will always shut in the heavier streams which net less revenues.
Re: "hard to extract light crudes"
Actually, their lighter crudes are on-shore and ridiculously cheap (~50 cents/B on variable cost and maybe $3.5/B including maintain production cap'y investments) to produce. All crudes, save ASL, are produced with natural pressure drive, which is part of the reason that they use water injection. The ASL requires downhole electric motors to produce, but the production costs there are still quite low. The reason that they delayed development of Nuayyim was that it was so easy and cheap to develop more AL in Ghawar and Khurais. The new projects are costing $5-7/b - still absurdly low compared to the real world.
Regarding water injection
It is Aramco practice to maintain reservoir pressure by reinjecting gas (as in Shaybah) or by injecting water (as in Ghawar), unless there is enough natural water drive under to reservoir to do that for you. Note that a substantial portion of the Khurais investment is to bring seawater from the Arabian Gulf 350 km to Khurais for injection at day one. Take a barrel out - put a barrel back in to hold pressure up.