In Defense of the Hubbert Linearization Method
Posted by Sam Foucher on June 24, 2007 - 10:30am
This a post by Jeffrey J. Brown (westexas)
The Hubbert Linearization (HL) method (the Hubbert Linearization term was coined by Stuart Staniford, with The Oil Drum) is essentially based on the mathematical observation that a parabolic (bell shaped) curve can be plotted as a line, when we plot P/Q versus Q, where P = annual production and Q = cumulative production to date. The parabolic curve assumption is based on the premise that we tend to find the big fields first. In essence, "Peak Oil" is the story of the rise and fall of the big fields. The parabolic HL model suggests that the world and Saudi Arabia are both probably now in terminal decline. While the overall world decline may be quite gradual, the impact on world oil exports will probably be very severe. See the following article for more information on the HL method: Texas and US Lower 48 Oil Production as a Model for Saudi Arabia and the World.
Note that if the Ghawar Field in Saudi Arabia is in long term decline, which I believe that it is, it is my understanding that every single field that has ever produced one million barrels per day (mbpd) or more of crude oil (crude + condensate) is now in decline. Saudi Arabia has one field coming on line that might make one mbpd, although a lot of people have their doubts. The only real confirmed one mbpd and larger field on the horizon is Kashagan, which probably won't break the one mbpd mark until 2020 at the earliest.
As many people know, Kenneth Deffeyes predicted, using the HL method, a world crude oil peak between 2004 and 2008, most likely in 2005. (He observed that world production apparently peaked in 2000, but he never backed away from his mathematical model that the probable peak was between 2004 and 2008.)
In any case, in the above referenced Texas/Lower 48 article, we supported Deffeyes' work, and we added the Texas model. I observed that Texas peaked at a later stage of depletion than the Lower 48. Post-peak, Texas declined at a faster rate than the overall Lower 48. This was the basis of my warning a year ago that the world and Saudi Arabia were on the verge of a decline in crude oil production. It may be a coincidence, but relative to monthly peaks in 2005, world crude oil production is down more than one percent and Saudi crude oil production is down about 11% (EIA data, crude + condensate).
Note that the initial Lower 48 decline was quite gradual, less than 1% per year for the first two years. Also note that the world has the benefit of the non conventional tar sands production that was not a factor in the Lower 48.
A key piece of data in support of an involuntary decline for the world and Saudi Arabia is the price of oil. The average monthly Brent crude oil price in the 20 months prior to 5/05 was $38 per barrel. The average monthly Brent crude oil price after 5/05 has been about $62, within a range of $54 to $74. Again, we saw this pattern of higher oil prices and lower production in the Texas and the Lower 48 in the Seventies.
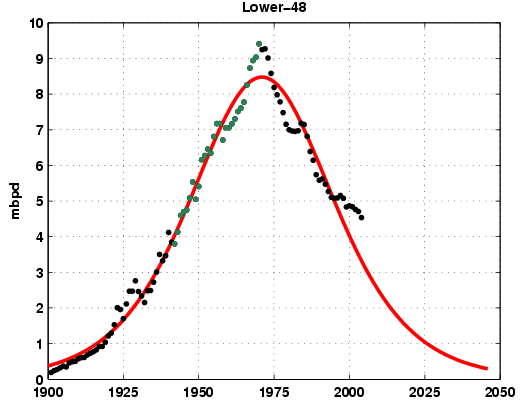
The Lower 48 peaked in 1970. Based only on production through 1970, the Lower 48 was right at the 50% of Qt mark in 1970 (Qt is a mathematical estimate of URR for a region).
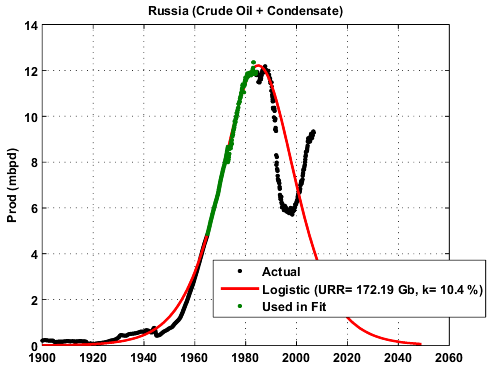
Russia peaked on a broad plateau centered on 1984. Based only on production through 1984 Russia was right at the 50% of Qt mark in 1984. Russia made from just above 11 mbpd to just below 11 mbpd for five years on both sides of 1984.
At my request, Khebab generated a post-1970 production profile for the Lower 48 and a post-1984 production profile for Russia, using only production data through 1970 for the Lower 48 and through 1984 for Russia to generate the models.
The post-1970 cumulative Lower 48 production, through 2004, was 99% of what the model predicted it would be, see Figure One, Hubbert Linearization technique applied to the Lower-48. Only the data between 1942 and 1970 (green points) are used to perform the fit (red curve).
The post-1984 cumulative Russian production, through 2004, was 95% of what the model predicted it would be. In other words, Russia was "underproduced" through 2004, see Figure Two, Hubbert Linearization technique applied to Russia. Only the data through 1984 (green points) are used to perform the fit (red curve).

In 2006, Russia "caught up" to where it should be. Now, as Russia has approached the 100% mark (100% of what it should have produced based on the HL model), its year over year increase in production has been slowing appreciably, and since October, 2006, the EIA has been showing basically flat production for Russia.
By the way, based on data through 1999 and 2005 respectively, both the North Sea and Mexico started declining right at their respective 50% of Qt marks.
Now, a lot of claims that the HL method is inaccurate are based on a misuse of the method. In most cases, we don't get an accurate Qt estimate until we get a P/Q intercept in the 5% to 10% range. For example, a lot of people use the UK as an example of where the HL method doesn't work, but this is based on wildly improbable early P/Q intercept of 30%.
A lot of the disbelief/denial about a World/Saudi peak is very similar to the reaction that we saw in the Lower 48/Texas in the Seventies. Probably 9 out of 10 Texas oilmen were shocked that Texas didn't show increasing production after the Texas RRC went to a 100% allowable in 1972.
But the bottom line is that we are using a fairly objective method that takes the two pieces data that we have the most confidence in, annual and cumulative production, to generate mathematical models. And many large producing regions--Texas; Lower 48; Total US; North Sea; Russia and most recently Mexico and the world--have shown production patterns that are consistent with the HL models.
The most common response I get to all of this is simply denial. The reserve situation "can't be that bad."
All I can tell you is what the mathematical models are telling me. In a nutshell, I think that the reserve situation is that bad, and I think that we are facing the near certainty of rapidly declining net export capacity worldwide.
While reasonable people can disagree on what the annual and monthly production data are telling us about our proximity to Peak Oil, in my opinion it is a virtual certainty that Peak Oil, from the point of view of importers, is here. This virtual certainty is due to the absolutely lethal combination of flat to declining crude oil production in exporting countries and the (sometimes rapidly) rising domestic consumption in exporting countries, resulting in sometimes catastrophic declines in oil exports. For example, based on EIA data, net total liquids exports by the UK dropped at an annual rate of 60% per year from 2000 to 2005.
In effect, in my opinion the very lifeblood of the world industrial economy is draining away in front of our very eyes. The only question is how fast the patient is bleeding to death.
Sorry to be the bearer of bad news, but you wuz warned.
Jeffrey Brown is an independent petroleum geologist in the Dallas, Texas area. His e-mail address is westexas@aol.com.“For a successful technology, reality must take precedence over public relations, for Nature cannot be fooled.”
—Richard Feynman
Contact
- Content: editors at theoildrum dot com
- Tech support: support at theoildrum dot com
License

This work is licensed under a Creative Commons Attribution-Share Alike 3.0 United States License.
Nice work. I know I could probably go find it elsewhere, but I'd like to see the world C+C HL and annual prodcution charts in the grand finale
I believe that this is Ace's work:
http://i129.photobucket.com/albums/p237/1ace11/WorldCC2100.jpg
Note that, IMO, exported crude oil will decline much, much faster.
There is also an interactive modeling tool which can be downloaded from this site.
This tool graphically displays the changes you make the input parameters (total reserves, production rate, depletion rate, etc).
You can also create linearization charts from the current production graph and interactively slide the linearization data selection set along the data points to view how moving the data set effects the total calculated reserves quantity.
Hi Engineer,
Here is the latest update!
Updated World Crude Oil & Lease Condensate (C&C) Production Rate Forecast to 2100
The chart below is an updated forecast of C&C production rates. Actual production rates are used up to 2006. A bottom up forecast based on more than 300 projects/regions is used for the years 2007 to 2012.
The dark red line represents an estimate of true remaining reserves which is adjusted for the grossly overstated OPEC reserves. The green line is based on BP’s recently released reserves figures which includes OPEC’s grossly overstated reserves. The forecast from 2013 to 2100, for both the dark red and green lines, is an exponential fit based on remaining recoverable reserves, similar to the HL method.
Click to enlarge - This chart will be updated when EIA Apr 2007 data are released, before mid July 2007.
Your showing a fairly high decline rate not sure I believe it.
You have us down the magic 4mbpd that make peak oil painfully obvious by 2010. Other people are showing it later.
We do have quite a bit of production coming online that should push this out 2012 or so ?
The decline looks to steep to me for the next few years.
I've refusing to consider this decline rate coupled with exportland.
I also don't want to believe that decline rate. There is a lot of production coming on, but it's not enough. Recently, Aramco is only scheduling one more expansion of Shaybah so that Shaybah will reach plateau production of 0.75 MB/D instead of 1 MB/D. Aramco's Al Khafji project of 0.30 MB/D, in the Neutral Zone, is no longer on their project schedule. Aramco only has 0.5 MB/D from AFK coming on line late this year, 0.1 MB/D from Nuayyim late 2008 and 0.25 MB/D from Shaybah expansion also late 2008. It's just not enough new production to offset declines.
Many of Russia's projects have been delayed to come on line late next year. (It's tough to do work in the long cold Russian winter). Mexico/North Sea are showing very high decline rates.
People like Robelius show an optimistic peak oil date later in 2018 but this assumes that Ghawar has 150 Gb URR. Robelius does show worst case peak oil, including NGLs happening in 2008. Also note that the C&C excludes other liquids such as NGLs (8 MB/D) and ethanol/XTL. Bakhtiari/Deffeyes/Skrebowski/Campbell/Simmons/Savinar/Heinberg probably wouldn't disagree with the decline rate.
Here is the chart that the 2007-2012 bottom up forecast was based.
click to enlarge
If you believe that OPEC's reserves are overestimated by at least 400 billion barrels, the world's total URR is about 1,840 billion barrels and that the world has produced just over 1,000 billion barrels C&C to the end of 2006, then the world has produced over 54% of its total URR of C&C. This means that C&C will decline.
Are you taking into account the Canadian tar sands (already included in the EIA C+C data)?
The production is set to increase by 0.5 mbpd in 2007, check this post:
http://www.theoildrum.com/story/2006/10/20/142436/03
Hi Khebab,
Yes, I have taken into account Canadian tar sands, but I think that most forecasts are too optimistic.
Last year, I was optimistic about tar sands production but then I read your comprehensive story a few months ago when I was checking my forecast for tar sands. I also listened to David Hughes http://globalpublicmedia.com//interviews/823 who thought that tar sands production was limited to 2.5 mbd. The Hughes interview was done in 2006, prior to the possible cancellation of the MacKenzie Valley pipeline. His tar sands limit of 2.5 mbd may need to be revised downwards.
The Canadian Association of Petroleum Producers (CAPP) just released their June 2007 forecast http://www.capp.ca/raw.asp?x=1&e=PDF&dt=NTV&dn=123361
Table 7.2, page 32 of CAPP’s forecast (moderate growth case) shows the following tar sands production numbers, mbd (actuals to 2006)
2004, 0.99
2005, 0.99
2006, 1.13
2007, 1.28
2008, 1.49
2009, 1.69
2010, 1.84
2011, 2.03
2012, 2.27
My annual average tar sands forecast numbers, included in the charts above, are lower.
2007, 1.27
2008, 1.36
2009, 1.45
2010, 1.55
2011, 1.65
2012, 1.70
These numbers show an annual growth rate of 7% until 2012, when a ceiling of 1.70 mbd is assumed, which is similar to your logistic curve and the CAPP 2005 (constrained case) from your chart below.
I cannot justify using a higher growth rate than 7%/yr for tar sands production because tar sands uses huge amounts of natural gas, water, infrastructure and produces lots of carbon dioxide/other pollutants. Environmental constraints may also become stronger. Woodland Cree First Nation is challenging Shells Oil Sands expansion from 12,500 bopd to 100,000 bopd.
http://www.marketwire.com/2.0/release.do?id=745361
Tar sands could also be starting to produce acid rain which is derived from sulphur and nitrogen oxides.
http://pubs.acs.org/subscribe/journals/esthag-w/2006/aug/science/jp_acid...
It also appears that a huge source of natural gas is at risk, the $US16b MacKenzie Valley pipeline. However, the Canadian taxpayers might subsidise this pipeline so that tar sands oil can be exported to the US.
http://blog.foreignpolicy.com/node/5110
The $US25b Alaska natural gas pipeline may also be at risk.
http://www.canada.com/nationalpost/financialpost/story.html?id=397fb965-...
Delays in either or both of these pipelines could force gas prices up considerably, making tar sands oil more expensive to produce which could adversely impact the economic viability of new projects.
Even with increasing tar sands production, according to EIA production data, Canada’s total C&C production decreased slightly from the last quarter of 2006, 2.643 mbd to the first quarter of 2007 at 2.636 mbd. This probably means that Canada’s conventional C&C production is declining at 7%/yr to offset the tar sands increase of 7%/yr.
Memmel,
Ace has spent huge amounts of time in the existing data, something I have never seen you do. If this is Ace's forecast, then I believe that, based upon his assumptions, this is a valid forecast. He always includes all the mega-projects known to be coming online in the future. But generally he has posted the "near term" graphs that focus on now to about 2012. Rarely has he posted this larger graph.
Also, Ace is very close to Bakhtiari, who predicts 55 mbd by 2020. Ace's prediction shows just under 50 mbd by 2020 or 55 mbd by 2020 if you believe OPEC's reserve numbers.
You've talked the talk but the scenario in front of us is worse than most on this website are willing to admit, Far, far worse. Take your economic collapse scenario and expand it and speed it up at the same time. Then you might be closer to the truth. Data like Ace's is why we need to move, as an entire civilization, right now, on this issue. We're almost out of time. And this is the killer of techno-BBs such as those hoped for by some here. If the global economy collapses too fast you are not going to have solar PV producers still producing, nor high tech wind, nor anything else. Add in the global shortfall in grain production for 7 of the last 8 years and we're closing in on several nasty problems at the same time. People who can't eat cannot even be conscripted into slave labor.
Ghawar Is Dying
The greatest shortcoming of the human race is our inability to understand the exponential function. - Dr. Albert Bartlett
I've come close to doing some modeling on my own but I have nothing to add of any value over whats been presented. So I'm not sure where or how I could contribute modeling. I've got lots of ideas I'd like to model but it would be a full time job and in general requires data we don't have. The crux of the problem is to do anything beyond whats been done on the modeling front requires data thats not in our possession.
Take my irrational markets and shortages model all you get is almost immediate system collapse so I'm not sure what to model. My other keen area of interest bunker fuel has most of the data behind a paywall and given the data the model looks complex to me. I've looked for free databases of historical price records and even emailed bunkerworld but no reponse.
The model he presented was the most aggressive I've seen so
maybe I was a bit rude in asking but yes I wanted to understand why/how he got it. I'm sorry if it came off rude.
My ant antenna's went up and got burned off by the implications of the graph.
Now with that said we are completely dependent on total liquids and the EROI of these total liquids to keep this house of cards from collapsing early. Outside of NGL's the EROI of the rest is suspect and NGL's probably are offset by the declining quality of the crude. So even if you throw in all liquids your back to Aces curve. BTW this is why I'm not all that interested in all liquids from a EROI perspective with the decreasing quality of crude thrown in they are pretty much neutral or 1:1 on EROI and can be discounted at best say 3:1 and thats probably pushing it.
Given the way I handle none C&C sources Ace's graph caused me to sh%@t my pants which can have the effect of causing a posting to be a bit rude if done before the trip to the bathroom.
Sorry.
I didn't see it as rude at all! More like complete shock. :)
But this is the problem that Ace, WT, Khebab and others keep talking about - decline looks horrid and while the economy can muddle through a few years of tightening its belt, you cannot tighten your belt forever.
By the way, if you've been reading Ace's plots ever since he started, you would see the all liquids peak creeping forward from early 2009 now into 2008. It's moving towards us and we are moving towards it. If it happens in 2008, things could get ugly fast. Also, Ace is predicting noticeable shortages somewhere in the world as early as this fall which probably will create price spikes. So if we get the $80 or $85 per barrel oil in the fall, don't be lulled into thinking the worst is over if it falls again. Volatility is the buzzword of a resource constricted market.
Ghawar Is Dying
The greatest shortcoming of the human race is our inability to understand the exponential function. - Dr. Albert Bartlett
Yes I figured out that this latest plot has shortages starting this fall not just tight prices. We can only hope that KSA is holding back a little bit at least and will up production once oil crosses 100 a barrel. Also we effectively have a economic crisis scheduled for the late fall early winter. With Aces work this event becomes almost 100% certain. This should cause demand too back off some. So the first shock wave esp if KSA has any excess capacity will give us a small Indian summer.
So regardless of when the first shock from peak oil hits I see a bit of a breather before the next one. I'm guessing it will take three shocks before things start to crumble.
So using Aces work we have a shock sometime this fall.
If we have a hard winter a shock then if not we squeeze by.
This puts a much large shock next summer as we don't have a summer driving season but widespread shortages or very high prices. The fall of 2008 should be another breather period.
2009 is toast.
Now if Ace is too aggressive we get a weaker signal this fall
which is a unexpected price run up when prices should be falling I think a lot of people consider this very likely.
Late summer of 2008 would be shortages etc.
So Aces work moves everything up by 6-8 months. And if we sneak by without a hurricane this year I doubt we make it next year and certainly not for the three year initial crisis period 2007-2008-2009. We are going to have one sometime and in general the chances of a major above ground event making a bad situation horrible is close to 100%.
To some extent a strong hurricane this year causing major problems would be a good thing since it would give use a overly strong initial shock.
Personally the basic problem I have is the recent insanity of the housing market still has not blown off and its really hard to make a prudent buying decision in most markets.
And since you can figure even if prices reverted to the mean quickly the value of property will be very low for a looong time so your only buying it for a personal garden but your locked in forever in effect since you effectively cannot sell.
But waiting till land/houses is dirt cheap is pretty dangerous because it may be difficult to execute a move at that time and of course any fiat money based savings could get wiped out in the interim.
So I need to see a serious crash in prices in the RE market but things still stable enough and the currencies not trashed so I can make a move. Its going to be very very tight. I have a plan B but Ace is mucking up my A plan.
There it is.
There's the answer to the "They've predicted the end of oil 'X' times in the past and they were always wrong" talking point.
Just playing devil's advocate, but won't the cornucopians and deniers immediately come back to westexas' point with another talking point along the lines of:
"Well, there's plenty of oil out there, we just haven't discovered or developed those fields yet!"
First, thanks for pushing back. I think it's healthy and good for the discussion. It might even be helpful to put together a "Cornicopian rebuttal FAQ" -- with an emphasis on Factual data to rebut these kinds of "Faith-Based talking points.
For the "plenty of oil argument" I can think of a handful of replies for different occasions: (Some are just for fun)
1) Serious / Factual:
2) Serious / Business:
(*I need a technical reference for that, I believe I read it in a Roscoe Bartlett special orders speech, but the FAQ would need to have bulletproof, referenced facts.)
3) Flippant / disdainful / Political
4) Flippant / disdainful
5) Disdainful / Serious
6) Disdainful / joking
7) Disdainful / Jim Kunstler
(Edited for spelling. Too much coffee)
There are unbelievably large amounts of fossil fuels in the world ... peak oil is about flows of oil ... we can't get it to flow out of the ground at the rates required to meet our exponential expectations of increase in demand.
IMO anybody that responds to peak oil by talking about the amount of oil in the world, either undiscovered or discovered, doesn't understand the problem.
Xeroid.
Good point. My response to that is "Reserves are not the issue. The issue is how fast you can get it out of the ground. There is an unstated assumption that if oil is "there" that there is no difficulty in getting out of the ground, processed at the well head for water and other impurities, transported halfway round the world, then refined and delivered to you. There are a lot of difficulties, lately with refining, but mostly in getting it out of the ground. We can discuss those difficulties if you want."
At this point the eyes have normally glazed over and they think I am a nutter (probably I am) and they walk away. Most people just do not care. Even educated, aware people, do not care. They do not have the entire matrix of information required to understand the information in their heads. Most people are not aware, they are more concerned with the personal habits of Brad Pitt and Paris Hilton, or football. These are the folks who also whine about "gougers" and being ripped off etc.
Humanity will trip over the edge wondering what dress x or y actress is wearing to the Oscars. Nobody cares.
Your comment reminds me of an excellent movie... starring Brad Pitt! Fight Club is described by a fan like this:
"the story is nothing short of incredible, a pure shock-value social commentary on the state of the world at the end of the century"
Discovery rates are a good approach.
8) We can use past discovery to predict how much is left. As discovery each year drops, it points to a maximum:
In "Beyond Oil" Deffeyes models "hits" on new oil fields. His model projects that we have found 94% of all oil and that roughly 100 bbl remain unlocated (this was in 2005). (which is why a "big" field like 7 billion barrels is news and we don't find any 70 billion barrel fields).
9) We can play a "what if" game. What if there were 4 trillion barrels. Then we would expect to be finding X bbls of oil per year in new fields now. We are not.
Colin Campbell co-authored an analysis (which I cannot find right off hand) where he showed how much discovery we would have to be having to find the extra 1 trillion and 2 trillion barrels of oil predicted by the USGS. As you can imagine, to find another 2 trillion, we would need a second discovery peak as huge as the one in the 1960's. And to find another 1 trillion, the peak would have to be half the size. Nothing like that is happening.
10) Serious/Business
If there is so much more oil to discover, why are the oil companies trying to get into tiny slivers of protected Federal Land? Why not just drill the vast world wide reserves? (because the protected areas are the only undrilled areas remaining).
11) Serious/Business
If there is so much more oil to discover, why are the oil companies developing fields in countries that are undergoing civil war (Nigeria) instead of developing the 2 trillion barrels of oil elsewhere.
The next cornicopian response will be that we will just squeeze more oil from the current fields.
12) Serious/Business
If we could get more oil from the current fields with advancing technology, then why is the US lower 48 in decline? Why is the most technologically advanced country int he world, home the the most sophisticated oil companies, unable to halt the decline in oil production?
(Here we could use a few more items that explain how oil becomes locked in the rock once the water or gas flood replaces a percentage of the oil. And some references on how water and gas flooding have been used extensively since the 60's. "Twilight in the Desert" is one source.)
The next step is dealing with low EROI alternates. And then other energy sources substituting for oil.
Jon Freise
Analyze Not Fantasize -D. Meadows
Hi Joe,
Thanks for the detailed reply, you certainly came up with a wide array of counters to the common talking points out there.
I feel like the (Western) world has lived through some great years and now we are entering a period of consequences.
Personally I am very frustrated that people at all points of the political spectrum are so completely in love with their cheap oil lifestyles to formulate a constructive response to the end of cheap, easy oil.
The problem is that production curves look very similar to discovery curves and the global discovery curve peaked back around 1964, I believe. It may be a year off either way but it was roughly then. The discovery curve since then looks like a descending meteorite, absolutely plummeting downward.
So we are left with one of the following options:
1. All the geologists in the world are in cahoots to hold back oil to drive up the price. OR
2. All the geologists in the world are incompetent and can't find what their granddaddy could clearly find. OR
3. There's not much oil left for today's geologists to find.
My response to geologists who insist there is more oil is to directly ask them - where? I ask them if they have looked at the discovery curve over the last 100 years and almost always they say no. Like most employees in most businesses they are concerned about today and tomorrow and don't have much time for yesterday. Yet in the data from yesterday are important clues about today and tomorrow.
So while you are playing devil's advocate, please explain the discovery curve:
Ghawar Is Dying
The greatest shortcoming of the human race is our inability to understand the exponential function. - Dr. Albert Bartlett
Hi Greyzone, this is not about oil, but my own lack of HTML skills. How do you embed an image in TOD. I have tried, but not yet managed this.
Eyeballing that particular discovery curve it would give a URR probably around 2000 bbls. I suppose that the geologists would explain away the clear decline by saying that the actual URR is 3500 bbls (such as what USGS predicts). But then we should ask, where is the discovery curve that supports the higher value?
Well here is one from Shell Oil:
(for SAILDOG, note how to imbed a pic
<img src="http://www.peakoil.nl/wp-content/uploads/2006/09/po-shell6.jpg" /> )
Well, this discovery curve shows approximately 3500 bbls, which is 75% higher than the other discovery curve. It would be interesting to do a year-by-year analysis of this curve against the one you posted to see how the discovery values are boosted. Shell either puts in reserve growth or place fairly aggressive predictions on the discovery values (possible instead of provable or probable?)
Or better reserves are known to be 3500 bbls so the discovery curve must match. A bit simpler explanation without a in depth analysis. The prediction discovery is asymmetric. However if you assume that Antarctica can and will be fully exploited you probably do have 3500 barrels. Does anyone know if some people are excluding Antarctica and some are including it. You would have to think their has to be some pretty big oil fields in Antarctica.
Funny the USGS included it with Africa.
http://www.usgs.gov/newsroom/article.asp?ID=636
And they have a lower figure.
I'd have to guess that estimates for the Arctic and Antarctic would be the wild card ?
Antarctica is protected by international treaty. Whether any geologists include it or not is anyones' guess. However that continent was in a tropical spot during the Carboniferous period. If anything, it'll have coal, though pretty inaccessible. Wouldn't add that into the coal reserves. As far as oil, one could try the obvious and use Google.
If oil is there, the treaty becomes an above-ground sticking point and drilling becomes a pain as ice under great pressure flows and will cause the drilling pipe to get stuck. READ: heated piping. The EROEI might not be worth it even for a large field. The treaty does not allow for divvying up the Antarctic into "colonies" though military and research bases are allowed. And of course, a spill would make quite a mess. A similar treaty protects the moon from national ownership.
I wonder if any seismic exploration has occured on the sly and kept secret regardless of the results. A scientific base looking for fault lines doing the exploring on the sly seismically could find possible formations. Fun conspiracy theory: Suppose the USA bases did find a Ghawar size field. We'd keep it quiet until we break the treaty and being the only superpower (while fuel lasts!) go in uncontested. The Antarctic is really the last unexplored (as far as we know) oil patch. But since it's covered in ice, all bets are off.
Petrol prices high enough yet? Just wait!
AKAIK, nothing has been discovered at the poles yet, so how can it appear on the chart if these have to be probable or provable?
Thats what made me wonder if its a case of we don't know whats been discovered at the poles.
You would have to guess that both regions still have some large reserves discovered or undiscovered or as I'm wondering discovered but generally unreported. Considering extraction costs political issues etc etc and more important the fact that we are a long way from even attempting to exploit these fields I don't think they are important to oil use with our current economy. But you have to figure their must be significant reserves somewhere in the arctic regions that have not been officially acknowledged.
I don't see why a nuclear sub could not be used to do a bit of prospecting.
http://www.cnn.com/TECH/science/9807/01/arctic.yoto/
Its not a large stretch to go from this to actually do a bit of oil exploration.
And this
http://www.sciencedaily.com/releases/1998/01/980129074316.htm
But not a single hit from google for seismic studies with a nuclear submarine. I can't think I'm the first person to think about doing this.
Perhaps the difference is (at least partly) explained by a difference in what is being measured on the left axis of the two graphs. One is barrels (bbl) and the other is barrels of oil equivalent (boe).
Good call, I will update with that information.
It's a reasonably safe bet that the GCA (Guneshli-Chirag-Azeri) complex in Azerbaijan will exceed 1MMb/d next year, and probably for a few years thereafter. All the major facilities are now installed, and the final platform (on Deepwater Guneshli) will come onstream, using pre-drill wells, within a few months. GCA produces into one export pipeline, but you could argue that it is three different fields. Then again, look how finely Ghawar gets sliced on this very website, sometimes.
PDF Alert - GOTO page 3. Hey, Khebab - linearize this...
http://www.bp.com/liveassets/bp_internet/globalbp/STAGING/global_assets/...
Not that this will do anything noticeable to overall global decline; just making the observation. I certainly don't see a million coming from anywhere else, anytime soon - maybe never.
Post hoc ergo propter hoc
Or, just because "B" follows "A," it doesn't mean that "B" is related to "A."
Having said that. . .
Building on Hubbert/Deffeyes work (now known as HL) and on Matt Simmons' work on increasing consumption in oil exporting countries (and Khebab’s excellent technical work), last year I warned of three upcoming events: (1) A decline in Saudi crude oil production (based on comparisons to Texas); (2) A decline in net exports worldwide and (3) A decline in Russian crude oil production.
As I said up the way, it may be a coincidence (i.e., the Saudi decline may have been voluntary), but we have evidence of support for Events #1 and #2. The remaining question is Russia, where the EIA has been showing basically flat production since October, 2006.
The key point to remember about Russia is that is is a very old producing province, about 20 years past its peak production level and as Russia has gotten closer to "catching up" to the HL model prediction for post-1984 cumulative production, its rate of increase in production has been slowing--and for the six months its rate of increase has basically been zero, based on EIA data.
Very recently, we have seen some remarkable comments coming out of Russia, from suggestions that Russia may “choose” not to increase its oil production to calls from the newspaper Pravda to “Step up its efforts for alternative energy solutions.”
Link to Pravda Editorial: Russia to reform national economy to get rid of oil dependence http://english.pravda.ru/russia/economics/93835-0/
Nina Krushchev (apparently no fan of Putin), granddaughter of Nikita Kruschev, had an interesting declarative statement in a recent column in the Guardian:
In any case, because of the HL based analysis, last year I also strongly recommended the ELP Program: http://graphoilogy.blogspot.com/2007/04/elp-plan-economize-localize-prod...
A question I have asked in regard to my ELP recommendations is the following: Does anyone now wish that they had bought, on January 1, 2006, a $50,000 SUV and a $500,000 suburban McMansion, all with 100% financing?
A question that you need to ask yourself is the following: Given all of the above, what are the chances that events are going to continue to unfold as the HL based models suggest they will?
Almost certainly yes, as envy is an extremely strong social force. But they're probably not reading anything around here...
I had a nice talk with the Russian oil analyst at Aton Securities earlier this year. He had a good story:
The export taxes on oil are very high in Russia, and domestic prices are relatively low, so the oil producers' "netback" on their production isn't very high. In effect, either the Russian people (via low prices) or the government (via high taxes) benefits from the oil. This worked for a while because the workover methods they were using on old fields to up their output were cheap and easy, and thus production costs were low. However, that bonanza has been about tapped out, and the next cycle of development has high capital costs. At today's low netbacks for Russian crude, these high capital costs are not justifiable, so Russian crude producers (Lukoil, Surgut, Rosneft, etc.) are not expected to undergo large capex programs, and crude production is likely to decline accordingly.
This could be remedied by raising local prices and lowering export taxes, and it is likely that some step towards that direction will eventually be taken. However, the Russian government is well aware of the resource situation, and they may deem it attractive to limit the pace of development, so that a greater resource base is available in the out-decades.
Good work WT. I think most of us here agree with your ELP plan even if we dont vocalize it as much. The problem is convincing the 99% outside the peak circle who refuse to believe the truth.
Based on your assessment of russian production how much do you expect exports to decline year on year from 2007 to 2008?
Khebab and I are working (that is Khebab is doing the hard work) on projections for future production and exports by at least the top five net exporters (that accounted for half of world net exports in 2006). The HL based projections will not be a pretty picture.
In any case, for the top five, if you assume a 5% decline in production (the top four showed about a 4.4% decline from 2005 to 2006), and a 5% rate of increase in consumption (which is below their 2005 to 2006 increase), net exports by the top five would initially decline at about 10% per year. Note that in later years, the decline rate, based on the Export Land Model, tends to increase. Based on the 5%/5% assumptions, net exports by the top five would be at about zero in 14 years.
Can their exports (in a practical sense not theoretical) ever go to zero? I mean the reason that their economy is booming is because of huge export revenues right? wouldnt a point where exports are so compromised that any amount of price increase does not negate the loss of export revenue start to compromise their GDP's and hence their domestic usage?
Your thoughts?
I have postulated two phases in Export Land.
In Phase One, revenue from export sales continues to increase, even as exports decline, because of higher oil prices.
In Phase Two, revenue from export sales declines, even as oil prices increase, because higher oil prices can't offset lower export volumes.
The problem arises when exporting countries try to limit local demand, so that oil and petroleum products can be exported, e.g., look at what is going on in Nigeria.
As a practical matter, there won't be a big difference (between restrained domestic consumption and no controls on domestic consumption) in exported volumes once an exporter's exports fall by 75% or so.
It's kind of analogous to the HL method. As we get more data, the plot asymptotically approaches the horizontal line (P = zero), without ever quite getting there in most areas. But the production rate is so low that P is effectively zero.
Gotta run for now. Be back later. I have to go do my part to flatten the Lower 48 HL curve, by picking some drillsite locations.
I've pretty much got my economic model done for considering the economic effect of HL/Export Land. I still don't see how to plugin numbers to get estimates.
First and foremost we assume the market is in denial well past when its obvious we have peaked this means the market will be ineffective in pricing oil to include the risk of export land.
It will only react to export land conditions.
This condition of a broken market implies that it will incorrectly allocate resources which of course means shortages will develop so assuming the market is misguided naturally results in shortages from mis allocation of resources. This is a common theme when a resource is over exploited if its renewable or simple exploitation of a non-renewable resource where the expectation is supply is far larger than reality. Humans are by nature bullish so our markets always fall into boom bust cycles its practically intrinsic.
Thats the economic side of the equation. So the primary effect is shortages this leads to the second half and why peak oil is so ugly. What happens when the supply of a resource becomes strained is events that where previously uncorrelated because ample supply acted is a sort of buffer become correlated. In the markets this is known as systematic risk. Even without outright shortages the whole system becomes more and more susceptible to systematic risk as supply and demand drain reserves until outright shortages develop.
The systematic risk or correlation is not obvious but you can see that a shortage in one part of the world prompting panic buying can lead to a shortage somewhere else and another run of panic buying. The how of the correlation or chain of events that cause seemingly unrelated events to actually be correlated is complex.
A simple picture is a spray of hot coals landing on a sheet of paper each burns a hole and if the paper is big enough and the size of the coals small enough and better you can get a fresh sheet the events remain uncorrelated. But in the case of coals landing on paper if two land close together by chance then you can get exponential growth in the burning region they share a common variable in this case proximity.
So for the sheet of paper to go from having small holes burned in it to bursting into flames and completely disintegration we actually have a good idea of the variables that cause correlation its the size of the coals the rate the coals are falling on the sheet and how often two different coals land close enough to share the flame front.
In the case of oil these variables are not as easy to determine but its easy to create any number of correlated positive feedback loops when supply is short to show that shortages and low supplies result in correlation between previously independent events.
Its easy to see from the paper example how a lot of small events can suddenly turn into a big event as the correlation causes coalescence with bigger and nastier feedback loops.
And you can see how hard it is to actually see this coming since its effectively random which the exact chain of events
actually causes the paper to burst into flames.
Back to the model you can however watch for more and more correlation and although its impossible to time you know that past a certain threshold which from other models I set at about a 5% difference between supply and potential demand the chance for a coalescence of correlated events becomes almost 100%. Next of course this model has everything falling apart so fast you really don't have time for the market to respond and try and restabilize the situation.
Forget about trying to find alternatives as punishing shortages cause the economy to grind to a halt.
A major hurricane in the gulf or and attack on Iran will be enough to send our world economy to the bottom. But even if this does not happen the aggregate of correlated small events will eventually result in cascading failure.
The timescale is easy since WT's models shows exports dropping by about 50% within 5 years this economic model of correlated shortages with exponential feedback everywhere has to execute in less than two years once it goes critical.
The minimum is based on simple timescales for the moving of oil and the fact that reserves will not all be at zero in the beginning this gives a lower bound of about 8 months from the beginning of cascading failure until the system cannot recover. I think barring a large event this is to low and its weighted to the high end.
Next of course when does this model start I gave 5% split between potential demand and supply but this is hard to gauge. Going to Exportland agian we can see that two years into Exportland we are well within this 5% region regardless of how demand has adjusted to supply. So two years past when export land begins in earnest is about the most your going to get and then your less then two year before meltdown.
Taking a conservative approach and assuming ExportLand started this year we end right where my predictions keep ending which is we are toast by 2010. So the end of the oil age can be predicted comfortably to be 2010 to 2011 at the latest. So enjoy the next 2 1/2 years.
Wow. Really important post, memmel, thank you. I guess so as not to engage in ego-stroking I should offer some quibble,so...when you say"this model has everything falling apart so fast you really don't have time for the market to respond and try and restabilize the situation." have you given weight to SPR, Plunge-Protection Team, trading suspensions, circuit-breakers,etc? Gov't does have some options in arresting a slide, I mean if, for example the military were to suspend fuel purchases temporarily that would release an enormous amount of pressure on demand. Even a voluntary odd/even rationing system would relieve some demand pressure and buy us SOME time. Not that we would use it to fashion a coherent societal response, but I don't see gov't and Wall St as being impotent, either.
odd even wont do shit.
people will just buy twice as much.
it's simple.
anyways, the best way would be to tax the shit out of gasoline right now. tax it under "global warming prevention", don't let the people know it's because the oil is running down, increase taxes every year (note that increasing taxes have an exponential effect on demand and size of a market) so you can actually get away with lower tax increases year on year and look like you are doing something.
in the mid term (10-15 years) the tax will shift everyone away from gasoline powered vehicles. In the long term it will hopefully prevent ACC (anthrpomorphic(sp) climate change) by moving humans to renewable means.
simply put people, this is it, we either make it or break it through this chokepoint. How things are going it is unlikely humans will get off the planet, so we are screwed, more screwed than ever before. Simply because we have wasted our natural endowment of resources.
Now humanity will never go to other planets, and will likely die in a gamma ray strike, a meteor, GW, or an iceage.
Physical limits cannot be surpassed by physical creatures.
"Physical limits cannot be surpassed by physical creatures."
You hit it, that's the problem right there.
Don't you know Gilgamesh, we aren't physical creatures? No, no, we are much much more special than that. We are so special, nothing, in the end, can bring us down. Ah the provincial nature of humanity, gotta love it...
to fully address what you have written
the SPR will be gone before last imported barrel from OPEC.
The military will not have fuel either
Even if the fuel is suspended(Ignoring the overnight destruction of the economy), petrol will still have a use. The real market has always existed in some form throughout the ages. Bartering goods for goods, services for goods, money is just the abstraction layer.
What this means is that if there is a demand, the market will try and satisfy that demand regardless of what the gov does. i make no guesses at which price this demand may be, but it will be there.
Actually I agree but it won't be used by soccer moms in SUV's to pick up the kids at school.
To expand on the first response. In general and maybe the Russia is a good example the status quo will be protected until it can't. When it can't the situation will change. So the powers that be esp in the US will vigorously protect the status quo as long as they can until they can't.
Considering the current state of our fiat currencies or better faith based currencies we don't have a lot of room left to protect the status quo. And the big problem all the powers that be face is simple loss of faith in authority once this happens you either get a new set of masters that at least make promises that thing will be better or the current ones usurp more and more power and effectively crush any outward effects of this loss of faith.
The key is context and to directly answer this post. Sure we use gasoline but it won't be for a soccer mom to pick up the kids at school in a big SUV.
The solution is brutal and obvious the biggest problem as export land progresses is the overconsumption by the middle classes of all countries. I've stated before that usage numbers for the poor countries are heavily distorted since most of the gasoline is used by people that have purchasing power on parity with people in the wealthiest nations. So the top 10% of the population of a poor country use 90% of the resources effectively mirroring the usage patterns in the US. The statistical averaging of the large population of very poor people with the smaller "western" population distorts the real situation.
So to focus the problem is this class of people world wide that are basically equivalent in their purchasing power the only way out is for this whole class to develop a way to start shedding a big percentage of competitors annually.
This has to happen since demand cannot exceed supply its a natural force and no monetary games can fix this so at best these games can buy the richest time to reposition to take advantage of the changing climate but as far any sort of real effect I doubt it.
A lot of people on the board live at least a middle class lifestyle walk out and look around you at least 50% of the people you see in your neighborhood will probably be begging for food to eat within the next ten years. It may even be you. Nothing can stop this from happening since the natural move is to follow the same usage patterns as the third world with the top 10% using 90% of the resources. Thus the only solution is for most of the middle class to cease to exist as a group. Not to his has the side effect of dramatically dropping the need for a wide range of resources outside of food which can't drop all that much so the only sticky commodities are food and water. Shelter might be a issue or more importantly shelter that allows access to jobs.
Think about it during the depression exactly this happened people that stumbled or simply had bad luck plunged into deep poverty while for those that managed to continue employment it was not a bad time.
So you see the core problem is we have a group of people that have fairly equivalent purchasing power world wide that do not support changing their lifestyle one bit. This group will simply engage in a Mexican standoff until one party blinks or fails. This scenario simply repeats. Nothing can stop this. Initially it will generally take out those that have made the worst financial decisions and cannot actually afford the lifestyles the live. This will in turn cause others to fail effectively randomly as consumption drops and
various companies downsize. So the second wave can easily take out a lot of people that are conservative esp those close to retirement. Wave three gets tough because your down to those who can hold out the longest. Actually at this point consumption might be down enough that a sort of Indian summer is possible before we continue the relentless march downward.
To sum it up we practically have to have and event that removes at least 1% of demand in the next year or so nothing can stop it. And all I'm outlining is a common depression scenario nothing special. The underlying cause is interesting assuming our recent financial games don't take us down before peak oil gets going in earnest.
Don't forget their are a lot of events coming together competing to be the one that takes out. Peak oil may well have to wait its turn.
Financial is the top contender.
GW is the 800 pound Gorilla and we don't know for sure when it will cause serious problems.
Water/Food/Fisheries are all right on the brink.
War is increasingly a issue.
So their is a really good chance we won't make it to a peak oil caused meltdown its a tight race. But Peak Oil puts a fairly absolute bounds on how long we can continue business as usual and its certainly less then ten years and if the models are right less than 5. I think we have until late this fall before we can easily see that things are obviously not normal.
Now if the damned housing bubble would just crash faster so at least we have and option of sane prices for a place you can grow a decent garden.
I am not sure that I go with the melt down theory. Much depends on how the markets react; and how governments react.
Peak Oil can be defined as a growing gap between the amount of oil supplied at a given price and the amount demanded at that price. Within that definition Peak Oil already exists for all those people who cannot afford oil (products) above (say) $35. Many poorer countries, Senegal, Guinea and Zimbabwe among them import much less oil than they used to. For these folks the age of oil is already over.
This process will continue and Westerners will buy smaller cars and drive less for some while, even as supply commences to decline. Even though production has been flat, the silence is deafening from TPTB and the MSM. Maybe the world will come to accept this situation. It has already lived with it for nearly 3 years. Maybe declining supplies and higher prices will be accomodated by the markets. Conservation can go a very long way. Not everybody "needs" to have lunch in Venice if they live in London. There is a lot that can be done.
Some countries (notably the US and Australia) will struggle because they have poor public transport. Europe will be better off in some respects. etc etc.
The catastrophic scenario might not happen. I hope it doesn't.
First a lot of the demand destruction in the poorer countries is probably a myth since the oil usage distribution is the same as at the world level with the top 10% of the population using 90% of the oil in these countries. These people have purchasing power on par with the wealthier nations. Once you exclude them the physical amount of oil products used by the poorest is very small so even if they are demand destructed your not going to "reclaim" a lot of oil to use for SUV's. Squeezing the third world for oil will thus not work for long.
Collapse is based on a market that is not pricing the situation correctly and shortages. This is a bubble type market but in this case the bubble is caused by the market optimistically creating a low price for a commodity until its physically in short supply. Considering the status of the US's gasoline supply I'd say we can see this happening now.
All bubble markets eventually collapse in the case of oil since its a underpricing problem the collapse means huge spikes in prices and shortages.
The shortages which I've mentioned several times are the killer not price. The example is a 1969 VW beetle without gasoline is worth just as much as a 2007 Mercedes SLwhatever. They are just big hunks of steel. Shortages remove the purchasing power option from everyone.
Thus in the shortage scenario instead of everyone reducing consumption by 1% you simply go a week with no gasoline.
This balances supply and demand. Reactive pricing at a much higher price point then before the shortage helps keep some demand destroyed but its not a primary agent.
As long as we have purchasing parity and a delusional market
the only outcome I can see to balance supply and demand is physical shortages. And these wreak havoc on a economy. Unless prices increase substantially and people also have a viable path to reducing their oil usage significantly we will have shortages.
As far as to why the market is in denial the basic reason is if your customer prints the money that he pays you with you have a problem. The current situation is a symptom of a world awash in petrodollars and borrowing forward like mad to keep running. I think worldwide it would take 100 years to pay off the debt thats on the books right now. I'd have to guess the economy will falter when we are 1000 years in debt. Obviously most of this debt will be defaulted. But you can see that commodity prices which don't live in a vacuum are heavily affected by the economic conditions. This borrowed money is also flowing in and out of markets including the commodities markets looking for yield. So at the moment the money flows control all the markets fundamentals have little effect.
G,
2 things:
1/ It's too late for a high US gasoline tax, you would drive too many people and businesses into bankruptcy.
2/ The military will have fuel long after everyone else runs out. The US army, for example, has its own private storage tank, under the Iraq desert.
bankruptcy sounds a fuck-load better than death.
i'll take a pound of wallop as a cure anyday over a meandering death from starvation.
the us military will fragment as soon as there is trouble. they (upper ranks) likely understand the significance of peak oil and the impossibility of maintaining any semblance of order or control over such a vast land area.
and how will the USarmy get the oil from Iraq to the USA where it is quelling riots?
Its all guesswork or pure speculation. I think its clear you probably don't want to be living in downtown LA. I'd stay away from large populations in deserts in particular and large cities in general and try to be near areas that grow significant quantities of food vs the population. And of course start practicing ELP. Other than that we really don't know how thing will turn out.
The US has a large coal supply and could build Nuclear power plants very fast with a crash program. And of course wind could be scaled out fairly quickly. So a lot of good things could happen. I know I'm calling a lot of coal fired plants good but if we had to build them to have enough energy to convert our economy it can be argued to be better then just falling apart. PV also.
The EU has similar options and is in better shape.
Outside of the near certainty of trouble in the biggest cities and potential food shortages esp in ones that are barely sustainable with oil anything else is pure speculation or envisioning a possibility.
We know we must change and we know that a few places are probably not a good place to be other than that we know nothing about how this is going to play out much past peak.
This uncertainty coupled with models to point to far worse conditions as possible makes ELP'ing a pretty good idea.
The UK just became a net importer. They still export some, but they import more. It must be something to do with grades needed by refineries.
I am not sure if this answers your question, but it amounts to the same thing. Instead of supplying themselvs and the world, the UK now is becoming dependent on other countries. The US of course went through this process (painfully) in the early 1970's.
While I more or less agree with everything you have been saying on Hubbert Linearization, I have had a problem for a long time with your export model. I agree that most big producing areas tend to underprice their oil for domestic consumption and it is obvious that such a policy means a continuous shift from exports to domestic consumption in those countries. But I disagree with your next leap that such a policy will mean less consumption for world importers than what the commonly used forecasts for imports are saying. Unless you disagree with the commonly used world consumption numbers of 2% per year, what does it matter if some countries consume more or less. By just using a certain number of countries, the big producing countries, you arrive only at a partial picture and you cannot then generalize from this picture.
You would make the same mistake, for example, if you just take the consumption changes of the G8 countries and then extrapolate this number to the level of changes in world consumption. In other words, what matters is still only world production and world consumption if we discuss Peak Oil.
In purely economic terms, there are producers and consumers, and political boundaries shouldn't matter. The oil should go to the highest bidders inclusive of the higher transportation costs to remote importers.
However, back in the real world, borders do matter. For example, look at what is happening in Nigeria, where they are trying to maximize exports, without meeting local demand.
Also, look at what happened from 2005 to 2006, for the top five net exporters (EIA, total liquids):
Production: -1.3%
Consumption: +5.5%
Net Exports: -3.3%
Why will this trend not continue?
Furthermore, we have the "positive feedback loop," where torrents of cash flow from exported oil increases domestic consumption in exporting countries, e.g. 50%/year rate of increase in foreign car sales in Russia.
Understand that the wealth of people that own and drive cars is about the same worldwide with and advantage going to those in exporting nations. The averaging of this wealthy class with large populations of poor in some countries gives a very distorted view of the demand for oil. The reality is that the very poorest use very little oil so removing their demand has little effect the remaining users are fairly equal and the bidding war will quickly move into this car owning class and this means political issue will of course become a big factor as this fairly elite class pressures their government to maintain their way of life.
We often talk about the next stage as a bidding war amongst the western nations but its a bidding war for gasoline by all car owners the vast majority happen to be in the west.
This is important because it means demand will be very inelastic even with significant price increases. This leads to my shortage model.
While I am in no way disagreeing with any of your points, there is a wild card in that there are rather large areas of the planet which are obviously unexploited. To use a national characterization as a basis can be misleading.
As an example, during WW2 the construction of the Alaska highway caused TPTB to put in an oil facility at Norman Wells in the North West Territory on the Mackenzie River. There is a natural oilseep there which made the exploration rather easy. A pipeline was constructed to Whitehorse, Yukon as I recall, which appears to still be running. Google Norman Wells, and disregard the evangelist of the same name, or whatever he is. One site has a nice aerial view.
My point is that the Western Sedimentary Basin doesn't stop at the Alberta border. It appears to be potentially productive all the way to Prudhoe Bay. There is no pipeline, railway or decent highway, so at the moment it is all stranded. Geological studies of Ellesmere Island and so on were carried out in the sixties. Quite how much is up there is not public knowledge but by extrapolation it could be rather large.
In defense of HL, there is no way that it would be a great mitigating factor, but if we embarked on a major exploitation, its HL curve would start today rather than lumping it in with the rest of the Canadian curve. In other words, if it were a separate country we would treat it as statistically starting now rather than whenever you want to start Canada, say 1948.
If you want to use Hubbert on a field by field basis it works pretty much as advertised, but trying to lump it into national generalizations is an oversimplification. The chances of another couple of SA megafields sitting up there is perhaps remote, but I don't know. Not a lot of holes to go by. There could just as easily be just as much or more oil between Hay River and Alaska as in Alberta. Prudhoe Bay could go all the way to Baffin Island.
It isn't cheap and it isn't fun up there, but neither is the North Slope. How much is potentially off the south coast of Australia? Central Africa? The Siberian coast? So far, all the oil in Africa has been from the coast, largely because going inland was pretty risky politically and out of gunboat range. These sorts of remote and nasty areas that are currently unexploited could mitigate the world downslope for quite some time. It won't affect the peak situation, but will provide a lot more downside breathing space than the doomers seem to assume.
The socioeconomic transition from high usage to low will be a good trick given that the economics system is an evolved rather than a designed one which has eveolved around a growth model up to now. Debt service becomes rather problematic in a shrinking economy and inflating them away becomes our only current solution. Maybe they'll inflate away your payments on that Hummer and McMansion anyway. A free useless car and house courtesy of the Fed!
What if Iraq has more oil than SA did? The situation having been that potential oil supply gluts made exploitation of somewhat higher cost oil risky, most installations were close to the coast, and inland areas were left for later. Now it's later and there is a mix of really cheap and really expensive oil out there. There's still another round in the chamber with CO2 as the recoil and who gets the dubious distinction of burning it still in the balance. But it's Sunday and the sun is shining.
When Hubbert did his original work in 1956, he noted that a one-third increase in estimated Lower 48 recoverable reserves postponed the predicted peak by five years.
The question is when, not if, an exponential rate of increase in energy consumption runs up against physical limits.
The problem that we, as importers, are facing, is that net export capacity is a dependent function that is dependent on two independent variables, (exponentially declining) production and (exponentially increasing) consumption.
Our problem is we have not one, but two exponential functions working against net exports. This is what produced the 60% annual decline rate in net exports from the UK.
To further compound the problem, here in the US, our demand for imports is growing because of exponentially declining production and exponentially increasing consumption: http://www.theoildrum.com/uploads/28/Data_4weeks.png (Khebab's work)
As I have said, every time I run through these scenarios, I get more--and not less--concerned.
I don't get the "Exponentially declining production" bit...the HL curve is often simplified as parabolic (i.e. polynominal, not exponential), but of course it's actually closer to a normal distribution curve, which eventually flattens out again and is asymptotic to zero.
I accept that consumption in developing oil-producing nations is likely to be exponential, but probably not all that dramatically so. Do you actually have any data showing this trend?
Do we have any data for large fields (and groups of large fields) that have gone far enough down the production curve to know what the tails look like?
What would be expected is that production will decline until EROI of the field drops toward 1, then the field will be shut down.
But it does not matter a huge amount. We don't get into the tails until the final 10% of the oil. By then production is so much lower, society will be very different.
Jon Freise
Analyze Not Fantasize -D. Meadows
None of model are valid much past peak. At best 15% of peak production. I doubt they will work much past a 5% decline.
The underlying assumptions are simply not valid past this point.
If you press one of the global warming modelers I suspect they will also admit their models don't hold much past significant melting in the Arctic since its almost impossible to successfully predict through adding a new ocean to the planet.
The models may be accurate but we cannot have faith in them.
All the peak oil models suffer the same problem since oil extraction and usage is a economic/life style choice and concentrated in the middle class of the wealthy countries the actual production after about a 5% depletion has a lot more to do with the economic health of this group than anything else. If they can continue to maintain their consumption patterns and lifestyle then we probably stay close to the current models. This is the weakest business as usual part of these models but inherent through out is that things stay like they are with prices effectively steadily increasing. The chances of this happening esp when you consider the current financial climate are slim to none.
My guess is we will see shortages and major price spikes followed by economic downturns then a bit of recovery rinse and repeat. At each downturn you will shed a certain percentage of the population which will find that it can at best earn survival money. If you take ExportLand and just apply the percentages pretty much directly you have about 10% of the worlds population that used a decent amount of oil becoming minimal participants in the oil economy. Its of course not a flat percentage and it won't be a simple increase. But each year a pretty big hunk of the worlds population is going to have to effectively opt out of the world economy and it won't just be in the poorest of nations. You would expect this to cause above ground factors that won't favor oil production and consumption at anywhere near current levels.
But I hasten to add its impossible to believe any model we have much past peak they will all be invalid fairly quickly I doubt we can correct them quickly enough to actually maintain any predictive value in effect things will change faster than we can get enough data to even make a prediction and correct replace models. I'm not optimistic but I do recognize that we don't really know except that we can be pretty sure the next five years will not be pleasant.
As and aside simply having business loosen their rules for workers and moving to extensive carpooling could easily buy us a lot of time. Also subsidizing moving into the cities. We could even after we wait too late still act in a way that we can convert our society.
At least in America I'd be surprised to see people do such acts since in a lot of cases it would mean actually setting next to a stranger this is intolerable in the US.
Yes.
As soon as i get them up to my photosomething account I will post them.
Here is the plot.
Didn't wanna make a legend in R so...
Black is the Lower48
red is Texas
grey is Brent
blue is Alaska
The USA has the longest records as well as some of the most detailed.
The plot is a modification of typical Q/P y axis by Q x axis plot.
It is
Q/P y axis
RelativeQ*Age of oilfield/region x axis
Using the relative Q (convert each data points Q by dividing by the max Q observed) all of the data becomes scaled very nicely (between 0 and 1) meaning different sized oilfields can be compared easily.
the (relative Q) * (age of the region) gives a good idea of how different fields stack up even when they are differently aged.
Here is the same graph as above with some interesting lines drawn on it.
Notice how the p/q ratio drops like a rock after a specific point. This is when the field no longer produces any amount of consequence(ie watered out).
plz comment.
Would you happen to know the well types used in these various fields. Did technical improvements increase URR or simply shift the production curve ?
Most people that believe in peak oil also argue that most of the technical advance generally allow faster extraction. Certainly that have allowed production of difficult to extract oil that generally of low quality although we successfully extracted this oil for example the California tar a long time ago. So even in these cases its not clear that recent technical advances did anything but increase the extraction rate in many cases of course this had to happen to make the project viable.
The technology will save us argument is actually the hardest one to refute IMHO. I'll give you that advanced methods allow us to extract oil from old fields but the production rates in these cases are low enough that your not talking about and approach that makes a huge difference in the big picture.
Do you have the well type and production logs for these fields ?
I argue that the US with decades to apply any advanced method it deems has been unable to substantially increase its production rate and depending on how you do the accounting has not made any change in its URR. Thus the chances of technological advancements actually making a big difference are old.
I'll take a looky for the well types, i have production logs as reported by respective agencies.
i'll send you a mail if i find it in a non-timely manner.
Cool In my opinion the technical argument is the one that has the biggest chance of at least delaying the effects of peak oil maybe by several years. We actually don't know right now if technical innovation will give us a bit more of a plateau then what HL is predicting. Since we know that horizontal drilling and other advanced methods seem to allow us to keep the production rate high at least at the expense of greater declines later if not higher URR we have a chance that they have indeed managed to delay the decline rates to lower values than predicted by peak oil.
Of course since these methods have been in use for a while the steeper declines of "older" fields probably offsets any gains so your back to square one. But you can always hope.
I'm praying we get a really nice price shock soon and economic slow down before we run this thing into the wall.
I might be one of the few people who ever prayed for a recession but we need one ASAP.
One more thing do you have the dates when wells where drilled and completed ?
In the case that I'm asserting that the logistic model is actually a valid physical model showing that the wells are created in a logistic manner leading to logistic production rates would be really cool.
Please email if you have this data set and send it to WHT also I think he seems to be interested in this and having data of well completions with production logs ? :) would be cool.
If we want to do any sort of real modeling we have to have this data.
Just for my own benefit, I did some basic calculations based on what existing data I could find. For SA, which currently produces ~9.5mbd and uses domestically 2mbd, if we assume that the 9.5 can just hold flat for 10 years, and domestic consumption increases 5% year over year, then by 2017, we're down to 6.5mbd exported. While significant, even if that pattern was extrapolated across all major oil producing countries with rapidly growing economies, I would see it as a "pretty bad, but not catastrophic" rate of decline. True, after that it has the potentially to get much worse, but I suspect the world economy will already be a very different place by then, with pretty significant demand destruction going on.
Really the only thing that I see producing a completely unmanageable rate of decline in available oil for importing is North-Sea or Cantarell-like production rate declines.
Our problem is that many exporters, especially the top three net exporters, based on HL, are way, way past the 50% depleted mark, which I think will result in catastrophic net export declines.
The paper that Khebab and I are working on will attempt to quantify the estimated net export decline, at least for the top five. It will not be a pretty picture.
This is why I am increasingly tending towards the "Amish" option: to adopt a non-electric/no fossil fuel lifestyle. Before that I thought in terms of "green' solutions like high mpg cars, etc., but sooner or later even these adaptions will be too expensive. I figure we have, at best, 4 or 5 years before Olduvai Gorge.
Might as well prepare for it now, rather then fight the inevitable.
Flavius Aetius
Regarding consumption, the top five (half of net exports worldwide) have shown an accelerating rate of increase in consumption since 2000. From 2005 to 2006, their consumption increased at a 5.5% annual rate.
The key point is that net exports decline because of declining production and (sometimes) rapidly increasing consumption, which resulted in the 60% annual decline rate in UK net exports.
The 60% annual decline rate in UK net exports (a figure I haven't seen any raw data for, but I'm assuming is valid) is presumably because the high rates of production decline (due to the agressive way in which the North Sea fields were exploited) quickly lead to a situation where total oil production was very close to domestic consumption (which has barely increased over the same period).
The 60% was a once-off (and final) drop of course - from now on the UK will be a net importer, barring any substantial new finds.
I'm not sure how this is relevant to the situation of major oil-producing countries with developing economies that are now supplying the world market. Almost all of them are producing far more oil than they consume internally, and it would require at least 20 years at 5% growth in domestic consumption for most of them to end up with zero net exports. Sustaining 5% growth for 20 years is no mean feat, I might add - especially with unstable/authoritarian political regimes. But I would certainly accept that in 20-30 years time there will be extremely little oil left on the world market. The part I don't get is why exports are expected to decline at the sort of rates I've seen you post before (26%?).
In round numbers, for 2006 the top five (half of net exports worldwide in 2006) had the following numbers (Total Liquids, EIA):
Production: 30 mbpd
Consumption: 7.5 mbpd
Net Exports: 22.5 mbpd
You can actually use the Rule of 72 here (or just round off to 70) for the top five:
At a 5% year decline rate (pretty close to what the top four showed from 2004 to 2005), production would be at 15 mbpd in 14 years.
At a 5% per year increase in consumption (less than the 2005 to 2006 rate of increase), their consumption would be 15 mbpd in 14 years.
Basically peak exports (in 2005) to zero exports in 15 years. The UK went from peak exports to zero in about six years.
Note that based on HL, Saudi Arabia is 60% plus depleted, Russia (at least mature basins) is 85% plus depleted, and Norway is 70% plus depleted.
Ok, but if we had a 5% year-over-year drop in global production rates (and note as I said before, no model predicts exponential decline), a huge global economic downturn would be inevitable, accompanied by a significant drop in demand. Which would probably give us 20-30 years before there was truly no significant amount of oil left on the world market (maybe just enough to manufacture essential medical equipment and produce pesticides). In that period, I would see what's left of the economy to be put to work preparing as best as possible for a post-oil world. We'd certainly be looking at least a 15-year long recession/depression. But I'm optimistic there will be recovery, and certainly part of me thinks this sort of level of economic upheaval is desperately what we all need to wake up to ourselves (much as I wouldn't otherwise wish it on anybody).
The "worst" case scenario (from my personal point of view) is that the world's oil producing nations become the new controllers of the world economy, and the current rich western nations are by and large reduced to poverty. But even then, it just means that the world will be essentially run by self-interested authoritarians and religious zealots, and won't be a very nice place for most of the world's population. Spot the difference.
Okay. Let's try this one more time.
I am not predicting a 5% decline in world production.
Strictly speaking, I am not even predicting a 5% decline rate in production by the top five net exporters.
I am giving you some "what if's" while I am waiting for Khebab to do the hard work of generating some HL based predictions for net exports by the top five.
What I can tell you is that the top three world net oil exporters (at 60% to 85% plus depleted, based on HL) are far more depleted than the world is overall.
If we tie this in with expected--and observed--rapid increases in consumption, rapidly declining net exports basically become, IMO, a mathematical certainty.
Define "rapidly declining"! If rapidly declining means anything like 20% in a single year, then the US and other linked economies would fall to pieces - and all of a sudden the oil producing countries will lose the income that's fuelling their growth. At 10% western economies would suffer severe downturn (certainly an extended recession), but even then the income to oil producing countries would dry up somewhat and with accompanying demand destruction the world would somehow muddle it's way through. At 5-10% I would see a gradual economic growth slowdown over many years eventually resulting in recession in most western economies, but lasting probably not longer than 5 years or so. At less than 5% we'd be able to adapt without it hurting the economy significantly (though it would certainly cause some major reorganisation).
The actual decline rate matters very much in determining the likely outcome.
You have pretty well summarized why I am stupefied that net oil export capacity is not the #1 story in the world.
However, the point you are forgetting is the explosive increase in oil prices--dumping torrents of cash into the laps of the exporting countries, as market forces (or military forces) try to allocate the oil and petroleum products.
Note that my model suggests a "slow" rate of decline in net exports at first (top five), I'm guessing something like the 10% range, transitioning into a much steeper decline rate later, probably in the 30% to 40% range. But again, I am waiting for Khebab's HL based plots.
The point that Memmel (and Matt Simmons) have been making is that we are very likely to see physical shortages of petroleum products, even with high prices.
IMO, we are rapidly transitioning into the reality of an exponential decline in net exports, while the conventional wisdom is for an infinite rate of increase in imports. While devastating and probably deadly, the collision between reality and expectations will at least be entertaining.
There has never been a time when the world hasn't been run by self-interested authoritarians and and religious zealots, and it has never been a very nice place for most of it's population.
Hence my "Spot the difference" comment.
What was the "US" decline rate ? We never really exported I don't think and basically went strait through our decline to become importers. Mexico seems to be on the same path. Is their any country that offers a sort of counter example to the ExportLand model ?
Also in general consumption has been on the rise in all countries through the world the recent increase in prices simply accelerates this in producing countries. Finally of course the huge factor thats not in this model but important if you consider cases where decline is not that steep. China/India etc are seeing demand grow at a fast rate so any consumption that does not go into exporting countries will go to new consumers in the developing nations still leading to export declines to the older industrialized nations.
So again the ExportLand does not take into account all factors but adding in the growing demand in second world India/China simply accelerates the model.
Notice that the only way out i.e steady are increasing production is the same as assuming we are not at peak or we will have a long plateau. The plateau case is possible and may well prove to be true but so far I've not seen enough to convince me this will happen. If we are lucky a combination of a fairly mild deep recession and a bit of good news on the production side may give use a few extra years. I hope so.
What's a "mild deep recession"? Mild = short?
Sorry not quite a full blown depression i.e no bread lines people can still get employment low wages but no starvation etc. So mild deep means serious unemployment or low wage employment and loss of assets but not starvation problems.
And the economy is still functioning gasoline readily available if very expensive etc.
The more extreme outcomes say that physical shortages will so damage the economy that it becomes non-functional. So understand that mild is from my viewpoint :)
If we are lucky we only get this mild-deep recession and our economy can reorganize.
Maybe I should expand you probably have seen these wedge models used by people explaining alternatives. Lower gas mileage window power etc. What they are doing is making the assumption that the economy is fairly intact and makes a active decision to adopt alternative energies and transportation etc the wedge shows how the alternative replaces the existing technology. Almost all of them have pretty good conversion numbers so to expand a bit whats important is if you can wedge as I call it once export land starts kicking in.
I don't see how the US as a country can pull of wedging but a lot of regions can the same probably holds for Europe in general all countries have regions that are probably capable of "wedging" and all seem to have areas with big populations that are almost certainly not going to wedge.
So the bottom line is can you wedge. Shortages are particularly nasty since they throw a huge money wrench in just keeping the normal economy going much less wedging.
Wedging is simply a regional version of ELPing or you could see it as the collective approaches needed to support a population thats attempting to ELP. Trade will still be important and probably will remain so and again shortages cause problems.
I really hope we get sky high oil prices soon since its a lot better then having shortages and gives wedging a chance.
If you look at the analytic expression for the Hubbert curve (the solution to the ordinary differential equation (1/Q) dQ/dt=1-1/Qm), that experession does have an exponential tail.
Exponential decline is a bit deceptive, however. That means the decline rate is slower as time goes on.
"there are rather large areas of the planet which are obviously unexploited"
Not true, sadly. Peak discovery happened in the 1960's. We have been looking, but not finding.
Deffeyes did a statistical analysis in "Beyond Oil" that showed we had found 94% of the oil available to be found. And that 100 bbl of a total 2,100 bbl of oil was all that remained to be located. We will know the statistical model was wrong if they start finding oil in 70 bbl and 150 bbl fields again. That book was published in 2005.
There have been other analysis of discovery. Campbell has published some showing how much discovery would have already happened if another 1 or 2 trillion barrels existed.
Laherrere has done several studies of wildcats vs discovery to show that major regions are essentially tapped out for discovery. (Saudi Arabia tapped out at least 30 years ago).
Before you call people "doomers" you need to prove the oil exists. What you have here is wishful thinking.
Jon Freise
Analyze Not Fantasize -D. Meadows
A couple of observations on HL. First even though the method is widely used and has been explained I think that it suffers from lack of a clear explanation.
Here is my take on the method.
First and foremost the method can only work if the curve being test has a parabolic shape not this has nothing to do with the debated logistic function.
See http://mobjectivist.blogspot.com/2005/12/hubbert-linearization.html
But to back off the mathematics understand that a vast number of curves are close to a parabola i.e a parabola provides a good first order fit the simplest members of this family are a square and triangular shaped function. Just about any other function that has three inflection points provides a better fit.
So next lets look at these inflection points. A simple explanation of a inflection point.
If your driving your care and you start accelerating the first inflection point is when the rate of acceleration slows to zero then begins to decrease so your pushing on the gas peddle and your car is going 1 mph faster each second then 2 the series looks like this
0 1 2 3 4 5 4 3 2 1 0 -1 -2 -3 -4 -5 -4 -3 -2 -1 0
You can easily see the three inflection points.
For HL you have to be past the first inflection point at a minimum and since HL does not directly include discovery you should be comfortable past the first point this ensure that
all the king and queens have been found and most of the smaller fields mapped since the bulk of the production comes from the kings and queen fields and the production stratgey is well in place by the time your past the first inflection point and closer to the second HL is robust agianst the discovery pattern if these criteria are met. A more complex model in general only allows better modeling of the front side of the curve where discovery has effects the backside or decline side is smooth and matches well to HL.
This means of course that the front side fit is not all that important and a better model will probably not give a very
different answer for peak and backside decline.
In our case we are looking at mature regions that are not only well past the first inflection point but close to or past the second. So given the above we expect the fit to be good.
Next the linearization method itself. This is probably the part that I dislike the most about the method. It a way to do minimization by hand without a computer. If you haven't noticed we have a lot of powerful computers these days and even hand calculators can use more sophisticated approaches.
In general these methods basically vary the parabola we have discussed before and measure the average distance from all of the input points this gives a error term thats minimized.
In effect they do a lot of linearizations fast.
This gives you a better fit but its sensitive to outlying data points and thus you end up setting up some filters to smooth the data or throw out anomalous data which puts you right back into a human decision certainly with a more rigorous reasoning but still subjective.
Its important because this hand fitting is a easy place to attack the model but if you compare the fit or final curve
done using HL vs a more complex fitting procedure you will find that if the person doing HL did a bit of eyeballing the fit the Mark I human eyeball is very competitive with the computer. The reason of course is basically all of us have a innate ability to pick out patterns to the point we always see patterns. And we are in general very very good at it.
But if you question the fit given by HL its trivial to take the curve and original data and run it through a different fitting program. I will say I don't like when only the HL curves are given I want to se the logistic curve on top of the original data so I can do a quick scan of the fit.
To finish why the logistic curve ? I can answer this question with two questions.
1.) Ask the Ants. Why are Anthills not 10 stories tall and the size of small hills ? Certainly we have cases where ant colonies are unusual but they are just that unusual. In general if you look at a ant colony and HL for oil you will see that the same forces are at play and the far more complex ant colony falls into something very close to HL.
Using mother natures minimization of a similar situation as a ultra super computer thats run for millions of years shows
that HL is right on the money.
Of course peak ant hill is a myth and all the ants need to do is invest billions of more dollars and they can grow their anthill as large as they want right ?
Yeah right. So if you want to attack HL explain why anthills are not 10 stories tall then prove HL is wrong.
2.) The next case is tree root systems again the same conditions apply and tree outside of exceptional conditions
tend to have almost the same amount of root growth. Its the same problem with the same result.
Ants are the best model IMHO since they are the easiest to map to oil extraction and most people share a intrinsic basically correct model for ant colonies. So if you can prove that ants after millions of years are badly mistaken then I'll believe we are not right at peak oil.
As you know, when we integrate a production rate versus time graph, we get the area under the curve, otherwise known as URR.
Empirically, the HL method (with sufficient data) appears to do a pretty good job of estimating the area under the curve, or URR.
We could not find two more radically different production profiles than the US Lower 48 and Russia. But in both cases if we only use production data through 1970 and 1984 respectively, the method has essentially been 100% accurate in predicting post-1970 and post-1984 cumulative production, i.e., the areas under the production curves respectively from 1970 and 1984 to 2004.
Back to my ants :)
If you look at ants this volume can be seen as the amount of dirt removed to build their tunnels this is logistic in nature and the same problem you have with drilling oil wells in fact its far richer. The logistic equation at its heart is about tunneling and EROI for Ants this is equal to URR for oil.
So if you consider oil extraction as a technically inept ant colony you can see that the logistic equation gives the URR.
The rate of production etc etc depends on the region size of the area being tunneled but the critical point is the logistic equation seems to accurately model the tunneling problem and thus can predict URR since oil wells are nothing but tunnels. All the complexity effectively collapses into the simple tunneling equation or HL coupled with a empirical fit.
Its actually really cool when a simple equation arises from complex systems. Mapping the variables back to first principles is a bear but the mapping between classical and quantum was done after the fact for example. So if we had the first principle model for oil extraction we could show it collapsed to HL. Since ants run the same calculation and give the same result we need not try to create the first principal model simply argue in effect without proof that ants are a good model. Only after we have a excellent model for ant colonies can we do one oil. But why ?
Ever since I barely escaped, during the waning months of the Carter Administration, my last math class--partial differential equations and boundary value problems--with a hard earned "C," I have tried to stay away from calculus. But Khebab is not burdened with my mathematical limitations, so I defer to the master on this one.
My view on the issue is that it is a simple tool that seems to work reasonably well in many large producing basins.
Thats what I said :)
For me, the beauty of the HL technique is that it is intuitively appealing. Indeed, after a few minutes of reflection it is almost intuitively obvious.
I've been messing with parabolas since I made my first reflecting astronomical telescope at the age of sixteen. It is true that for "flat" parabolas a sphere (or circle in two dimensions) is a good approximation, but the "deeper" the curve, the more apparent is the parabolic shape. In other words, you can make a six inch telescope f/12 (seventy two inch focal length) with a spherical mirror which is a good approximation of a parabola. But if you want to make an f/5 (thirty inch focal length) six inch reflecting telescope, the sphere is not at all a good approximation of a parabola.
Because we are looking at "deep" curves (or steep ones) when discussing HL, I do not think that the fact that some parabolas are close to circles or ellipses or hyperbolas is relevant.
The trouble begins when people take HL too seriously, e.g. to too many decimal places. [I love the way EIA clairvoyantly guesses the resource scenarios to four decimal places (PDF, p.8).] As we've seen around here, that sort of thing can get you into ill-tempered arguments having no possible resolution.
It's useful to keep in mind that when any quantity is growing exponentially, the time frames are then logarithmic in the growing quantity. And, typically, when you fiddle with numbers, their logarithms don't change much - so if you fiddle with the total quantity of a recoverable resource, the timing of a production peak doesn't change that much. Indeed, if the Earth has a 'creamy nougat center of oil', you still get a peak that's not eons out, or you exhaust the oxygen first.
Just as exponential growth will eventually overwhelm anything, its inverse, taking the logarithm, forgives a multitude of sins. Which means that estimation techniques don't have to work perfectly in order to give reasonably likely time frames.
Exactly even with massive fiddling you don't gain much.
This means to fail the model has to be intrinsically wrong.
Since its actually not a lot different from results obtained from repeated bottom up analysis which I might add generally WAG on the decline rate we can't easily dismiss the model as wrong.
I will say that most of the bottom up predictions are now wrong. Right now today almost every bottom up model has proven to be too optimistic. Yet we have no out cry questioning bottom up models. While HL's track record so far is right on the money. I have a lot more faith in a model that attempts to handle depletion then ones that don't handle it well or at all and which are negatively effected by above ground factors that are also not included. The sin is overestimating when the peak occurs what the peak value is and underestimating the decline rate.
If HL consistently proved to pessimistic thats a good thing models that are obviously optimistic are worth very little. Esp if exports land is included. So far HL has been pretty much right on not pessimistic which is why I think the models need to be modified on the back side.
ExportLand is one modification that makes sense but its not the only one and all these modifications are negative i.e the amount of oil available will decline faster than HL predicts so its actually optimistic post peak. EROI/Investemt costs are right behind Exports and will contribute their own 5% exponential growth problems.
the EROI/Investment issue starts later but seems to be just as big a factor as exportland. Later on it swamps all the other factors.
The only positive factor that can actually change the situation dramatically is a worldwide depression and although it makes oil available its not something most people consider positive.
I would think that ant hill colony size would obey the Logistic derivation. The birth rate of ants starts to diminish as population increases since they have a finite area surrounding to collect food. The other piece is that all biological species have a death rate that is proportional to population. Work the birth and death together and you get the Logistic equation.
In effect the ant colony does not necessarily collapse, it just reaches a steady state where the birth rate equals the death rate. Or do the ants completely strip their environment of food resources so that it doesn't get a chance to renew? In which case the population hits a peak and then drops to zero as the colony starves out. I believe that the Logistic models the first case but not the second starvation model.
Always appreciate a good analogy.
Right its only a half model since ants are good citizens and use renewable resources :)
But its close enough since the ants expend their resources extracting their food and digging holes etc etc. On the upside the economics of a ant hill are logistic and what they accomplish given scaling is basically the same thing we do extracting oil. My point is when you scale the problem up and do all the variable assignments between a anthill and humans or really big ants drilling oil wells its a one to one mapping. And thus the logistic model fits. The whole system scales to almost a perfect match with oil extraction. Numerically of course a number of ants are replaced but one human with powerful tools so its not one ant - one human but other than that you can play the game of showing that the two are countably the same problem with a scaling factor. Underlying this is the fact that the energy used is about the same as you scale. Supply/Demand for both product and the means of production maps onto the birth death model for example. So given the ability to do a scaled correspondence the problem is not to prove that oil extraction is logistic in nature but to figure out how too prove its not logistic.
Or at least its logistic to peak and slightly beyond. As you see once you move much past peak its not clear the model holds but it makes sense to move to a collapse model that works for every other bubble situation thats ever been modeled. I'm proposing exactly this as the conditions that take hold post peak so at about 5% decline from the peak you go into the collapse model.
The method of proof is effectively this.
http://polymathematics.typepad.com/polymath/2006/08/countability.html
Or this link.
http://en.wikipedia.org/wiki/Countable
With a bit of induction as Don mentioned.
http://en.wikipedia.org/wiki/Inductive_reasoning
In my opinion the strength of the proof is that you can show
a scaled but very good countability equivalence between a logistic ant hill model and oil extraction. That you have used inductive reasoning to assert are equal in the first place.
Its a pretty dang good proof. And you would be hard pressed to prove its false and even if you found a alternative model
it has to be really close to logistic so your alternatives would almost certainly be variants of the core logistic model.
To be honest at the moment I can't see how these sort of extraction models or resource depletion models can be anything but logistic on the upside given the strong mapping between the dynamics of ant hill with proven logistic behavior. Notice total ant colonies include a discovery phase when they enter a virgin territory so even that in the model so I don't see discovery as outside the logistic model . In effects all factors are in the ant model and its logistic.
If you think about it attempts to disprove peak oil require a sort of magical market trick by Wall Street to save the day or finding Atlantis filled with light sweet oil.
The links are to examples of inductive or deductive reasoning. Which link gives the details of the ant analysis?
Sorry studies of ants is a main use of logistic modeling and these days virtual ants are used.
http://www.theoildrum.com/node/2689#comment-205300
Just google for ants and logistic and you will get thousands of papers on the subject covering every thing you ever wanted to know about ant colonies and more and application of the model to a wide variety of problems.
My assertion is ants in the biological sense digging holes exploiting a food supply etc can be countably mapped and scaled to equivalent variables used to model oil extraction.
The simple mapping is between ant tunnels and oil wells and the resources needed to create each and of course a finite food supply and finite "basin" that good for a colony or oil. So thats the basic mapping. The life death model is a bit tricker but doable its mapped to the market for final product and also the internal costs contractors leaving and joining the project. Actually the internal costs i.e contractors agreeing to join or leave the project in my opinion maps quit well to life/death. The external market forces don't seem to have as much of and effect. In any case you can continue to do this sort of mapping for as many variables and their derivitives as you wish. The assertion is that by showing this countability or mapping I've proved that the two different systems share the same model.
The fact that ant colonies follow logistic equations is well proved therefore oil extraction must.
Now backing up I have no idea how you formally do this sort of proof using formal logic for variables of a model. Its very similar to the sort of algorithm performance analysis you see for computer algorithms but different.
I'm sure this is a known method I just don't know what its called its not something I've ever heard of before.
Googling for countability and logistic gave some interesting hits.
So its easy enough to do and the interesting part is mapping the ant model probably gives a richer model for oil extraction then has been presented to date. The debatable part is how to map the life/death part I agree but since the final outcome maps and the input constraints finite resource base maps and a reasonable life/death mapping seems to work the models map. It sounds like your interested so the first step would be to pick one of the ant models thats known to be logistic and map the variables. The simple mapping of workers and equipment entering and leaving the oil field to life/death along with the fairly obvious mapping of the rest of the variables make me fairly confident I have a proof.
It would be nice to understand what doing this is called the approach is to use induction and countability to prove the equivalence of the variables and constraints of two models and thus assert the governing equations must be the same. Also the derivatives so all these can be mapped. And mathematicians call this ???
To me its a sort of expanded concept of integration.
I want to emphasize that external market forces probably have no effect unless they force the operation to be unprofitable as long as any profit can be made the resource is exploited.
Ants don't have external markets so they can't really be part of the model.
Justification can be seen by recognizing that builders will build houses as long as they can make money or until they go broke since this is what builders do. Oil companies will drill for oil until they go broke since thats what oil companies do.
If they don't then their by definition not a oil company.
Ants do ant things because they are well ants :)
I think its worth stressing that this model only requires that the system can continue to function other than that external profit losses have it seems zero effect on the rate of exploitation.
Before I get flamed hard for this. Note that only after supply is constrained and prices high does the market induce expending a lot of extra effort for decreasing returns. This only pays off if you find a new region or basin with the extra investment. It has little effect on the areas that have peaked.
So to be even more controversial if this is the right model Texas crashed because they did not find any more oil not because cheap oil was found elsewhere thus if a big oil strike had been made the Texas oil economy would have continued to function. The fact that other sources were found is not relevant.
But you pointed to a bunch of papers that appear to go all over the map concerning logistic applicability to ants. Which is the one paper that is the definitive and fundamental source?
I don't have one paper. Thats not where the problem is the problem is we don't have a good model for oil extraction to map at the same level that the logistic equations where done for ants.
So the problem for me is do we have the data set to run this sort of model. For example I'm proposing that the life/death model is at least mapped to contractors and equipment entering and leaving a field. How do we get this information in the real world ?
Here is a link to virtual ant models.
http://www.kasprzyk.demon.co.uk/www/ALHome.html
I don't know if these ai ants are logistic or not just looking at the link description I don't think you get logistic behavior.
This one is termites but looks pretty good and more important not behind a paywall.
http://www.comp.leeds.ac.uk/danl/ladley-bullock-jtb.ps.gz
Discovery is logistic also tons of papers I'm hitting pay walls big time trying to find a link.
This however might be more useful since they have already humanized the model.
http://www.medievallogistics.bham.ac.uk/aims.htm
Actually the fact that someone is succesfully mapping logistic equations derived from simple insect behavior to medieval armies is a pretty good support for the approach.
So the big question is what data do we have to map on the
oil extraction side.
We have discovery assuming the population is high enough you should get a logistic map.
We have in some cases knowledge of wells drilled this should be logistic.
???
Almost all the various data points follow logistic equations this is what drives the whole system to be logistic.
I'd like to stress that all I did was note that we have a lot of studies of biological system that have the same variables in them as we have for oil extraction. Its a known fact that these variables are logistic for the biological systems and in particular for ants. Given that they behave in a logistic manner and map one to one with oil extraction oil extraction is logistic.
The medieval link is doing the same thing with foraging armies and his models seems pretty close to what I think the right one will be for Oil.
Now I have not obviously done the actualy oil model mapping.
The big problem on the oil side is although you can do a theoretical mapping like I did we are really short a lot of data.
The best case scenario is you have all the info. Discovery wells drilled types of well production rates per well. Workers on site/equipment on site etc etc.
The discovery data set for oil is so small I'd question if its big enough to get any sort of valid model. The fact that people seem to be able to predict a discovery rate of their choosing depending on the model supports this view point.
You can use prior discoveries to predict production and the simple models which show that we probably won't discover a lot more oil are probably valid. The fact the planet is finite and we have looked in most places is probably more important then any model based on previous discoveries.
The bottom line is theoretically I see a strong mapping thus the onus would be to prove that oil extraction is not logistic.
The second step is we have to work with data we have on hand
the "experimental" proof is that you can take a logistic model of ants tunneling and it maps right on to wells drilled into a oil reservoir. Since the creation of the wells is logistic the extraction rate is logistic given a finite resource. This is just a logic experiment.
So if you have the data on a field that gives when each individual well was drilled we can test if its logistic.
But every aspect of the process is lousy with logistic equations so its up to you and what data you have if you want to do a real model. I'm content to do the theoretical observation :)
Seriously every single system of this type across a vast number of different fields is logistic I don't even know what and alternative would be. I did see a small number of papers arguing linear growth for a few things.
Before I can doubt the system is logistic I'd have to see a valid model for a similar process that does not exhibit logistic behavior to date I see no alternative model that can be used to "disprove" the logistic one. Only very highly contrived examples that in general don't map to any real world complex system have been presented to "prove" logistic the logistic equations don't hold.
So show me one case where we have a similar system that was modeled logistically and later proven to not be logistic or we have no way to test the validity of the logistic model.
We already know it gives a good fit for real world data so thats not and issue more sophisticated models simply introduce more variables that are known to behave logistically in similar systems.
Are you sure you're using "countable" correctly? 'cuz it has nothing to do with whether ants are a good analogy for oil producers.
Most of your uses of "countable" don't even make sense. "Countably the same problem"? What is that supposed to mean, "provably, but with numbers instead of logic"? That's not what "countable" means. "Countable" just means "each element can be uniquely labelled with a positive integer".
Throwing around technical terms in bizarrely inappropriate ways just makes you sound like a crackpot to those of us who do know what those terms mean. If you want to make sense to other people, you need to take the time and care to formulate your idea, work it out in detail, and then communicate it in a clear, concise, and correct manner.
And that means everything from the choice of words (i.e., ones you know how to use) through grammatically-correct sentences to well-structured paragraphs. Your English teacher wasn't trying to be mean; all of that stuff really is important for effective communication.
It's also not clear that you're using "proof" correctly, given that inductive logic can't be used to prove anything. From your link:
"In contrast to deductive reasoning, conclusions arrived at by inductive reasoning do not necessarily have the same degree of certainty as the initial premises."
Did you even read the links you posted here in "support" of your argument?
EDIT: good grief, you're not even using "logistic" correctly. The "logistic" link you trumpeted as having "humanized" it is about logistics - i.e., feeding armies - and has nothing to do with the logistic function.
You seriously need to think things through more before slapping them up here.
You have never clicked on my name I see.
And I guess I'm lucky you decided to wast time clicking
on a link obviously you did not read the contents.
http://www.medievallogistics.bham.ac.uk/aims.htm
And I'll give you a small hint what do you have to do before you drill for oil ???
Maybe your can figure this one out ?
Naw...
Okay I'll give you the answer since its not clear you have critical thinking skills.
Find it.
And then I'd suggest you google for Optimal Foraging Theory
and logistic equations and maybe just maybe you might understand why I suggested this link or you could actually read it.
And from there you could find out about spatial logistic equations. And the relationships between food gathering and logistic equations.
And I'm sure considering armies with thousands of men and machines trying to accomplish a unified goal and thousands of men and machines trying to do the same in a oil field as similar problems. And the point of the above link is he has already done the work up that leads into logistic solutions.
Memmel, don't take Pit's criticism too harshly. We always need some more borderline insane ideas to put through the wringer. And you are the man to provide them. Keep throwing them on the table and we can sort them out.
Kehbab:-
Memmel:-
There seems to be some confusion here. A parabola is not a bell shaped curve. The essence of a bell shaped curve is that it flattens out at each end to asymptotically approach a base line and has two points of inflection (i.e. points where the second derivative changes sign). An upside down parabola has no lower limit and no points of inflection. The second derivative is constant at all points.
The bell shaped curve that Hubbert used was the first derivative of the sigmoid curve, a special case of the logistic curve. A plot of P/Q verses Q for this curve gives an exact straight line. Such plots for other curves such as a parabola or a Gaussian curve only approximate to a straight line.
I was talking foremost about basic shapes not pure math first and foremost i.e parabolic looking and better a fairly deep parabola not in the mathematical sense but in the visual sense. Parabolicish looking :) Like the word roundish. If you want bell curvish except the asymptotic behavior is of no interest since we are looking at the tree inflection points. Curvish by itself invokes a pleasant but incorrect mental image.
Here are some links on the exact method.
http://graphoilogy.blogspot.com/2007/06/in-defense-of-hubbert-linearizat...
http://en.wikipedia.org/wiki/Hubbert_Linearization
http://www.theoildrum.com/story/2006/7/7/10623/98153
WT probably should have given more links to the background material.
Recall that every symmetric peak when expanded to first Taylor series term looks like 1-k*x*x, which is an upside down parabola. Which means that linearization will always work for at least some segment of the curve. (However not all these curves will give the same URR)
i get your ant analogy, but to me radioactive decay works better, i.e the amount of radiation (production) is proportional to the amount remaining (Qinitial -Q). the units of P/Q even suggest a half life (1/t)
radioactive decay is a simple first order DE
hubbert linearization is the first derivative of the logistic function.
Jeffery & Khebab,
Great work as usual. I thank the both of you for the time you spend looking and compiling all this data.
I agree with you every time I look I see more reasons to concerned not less.
The October date I keep seeing go by. I assume things are lined up for wide impact obvious problems?
D,
Do you mean the ASPO conference, or when the SHTF (or both)?
BTW, my daughter and son-in-law are driving out to Cannon Beach and then Newport today (I recommended Dooger's in Cannon Beach). (Seeing the country while they still can).
SHTF is what I was thinking. There was some posts about Oct. being the time when PO is no longer kept quiet.
I hope they like that stretch of the coast. It has the most vistas. Weather is a bit cloudy today. The Tillamook cheese factory has some good ice cream if they like that sort of stuff.
In most cases, we don't get an accurate Qt estimate until we get a P/Q intercept in the 5% to 10% range.
I also remember Khebab stating that you don't get an accurate estimate when most of the points you are using are have values of P/Q above 5%.
Its hardly a surprise that ASPO-USA won't accept your presentation about the decline of net exports if you are using HL to forecast production. If you are using it anyway to predict Russian production despite knowing that it is not reliable why should they trust anything you say.
Of course you aren't going to let that stop you from making predictions here about Russia. Not like there is any risk involved, if you are wrong you already have a convenient excuse.
I expect you will be repeating that excuse many times in the the future whenever someone points to Russia as an example of HL making an inaccurate prediction.
Dude ASPO doesn't matter any more. I'm now taking care of my own ass you can make your snide comments I'm looking for good farmland. I'm not surprised its ending this way the same damn thing happened with global warming.
I assure you the real pisser for you not me is if I'm right.
I'd love to see WT be proven wrong with a REAL argument not BULLSHIT.
And this is problem is serious enough that people that reject a parabolic solution which works for a vast range of problems better step up and explain in detail why HL is wrong. Not posting drivel. I'm sorry for the caps and the attitude but if the model is correct its results are serious enough that a sound rebuttal is needed or we need to heed the model. Or don't as I said the repercussions of the model are so serious that this rat is interested in self preservation not your opinion.
Take a good hard look at this URL.
http://arctic.atmos.uiuc.edu/cryosphere/
The Artic melting is now unstoppable you can argue all you want but the facts are right there. We have a new ocean and its effects on the worlds climate are unknown. We have flipped our climate to a new regime the party is over and people are still making similar arguments to your right now but targeted at global warming.
WT is giving you a warning and your misunderstanding of the situation cannot change the facts sorry.
I used the 5% to 10% range because most large mature producing regions tend to fall in this range. There are two outliers that I know about, the North Sea and Iran. Iran is a real problem because of the pre-peak decline, after the Shah fell. I think that the North Sea is due to the exclusively offshore nature of the production.
In regard to the ASPO discussions, it turned out to be a misunderstanding as to what we were talking about. The net export paper that Khebab and I plan to do will use two production projections, one based on HL, the other assuming flat production forever. Note that flat production = lower exports, because of increasing consumption.
In any case, I think that declining net exports will be widely reported by this fall, although as Memmel has pointed out, the POD People (Peak Oil Deniers) will still claim that the decline is not due to geological constraints, i.e., many will persist in their claim that an infinite rate of increase in the consumption of a finite energy resource base is no problem.
You can't "win" with the hardcore "POD people". Only reality will convince them, and reality is sending them all the wrong signals right now. The media empire is abuzz with syncing EM radiation and audio outputs, "news" broadcasts and the newest Hollywood movie. A distraction lures around every corner. Bloomberg has ream after ream of "analysis". Hell, even here at TOD there is a constant churning of ideas... Just discussion, to some people, means oh things have to keep on going on this way. Simple cognitive dissonance is how people control themselves, actually. You have to shutdown some ideas, or conjectures because they lead to very ugly pictures--and we humans like pretty pictures. Discussing these issues with the POD people is useless because you are not arguing against anything! You are arguing against faith, and you'll always lose (I know, I've tried and inevitably failed). It is akin to debating against the idea of a "personal god", or that someone's favorite color isn't blue (even though that's what it is), no, no, it's green! They just won't accept it.
In the end, I don't know how people are capable of being so incompetent and shortsighted--but then again I sort of do. I see it in myself, and perhaps if I didn't go down a certain road of development to where I am now I would be a wild-eyed freemarket praising, cornucopian, born-against christian fundamentalist... Or perhaps I could have been a vegan who snuck hamburgers. I dunno.
All I'm saying is that you can only hope to "convert" those who are in the middle, who are moderate on these types of things--because they are susceptible to, for lack of a better term, *true reality*. This is the main problem... Our culture has become so equiped to neutralize thought and stagnate cooperation that most humans are simply not able to understand what this world is... Reality has become distorted (and always was, before science really started making inroads the last 5 decades). The PR industry is one multi-varied reality-distorting juggernaut. H Sapiens need explanations and answers and they will seek them out and adapt. Doesn't matter if they are right or wrong, something has to fill in those hundreds of billions of glia and neurons.
Not to sound new agey (eck) but here's a good quote that summarizes this:
"As far as we can discern, the sole purpose of human existence is to kindle a light of meaning in the darkness of mere 'being'." - Carl Jung
We are presently so comfortable not many are seeking out how to be more sustainable and change their ways because it just isn't worth it--and plus, in their view, why?... They turn quickly either to self-rationalizations about the lifestyles they were born into--so then you get the "oh we'll drill some more" and have simply no clue what HL is and in fact don't want to know (even though everyone is capable of understanding this stuff...)
Clearly, there is roadblock to do anything, and since nothing is happening top-down, eventually something is going to happen bottom-up... Which, certainly nobody is used to.
[edit: another note on the POD people, I shouldn't have strictly wrote "right now"--because they've always been around, and at the root of their contestation is really just a general optimism... that in the end really must be called faith.]
Exactly thats why the correct post peak economic model or market model has to assume most of the players are either in full denial or if they are in the right positions using the the fact that the market is in full denial to advance their own positions.
Hopefully I'll get some real debate on this but the moment you assume a market is in denial and is incorrectly pricing a asset or resource you get CRASH. In the case of oil this means shortages and price spikes.
Now for the big players with deep pockets that can afford to short the market and hedge effectively and also afford to keep on top of these bottom up signals we can see that someone is going to make some serious cash off of this.
Thus a few will get very very rich and quite a few of the rich are going to be poor. Us mere mortals are going to get our routine whipping. The downside is we can't really use the market itself as a indicator of the state of the oil supply which is a real bummer since don't know when its going to grok peak oil except it will be after we face some obvious shortages or and above ground factor that triggers them.
I think KSA is a bit miffed that the market is not acting rationally and sending them bigger and bigger piles of cash before our economy tanks. We can see this situation unfolding perfectly in the US housing market for example in this case its a glut not a shortage but its almost a perfect alter image of the oil market just replace excess with shortage.
You don't need to be one of the "POD people" to believe a model is only accurate when the assumptions built into the model are true.
Hubbert linearization is claimed to be able to predict future production when that production becomes constrained by geology. How is this model supposed to produce a reliable prediction when the data fed into is from a period when production was constrained by a cartel?
During the period typically used in HL OPEC constrained its production so that world production grew at a fairly consistent 1.5% per year. This kept world per capita oil production at a nearly constant level as some here have shown by previously by posting graphs.
If oil production has not been been constrained by geology alone the data input is likely garbage and as they say garbage in garbage out.
HL has predicted false peaks before, some example I have pointed out are early false peaks indicated by HL for Indonesia and Mexico. Robert Rapier has pointed out examples from Texas. A HL of Saudi Arabia done in 1999 would have predicted a peak then as it was at ~50% of predicted URR. If the oil drum had existed back then westexas would have been repeating endlessly during 2000-2002 that Saudi Arabia's production was declining just as predicted by HL.
Any period of flat or declining production can appear on a HL as being at or near 50% of URR. Robert has show some simulated examples in a previous post. Look at a HL done using data from the 70's oil shocks sometime. Using HL alone it would appear that those oil shocks were caused by peak oil, after all according to HL the world was past 50% it must have been at peak.
It doesn't even take a period of flat production to produce a HL that appears to indicate peak. A significant stepwise reduction of an exponential growth rate after some time can appear to indicate that cumulative production is beyond 50% of URR, which I will demonstrate in a post later tonight down at the end of the thread.
Just curious, why are you so threatened by the Peak Oil concept?
As I have said several times, if anyone follows my ELP advice, and I am wrong, they will have little or no debt, a lower stress way of life, and more money in the bank.
Precisely what are you recommending? That people maximize their spending, commute and consumption?
Let me backfire your question: "Why are you so threatened by the Alan's criticisms?"
Because, as you see, it points nowhere. So many times I've seen big mouths claiming solid science, but when critically asked for rigorous and harsh questions, ad hominems strike: "why won't you believe me? Are you against me?" There seems to be only two kinds of people to you, mr. westexas: the ones that are for you and the ones that are against you.
You sound too much like mr. Bush.
Now pause, stop the sudden urge to backflame and reflect a bit on this: just because people point precise doubts and flaws on your theories, it doesn't mean they're possessed or smth. It means they are really questioning the inner builds of reality, and don't take anything from granted. That's real scientific attitude, if you ask me.
My opinion:
Yes, HL may work well when placed at 50%. But that's way backmirroring, isn't it? Because in 2007 we "know" USA's peak year quite well, as well as russia's and others. It's like saying that "oh, look, US peaked! I'm so clever" kinda stuff. It says nothing about the future global market if you don't know the precise year of peak. Robert Rapier showed us the flaws of HL method when we arbitrarily place it in a random timeline and try to deduct the future out of it. It fails miserably in all of his examples.
Now, am I saying that I'm against the Peak Oil concept? For god's sake, NO! It strikes me as an inevitable consequence. It's almost a no-brainer for anyone that received a scientific education.
But to say that geological constraints are far more conclusive than geopolitical is a little elusive to the real questions that should be discussed:
1 - yes, geology always trumps politics, but that's always in looking to the mirror analysis. Because for us that are stuck in the present, the cornering of geopolitical situations all over the globe pose us the question: "how much is really over there?" Do we know? Do we have access to it? So, yes, geopolitical factors a lot in this. We may have reached a point where oil countries can cartelize without repeating the 73's oil schocks bad consequences.
2 - Imagine the following scenario. Iran and Iraq share a mind-blowing geological factor that was unexplored until now. Political stableness and a new exploration's
boom like we've never seen since the 70's show the two countries have newer resources, climbing to 400 Gbarrels combined. That's a 40% increase in the total URR previously calculated of the planet. Exploration follows and it delays the Peak for another 5-10 years.
How will HL deal with this scenario? Often has been pointed out that it worked fine with lower 48. Yes. But it didn't predicted deep sea-explorations and Alaska, now did it? It didn't predicted North Sea as well. I remember Simmons predicting a Peak in the middle of the nineties, at 60 MBd.
Conclusion:
The oil market is not a free market, and the world has oil in different areas: protected areas, state-owned oil fields, private oil fields, undiscovered oil banks, etc. HL only works in a world without "fog-of-war" and oil totally discovered, without political crisis and technological shifts. In this world, I am able to cast my doubts about HL.
Still, geological Peak Oil will happen and I believe sooner than later. To say when it will happen and how things will unfold is stuff for doom-and-gloom prophets or cornucopians babble-talk. We, the reasonables, deal with each day with a surprise in our eyes and a clear knowledge that life's bigger than any logic mankind has.
Give it a rest Hothgor.
You're really annoying me there, mister. Stop calling me names.
There is not one shred of data to support this fantasy. Most of the Middle East fields were discovered before the Shah of Iran fell. Some predate WWII. If you are going to claim to be reasonable, you are going to need some data to support your position. Something like wild cat wells hitting major oil finds, and then suddenly cut off by the outbreak of a war and never resumed. You have to show the "creaming curve" was not reached for a major region.
A quick look at the discovery curves show that 400bbl of oil are not going to be discovered on land. And very unlikely going to be discovered in deep water. Again, Deffeyes showed 100 bbl max left to find (see Beyond Oil).
Jon Freise
Analyze Not Fantasize -D. Meadows
Thanks for the repply.
In fact, exploration both in Iraq and Iran decreased a lot since the seventies, given the war between both countries and later american's invasion in 1991.
I presented a "scenario". Not reality. Likewise, North Sea's true oil potential wasn't found out before 1973. But it is not a totally "fantasy" scenario. Check this post. Even discounting the forgotten Ultimate Recoverable Oil percentage (around 30%), it seems findings are still afoot in this region between iran and iraq. It surely blows off those median 5bbl per year findings. No wonder US of A is around the area. Some experts even claim that Iraq may contain more oil than Saudi Arabia claims to have.
But precisely, this is the fragility of your method, as you place theory in front of reality. Truth is, the most potential oil discovery region in the world is hazardous with war, famine, violence, terrorism and outright illegal invasion. Not the best place for exploratory investments.
I could name others like Greenland. Not the best place to drill, but still.
Deffeyes showed 100 bbl max left to find (see Beyond Oil).
I don't see Deffeyes as a good source. You must also take into account that those 100 bbl to be found are a probability that only measures what is the current trend, and not what would happen if a new exploratory surge that doesn't exist since the 80's would happen. I don't want to sound cornucopian, my hopes are bleak. But to say that there isn't oil to be found because "the papers says so", is preposterous. Oil is not homogeneous in the world!
Greets, Luís.
life's bigger than any logic mankind has
That is actually cute, I'm sure wittgenstein would agree. If only you wrote something else useful, I may appreciate the overall execution of your comment. So we agree, life is pretty damn spectacular! Moving onwards...
This all leads to the idea that the HL skeptics are:
really questioning the inner builds of reality, and don't take anything from granted.
Interesting way of stating that, it illustrates a lot about how your thinking is operating here. I'll just let that be and move onto the more important matters you brought up.
As for your point 2?
GUFFAW!
Are you here on a weekly basis? Can I watch you perform live? You're either the best comedian the world has ever seen, or a dire Pollyanna (and I don't think you're Lenny Bruce.)
You sir, give the best of 'em a run for their money in the "babble-talk" department... Now for some seriousness.
Imagine me and you in Iraq and Iran, I do
I think about it every day and night, it's only reasonable
To think about the oil you love and hold it tight
So happy together in Iraq and Iran
If I should call your closed market up, invest a dime
And you say you belong to me and ease my mind
Imagine how the world could be, so very fine
So happy together in Iraq and Iran
I can't see me lovin' nobody but you
For all my life
When you're with me, baby the totally discovered skies'll be blue
For all my life
Me and you and you and me
No matter how they toss the HL, it has to be
The only one for me is you, and you for me
So happy together in the Middle East
I can't see me lovin' nobody but you
For all my life
When you're with me, the fog of war will be blue
For all my life
Me and you and you and me
No matter how they toss the "mind blowing geological factor", it has to be
The only one for me is you, and you for me
So happy together
Ba-ba-ba-ba ba-ba-ba-ba ba-ba-ba ba-ba-ba-ba
Ba-ba-ba-ba ba-ba-ba-ba ba-ba-ba ba-ba-ba-ba
Me and you and you and me
No matter how they toss the "surprise in our eyes", it has to be
The only one for me is you, and you for me
So happy together in Iraq and in Iran
So mindblowingly happy together
How is the weather
So technologically happy together
We're happy together
So undoubtably happy together
Happy together
So babble-talk happy together
So happy together (ba-ba-ba-ba ba-ba-ba-ba)
.....................................
All best,
Mr. Unreasonable
Actually, it was Bertrand Russell's saying. Well I think he also thought of it as "cute".
mr f, you are really misrepresenting my point. HL as a predictive tool before peak oil was regarded has having serious flaws previous times, notably by Robert Rapier. According to Campbell, Peak Oil should have been occurred in the nineties with little above 60mbp(!), in the middle of 2000, 2003, 2005 and now people are claiming between 2008, who knows, 2010, 2015. Your favorite man, Deffeyes, claimed that it would span between 2004 and 2008 dates, but then added that he really wasn't surprised if it was already in 2000. Now that's science! Excuse me if I'm a "bit" skeptic about HL. It's track record is as bad as the CERA's track record. Or the USGS's.
Don't know what GUFFAW means. wtv. My point was not a fantasy. It is a low-probability scenario but I've placed it here to show you that if this is possible, it will render late HL predictions completely out of the table. So it is like gambling, really. I really believe that the scenario I presented is actually worse because it will render any scientist warning of impending oil production problems as a nutcase, and peak oil will be permanently shut off. Now, the thing is, HL wouldn't behave nicely according to this scenario at all. It would fail utterly. And that's a fact.
Nice arranged poem, mr f.
Greets, Luís.
Thanks for the compliments.
http://www.google.com/search?q=define%3Aguffaw&ie=utf-8&oe=utf-8&rls=org...
We don't have to imagine. As I noted at the top, Deffeyes observed in the 2001-2002 time frame that the world probably peaked in 2000. However he never backed off his statement that his model showed a peak in the 2004-2008 time frame. He basically observed that the world appeared to have peaked prior to the time period predicted by his model. Note that an observation is not a prediction.
As I noted up top, there are several items that support peak in the 2005 frame--among them high oil prices and the near certain decline/crash of every field that has ever produced one mbpd or more of crude oil.
Not only that.
I happen to agree. The study claimed 2004-2008? Okay. But if so, it was made by a guy that didn't even believed his own study and still claimed in the middle of 2003 that the peak was on 2001 (when all the charts said otherwise). How credible is that? It's like saying "the train is coming somewhere between 20:04 and 20:08, but I believe it already passed in 20:00". Ah! Well, if it doesn't come, no problem, one can "update" the studies. But if it does, wow, that was real science!
This is the kind of stuff that knocks me off these guys. Really. It's worse than crying out wolf's story. No wonder that when anyone quotes these guys, people are shut off. With so many idiots claiming that "mankind never went to the moon" and stuff, our radar for idiots is very sensible.
It may even shut us off some real problems, like PO. But if people start being more "scientific" and stopped saying nonsense like Deffeyes, or even quoting these guys, perhaps, *perhaps* people start taking you seriously.
At least, outside TOD.
Nonsense? The whole 2000 to 2008 range is less than 5% of the projected 200 year oil production era. Yes, 5% accuracy. That is better than you can get out of your car spedometer. That is better than any other technique that has been proposed for the prediction of peak oil.
What technique do you propose that can do better than 5%? Please, enlighten us "non-scientific" thinkers and earn your honorary Phd! (Or you could spend a bit less time posting slander and a bit more time trying to understand the statistical nature of the prediction.) Sigh. Oil is finite. Ignorance? Not so much.
Jon Freise
Analyze Not Fantasize -D. Meadows
gTrout, you don't seem to understand...
See you can't debate with this type of bickering. There is nothing to back it up, except empty emotional rationalizations.
Not only does it entail nothing more than saying "everyone's been wrong in the past, so they're wrong now" but the the post hoc cliche's that are used here by, if I may even call them this, "dissidents"--is unrelenting. So be it, the level of insightful discussion and healthy debate is likewise unrelenting, which makes up for the circus clowns posing as "dissidents" against the real dissidents.
As for the noisome comment "At least, outside TOD"--that is clearly incorrect, it should be at least, inside of TOD, because of people like our esteemed friend luisdias. He doesn't like the fact that others have cried wolf. He's clearly decided to take the mental road to salvation: PO will not be so bad, it may even work out fine (echos of BenjaminCole) and plus everyone is wrong about it! In these peoples' minds zero point energy and feasible, sustainable nuclear fusion balance out to the exact same probability/possibility of democratic institutions and industrial civilization being harmfully damaged by an unmitigated, crash-course PO scenario. That's just science, didn't'cha know? Yippee, all is well in Mayberry...
How are you supposed to convince people that drastic change is needed to avert societal pain if there are droves of people like luisdias at the same time telling the herded masses "all is well, all is well, pay no attention to the man behind the red curtain--everything is fine, we are doing alright, continue as you are... Go shopping, do whatever you do normally but for the love of god don't change a damned thing because we're all just so hunky-dory and life is grand, ain't it?" When people are consistently proposing that all is well, then we are in for an epiphany after it is abundantly clear how fragile the world economy, and modern life as we know it, truly is. Of course, those who care little about modern life, and our future, will certainly shoot us in the foot at every opportunity. This has to be the epitome of overvaluing the present in order to depressingly discount a very uncertain and challenging future. Plus, this type of mentality is what is going to turn into a refuge, a catalyst (and already has), for all the wonderful conspiracy theories that descend from this level of magical thinking. ie. the usual suspects oil companies ripping us off, regulation zealot politicians stopping us from drillin' more, creamy nougat center, ad infinitum. They're also too busy pissing all over our future, and our childrens' future. How can anyone argue against "lets at least try to get somewhat sustainable for our descendants sake"? Well, it seems that some are capable of it... Thanks luisdias! You are preforming a vital public service. I commend your effort.
Hi Mr F,
I don't like to see these kinds of comments go unchallenged because they give people new to the argument the wrong impression. 5% is good enough to know we need to change society (a change that will take far, far longer than the accuracy limit).
I should have been more polite, it can just be frustrating. I guess that means I need to practice my patience as much as Luisdias needs to practice his peak oil prediction skills. Good luck to all of us I suppose.
Fair enough. As for politeness... Now you've got me blushing.
:-D
...
That is a very good assessment of things, actually. When a person cries wolf too many times without consequence, people shut off. Perhaps that person should reevaluate its own speech and the real dangers we face. Because if not so, you are really making an idiot's figure by relying in unknown figures to make predictions. A rebound in the oil market is not that impossible, you know? It happened before a lot of times.
The real issue is energy independence. I've read somewhere here that Opec's in the driver's seat. A very intelligent remark, btw. Does that mean that we've reached peak? Perhaps, perhaps not. Doesn't matter. The problem is that western countries are relying their growth on a blind faith that the "others" will be willing and competent and capable enough to provide that power. This is insane, obviously.
For the record, you are the ones who are "preaching" the future, not me. I can only see a great surface of possibilities, and most of them are bleak. Some are not as bleak, some are terrifying. Most of them will, however, skip HL predictions :).
Where did I say that all is well, mr f? Find me that line. But this is revealing. Your method is basically the same of Matt Savinar's. You couldn't care less of the truth, or the search for it. All that is important is to scare the pants out of people so they start moving ... somewhere. Yeah, but that approach has a problem. If it turns out that you're wrong in a lot of things you say, you're shut off by public opinion. Though I agree, cultists always come back and forgive the "masters" so you'll always have an audience.
"You couldn't care less of the truth, or the search for it. All that is important is to scare the pants out of people so they start moving ... somewhere."
You seem to have your own magic 8-ball, don't'cha, Dr. Luis?
To "start people moving ... somewhere"? What the hell does that mean? And to use your own cultivation of ignorance against you, where did I say that? You are extremely inarticulate.
I am not "preaching the future". I am discussing the future, there is a difference, but you seem incapable of understanding that.
"Your method is basically the same of Matt Savinar's."
What method? Again, you fail to even pass the basic test of your own standards, aka being "reasonable"!
To be blunt: how full of shit you truly are, dear sir. I'm the furtherest thing away from a "cultist" you can find. But I know you're just interested in ad homs, so keep it up, "master" luis.
Ah, but you are forgetting that it was projected only a few years ago. Not that it was projected in 1950's, like Hubbert did.
I have. People have been predicting Peak Oil since the eighties, following to nineties, 2000, 2005, 2008, 2010, some will even predict 2030. I am not dumb. I know where the great probability lies. But of course, peak oil is not about a precise year that will mean the exact half of the oil production. It will be bumpy. Noisy. Precisely because of "above-ground factors". Well, if anything, above ground factors only decrease the oil flow, they cannot increase above geological constraints. So there is a lot of oil undiscovered because of above-ground factors and a lot of oil not drilled because of above-ground factors. This means peak oil is being artificially anticipated by above-ground factors.
Any breakthrough on those factors would wipe out that 5% tag line. But by then, 2010-2015 would be even greater, because it would mean a 2.5% accuracy! Ah! Beat THAT!
are simulated examples constrained by geology ?
I don't think the cartel thing matters. You can have an oil province that is producing with no political contraints but that has some yet-to-be-discovered significant fields. This would be similar to an oil province that had no remaining significant discoveries but was constraining production because of political reasons. An intelligent use of HL should be able to take care of this. All the objections I've seen to HL seem to be based on unrealistic expectations and use of HL as a precise predictive tool, which it is not. This is kind of like the famous 'srawman' argument.
What I like about HL is that it is based on actual historical data and not on the often WAG data of reserves and the even more WAG projections of how oil-extraction projects will develop and come to fruition.
Of course, you are thinking about lower-48 and the discoveries of Alaska and Deep-sea, aren't you? Because those offsetted HL like a lot, specially in the end-curve.
I'm with you there, ET. But there's a problem when people start using HL's predictions by the millimeter, according to yourself. So, when people do it, I can objection to that, Can't I?
Not if Stalin was still around. =]
How about statistical rigor?
will the fact that a logistic curve works very very well at modelling these curves? all of these curves for all fields in existance?
Hi Gil,
Take a look at the production profiles for every UK North Sea field. To save your time, the ones normally described as "giant" would be Forties, Statfjord (which is mostly in Norwegian waters), Brent, Beryl, Piper, Magnus, Nelson, Scott and Cormorant - Thistle turned out to be not-so-giant after all. There is simply no physical, technological, commercial or economic basis for the logistic function.
http://www.og.dti.gov.uk/pprs/full_production.htm
And if someone says that HL works for basins instead of fields, I'll send them right back to the production profile for Azerbaijan - Page 3 of this PDF.
http://www.bp.com/liveassets/bp_internet/globalbp/STAGING/global_assets/...
What I will concede is that exponential decline, or a family of functions of which exponential decline is an end-member, works pretty well for fields where underlying decline in the reservoir (pressure decline, watercut increase or GOR increase) is the main determinant of production rate, i.e. after you've pretty much stopped drilling new wells. There are good reasons for this, founded in physical law (unlike HL). But if you aggregate the production profiles for a bunch of fields with different decline rates, the end result is most definitely not a simple exponential decline curve, even if they're all exponential individually.
Love,
PUD.
Interesting curves from UK. I like the way that the Piper production just stops for awhile and then you recall that a catastrophic fire wiped out the platform at that time.
But if you aggregate the production profiles for a bunch of fields with different decline rates, the end result is most definitely not a simple exponential decline curve, even if they're all exponential individually.
Not really true if you consider that if a field has a fixed extraction rate, then an unbiased, maximum uncertainty aggregate of a bunch of fields with various extraction rates but known mean would quite likely be an exponential. This occurs because an exponential has the property that the mean equals the standard deviation, a maximum entropy formulation.
Moreover, if you do model a single field as an exponential decline, then even for this situation, you would use a Markovian approximation on a group of fields and set the mean extraction rate to be dependent only on the size of the reserve. Because of the memoryless aspect of this process, it would once again work out.
This occurs because an exponential has the property that the mean equals the standard deviation
That is certainly true for the exponential distribution. Oilfield decline is something different. Anyway, what makes you think that an exponential decline curve is the correct model to use for any given reservoir? Strictly, it only applies for high permeability dry gas reservoirs, with no aquifer, producing against a constant backpressure, and a few other highly specific and rare situations.
Obvious to me. The number of taps you can make is proportional to the size of a reservoiir. Which means that the rate of extraction is proportional to the size. And in the aggregate this is even more true. People can stay in the mindset of of deterministic, individual scenarios or they can look at the probability and statistics of an aggregation.
Well I was hoping for something a little more in depth, but this is just a rehash wrapped with a lot of anecdotal evidence and propaganda message. Sure the situation is important, but that doesn't give any extra credibility to HL. I'm surprised you didn't throw in the news piece about people dying in Africa.
Stil no one has adequately explained from first principles why the Hubbert curve applies to oil porduction. The ant colony "its all tunnelling" being one of the most ridiculous analogies so far...
I guess what you are saying here is that HL does not work when people try to use it as a predictive model. When you have most of the data in, then yeah, getting a good curve to fit is easier.
Basically it's just curve fitting, but without a proper model it's not going to convince anyone. HL is not really necessary to the PO argument anyway, the production data pretty much speaks for itself.
I guess the implication of the following chart, from an article posted more than a year ago, was a little too subtle:
http://static.flickr.com/55/145186318_27a012448e_o.png
In any case, as I outlined at the top, starting in January, 2006, I started warning of a Saudi crude oil decline, a net export decline and a Russian crude oil decline. Based on all of this, I strongly recommended the ELP proposals.
Deffeyes explicitly warned of a world crude oil production decline, which we have seen based on EIA data, even with the nonconventional contribution.
I literally don't know how I could have been more clear, or more repetitive.
How does a drill bit work ?
Think hard I know its a tough question.
Sorry to be and ass but this is a serious problem and deserves a serious response.
Stil no one has adequately explained from first principles why the Hubbert curve applies to oil porduction. The ant colony "its all tunnelling" being one of the most ridiculous analogies so far...
Does not quite cut it. Prove me wrong.
Give me math or a thought experiment or anything not stupid comments.
The "first principles" proof of HL is pure inductive logic--nothing mysterious about it at all. Until you can find clear counterexamples to HL, then to me it is self-evident that the burden of proof (both evidence and logic) is on you to show either
1. how or
2. why or
3. in what manner
HL is wrong.
It is hard to fool an old logic teacher.
Its also heavily dependent on scaling laws. Just like erosions works the same way for a ditch as it does for the Grand Canyon. Its not just pure inductive logic.
The key insight is to recognize you can take a ordinary anthill and its tunnel system scale it and map it right on top of Ghawar. So don't leave out the power of scaling laws.
And since I'm full of crap...
http://www6.informatik.uni-wuerzburg.de/~kluegl/pubs/1998/kluegl_etal_Al...
http://www.springerlink.com/index/TLGXGG9WJ1AYQ2CW.pdf
http://www.springerlink.com/index/H70202H43502560G.pdf
http://bioinformatics.oxfordjournals.org/cgi/content/full/23/5/619
http://portal.acm.org/citation.cfm?id=1016322
http://linkinghub.elsevier.com/retrieve/pii/S0378475405002090
http://dx.doi.org/10.1162/106454602320184202
http://www.ingentaconnect.com/content/klu/11538/2001/00000063/00000005/a...
http://links.jstor.org/sici?sici=0021-8790(198106)50%3A2%3C387%3AANMOAA%3E2.0.CO%3B2-F
http://ase.arc.nasa.gov/publications/pdf/ACO_SGD.pdf
http://eprint.uq.edu.au/archive/00001116/01/ap_agent_else_03.pdf
http://www.eed.usv.ro/advances/2_2004/
Of course all these scientist recognize that Ant colonies are ridiculous models and have nothing to do with logistic equations. Man I hate to be considered a member of this group of stupid people.
I don't think you are stupid; I don't think you are full of crap. I like your comments.
Nevertheless, the HL model is based on pure inductive logic as its basis, with a bit of deduction tacked on to clarify issues.
"Scaling" as I see it is not relevant to the issue, because rather than looking at "scaling" situation, what is going on mathematically is much simpler--to wit, adding together many small HL curves to get one big global one.
From the logic standpoint your right. From the physical standpoint scaling laws are important.
http://en.wikipedia.org/wiki/Scale_invariance
For physical correlations asserting scaling laws or scale invariance is important. And sorry Don my snide comments where not for you even though I replied I'm obviously a bit peeved and am now chilling down :)
Some times "righteous anger" is the correct response. The outcome of WT model by itself is bad the addition of my correlation or systematic risk model makes it even worse.
This model needs to be proved wrong and so far even jiggling it by up to 100% you don't change the outcome for the complete model its 2-3 vs 4-5 years before a meltdown with a 100% increase in optimism. So the model pretty much has to be 100% wrong. And this I don't see even with heavy discounting you get no material change in the results at best you buy a year or two even with and extreme perturbation.
http://en.wikipedia.org/wiki/Perturbation_theory
It still converges.. So WT can be off by 50% and it does not really change the outcome their is nothing subtle about the situation its not a splitting hairs issue it either needs to be proven 100% wrong which would basically require disproving peak oil regardless of the model used or he is right because of the nature of the ExportLand model close is good enough.
So fractals?
it is well known that many obejects in nature are fractally based.
the small ant colony is the same as the large one, if you don't know the scale.
Same with many coastlines. Doesn't matter how far you zoom in, looks the exact same.
Same thing applies here to oil fields, doesnt matter how big the fields are, the cumulative production is logistic.
it's the same with organism growth in cultures, resource exploitation is the same.
Fractals are cool. I'm not sure we have enough data on the various important variables that effect oil production to even do a good logistic model much less fractal modeling.
I'm happy enough if someone shows up to argue oil production is not logistic on theoretical grounds. Maybe given this discussion someone with the needed data will do the modeling.
You would have to work for a oil company and have access to a lot of insider information to be able to prove HL is a good model.
Wait didn't someone named Hubbert already derive a logistic like equation from well logs and completion dates :)
Then give it, instead of merely claiming it exists. You'll find that a substantial number of assumptions are required, making belief in HL's effectiveness more a matter of faith than of fact.
Which should hardly be surprising, of course, since that's pretty much the case for inductive logic in general. It does mean that there's a pretty strong onus on those making the claim "HL works!" to provide solid and comprehensive evidence, though.
Why are you using the term faith as if its derogatory.
I have faith that Quantum Wave Mechanics is true but only the haziest of understanding. I have faith in a lot of physical and statistical concepts. In general its because of a chain of trust either in understanding some of what a person has done so I trust other parts of their work or via faith handed down from a professor or teacher who believes the work and maybe understands it. Chains of faith and trust are a cornerstone of Science. If you have no faith or trust in the competence of some one you will never believe anything they do.
And finally your talking about testing this proof with experimental evidence and a model. Thats a test of the proof the claim that HL works rests of the proof.
If you don't believe the proof YOU test it.
If you don't believe me and have no faith thats a completely different issue nothing I can't do about it.
If you have well completion dates well production logs and equipment men employed directly and indirectly in developing a large field that fits HL over a 20-30 year period send them to us and we can test both HL my proof and a large number of potential models we could also use financial info concerning investment decisions. Given my proof I know the data needed to test it. And I know I don't have it.
Maybe WHT is interested enough that he can think of another data set we do have that would work but this is what I came up with. Maybe well completion dates are enough ?
I tend to think that even if we proved wells completed in a logistic manner it would not be enough for most of the people that doubt HL and I'm sure doubt a physical model might underly the empirical fit. If you think about the data I asked for and read a bit about logistic systems it takes only a few minutes to see that most if not all of the processes involved in developing a field follow logistic equations thus its no surprise the overall system is logistic.
Indeed logistic models are used to model large engineering projects.
Google
logistic regression large engineering projects
I suspect you did not even try to do the proof or even look through the link or google for other very similar systems that all exhibit logistic behavior. I know you did not even try too set up the variables to equate them since you would then know immediately I don't have the data to test the proof and would not have written this.
OK,
I just observed you haveing your head,and dignity,handed you in a sack.Do you have any more comments on this matter?
The question I asked when this story first broke, is whether Russia was having problems keeping the oil pipeline full:
http://www.neurope.eu/view_news.php?id=75373
EU demands Russia informs Lithuania on Druzhba
One more comment on why oil depletion or peak oil is so problematic. Oil is a bootstrap resource like steel concrete water etc. You need water to grow food to feed the people so they can dig a well.
And example from computer science is most C compilers are written in C/C++ if we lost all binary copies of the current C compilers we would effectively be back in the stone age so to speak and have to redo the bootstrap sequence starting with machine code on up. This is equivalent to a persistent oil shortage in a region it effectively sends you right back to the stone age until the shortage is alleviated.
So bootstrap or intrinsic resources have the problem that if they get to low before you have a substitute it gets almost impossible to create a effective substitute. What this means is as we get closer and closer to the point that cheap oil is not widely available our options for averting the worst effects of peak oil narrow dramatically. Time scales of 5-10 years or worse implied by WT model are effectively to short to leverage our current oil driven economy to create a replacement since energy to do the transition would have to come on top up existing natural growth. So at best with a quick response we are already facing a difficult condition.
In general we would like 20-30 years to transition off oil given the chance even if we are committed 100% to doing it.
And for my own model you can see that optimism or denial only has the effect of making matters worse.
So problems with the supply intrinsic resources needed for the functioning of an economy generally have a significant effect on the economy far greater than the absolute shortfall would indicate.
Norway oil production down 7.4% in May, 2007.
Production at 2.2 mmbod.
http://www.bloomberg.com/apps/news?pid=20601072&sid=aDYLArXEPRfI&refer=e...
Norway peak oil/plateau and linear decline due to finite OOIP, with advances in technology included.
Hi Rainsong,
That important Norway decline was 7.4%, from April to May, in only one month. This means that the entire North Sea production of crude oil & lease condensate (C&C) production is declining at least 10% per year. That's equivalent to a fall of at least 0.4 million barrels/day (mbd) per year. Add to that the decline from Mexico of at least another 0.3 mbd to get a total annual fall of at least 0.7 mbd C&C from the North Sea and Mexico.
This fall of 0.7 mbd is significant as countries capable of producing at higher rates are becoming fewer in number. The positive green bars on the left hand side of the chart below shows some countries that have produced at higher rates in Mar 2007 than in Mar 2006.
Click to enlarge - This chart will be updated when EIA Apr 2007 data is released, before mid July 2007.
Canada’s increase is due mostly to low ERoEI oil sands and will increase further only if there are sufficient inputs of water and inexpensive natural gas, as well as easy environmental constraints. Production rates from USA and Russia are likely to continue at a slow decline. Iraq has potential but is likely to have constant production to at least 2009.
Of the eight countries represented by the eight biggest positive green bars on the left of the chart, that leaves only Azerbaijan, Angola, Brazil and Kazakhstan with the ability to increase oil production. However, these countries might not want to increase production as they become aware of the large declines in regions such as the North Sea and Mexico. These large declines will push prices higher. If a country has an increasingly more valuable commodity, there is a strong economic basis to produce it more slowly as the price continues rising. What's more valuable - a barrel of oil or the $US70 which you get for the oil today? Perhaps that barrel of oil will be worth $US100 in a year.
On balance, total production falls are just greater than total production increases. As Saudi Arabia has peaked, this situation will continue which will cause world C&C production to continue declining very slowly.
Norway decline due to maint.They usually do it May/Jun each year.Ditto for UK NSea(Aug).Pipes get clogged,need cleaning!Should see a rebound after maint.Have a look at EIA mo prod data.
A bell shaped curve is not the same as a parabolic curve.
It is if you graph it on log paper.
| The problem will solve itself.
| But not in a nice way.
The point is that around the peak, just about every curve has the first-order Taylor series expansion of 1-k*x*x. This is basically an "upside down" parabola.
WestTexas said that this can be linearized to some extent, which is true for a limited range; but only for the Logistic derivation is it linearizable over its entire range. Which means that the URR estimate by finding the x-axis intercept is only valid for the Logistic formulation. For other classes of "parabola-like" curves, the URR doesn't come out so clean, but that does not prevent analysts from observing the linearized parts of the curves and jumping to the conclusion that it is indeed a Logistics/Sigmoid type of function that best fits the data points. For all we know the actual URR may be way off, and we only have heuristics to back up the validity of using the Logistic intercept.
Yet IMO, I don't think the URR is actually as important as the year-to-year decrease in discoveries. For instance, we can have a situation where discoveries decrease at a 1/Time clip and mathematically we would achieve an infinite URR -- but this would have little effect on delaying peak. So much for putting too much emphasis on URR.
urr is what lets us predict the maximum of the logistic function, we are just filling in data from zero until then.
And then the date of 1/2 URR is typically used to place the peak position. Which could make a difference if the curve deviates from linear.
I'm no longer convinced that discoveries and URR are really all that independent. If you think about it they won't be since the rate of discovery itself depends on URR.
So maybe its better to say discovery and HL are two independent ways to calculate URR ?
Obviously example of a big deviation between the two approaches would be welcome. I'd like to see a good poster child for HL failing. Russia used to be the best chance.
Do we have a good example where discovery and HL give divergent results ?
All models have conditions under which they fail.
I guess Iraq would be the poster child for HL failing ?
Has ASPO put forward a "standardized depletion" model that they support using instead of HL? I expect that from an Export Land view, the conclusions will not be much different.
The bottom up method and the HL method seem to support each other very well. HL is less prone to noise when you have a rough idea of URR.
Jon Freise
Analyze Not Fantasize -D. Meadows
Just a reminder, since Russia has become so important as an exporter of energy and so much effort has been put into predicting their future exports:
Within the last 2 months a Russian oil official was caught publicly stating that they may very well NOT be an oil exporter by the year 2010...
Do you have a link for the comment?
I just ran some numbers assuming a 10% annual decline rate in Russian production and a 5% rate of increase in consumption. Over a five year period, this would result in about a 25% year decline in net exports, down by 50% in less than three years.
Man, I should save those links to events that I think are important, as I believe this one to be.
I had thought that I mentioned it, or maybe someone else did here just short of about 2 months ago. Possibly in one of Leanns (spelling, sorry) links. I was surprised that not much comment was generated by it, but there were some other very hot items at the time also to serve as distraction. Lack of refinery capacity (ahem, sorry, frog in throat, lol, talk about yer red herring) was a very hot issue at the time.
I must thank you once more for the great quantity of excellent thought put out by you wt, I for one am very appreciative and always give careful consideration to your thinking.
There is one thing that I believe to be quite illuminating but it is an issue that is next to impossible to do quantitative analysis on. I think of it as a 'Rhetoric Indicator'.
It is the level of BS, lies and misdirection put out by the major players and their tone and content. When taken in context of the present supply situation it can be insightful.
At present my personal Relayer BS Indicator, or RBSI, lol, stands at an appx. 80% chance of July and August being extremely huge for exciting times in the oil patch. I do believe we will be seeing the last year high of roughly $78 crude topped quite easily within that time frame.
Must run, I am attempting to learn some of Bruce Lee's moves from "Enter The Dragon" which is starting now. May need them soon.
wt, i just have a question (or two)about your statement
"...we dont get an accurate Qt estimate until we get a P/Q intercept in the 5% to 10% range..."
as i understand it, this means the linear part of the curve is back extrapolated to zero Q.
this is the first i have heard of this. could you (or anyone) expound upon the significance of this. is it just an empirical observation ?
if i understand the statement correctly, P/Q can be anything, but the intercept must be in the 5 to 10% range for hl to be valid ?
Actually, the P/Q intercept is when you extrapolate the line to the left to the vertical axis, and it just an empirical observation. I think that it is primarily related to the post peak decline rate. There is at least a qualitative relationship between the slope of the line and the post peak decline rate, i.e., the steeper the slope, the sharper the post peak decline rate, and there are some upper limits to plausible post-peak decline rates (absent special circumstances like Russia).
As I noted above, the principal outlier (outside the 5% to 10% range) is the exclusively offshore North Sea province (about 13%). But again, here the slope of the line is an accurate predictor of the post peak decline rate (more than twice the Lower 48 decline rate).
Do it yourself HL: http://www.eia.doe.gov/ipm/supply.html
If you click on (I think) 4.1D, you will get the complete data set of North Sea crude + condensate production. Try it yourself. Plot the annual production versus time. And then plot P/Q versus Q, and see what kind of Qt estimate you come up with, and at what percentage of Qt that the North Sea peaked.
Robert Rapier previously discussed how fixed production or linearly increasing production looks like peak in this post
http://www.theoildrum.com/node/2389
One thing that he did not mention and may not have noticed is that even exponentially increasing production can look like peak on a HL plot.
To demonstrate this I created a HL plot for the imaginary middle eastern kingdom of Exponentia.
Oil was first discovered and developed in Exponentia by western oil companies. Being motivated only by profit they developed the oil reserves of Exponentia as fast as they could resulting in oil production growing exponentially at 6% per year.
After 35 years the elderly king of Exponentia died and his son who attended a university in the west took over. The new king, having learned some economics at the university, realized that if Exponentia, along with other oil exporters, slowed the growth of its oil production they could make a larger profit from there exports.
The new king therefore kicked out the foreign oil companies and slowed the growth of oil production to 2% per year.
The following is plots of Exponentia's production over a 60 year period, which includes two periods of exponential growth, the second period at 1/3 the rate of the first.
And the HL of years 35-51 show in magenta in the HL plot and the previous plot.
Note that after 16 years of the reduced growth rate the HL shows Exponentia to be at 50% of URR. ( 160 out of 320)
I assume some people will notice how the data used in the HL appears to produce a curve rather than a line.
The data used in HL of the world also shows this curve.
Conveniently for those who promote HL as a useful way of estimating world URR the upward curve at the beginning is obscured by the recession caused by the oil shocks at the beginning of the period typically selected for analysis.
At the end of the usual period selected there is also a period of reduced demand cause by the Asian currency crisis, the dot com bust and 9/11 further obscuring the curve.
After the recession production turned up to continue the curve that it would have otherwise followed. This is, of course, dismissed by believers of HL as a dog leg up, which they assume foreshadows a sharp decline in production as the HL returns to the prediction based on their preferred data.
Hi Alan,
This is somewhat a reply to the "periods of growth" that you mention below in reference to Stuart.
Yes, a "field" like *cough* SA *cough* can be better defined through periods of growth. For this very reason, I object to raping the HL method with "unrealistic" data.
With your example from exponia, you begin with 6% growth and end the first period with 6% growth.
1st objection: 6% of what? Where did your first year or years come from? I fed your datapoints into my computer and came up with 0,5 - 0,6 production (nice that we don't have to worry about units in theoretical curves:-).
2nd objection: Your constant growth is not the way the bell curve works at all. That would be a geometric curve.
An exponential curve, on the other hand, grows in growth. Let me give you an example with SA data. 1936-1977:
We're talking about a country (geometria:-) where the private oil companies are trying to produce as much as possible, right? Skipping SA's first ten years (for the jump from 0% production to any number is infinite growth), it looks like this:
The pink curve is a 5-year average, giving the obvious *exponential* property from 1957-8 up to 1972.
The bell-shaped curve (and therefore HL or WebHubble's Shock model) is mostly defined (as far as I can tell) by the point at which this exponential growth can no longer be carried out.
This happened in SA in 1972. Sure, they may have been able to go to 15 or 20mbpd production, but they could never have kept up even partially a 20% yearly production growth. The growth began falling, not the production.
Please, (and this goes to RR as well), try to figure out what the model is trying to model before debunking it with assumptions that don't fit into the model/situation. I will admit that your scenario was much better than Robert's, by the way.
By the way, HL is based on a model - but in and of itself, it's only a tool, a shortcut, an indicator of what's going on.
Better tools exist. Look to WebHubble for the shock model. Look to my variation, to try to get a URR:
http://www.theoildrum.com/node/2357#comment-168298
There I came up with a URR for SA of about 210-220Gb.
Cheers, Dom
My only caveat with the shock model is its more complex and thus offers a better fit but its not clear how strong its predictions are in the sense that it has a lot more parameters that need to be set and how does the effect the outcome ?
Since it includes directly discovery it tends to model late large discoveries better than HL which is a problem for HL as its currently written. But with that said double humps tend to
get absorbed and you revert to the mean. So the overall result is similar to doing HL on say the lower 48 + Alaska the central limit concepts prevail in time. So for the current HL when discoveries are truly well in the past i.e 10 years your safe. You can see the problem here is the discovery profile is not included as part of simple HL. If it was then the correct answer is probably to model the fields but the result is the same as doing HL on disjoint data sets. If you broke out the individual fields and summed the URR's instead of doing HL on the composite or overall production data you would then not have a double hump.
So you can see late discovery and doing HL on multiple regions is really the same problem. In short any double peaks caused by discovery exist only because of the way your presenting the data they are not real just a figment of the accounting methods being used I can take any collection of fields and generate double humps. For HL the simple solution is decomposition followed by summing.
Now the big trick with HL that drives everyone bananas and even me is this points used to fit trick. The practitioner of HL is applying some serious filtering and smoothing criteria using the human brain to pick out the parabolic curve. Thats both the power and in some sense the weakness of the method since a least squares fit with smoothing and filtering would eventually give you the same answer but at least we have a mathematical form for the rejection criteria. No problem as long as when you do HL you also show me a plot of the curve and the real data so I can also at least eyeball the fit myself. But we still don't have a rigorous definition of the fitness criteria used.
My answer to this is to at least present the error terms for your HL and for the line say 1% above and 1% below the one chosen so we know you at least have some fitness criteria.
I'm happy to eyeball the curve on top of the data since we are good as seeing fit but its sloppy to not present the error terms and at least some data showing the fitness.
The problem is HL is a trick method like a slide rule from pre computer days. I suspect people objecting to it would also object to how slide rules work. I see how it works but given we have computers why expose the trick instead you can used HL to give the initial conditions for minimization using non-linear least squares methods and get the same answer but hide the trick since it seems hard for some people to understand. I think its cool but I think slide rules are cool :)
I will admit that your scenario was much better than Robert's, by the way.
I threw many scenarios at it - real and contrived - and showed one time after another that it failed to accurately predict a peak. That's why I consider it a useless tool. It tells me nothing. It says "peak might be this year, or it might have been 5 years ago, or it could be in 5 years." As I showed (one of those many scenarios) it would have predicted a Texas' peak for 17 years. That is not a scenario. That is reality. My scenarios were only designed to show how it would behave given specific pieces of data - one of which was very similar to the behavior of KSA.
Ok, Robert, let's differentiate.
Your contrived mathematical sets are, like WesTex says, a waste of time and (like I say) a rape of a "perfectly good" model.
ON THE OTHER HAND, like all models, especially because of its shortcut approach, HL has clear drawbacks.
1) Your critique on the applicability to the Texan and KSA situation is VERY WELL FOUNDED. Any partially well-trained statistician looking at the graphs and being aware of the HL method will see the problems in these cases. HL is an eye-baller, like Memmel says.
Therefore, using only HL alone for SA (and the world, for that matter) is irresponsible. It needs to be tested against other models.
Therefore, we need a model against which the HL model can be tested. And, as a further model, the new model would need to be tested against other information.
2) Please show me your complementary model (Have you already done this, do you have a link?). I am somewhat partial to the shock model. I demonstrated my hybrid model, one that does not constantly push URR higher and one that indicates peak a decade or two before it happens.
Texas in 1955:
As you can see, URR is about 66Gb, which is still ca. 2Gb higher than present estimates
Saudi Arabia (all data, please forget all data past ca. 1979 to verify model):
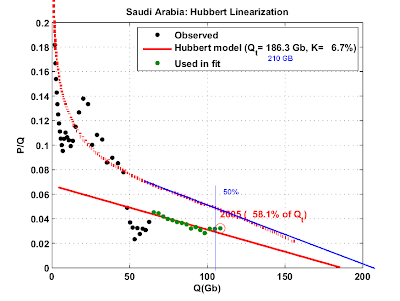
This was the chart I posted in March. If I were to redo the data (a time comsuming aktivity), only using that up to 1979, I come up with a URR of ca. 225Gb. That puts 50% at 112,5Gb which was reached ca. 2006, right?
Why is this model more descriptive than pure HL?
HL uses the last data points to find a conclusion.
Mine asks the question: When was exponential growth no longer POSSIBLE ? (SA doubled production from 2 to 4 and from 4 to 8 very quickly. 16 would have been possible. 32 WOULD NEVER HAVE BEEN IN THE LEAST BIT POSSIBLE)
3) These models are NOT very precise - an error of a couple of years should be accounted for. I don't think even WesTex claimed otherwise. Remember, we're concerned about world peak and not restrictively SA's. The sum of the models insist that we have reached peak/plateau. Do you have a different conclusion?
Thanks!
Dom
What type of curve are you fitting the data with? What I see on the graph looks like normal fit for the lower 48 Dave Rutledge posted here:
http://www.theoildrum.com/node/2697#comment-206082
Interesting. I wish there was a place you can place an extended post of the exponential growth inflection point.
Despite claims made that I do nothing I did do a review of HL when Robert posted his first post on the subject.
I sent him my results and he never responded.
1.) HL used correctly is a easy quick way to do curve fitting.
Simply looking at the fit is sufficient to ensure a good fit.
This is true in general with curve fitting looking at the results is a important part of the method.
2.) If you believe the HL anaylsis is in error or want to test other fitting functions a wealth of methods are at your disposal this is and extensive field.
Many are based on the concept of non-linear least squares fitting and their is even a javascript page that allows you ti fit.
http://statpages.org/nonlin.html
This is a iterative minimization method and it gives error terms etc etc.
My response to Roberts assertions is if you don't like HL use this method to fit and its fairly easy to get good error terms.
Next its not clear why we are not doing it this way and treating HL as a first approximation to a minimization routine. But on the same hand your free to do so yourself if you question the fit.
Robert never tried these methods no one questioning HL seems to have the basic mathematical skills in this area to do the obvious steps needed if you question the HL results.
I've laid out a well known approach that produces the information needed to question a curve fitting procedure and it goes unused ?
3.) The fact that people questioning HL don't know these methods and refuse to use them when they are suggested as a minimum first step in criticizing a model and the fact that the second time this has come up non-linear least squares fitting was not suggested even by Robert who has had this information for a while bothers me.
This is not rocket science.
And finally I learned to programing from Numerical Recipes in Fortran and all I did for 4 years was numerical solution for chaotic systems. Your free to decide if I have a understanding of the problem or not. Unless I see the results of some non-linear least squares regressions or other minimization technique I see no reason to even consider the arguments being made that HL is wrong. So at least do the basic steps needed to create the argument against HL.
Can't argue the math.
This points out that we shouldn't use HL in isolation. For example, in this case of Exponentia, it would be nice to see the hypothetical curves for discovery. Whether that showed a current decline or an increase would make all the difference in the interpretation of the linearization.
Well if I was bored I could make up some for you to interpret.
Speaking of discovery, Laherrere uses a Hubbert curve in his projections but instead of using HL to estimate URR he uses another method, discovery creaming curves IIRC, and fits the Logistic curve to the get the projected production. I think this would be a more reliable way of using Hubbert curves.
Sorry I don't get the point if you know the real curve is not close to at least parabolic then fitting to the logistic is simply a bad curve fitting.
As far as a good example of Exponentia goes Iraq is probably a real world example but years of sanctions and three wars tends to distort your production curve. Actually for Iraq I'm not sure the discovery model even works.
In fact digging back Iraq was brought up the last time we went through this exercise.
http://www.theoildrum.com/node/2357#comment-168214
So sure HL can fail in a real world case. I might add this this is exactly the sort of situation that I expect to cause
HL to fail to predict production post peak. So after we have a world peak above ground factors such as Iraq and even Exponentia will come into play to limit production.
But the argument that you know that the curve is not logistic the doing a logistic fit and proving it wrong is the bogus part. Curve fitting is by definition done when you have some a priori reason to believe the data is reasonably well represented but the function chosen for fit. The logic is flawed. HL is just curve fitting their is no deep concepts here and therefore nothing to disprove.
And finally your not including depletion effects in your model at all. The rate of change of production growth does not even map to a parabolic you have a sudden step function from 6% to 2%. You never had the rate of growth begin to slow on the first up slop so no inflection point then again no inflection point on the second curve. You have to pass one inflection point where the rate of growth begins to slow
in a logistic or smooth manner to even try and fit.
A sudden jump from 6% to 2% linear is a huge warning sign that logistic might be a bad function. Let the 6% part of the model pass through the first inflection point and have the growth rate slow then play games I think you will see the fit will be a lot better. With a artificial inflection point then no second real inflection your not going to get
a good answer. So basically the rate of increase in production has to slow from "natural" causes to even hope to use HL. For predictive use this is either a natural slow down in production on the upside or the peak or finally the right hand inflection point but that one is generally not that important. These inflection points are critical for "pinning" the parabola. Otherwise you cannot fit or the fit is garbage but this proves nothing.
And then the tooth fairy enters and drops a bazillion gallons of oil on Exponetia. PLEASE don't use this argument.
Your asserting a priori that the situation is not logistic then slam a logistic fit on the system then your wave your magic wand and show that your added a hidden factor and its really not logistic. This is just a variant of the stupid argument that Robert tried to make.
We are NOT PROVING that oil production is logistic. We are ASSUMING its logistic and curve fitting. The ASSUMPTION of a logistic fit has been shown to provide a good EMPIRICAL fit to other large regions that have gone into production declines.
PLEASE PLEASE PLEASE don't post these stupid contrived examples to some how prove that oil production is not logistic. You look like a friggin idiot Robert made a fool of himself with this already.
Now with that said I am offering my Ant model is proof that the logistic model actually has a strong physical reason for being correct. Thats a utterly and completely different approach and issue and has NOTHING to do with EMPIRICALLY fitting HL to oil production. The logistic curve provides a good fit. A parabola provides a good fit a bell curve provides a good fit to production data. A LOT of curves of this shape fit production data. HL happens to have a lot of nice properties of simply fitting some random curve with at least three inflection points.
PLEASE PLEASE don't go down this path why don't you draw strait lines through your curves and show me how you can prove that you can fit any two points to a strait line thus a model that uses linear fitting has to be wrong.
The logical fallacy of this argument simply blows me away I'm shocked that otherwise smart people keep bringing this hideously wrong concept up it send anyone with a ounce of mathematical sense screaming. Just because Robert made a utter fool of himself with this does not mean it needs to be repeated. Can we quite posting this nonsense ?
If you want to use a model to make prediction you should test it first to see what kind of data could produce inaccurate prediction before you rely on it.
What have we discovered by feeding the Hubbert model various data?
Fixed production (cough)Saudi Arabia(cough) looks like peak oil whether it is or not.
Production that is increasing linearly can look like peak. (Roberts post which you obviously are familiar with)
Exponentially increasing production (provided the rate is constant) shows up on a HL as a straight line, see above
Hardly a surprise, steady exponential = infinite reserves
Exponentially increasing production with a sudden change in rate produces curves that decay toward a P/Q equal to the new growth rate. This creates more opportunities for false alarms.
Don't think the stepwise exponential is possible? Stuart pointed out in this post
http://www.theoildrum.com/story/2006/1/22/04219/1102
that it is possible to fit historical production with a series of exponential curves with the following rates
1891-1929 7.9%
1929-1942 3.9%
1942-1973 7.4%
1973-1979 2.1%
1979-1983 -4.0%
1983-2004 1.5%
This can be used to produce a smooth version of the real data

Leaving the Hubbert linearization for the moment. If oil world production was following a logistic curve the data typically selected should produce a parabola on a P vs Q plot.
It doesn't look like a parabola to me, more like a straight line. Note that the last few years, the years referred to as a dogleg and often treated as outliers are on the line.
What would produce a straight line on a P vs Q plot? Exponential growth will produce a straight line in this case it is a growth rate 1.5% per year.
Now obviously exponential growth can't last forever, even at a low rate.
Leaving that aside, why would you expect HL to produce an accurate estimate of URR when using data from a period with fixed exponential growth?
You can see from my previous post what can happen.
Very good HL debunking there, Alan. It is clear to me that HL only works when we want it to work and thus "fit" it to work. Unfortunately, HL believers will only demean this kind of debunking and portray it as a Peak Oil Denying stuff. Cornucopians will use it as a tool to get Peak Oilers irritated, by pointing out that even HL is not generally accepted by Peak Oilers...
Ahh, science always hurts.
MY GOD are you people this dense. The data set is assumed to follow the logistic equation and your doing curve fitting.
Why the hell are you talking about debunking HL. Its just frigging curve fitting. I can't believe people keep spreading this FUD.
Curve fitting 101
Any data set can be used to fit to any curve.
Two points make a strait line so any data set with at least to data points can be modeled as a strait line.
Any data set that follows a parabolic like growth peaking and decline curve can be modeled by a large family of functions.
One function that seems to fit well and has some nice mathematical features that may or may not be "real" has been shown to empirically have a good fit for oil extraction.
A infinite number of such curves exist we have explored a few alternatives.
This is just curve fitting its impossible to disprove. Your free to argue that oil extraction does not follow a curve but thats has nothing to do with HL.
Maybe a freshman stats teacher can step in and help me.
This 2+2=5 argument is simply crazy its not even mathematics.
At least please read a introduction to the concept of curve fitting.
http://en.wikipedia.org/wiki/Curve_fitting
This is first year college stuff that you guys are butchering its driving me crazy to see such basic mistakes published and believed.
Astounding I feel sorry for your math teachers.
Lets at least back off and work through the basic principals of curve fitting I'm assuming that we are dealing with people that simply don't have the mathematical background to understand HL and curve fitting. Thats ok lack of knowledge can be corrected.
The concept of disproving curve fitting boggles my mind.
Right on cue. :)
Two for two!
Some have argued that HL is predictive.
Others are arguing that HL is not predictive.
Your ranting about "curve fitting" is, frankly, utterly out of left field and displays total ignorance about the discussion.
Yes, you can fit curves. Duh. That's not the question.
The question is whether those curves are accurate predictors of future oil production. And the argument is that these particular curves are not accurate predictors, since examining their behaviour on known test data shows they are strongly biased towards predicting imminent decline.
If you're going to rant, at least rant on-topic.
I'm considering not wasting my time replying.
You can do a linear regression on any data set.
You can do HL on any data set.
If you want to argue the data set is not even parabolic are a collection of parabolic like curves yet represents real world production then we can argue that point.
If its even remotely parabolic then a HL analysis is valid.
You can question if the fit is good enough to believe its predictions but it is predictive. Claiming its not is stupid.
BEING PREDICTIVE DOES NOT MEAN CORRECT !!
Sorry for the caps but the concept of incorrect predictions is not exactly unknown.
I can do a linear regression on your data and predict its always linear increasing or decreasing with a linear model.
Showing me examples where HL predictions are not correct means nothing nor does it mean its not predictive.
Now again if we want to look at real world data sets and talk about if HL is a good way to fit the data and if the resulting prediction is correct thats a completely and utterly different issue. The only restriction I see on HL is that you need the left side inflection point before you can confidently fit and the data used to fit should reasonably approximate a parabolic function. Those are the basic restrictions. Meaningful conversations are possible on the HL fit.
Do your really not understand the concepts used in curve fitting I don't think that are all that difficult.
Forget about HL just do the same exercise presented to disprove HL using linear regression and the assert that linear regression is not predictive therefore its a useless model. Your argument works for any curve fitting method.
Or better prove linear regression works but not HL I'd love to see that one.
I'm serious either do it or quit spouting nonsense.
Show me I'm ranting and off topic and I'll never post on the Oildrum again here's your chance..
Trying to spread FUD about HL considering the seriousness
of what WT is trying to say and if you think two seconds about the number of lives at stack you will realize your stupidity can have a lot bigger effect then you think.
WT model is dead serious and I'm dead serious. We might help
if people get the message about what could happen.
You don't like what I have to say prove me wrong I'm gone.
Heres your chance.
Please go away. Your comments are obnoxious and disruptive. I can only speak for myself, but I am trying to follow this discussion and your lengthy rants are adding nothing of substance to this debate.
At least take a time-out. You are emotionally and intellectually unable to handle this conversation in an adult manner.
It is clear that "Asebius" and "Pitt the Elder" understand HL and have actually practiced its use extensively to be able to post on the topic. They also seem quite intelligent.
Your name-calling and insistence on their "stupidity" make you look like a fool.
I think Westexas can handle this without you. And yes, please consider harder not wasting your time replying.
I think that Memmel is simply frustrated that so people are making so many bizarre attacks on the simple HL method--even as HL based predictions are by and large being validated.
I think that many of the attacks are motivated by a deep seated concern that the HL method is producing approximately correct URR estimates.
Part of the problem is nobody is on the same page. Person A is having an argument with Person B. Person C jumps in and starts arguing against Person A. Nobody realizes that everybody is actually arguing about a different aspect of HL or has a much different concept about what is being argued about. It turns into one big cluster***k and then memmel jumps in screaming that everybody is stupid who doesn't believe what he does and they better prove him wrong (God knows what he is talking about) or else.
Pitt, I think is doing a good job breaking things down into provable, debatable points and asking simple questions and he is being called an idiot. Go figure.
Prove me wrong. When Robert who I highly respect presented this argument originally I was no less dismissive. And outside of this brain fart on his part and regardless of what he thinks of me I hope he realizes I have the absolute highest regard for him. These arguments have zero basis in FACT and thus are either pure FUD or simple ignorance.
So either prove me wrong or drop the argument.
If you prove me wrong WT is wrong and peak oil is out past 2010 and effects out past 2015 even with export land and I've already decided how I'm going to handle peak oil and other issues so I no longer need to post.
If however WT is right and Ace is right and worse I'm right we have less than two years before serious issues start effecting the world. Thats not a lot of time and it puts a crimp in my own personal plans.
Serious well thought out arguments are important now.
Can someone come up with anything to bolster the later peak date. And I'd love to see them instead of FUD simply for personal and selfish reasons. Right now I live only a few miles from the place I expect to be ground zero once WT exportland kicks in.
Now all I've asked is that you take the same data and use linear regression instead of HL to prove that linear regression has no predictive power its a simple request and I'm pretty interested in the response if people want to peruse this argument. The argument being made need not involve HL at all. A argument that fails for the simple concept of linear regression is not exactly one I hold in high regard sorry.
BTW as far as HL itself goes I did it enough to figure out how it worked and see no reason to use the method except to find good initial conditions for a standard least squares minimization with filtering.
Thats where I personally stand on HL the results or fine but more rigorous approaches are well known.
Prove what? That HL has incorrectly predicted a peak in global production for the last 8 years? OK, how's this - it has. There you go.
It's okay, it's just as easy to ignore you. Bye.
When Robert who I highly respect presented this argument originally I was no less dismissive. And outside of this brain fart on his part and regardless of what he thinks of me I hope he realizes I have the absolute highest regard for him.
I don't have consistent Internet access at the moment, so I probably won't respond after this. But your constant insults over this matter need to be addressed.
First of all, it was not I who was made a fool of. I am not the one who religiously clung to the HL even as I showed time and time again cases - real and contrived - where it predicted, or would have predicted a false peak. You disagreed, and I kept trying to get you to model the data yourself. You would not do it. Now, you have admitted that you have "come close to doing some modeling." Give me a freaking break.
Do you know who agrees with my analysis? Stuart does. I think Khebab does. I think WHT does. I know they all agree with my finding that the URR tends to creep out farther and farther as time goes by. Of course these are people who have actually done some modeling of the data - unlike yourself. I have done a lot of modeling in my career. I understand what makes a good model. A model with a high rate of false positives is not very useful. A model that gets it right sometimes is not very useful - unless you know exactly when and why it breaks down.
So, let's review. I showed that Texas would have predicted a peak from about 1960. Brain fart? I showed that Saudi would have predicted a peak several years ago, and that % of Qt has been moving backwards. Is that making a fool of myself? I showed that a region with a steady production of oil would predict a imminent peak for many years. Why you have difficulty grasping these very straightforward concepts, I have no idea. But I can tell you that others who have done a good deal of modeling didn't stick dogmatically with their initial impressions as you have. I would say that you are making a fool of yourself, but you would just dismiss that. But my sincere hope is that you actually do a bit of modeling for yourself, so you can see what the problems are. Until then, you are just an armchair quarterback.
Robert,
As you know, regarding your Texas HL post, you argued against a position that I never took, to-wit that the pre-peak Texas data could be used to predict the peak.
I did take the position that the totality of the Texas data set gave us a good idea of when Texas peaked relative to probable URR, which was later than the Lower 48. I then applied that model to the Saudi HL data set, which is much more stable than the Texas data set, thus my conclusion that Saudi Arabia was on the verge of a permanent and irreversible decline in production: http://static.flickr.com/55/145186318_27a012448e_o.png
Having said that, if we look at the Texas data set from about 1958 to 1965, and ignore the "dogleg up" right before the peak, we actually get a decent estimate of URR (about 50 Gb): http://static.flickr.com/44/145149303_e59bbf9890_o.png
The implication of this is that we should discount the recent doglegs up in the Saudi HL plot, i.e., it's basically further evidence that they are post-peak: http://static.flickr.com/52/145149302_924470eaa7_o.png
I do basically agree with Memmel that your use of contrived mathematical models was a waste of time. Why not focus your efforts on real producing regions like the Lower 48 case history? Or how about the North Sea or Mexico? I continue to be amazed that the HL critics basically pretend that the Lower 48 doesn't exist.
My offline analysis from your first post was I see no reason to do HL.
Why are people not doing non-linear regression fits ?
http://www.graphpad.com/curvefit/
You never answered. No one has answered this simple question.
Next assuming that the logistic curve is valid for a region production is not strongly time dependent in the sense if you don't produce the oil its still their to produce later.
Thus no matter how complex the production curve the production always maps to a logistic.
A way to map complex production to a logistic curve is to identify anchor years where production was not impacted by above ground factors and take year with impacted production and back fill so to speak the production between the anchor years. This is simply smoothing the production curve.
The key is above ground factors cannot make oil appear or dissapear so your free too re flow the "years" that certain quantiles are produced.
WT is doing something similar for Russia.
But if you do the above for KSA you will see that theoretically they should have peaked in the 1990's at between 12-14mbpd and declined there after. The above ground factors that you feel disprove HL simply delayed the peak and lowered the peak production amount. They are now back on curve. I will say that keeping the production at the rate they did for the time period they were able was surprising.
My only answer is the even these anchor years are bit low because they are almost always conservative with production.
Also the advance methods tend to distort the production curve forward at the expense of later production.
HL intrinsically assumes the big fields are early so in the cases you get a big field in late you do the same sort of game backsmoothing production until the curve fits a logistic again. Once back on curve barring another large discovery you can again project future production.
So if you want to quit disproving HL and better explain why HL I don't see the point. I think I'd be happy to contribute and present the above types of changes to smooth even complex regions for HL. So since oil is never created or destroyed and we almost always have a good sample of years which production was maximized aggressive smoothing can be used to determine URR using HL at the expense of the actual date of peak. But given the URR and cumulative production
and a number of years of unsmoothed current production data you can still get the peak year.
Maybe your willing to look at the concepts maybe not but since URR is a constant the complexity of the production curve is not important.
I'm unwilling to even debate your other assertions since I'm asserting that event your reliance on convoluted production curves is probably not a stumbling block for HL.
The critical piece is that you have to agree that the overall production without external forces should be roughly parabolic. If it is parabolic in the unconstrained case then HL works and the URR is a constant. External forces simply act to distort the curve and these distortions can be trivially removed. The only constraint is that what ever curve you decide to smooth production into a significant number of original data points need to stay on curve and you would want the latest data on curve if possible.
Or you can keep disproving HL its your choice. My method shows not only did KSA peak its recent efforts where heroic.
I'm willing and I think able to contribute but why ?
Kazakh and Russian oil exports via the CPC pipeline are down 9.2% since February
http://www.reuters.com/article/economicNews/idUSL0451724020070604
Caspian CPC oil exports fall 4 pct in May
Mon Jun 4, 2007 4:50AM EDT
Hell I'm even willing to help you understand the method.
http://www.perlmonks.org/?node_id=436861
The trick is just a variant of the well know method of weighing complex curves to integrate.
Next the observation is made that if all the employees of Aramaco since they are making major bonus's decide to take a break for two years production drops to zero.
When they get back from the long siesta they open the valves and the oil starts flowing at exactly the same rate it did before and depletion marches on. From this extreme example you see that above ground factors only distort the curve.
For this simple case the fix up is easy you simply move forward any peak prediction by two years. All your assertion
that disprove HL and at least implicitly acknowledge a real underlying parabolic production curve rest on this and this trivial example disproves the assertions. And its actually pretty close to Russia's situation.
All the cases that assume a none parabolic baseline production are simply not represented by known production data.
I agree with R2's concerns. As a supplementary techique it has value, but should never be used in isolation, and especially not to understand the fundamental behavior of depletion. That is enough to drive anyone up the wall.
Its a numerical curve fitting I've never said use it in isolation. I don't think anyone has suggest use it in isolation. I cannot see that it makes any sense in isolation the presentation of the results of the model under the assumption that the audience is aware of all the other surrounding material is not asserting that the model is working in isolation. Considering the wealth of surrounding material it makes sense to focus on this aspect if your discussing results of the model.
As far as a physical model based on concepts taken from ant colony dynamics well a lot of the variable exhibit logistic behavior plus they have constrained resources and discovery concepts etc. A bottom up model based on ants would almost certainly exhibit a logistic production profile.
The empirical fit of the logistic to oil production is very puzzling it bothers me. The last paper on the modified shock model included a logistic term. If a bottom up model similar to ant colonies works then the reason a logistic term creeps in would have physical meaning. Getting logistic fit without some underlying process causing logistic behavior simply does not seem correct. My opinion is you either show the system is modeled by a non logistic equation or you figure out why its showing up. Getting good fits to a logistic then asserting the system is not logistic is not a good answer.
So the current situation of HL as a purely empirical model is not satisfactory.
If logistic behavior is a real aspect of oil extraction then the wealth of modeling done for biological systems is useful.
Next consider the current situation that the basic claim is that oil extraction cannot be model by a simple model.
If you consider all the other complex systems that we routinely model using simple approaches I cannot believe that this is true.
A couple of approaches can resolve this.
1.) A bottom up model developed from biological models can be created to explain oil extraction. This barring a surprise would be logistic in its behavior.
2.) A alternative model with no logistical terms can be presented. It need not have a physical basis.
3.) Do nothing. We are at the point that the models can almost be dropped in favor of simply watching the above ground situation unfold. The important forecasts for the most aggressive models are down too being provable as soon as this fall. So in six or eight months or a year or two at most the models will either be valid or false.
At this point do nothing is not a bad idea our current models cover effectively the whole range of possible outcomes so the facts as they unfold will remove any controversy its not clear that a new model could predict a outcome not covered by existing models. Despite my ranting no one has offered any other approach to disprove HL then presented by Robert. I obviously disagree :) I hoped if someone had a way they would have happily presented it simply to rid themselves of my obnoxious comments. Having failed we are left with what I consider a weak argument at best. I've done everything I could think of to try and get something besides Roberts approach. If Roberts right then a much stronger rebuttal should be trivial and possible with a argument that uses data sets that are at least parabolic.
I happen to think its possible to at least construct such a argument.
So my vote is for do nothing. I'll add that considering the outcome that the most aggressive models are predicting I would have loved to see this controversy resolved since if they are right its getting to late to even cry wolf.
As I pointed out in the post up top, the HL plots for two real life case histories, the Lower 48 and Russia, using only data through 1970 and 1984 respectively, were basically 100% correct in predicting the respective post-1970 and post-1984 cumulative production numbers for both regions.
Is the method perfect? Of course not. But it is a simple and effective tool for producing estimates of URR, that, as outlined above, can be shown to be quite accurate.
As I also pointed out up the thread, the available data, up to and including the recent news about Russia, support the three principal things that I warned about last year regarding Saudi production, net exports and Russian production.
So, what is the probability that events will continue to unfold as the HL models indicate?
As everyone also knows, starting last year I strongly recommended the ELP program. So far, I haven't heard any complaints by anyone who followed by advice.
Now, precisely what is your point? That we can have an infinite rate of increase in the consumption of a finite energy resource base? That we should maximize our spending, commute and consumption?
Precisely, what are you recommending?
Given the fact that events, for whatever reason, are largely unfolding as I warned last year, isn't the prudent course of action to assume that the HL models are correct?
Lets make it simple. You have a parabolic function.
Once you have data points that pass through the zero of the second derivative. I.e the rate of growth of the function begins to decline you have enough information to solve the equation and predict the peak. Thats all HL is doing and its only valid as a predictor if the regions rate of growth has begun to decline otherwise a infinite number of curves can be fit.
Forget about logistic equations just fit to a parabolic function and show it fails if you have passed through a zero of the second derivative. Thats all your doing.
Now West Texas showed me a novel approach for KSA and he assumed that their peak production was the peak so he used the point where the first derivative is also zero. If you assert your at peak the solution for the parabolic is trivial. A neat approach considering the left hand production graph for KSA is a mess.
Its just curve fitting their is nothing to prove or disprove. Your free to offer a different curve that has a better fit for the data and we could do non-linear least squares to show better fits. But this is a common mistake you can make that causes you to lose predictive powers from simple models. In general with this type of stuff the more complex models provide better fits at the expense of any simple predictive ability. The simply have to many knobs that could be adjusted.
Think about a rockets trajectory in the case of a rocket you cant know its final velocity until the boost phase is finished as long as its accelerating you don't no the peak.
All you have done in some cases is show this function cannot be predicted.
Now back to global peak since we have passed the left hand inflection point at which the rate of growth has begun to decline HL should hold and give a valid result in the sense that the model can be applied in a predictive fashion the fact that the system is still increasing at a lower rate is not important and not strictly needed. Obviously for numerical regions you need a good bit of the left hand of the curve to improve the fit but the only strict requirement is that the second derivative has passed through a zero point and the curve is expected to be reasonably parabolic.
Then HL fits the data.
Please stop "debunking" curve fitting. A civil discussion of the correct curve to use to fit production data is possible
disproving curve fitting is senseless considering we have a infinite number of choices.
Some alternate views on the data:
The price of oil is lower than it was this time last year (brent+wti monthly averages), which has been the case all year, suggesting that any additional supply from KSA would push the price down.
If we assume that the price elasticity of crude oil is 0.05 (the same as what the paper discussed here suggested it was for gas in the US), then a 1% increase in global supply - KSA increasing production 10%, back to the production levels of last summer - would see a 20% drop in prices, leaving KSA in a substantially worse financial position than it currently enjoys. Indeed, even doubling the assumed price elasticity - meaning the world's use of crude oil is twice as sensitive to price changes as the US's use of gasoline - still leaves KSA losing money if they substantially increase production.
Now, that may or may not be what's actually happening, but it is one simple and rational explanation for the observed price and production levels.
IEA data shows Russia's production increasing from 9.76mb/d in Oct 06 to 9.86mb/d in April 07, a 2.5% annual growth rate. Q406 to Q107, for which the data is more stable, shows an increase from 9.81 to 9.90, or a 4.6% annual growth rate (although I suspect that includes seasonal factors).
I'm not sure which monthly EIA numbers you're using, but this may be one of those differences between EIA and IEA.
More importantly, though, cumulative production in Russia through April 2007 has been about 139Gb (127Gb through 2003 and 11.6Gb since). If their URR is 172Gb, they have only 33Gb left, or just 9 years at current production rates. In other words, they would have to start an immediate and permanent 11% annual decline in order for HL on them to be correct.
Has any very large, mostly-onshore, oil-production region ever undergone sustained declines in excess of 10% per year? That's six times the decline rate of the US, perhaps the most comparable oil-producing region (in terms of size, reserves, peak production level, and onshore/offshore mix).
Moreover, you've been beating this "Russia is going to crash!" drum for well over a year, with continuing strong growth in Russian oil production the entire time. After a while, it becomes clear that HL isn't a good analysis technique for Russia; Khebab's analysis of the HL results gives some good reasons why that might be the case.
In general, no simple model fits all the real-world data, and insisting one does - must! - takes things from the realm of science to the realm of faith. A model can still be powerful and valuable if there are a few pathological cases it doesn't fit.
The monthly Brent price, post 5/05, has been in a range between $54 and $74, averaging $62, compared to the average price of $38 in the 20 months preceding 5/05. Brent is therefore currently well above its post 5/05 average price.
In the comments section on my original post regarding Russia et al, in January, 2006, I posted the information about the modeling work that showed that Russia had underproduced the HL model through 2004.
You will note that, as I warned, all three of the top net exporters showed lower exports from 2005 to 2006 (EIA, total liquids), and Rembrandt's work showed an overall net export decline from 2005 to 2006. Perhaps this escaped your attention?
In any case, in 2006 Russia "caught up" to where it should be based on the HL model.
In regard to your decline rate comments you are of course correct, that 10% range decline rates for a large producing province are probably unprecedented, but Russia is a special case.
As you know, the Lower 48 showed a smooth post-peak decline. My premise, and a lot of people agree with me, is that most of the recent rebound in Russian production was the result of Russia just making up for what was not produced after the collapse of the Soviet Union.
Mathematically, this basically now requires a steep decline rate for Russia.
Or, let me put it this way:
Finally, I would just reiterate the points I made above. Given that events are largely unfolding as I warned last year, isn't the prudent course of action to assume that the HL models are correct.
Or do you disagree?
Are you encouraging your readers to maximize their spending, commute and consumption?
Yes, we know already - you keep repeating that as if it proves something (save that you seem to have switched to Brent, now that it's higher than WTI).
Going by price data, oil supply is tighter in the last two years than it was in the previous two years. Going by price data, oil supply is not tighter in the last year than it was in the previous year.
Ergo, the price data does not support a "worsening problem" hypothesis. Find new data that does.
Is it so hard to address the points I did make, rather than trotting out your talking points again? I don't actually disagree with you on everything; had it occurred to you that I didn't bring up net exports because I might have agreed with you?
As it turns out, though, the most recent IEA Oil Market Report doesn't break out Russian demand from FSU, but has FSU production increasing from 2005 to 2006 more than demand did. So, upon checking the data, maybe I shouldn't agree with you on this point after all.
Because it has not been "dead on" in predicting much of anything for Russia.
It was substantially wrong (high) until a few years ago, and will be substantially wrong (low) within a few years unless Russia enters immediate and unprecedented decline.
Basically, there are two curves, and we happen to be near where they cross. You're telling me those curves are the same; I'm saying that, no, they're just temporarily and coincidentally near each other.
You asserted that Russian production was on the verge of collapse.
About a year and a half has passed, with continued strong growth in Russian oil production.
I would not call that a successful prediction.
Why would I? One can certainly think HL is bunk and also think overconsumption is foolish and dangerous.
Your constant comment of "...or would you rather have bought a McMansion before Jan 1 2006?" is nothing more than a false dilemma fallacy - there's nothing preventing a person from neither believing your argument nor wanting that retroactive McMansion.
Right now, I can't imagine that anyone thinks that WTI is a better indicator of world oil markets than Brent.
The post-5/05 average monthly Brent price is about $62. The average for 2006 was $65. So, with a Brent price in the $70 range, we are currently above both the post-5/05 average and the 2006 average price.
In regard to my Russian prediction/warning, as I have repeatedly stated, as the data became available I noted in the comment section of the January, 2006 post that Russia was underproduced as of 2004, based on the HL model. They have now "caught up," and yes I expect Russia to show lower crude oil production this year, no later than next year.
As of mid-2007, it is a factual statement that both Russia and the Lower 48 respective post-1984 and post-1970 cumulative production numbers are basically what the HL models predicted they would be, using only data through 1984 and through 1970 to generate the models.
In regard to net exports, Rembrandt has calculated a year over over year decline in total net exports worldwide, and the EIA shows the top five net exports to be down by 3.3% from 2005 to 2006. The top four are down by 4.2%.
Do you deny that net exports by the top five are down from 2005 to 2006?
It's really very, very simple--we are bidding for declining net export capacity.
The US spent a tremendous amount of money and drilled a huge number of wells to get the lower decline rate its seen.
11% for Russia is very probable no way are they going to spend a 10th of what we did to keep production levels up. If anything 11% is probably optimistic I'd not be surprised to see higher decline rates given their investment.
Got evidence for any of those assertions?
It might be easier if you just explained why you disagree with the above statement.
Pitt has many good points. However, I think you've hit on a flaw/frustration with his communication skills. Since he is far from alone in this regard, perhaps we could all remember how communication works.
Communication involves sending, acknowledgment, and validation. When we say something and we have no "valid" response, most of us spend our time repeating ourselves (do you hear me now?). If anyone finds themselves repeating their statements, they should wonder if the other person has any intent to listen, doesn't understand, or could possibly be feeling invalidated.
Pitt, as nice as he can otherwise be, seems to have invalidation issues (puts the bar way too high and isn't very nice regarding this expectation for everyone when it just doesn't matter). Perhaps this makes him feel better about something. It's funny what we unknowingly communicate about ourselves.
Cheer up champ. Don't forget to have fun and make meaningful connections with it.
-Sean.
The 11% range decline number that Memmel suggested is probably consistent with the HL model for Russia.
If we only focus on the production data for the Lower 48 and Russia through 1970 and 1984 respectively, the HL plots indicated that cumulative production would be at about 50% of Qt (a mathematical estimate of URR) in 1970 and 1984 respectively.
The Lower 48 peaked in 1970. Russia based had a plateau, centered on 1984. Many other large producing regions have shown production profiles that are consistent with their HL models, such as Mexico and North Sea.
As I have described several times, US Lower 48 post-1970 and Russian post-1984 cumulative production has basically been what the HL models predicted it would be. This suggests that when Russian production starts declining, the decline will be very sharp.
Based on two key metrics--peak production and post-peak cumulative production--two very large producing provinces have therefore fit their HL models.
Starting in January, 2006, I started warning of a decline in net exports, especially by the top three net exporters. The EIA has confirmed this decline.
As to what the future holds, I have laid out my case as clearly as I can.
Russia is constrained by pipeline bottlenecks. The CPC pipeline expansion is an ongoing project. One East Siberian pipeline is not completed, but is under construction. Sakhalin III is supposed to contain 6 billion barrels of oil. The East Siberia fields more than 6 billion barrels. Kashagan is 13 billion barrels of estimated reserves, it might see one million barrels a day production. ACG in the Azeri offshore is likely to reach a million barrels a day flow. The Russians discovered a north Caspian field initially described as 500,000,0000 barrels and the largest discovery in years. I have read a later report describing it as 2 billion barrels. There were numerous dip closures in the Caspian not yet tested. There was a Russian commentary about the East Siberian projects being the new frontier of growth and that while they are being developed West Siberia is expected to decline. In Kazakh land the TCO fields are not at full flow due to lack of pipelines out of the Caspian. A two billion barrel oil field was discovered near Tengiz this year. Iran has reported numerous undeveloped fields in excess of one billion barrels. Saudi Arabia has the Manifa field project not yet online expected to bring a million barrels of oil a day in production and other undeveloped fields to cushion their production for some years to come. Iraq has multi-billion barrel fields untapped. Nigeria was listing close to 36 billion barrels of reserves and might eventually grow production. A field offshore from Ghana was discovered the other day, estimated at 600 million barrels of oil. China reported 3.5 billion barrels at Bohai Bay. They also reported a half billion barrel field in the Tarim Basin. An Indian Oil company reported an oil field in the Persian Gulf Iranian waters at a billion barrels. It is difficult to determine the size of some discoveries as 10,000 barrels a day production from a drill stem test flow might mean a 30 million barrel field or a 300 million barrel field.
In Canada there is scheduled to be a multimillion barrel per day flow out of the Athabasca and associated heavy oil deposits, some of the fields in Alberta cold flowed heavy oil. In Venezuela the same. There were smaller heavy oil fields in Oman (multibillion barrels) and the Saudi-Kuwaiti neutral zone, Russia and so forth that might be tapped going forward as technology and pricing might improve. Since some have forecast natural gas to peak later than oil, it is likely those who can will switch to compressed natural gas.
and your point is?
A classic case history:
Pennsylvania Anthracite Coal:
http://www.geo.umn.edu/courses/3005/resource.html
Graph: http://www.geo.umn.edu/courses/3005/antracite.GIF
Hubbert Linearization is a useful tool but I do not believe it is sufficiently accurate to be of useful predictive value by itself. However, in the current case we have lots of other data to support the HL information.
I once wrote about the difference between what Hubbert did and what the HL method tries to do. Hubbert did not and never attempted to predict URR. Think about that for a moment.
The HL method is dependent on its own URR prediction and it is my belief that this is where the HL method can be abused. If you want to do what Hubbert did, go read his papers. He started with pre-existing URR estimates plus observed rates of consumption and observed rates of increases in consumption. If you assume the URR estimate is good and that the observed rates are nearly constant, the rest follows almost as easily as an apple falling from a tree.
Where Professor Deffeyes and the rest of the HL crew go wrong is trying to predict URR. Don't try to predict URR with the HL method because Hubbert's own work never tried to do that and there does not seem to be a basis for it.
On the other hand, if you have an existing URR and apply HL to that, it does appear that it can give you a good sense of when you have peaked. In the case of Saudi Arabia, the HL method shows a clear peak if we reject the inflated 1980s reserves numbers and use the prior reserve numbers instead.
HL by itself appears to be susceptible to "false peak" calls. But HL used in conjunction with other data and tools can help nail down peak. In particular, an HL estimate that converges nicely with a pre-existing URR estimate appears to be solid evidence of peak or impending peak.
Ghawar Is Dying
The greatest shortcoming of the human race is our inability to understand the exponential function. - Dr. Albert Bartlett
it is my understanding that Hubbert's predicted range for a Lower 48 peak (1966 to 1971) was based on low case URR estimate of 150 Gb and a high case URR estimate of 200 Gb.
One key point here is that a one-third increase in estimated URR only moved the predicted peak back by five years.
And it is pretty clear that the Lower 48 HL data set was pointing toward a URR in the 150 to 200 Gb range for quite a while prior to the 1970 peak: http://static.flickr.com/45/145149304_a4a72211e6_o.png
Ever notice that the people attacking the HL method avoid the Lower 48 case history like the plague?
Please don't get me wrong, Jeffrey. I like what you and others have done with Hubbert's work and by extension, the Hubbert Linearization method. But I think we have to be cautious. You said yourself that it is not a perfect model and Pitt the Elder noted that even if there are a few outlier cases, a reasonable model is still useful.
The key is to not take HL as gospel by itself. And around here I don't think anyone does take HL by itself. There are the reserve estimates, the very unusual price/production situation we are now in (that you frequently hit upon), the increasing number of existing producers who have entered decline, the rapidly increasing costs of exploration in places we'd never even consider going before, the rapidly increasing costs of producing alternatives, and much much more.
HL is not happening in a vacuum and that is important. HL is a very valuable tool but only one of many very valuable tools.
Finally, Jeffrey, please read Hubbert's 1956 paper yourself. Dr. Hubbert did NOT predict the URR via his own methods. He took a pre-existing URR estimate (the high and the low) and then worked with those. This is exactly why I urge people to apply HL in conjunction with an existing URR estimate because that then allows you to ensure that when your intercept is a reasonable fit to the URR, you most likely have a good fit.
My sole quibble is using HL to predict URR. I don't think that is valid by itself. But an HL fit that intercepts a pre-existing URR estimate? That is useful data!
Ghawar Is Dying
The greatest shortcoming of the human race is our inability to understand the exponential function. - Dr. Albert Bartlett
Your being to stringent the model is more powerful than that.
All you have to know is that the rate of increase in production has begun to decrease. Of course you want a clear sample since its real data. But for the model to be applied this is sufficient. Thats the basic restriction on the model.
Given this the trick question is is this happening because of depletion effects or from external sources and some estimate of URR is a very useful piece of information in judging this.
If your comfortable assuming that the logistic model is a good fit and thats a completely different discussion that I'd love to see perused rationally it sad we never have had a good discussion of the various fitting methods that are possible. But to continue this means you think the curve is basically parabolic in nature then you can fit.
No reason for all the paranoia and distrust this is a really simple problem people have really gone weird for no reason.
This is just a simple empirical curve fitting no case for alarm or crazy theories or attempts to disprove curve fitting.
Now forgetting about curve fitting and going with the rest of your statement. Your generally correct HL is just a mathematical method it neither right or wrong true or false.
You have to use other factors to decide if you think your HL fit is valid if you did a least squares fit the error terms are one part of determining this. But a big caveat with curve fitting is to not overfit you better have some reason to think that your curve is a good one and depending on the numerical fitness is not a good idea esp if the data is noisy. Basically you have to have some reason to have faith in the model over and above simple numerical test of fitness. Its trivial to get a perfect fit thats not the issue.
So again moving forward HL is predictive of URR and has few restrictions.
Deciding if the HL fit is true and correct ( different issues) has to be done by assessing other information good fits for other similar cases is a big part of that. Arguing about HL is senless.
We can argue a lot of things.
1.) Is the data set to noisy ?
2.) Is the data set so far off from logistic that the fit is meaningless ?
3.) Data set is logistic but we have not passed first inflection point because of depletion ?
4.) Above ground factors are causing production changes that make the real growth/decline curve pre peak un usable ?
5.) URR does not match discovery ?
The list of valid questions and issues is large but trying to disprove curve fitting is not one of them and neither are unsubstantiated claims that HL is not predictive of URR the model is predictive you can readily have valid concerns as to if this prediction is the truth but thats a completely different issue.
I'm not sure what more I can say. We can have a incredible and great discussion on HL Shock model other models data quality noise numerical fitness validity of model predictions etc etc yet all we seem to get on this board when HL is brought up are some of the stupidest arguments I've ever seen in my life too "Disprove" HL.
I'm going to do linear regressions through any data set you care to post and would like to see people prove linear regression is false. Maybe then people will realize that curve fitting has zero information content. It how you decide to interpret the fitted curve thats important.
Friggin embarrassing.
Memmel,
Consider Great Britain overall as it hit its first peak and began declining. GB is a good example of a "double hump" because of a subsequent large discovery offshore.
Now if I had fitted the HL curve with data up to the first peak, I would have incorrectly predicted a peak in GB production. In other words there are additional factors, in this case subsequent discoveries, that modified the original curve. I believe that the "double hump" problem is partly why Khebab proposed the "loglets" method of analyzing these things.
I agree that the curve itself has little informational value other than how we interpret it but this is a case where an interpretation would have been wrong. This is why I say we need lots of additional sources of data. And we're getting lots of additional sources of data about near peak right now.
I really respect the value of HL but I don't see it as a flawless predictive tool all by itself. It's just not. But it is highly accurate if you interpret the curve in conjunction with multiple other signals. So I guess we basically agree there. The key though is that I can't personally say that just because HL says we're at or near peak that such information, by itself, is trustworthy all alone. For me, HL is just one tool among many that helps me determine that we are at or near peak. When multiple different approaches start to agree, from HL, to HSM, to bottom up analysis, etc., then we have a much higher confidence factor in our subsequent predictions.
Ghawar Is Dying
The greatest shortcoming of the human race is our inability to understand the exponential function. - Dr. Albert Bartlett
The problem with the early HL fit for the UK is that the P/Q intercept is wildly improbable--about 30%.
True but its still okay since the effect is caused by something that can't be part of the model which is the late discovery of a large field. The Kings and Queens model is a implicit. If we discovered 10 Ghawars tomorrow then Peak would be invalid but the HL still has has whatever validity it had before. Note that your implying that HL is predicting that a King or Queen is missing. The inverse is pretty dang interesting since if you reverse your logic and consider KSA's claims they should also have this sort of early peak far higer than today then we should see the new massive fields come on line. Thus assuming any validity to your assumption the chance of KSA holding half the overall total reserves waiting is almost impossible since they would have had to hit another Ghawar or several other massive fields by sheer accident.
And they would have had the double hump your asserting.
Thus if they had another Ghawar which is needed to match their claims they would have basically accidentally discovered it and brought it into production well before now showing the double hump your mentioning at a much lower QT.
100% agreement. Given all the information we have and HL so far has been a very useful tool we can make a informed decision. WT is not presenting HL in isolation but in the context of a vast amount of information we have collected. Given this data base discussing HL assuming that the audience is aware of the context is well founded. WT should not have to create a 800 page book of supporting evidence each time we want to run a HL plot. And we also have the shock model which includes discoveries. So we have at least two decent modeling tools at our disposal. Pure HL has the assumption that the region under investigation was explored in a logistical manner and that the kings and queens are found early. Also you can and in a large unexplored basin late ( Alaska ). But in all these cases thats where the shock model comes in because it handles late discovery of large fields better.
The reason I like the HL model is that the bottom up methods don't handle depletion at all and thats a pretty critical factor for peak oil. Also other methods for calculating URR using published reserve data are suspect simply be reserve data is highly political. For all its faults HL anaylsis of KSA is one of the key reasons I believe that have peaked. This is coupled tightly with all the other info we have. Put it this way if HL is saying KSA has the oil they claim and someone is arguing its less I'll go with HL. It may underestimate but it tends to not overestimate until a region is well past peak.
Bottom up approaches tend to overestimate. So given that HL's tendency is to over underestimate reserves/production and bottom up tends to over estimate productions and reserves between the two we have a good set of bounds.
Now even though HL technically underestimates in general most above ground factors are negative towards increased oil production events that result in unexpected increases in oil production are rare birds. And of course the discovery data points towards no huge new fields coming online anytime soon. So back to HL the number it gives even though its technically a underestimate is probably correct because all the above ground factors actually force real production down to what the model is predicting even if its underestimating URR. Finally all the late big discoveries that cause the model grief are well in the past now which is one reason we are concerned about peak oil in the first place.
Sooo... taking everything into account you come back to hey the HL numbers are proabably right once you get done considering factors that are not part of the model. My take on HL is its is a really good indicator of the URR of easy oil and tends to get the peak date right because its correctly discounting the extraction of the hard to extract oil. All we care about is the peak date and say five years past peak for these models. After that as I've mentioned a few times the models no longer hold. Focusing on export land and my shortage scenario and you can see we don't need these models 5 years past peak since above ground factors will invalidate any assumptions we have made.
And again back to export land if you include the strong growth of china oil demand we have even more reason to believe we are very close to the date we can forget about models and start paying attention to the exact distribution of oil on a month by month basis. OPEC has already made their position clear and its obvious we won't see cheap oil out of them ever again.
We need HL as a piece of supporting evidence for WT export land and we have a large body of other evidence that support export land if you don't like HL so its not critical.
We need to confirm the decline of Russia WT using HL and the shock model both are indicating decline coupled with obvious lack of investment on the part of Russia its a safe bet we won't see any large increases and if WT is right we will see decline soon. So the last sentence of the last chapter Russia in decline is waiting to be written any day now and we are done with models forever.
Lets hope we keep the internet going long enough for WT to post his told you so message :)
Actually I'm sure he feels the same way I do about my shortage scenarios and would welcome the chance to be wrong.
I think your being to harsh on HL its really a simple method.
If the region of interest has started to show a decline in the rate of increase in production the the number of parabolic curves that fit are small.
A better example would be to use radar information to predict where a rocket or shell will land. We can forget about the complexity of a logistic equations and easily talk about simple parabolic curves around the three inflection points.
http://www.glenbrook.k12.il.us/gbssci/phys/Class/vectors/u3l2b.html
A simple parabolic model is probably good enough.
If you don't want to talk about logistic equations.
Just do a non-linear least squares fit of a parabola to the data. You probably need to filter out the early production data but other than that fit to a parabolic equation then integrate this gives URR.
A parabolic fit is the most primitive case that reasonably follows a system that has three zeros of the second derivative.
Considering that the goal is to predict peak withing 1-2 years out of about 30 years i.e 3% and we assume production data is reliable to say 1% but outside forces distort it to say 5% you get at least a 80% confidence interval around the year predicted for peak. I'd guess its close to 100% if you gave a 5 year confidence interval. HL is probably right within 2-3 years in general considering all the factors.
This is just basic observations. I guess I don't see the controversy esp considering we are talking about regions that are either really close or past peak as measured by other methods.
I believe we are at peak, that the evidence you (Khebab, WT, memmel, et al) is persuasive. Y'all may be wondering what it will take to persuade the 99% of those unaware.
A lot I'm afraid.
You are not only challenging many economic and cultural assumptions, but the historically recent but deeply core foundations of US and perhaps much of Western culture. A social psychologist, Leon Festinger, did much research on a phenomenon he labelled as cognitive dissonance. It is a well investigated theory in social psychology.
If one is highly invested in ideas (unlimited growth, perpetual opportunity, consumption is good), evidence which challenges those ideas and which supports another set of ideas (limits to growth, overshoot, resource depletion) is highly threatening. That threat creates psychological dissonance (the glazed look many of you speak about as you try to explain peak oil to others) which most people are highly motivated to resolve. The stronger one is invested in an idea, the more likely it is that one will resolve the dissonance by discounting the threatening evidence.
Witness the process of educating industry, Congress, and the American people about global warming. Thirty years of mounting scientific evidence of climate change and we have barely budged. It is very rare to have the huge majority of scientists agreeing about anything in the way that we have about global climate change. Yet, we still have many deniers. Among those who believe that climate change is real, there are many who simply don't (or are unwilling to) grasp the implications.
I recently read a quotation from an auto industry spokesman saying that Americans will never accept raised fuel efficiency standards because we love our big vehicles. That is an example of continued denial in spite of acknowledgement of the problem. The evidence says "change or die." The majority of the people say, "no, no, no."
The Europeans and Asians may be more willing to change because they have had less investment in American ideology, but policy makers are not close to grasping what needs to be done.
The peak oil road to changing minds and hearts is rough indeed. There is not the same near unanimity amongst geologists, industry spokesman, and economists for peak oil as there has been with climate scientists and climate change. Perhaps, there is a shift.
My message to you is this: keep accumulating the story, keep telling the story in a way that is faithful to scientific truth as you know it. Be patient because the road is likely long. It is a long, steady, slow drumbeat which will most likely make the difference. Many of you may believe it is already too late, but obviously you persist because you must, because it is in your nature. Our extinction is inevitable: the question is when and how. Good luck to us all!