Saudi Arabia and Gas Prices
Posted by Stuart Staniford on May 24, 2007 - 7:47am
Let me start by providing the latest available data on Saudi oil production:
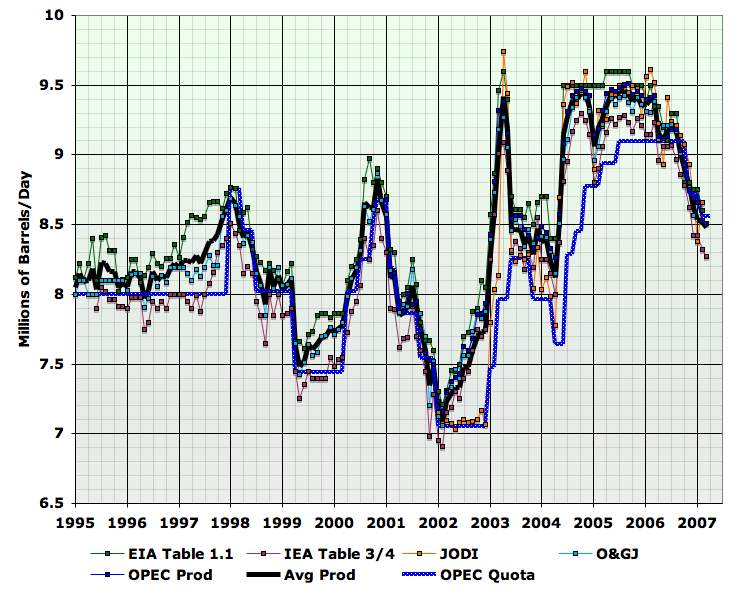
The core issue under discussion is that production is off by about 1 million barrels per day since Q3 of 2004, despite the addition of new projects with a rated capacity of about 1 million barrels per day (the Qatif/Abu Safah redevelopment which was supposed to create 690kbd of additional crude+condensate capacity, and the Haradh III development which should have added 300kbd of crude production capacity).
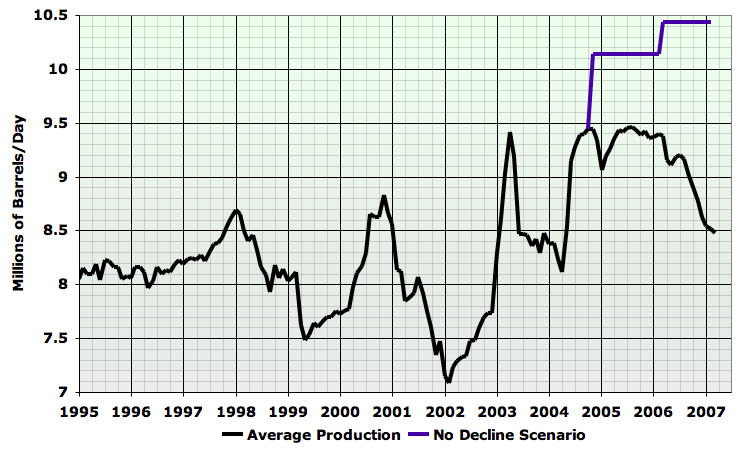
If we imagine that all fields had been on the same plateau as in Q3 2004 to the present day, and we further add in the new projects (dating approximate), we would have had a picture like the purple curve in this next graph:
This situation is one factor playing into the global production curve. Total global oil supply during the economic recovery following the 2000 tech crash recession looks like this:
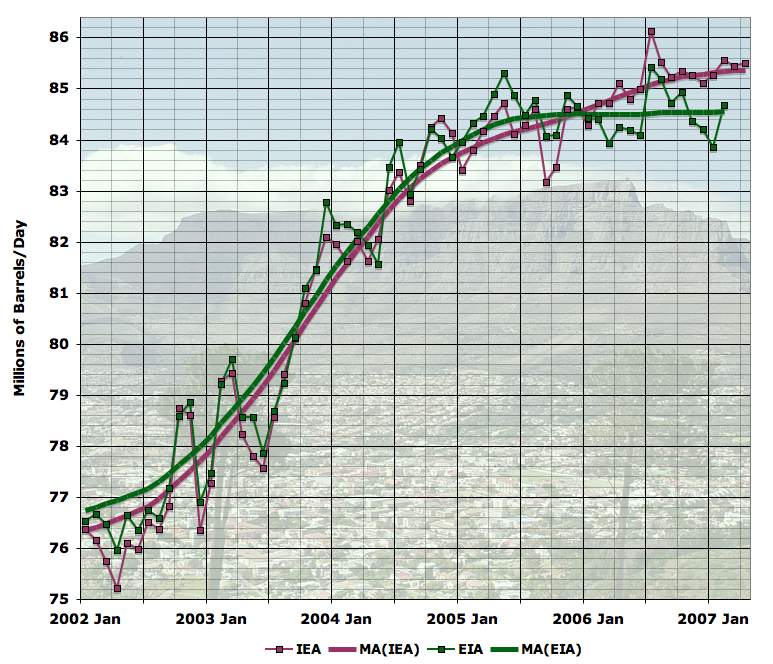
(These are "total liquids" figures - ie they include natural gas liquids, coal-to-liquids, biofuels, refinery gains, etc, in addition to crude and condensate). If you believe the EIA, total global oil supply has been essentially flat for the last couple of years, despite rising prices. If you prefer the IEA's figures, then production has been growing but in an anomalously slow way compared to historical growth rates.
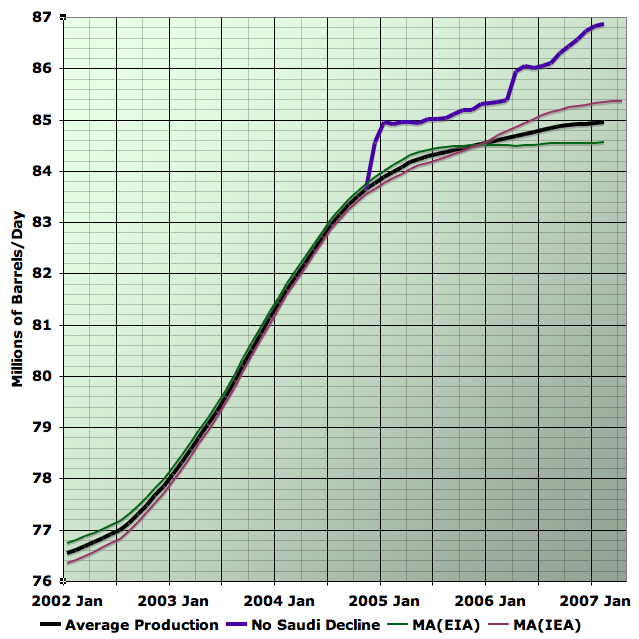
If we add onto the average of the two moving average curves above the difference between actual Saudi production and the hypothetical "no decline" scenario, we get this picture:
Clearly, that would have been a rather different last few years in the global oil markets. But how much of the run up of gas prices can we attribute to this cause?
Firstly, just how much has the price of gas gone up since 2004?
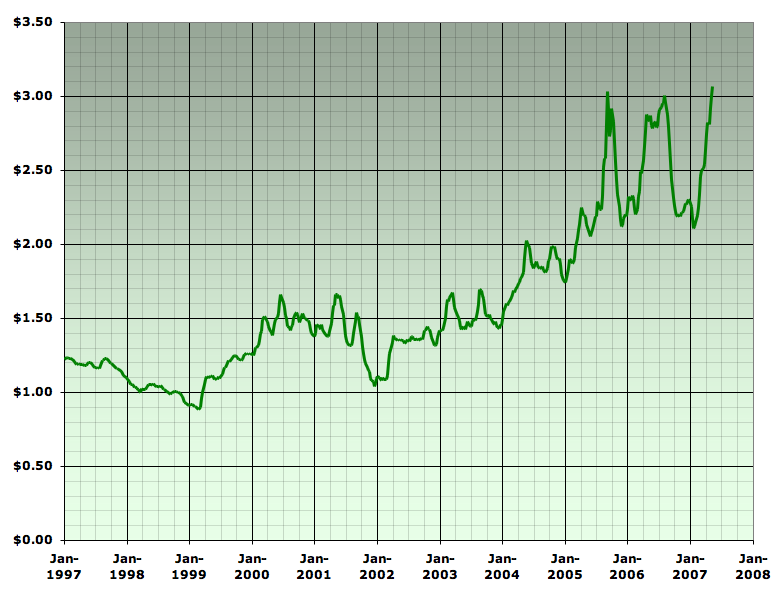
Well, in late 2004 it was around $1.90, and now it's about $3.05. So we have around $1.15 of increase to explain or about a 60% increase in the price.
The next thing to understand is that there is generally an extremely strong relationship between the price of gasoline and the price of oil:
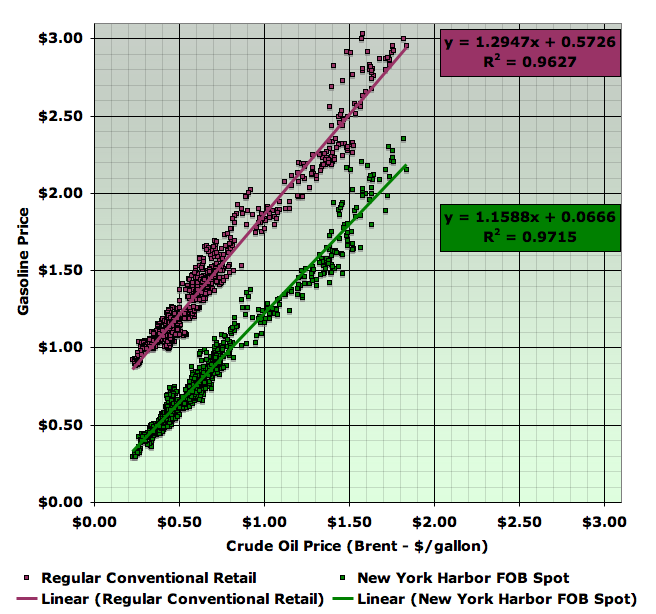
The R2 of 96% at the retail level says that 96% of the variance of gas prices (since 1991) is explained by this simple straight line model applied to oil prices. This makes sense - refiners have to include the cost of crude in the price they charge their customers, and both they are the distributors and retailers probably begin their pricing model by tacking a fixed percentage onto whatever crude costs them. While there is some residual effect that we can attribute to varying refinery/distributor/retailer margins - which are erratically seasonal - clearly if you know the oil price, you usually know most of what you need to know to get close to the current price of gas. Let's look at the time series of gas prices together with the results of the linear model above (which just knows about the oil price, and nothing else):
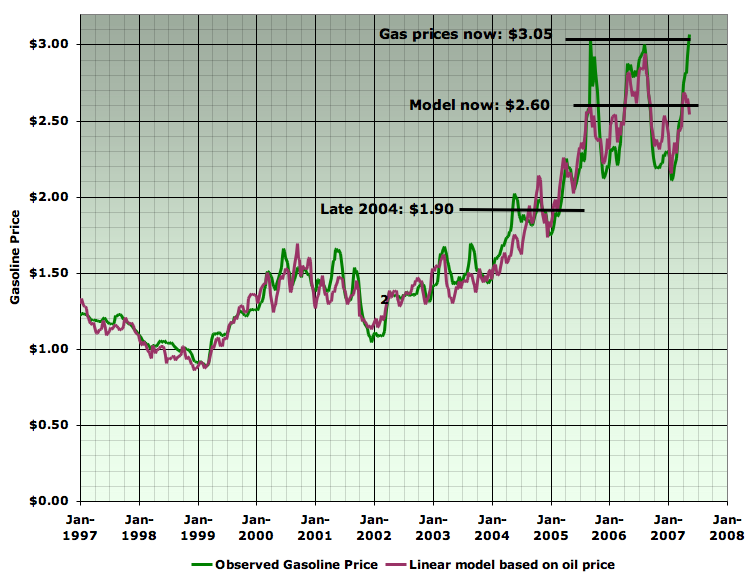
As you can see, although generally this model does pretty well, right now we are in an anomalous period where gas prices have gone significantly higher than oil prices alone would suggest. Likely this is due to the refining tightness discussed elsewhere. So on the graph above, we can attribute about $0.45 of the rise since late 2004 to downstream margins (most of which is very recent and probably fairly transient till BP finishes repairs), but about $0.70 is due just to crude costs.
So then the question is whether 2mbpd in missing Saudi oil production is enough to account for the $0.70 increase that can reasonably be attributed to crude, rather than refinery tightness. Well, that's a $0.70/$1.90 ~ 35% increase. Given a gasoline price elasticity of -0.05 during the period of interest, it would only take a 35/20 = 1.75% reduction in global gasoline supplies to do the job. Since the missing Saudi production is 2/84 = 2.4% of global oil supply, it would appear that, had this not happened, we would have had little or none of the 35% crude-based increase in gasoline prices since 2004.
(Note that I'm not arguing this is the only thing going on in world oil markets. However, I'm suggesting the thought experiment of keeping everything else exactly as it it occurred, and just adding back in the missing 2mbd of Saudi production. It appears in that hypothetical world, we wouldn't have had the crude oil increases that led to most of the recent gas price increases).
One might argue that the world couldn't have refined the extra oil, had Saudi Aramco produced it (thereby causing much larger violations of the historical relationship between oil and gasoline prices). Global refinery utilization data is poor enough to make this a difficult argument to evaluate. However, since they keep reducing their deliveries below contracted volumes to their customers, this doesn't seem the likeliest explanation:
May 14 (Bloomberg) -- Saudi Aramco, the world's largest state oil company, will cut Arab Light crude oil exports to Asia for the first time in at least three months as part of an overall supply reduction to the region.(Note that the production declines actually began at least 12 months before the OPEC quota cut, and earlier than that if one counts the failure of the Qatif megaproject to increase top line production).The Dhahran, Saudi Arabia-based oil producer will lower shipments starting in June, said three refinery officials who received notices and asked not to be identified because of confidentiality agreements. The producer has been reducing Arab Medium and Arab Heavy sales by between 9 percent and 10 percent of total contracted volumes.
Saudi Aramco's supply cuts in the past few months were focused on its Arab Heavy grade that mostly yields fuel oil during processing. Saudi Arabia is lowering exports to comply with 1.7 million-barrel-a-day production cuts agreed last year by the Organization of Petroleum Exporting Countries.
The company has trimmed shipments below contract levels since November. Saudi Aramco lowered exports to Asian refiners in April by an average 9 percent, and the cuts this month and in June are more than the 7 percent reduction in March shipments.
It's the eighth month that Saudi Aramco has reduced exports to Asia.
Finally, for the record, I don't want to suggest that gasoline price increases are all bad. I personally am in favor of high gas prices to promote conservation of precious remaining oil, moves to make the vehicle fleet more efficient and reduced carbon emissions. But if you feel differently about high gas prices, you might want to pay close attention to what Saudi Arabia is doing.
Recent Oil Drum articles on Saudi Arabia:
Stuart Staniford
- Depletion Levels in Ghawar
- The Status of North Ghawar
- Further Saudi Arabia Discussions
- Water in the Gas Tank
- A Nosedive Toward the Desert
- Saudi Arabian oil declines 8% in 2006
by Euan Mearns
- Ghawar reserves update and revisions (1)
- GHAWAR: an estimate of remaining oil reserves and production decline (Part 2 - results)
- GHAWAR: an estimate of remaining oil reserves and production decline (Part 1 - background and methodology)
- Saudi production laid bare
- Saudi Arabia and that $1000 bet
by Heading Out
- Simple mathematics - The Saudi reserves, GOSPs and water injection
- Of Oil Supply trains and a thought on Ain Dar
by Ace
Contact
- Content: editors at theoildrum dot com
- Tech support: support at theoildrum dot com
License

This work is licensed under a Creative Commons Attribution-Share Alike 3.0 United States License.
So on the graph above, we can attribute about $0.45 of the rise since late 2004 to downstream margins (most of which is very recent and probably fairly transient till BP finishes repairs), but about $0.70 is due just to crude costs.
Agree with your analysis, and I think it's a good one. I know what you mean by the preceding statement, but I would say it somewhat differently. Margins don't dictate the price. The price dictates margins. So you can attribute $0.45 to tight capacity, which has boosted downstream margins.
I was working on a gasoline price post, but you may have covered most of the bases here. One thing I was going to hit upon was the influence of a weaker dollar on imports.
Nicely done.
Nice that we're in agreement for once :-)
Superb work as usual Stuart.
Also agree with Robert's point about the weak US dollar. Downunder we are a long way below our record petrol prices due to the strong Kiwi dollar. I haven't even heard anyone mentioning petrol prices for nearly a year. Increasing deaths of teenagers due to street racing is a bigger concern.
Nobody here even knows that Americans are currently complaining about their "high" petrol prices. If they did, they would be disgusted, as NZ prices are much higher, and nobody complains.
Well, the Dollar might be falling, but from the Euro's perspective, it's more like the Euro is rising..
That's Euro compared to yen(blue) and dollar(barchart) for the past 2 years.
Now for the past 5 Months:
By the way, the graphs are inverted to get the right effect..
Here in Munich, we're also getting record gasoline prices, but that seems to have been the case for the past 35 years (mostly because of rising tax levels), so nobody really squeals about it.
---
My grandfather pumped oil with an engine-house,
my father pumped oil with a 20 lb. electric motor,
can't I just pump it online?
If I calculated that right, a gallon of regular costs $7.17 here.
(1 ltr. = 1.39Euro)
Diesel is about 0.2Euro cheaper.
By the way, the chart above is in %:
Top chart 95%-120% (inverse, of course)
Bottom: 97.5%-105%
Americans have both the "right" and the physiology to squeal.
Actually its sad how jaded Americans have become we are not the same people we where 20-30 years ago. I think the passing of the generations that went through the depression and WWII has been a real blow to our country. Whats left is a bunch of squealies.
I couldn't agree more. What has happened to America is one of the central tragedies of the modern era. Henry Miller saw it coming before world war 2. Now the process is more or less complete. "Shithoarders & Individualists" as JIm Morrison put it.
Matt
Wow, I guess since I'm a relatively young'un I never heard that "Shithoarders & Individualists" quote, but that is absolutely brilliant. That alone is a great ultra-condensed liberal take on what is wrong with the world. Heroin junkies say profound things now and again. Lenny Bruce was an exception who said profound things all the time...
Me likey when TOD goes all out USA Today on us and has nice, shiny pictures! Our editor Staniford is seriously rocking it these days. Excellent post.
____________________________________
TOD: On the rise during the descent.
It's on American Prayer. The Doors did it in the 70's by setting some spoken word tapes of his to music. Get it. Morrison was more a redneck boozer than anything else. He was a guy who basically ate himself up over our culture. A martyr suicide.
Matt
I can't believe the situation in NZ appears to be so much different to Oz where our dollar is also strong? Record in Melbourne last year was about $1.44 and today we got to $1.39.
Do you the know the figures for comparison in NZ?
cheers
Phil.
We're running about $1.55 here in Auckland at the moment.
The latest govt budget sets a new 10c/litre petrol tax on sales within the Auckland region to fund Auckland specific transport projects: finishing the motorway system :), electrification of the pathetic rail system, etc...
Nice link for current prices, and comparisons as well as breakdown of price components for NZ from the Ministry of Economic Development:
International and Domestic Petrol and Diesel Price Comparisons:
http://www.med.govt.nz/templates/ContentTopicSummary____20094.aspx
Also, shows some nice graphs giving an indication of the price incl/excl. tax for OECD by quarter (in $NZD of course)
The last swing producer is running out - we are starting to move to true just in time delivery, so to speak, as the last player in the shell game folds.
Storage has lost its role as a 'producer.'
This is meant in a broad sense, not a narrow technical one - for example, what is Aramco's Saudi based storage capacity? Estimates seem to range widely. But at this point, I would guess that Saudi Arabia has played its last ace.
Reality trumps.
Indeed. I seem to remember that, in order to avoid a major shortfall with respect to demand, Saudi Arabia needs to greatly increase its shipments in May/June... The trimming of its deliveries to Asia would seem to indicate the opposite.
Are we getting a clear picture that they can't deliver, yet?
Ace's graphs seem to show a significant difference between projected demand and supply in October 2007, if I remember correctly. But , I don't know whether supply means a producer producing the oil or a producer delivering the oil. If the latter, then I guess that we would need to see greater production significantly before the final part of the year,
Peter.
I agree the official start of peak effect season is a bit later starting this fall and next winter. We are being a bit myopic looking at the coming summer. We may have spot shortages but if so its because of the failure of the market not peak oil. So price alone will ensure that the US market is well supplied this summer. If you look forward however I think you will see that next summer regardless of price the US will not get the oil/gasoline it demands and thats when the fireworks really start.
My pond model indicates a spike in prices in the fall and early winter when historically prices have dropped if the signal is not obliterated by hurricanes we will see real peak oil effects as early as this fall.
Since this is the last summer that I think we will have a fairly normal US summer driving season my suggestion is too enjoy it. I'm not saying be flagrant but I've for example driven less that 300 miles this year I feel I've done my part and its not my fault that the rest of America is full of idiots. By changing my lifestyle I will be able to afford to take a few trips each year regardless of price if gas is available. I feel that real conservation should also have
at least a small rewards part. Next my trip is four adults
and three small kids in one mini van for 500 miles. So I feel even this extravagance is reasonable. If we had good
reasonably priced rail I would have been much happier to do a train trip :) But the cost of train tickets makes it much cheaper to move this many people via car and my actual energy usage may be lower.
Next summer shortages will proabably result in unplanned overnight stays in gas stations.
After that ...
I think I found the answer to Jevons Paradox.
By making a scarce resource a luxury item not a necessity your fairly immune to price increases once the resource depletes.
Next your conservation allows others to over consume putting them at a disadvantage once depletion kicks in. So by being frugal you set the Hummer driver up for a devastating fall once the resource begins to decline your enemies are weakened by playing the game wrong.
This does imply that conservation alone is not sufficient if the resource is still a necessity so buying a hybrid is a good thing but if you still must have gasoline then you have not fully beaten the system only if its a true luxury do you win the Jevons Paradox game. In a sense the only way to win at Jevons Paradox is to quit playing the game. I'd say this has profound implications for how we handle peak oil. Since partial "solutions" like ethanol are not real since they don't beat Jevons Paradox since the amount of ethanol we can produce is finite you will simply have the economy grow or shrink until it consumes 100% of the available resource then financial inequality will ensure that the wealthier people get more and more of the resource.
So moving to renewable does absolutely no good unless the population/consumption is well below the capacity of the renewable resource otherwise market forces will lead to consolidation. This is simply another way to say the only way to win is to not play the game.
So lets say to be safe you need to fix demand at 1/3 of the renewable capacity of the resource. For our current way of life this is fairly draconian but you can see that it ensures basically a endless supply if you stay within the constraints. Efficiency gains and real conservation would be a huge growth area in fact short term use of the extra capacity to implement more efficient future use makes sense.
So this is a even stronger argument. If your day to day usage is fixed at 1/3 of the total available and if up to and additional 1/3 of the resource is reserved for implementing efficiency gains your actually get real long term growth until the system is practically perfect. At that
point if desired the 1/3 restriction could be weakened but I'd think that it would be so ingrained its impossible to change. So growth would then continue by harnessing 1/3's of other resource bases. So using 1/3 of a renewable resource has seems to provide balance.
Its interesting that before fertilizers became widely available this is about the ratio that was used for agriculture for thousands of years.
The difference between gasoline and ethanol.
With gasoline eventually only the very rich will drive.
With ethanol eventually only the rich will eat.
If they survive the "above ground factors". :-)
But I agree, the only way you can win this game is not to play. Taking a bite here and there is not playing because you are not committed or addicted.
The question might be: Will the rich survive?
What is rich?
Dollars?
Gold?
Land?
Buildings?
Look at the Fall of the Roman Empire. Southern Britain is liberally scattered with the remains of quite exquisite Roman villas, and more than its fair share of hoards of gold and silver coinage etc. It is true throughout western Europe. The people abandoned the villas, or for some reason they fell into disuse. The hoarded gold suggest buried with a desire to return some day. They never returned to reclaim the hoards.
I think that when a civilisation crashes, it affects all levels. For sure, those at the top of the pyramid may last longer, but ultimately, the pyramid collapses bringing down all levels. Except , possibly by DNA, who now can claim lineage to the Romans or the Romano-British?
None. There is no lineage of family names back to this period. Only spurious attempts linking dark age rulers with Rome - and these 'bloodlines' are nothing more than spin to cement and reinforce a local victor.
The point of being rich is to ensure your DNA succeeds.
The lack of Roman names suggests none made it. Even the rich. Sure, the DNA made it into the pool, but the pride of the continuation of a family name did not. Thats suggests loss of power, loss of control
It goes further: After the Norman Conquest, all Anglo Saxon Aristocracy disappeared as well.
So the elite of Romano British society failed at the bottleneck in the 6th Century, and the Anglo Saxon Aristocracy failed at the bottleneck of 1066...
The Anglo Saxon peasantry survived. They were useful.
We even speak English rather than Norman French. One historian subscribes that this is because Wet nurses and other household staff were Anglo Saxon rather than Norman.
So perhaps it is not a given that the current elite will survive over the long term.
I think this has a lot more to do with Romans having a modern trade dependent civilization and that they may have not followed the 1/3 rules outlined above assuming instead that they produced food to the limit of sustainability or slightly beyond then yes they would have failed. So they broke this extended ELP two different ways. They where dependent on trade to support core parts of their lifestyle and they did not follow the one third rule. The sheer destruction during the dark ages coupled with the black death thence finding the new world before we again hit the maximum or renewable resources and concentration of power scenario is the only reason we are not living through the fall of the second Roman Empire now.
Some people that think a return to renewable is some sort of glorious new age I suspect they will be sadly mistaken unless we practice these 1/3 rules.
This article suggest that Romans where the Americans of the day and food the equivalent of the SUV of the time period.
http://resourcesforhistory.com/Roman_Food_in_Britain.htm
To my knowledge none of the empires ever practiced 1/3 ELP.
I think a lot of the primitive societies did but they also seemed too have practiced extensive low grade warfare to keep populations in line on top of the natural diseases.
So at least in the past we have little indication of a peaceful way to practice 1/3 ELP but modern birth control offers a route for us to eventually consider it even the simple and effective latex condoms of today are enough.
Hopefully we will have effective male contraceptives before TSHTF for real.
Dear Memmel.
My posting is not much concerned with why a civilisation may collapse, but more regarding the aftermath.
A common assumption is that the elite of any given civilisation survive.
After all, the rich exist to ensure they pass on the DNA that they posess
(...I wonder if they realise that they exist only as draught horses for a primitive ribo-nucleic acid...)
Anyway.
I suggest that the rich, in a collapsing society are no safer, and perhaps at greater risk, than the poor in that collapsing society.
There are no Ceasars, no Arthurs, not even any Godwynsons or Hardradersons, nor Tostigsons or Tostigdottirs.
I humbly suggest that collapsing societies take the elites down as well.
At least by the parameters that elites judge themselves. And that is the continuation of both the familial line and the bloodline. (they are not the same: Mummy's baby , Daddys maybe...)
There will be no Cheneysons or Jennasdottirs in future times. If lucky, they will survive in the common DNA blend.
Any assumption that the elite will survive and outlast this civilisation as an elite is at best, fragile. They may hang on for a while, but somebody will screw it up for them.
There is some serious doubt about the contiuation of the lineage of an English medieval kings line. A small dark line suddenly produced a six foot red-gold haired child. Quite possibly a connection between a Queen and an English bowman while in France.
The tall, red-blond complexion survived through the late Plantegenets, Henry VIII, and into Elisabeth I.
Compare the painting of Richard III with his brother Edward
As I said:
Mummys baby, Daddys maybe...
Sometimes you just gotta laugh
The Bush and Cheney dynasties may end up with Blackwater Mercenary Bastards... Pretty much the equivalent of a Hundred Years War Lucky Archer.
Who knows these things?
As for the Romans: They broke their own rules: You cannot hope to feed an Empire if it doesnt produce something in return.
And you cannot defend an Empire's interests if the elite are exempt by birth and wealth from military service.
Longer term I agree. Generally the rich stay rich by controlling the system that they in effect design. When the rules change few of the former elite make it through to be the new powers that be. So yes long term I agree that the power brokers of today will not make it genetically. However we will live for hundreds of years affected by the decisions made by todays and yesterdays elite. So their legacy will live for a long time if only as curses.
Hi Memmel, its an interesting line of speculation, but I question that the Romans were based on trade. They had a slave-based economy, and their conquest system with looting and tribute paid the troops. Eventually, they ran out of areas worth conquering and their warfare turned internal. The empire fell apart without constant conquests, which were increasingly unweildy to administer. Thats without considering yhe abandonment of Roman pagan virtue and philosophy for the outlandish oriental religeon christianity with its totalitarian worldview.
Gasoline and oil have replaced slavery in our society. their ability to do work is unparelled. As we deplete our slaves-oil run machinery, our American attempt at world domination will fall apart. The illegal immigrants that we are importing faster than we can assimilate will overwhelm our society, just as the Goths and Vandals overwhelmed Gaul and the western Roman Empire.
Hadrian's wall in Britain was what resulted when the exponential expansion of Imperial Rome stopped on its northwest fringes. It didn't bankrupt Rome, but it marked where the expansion failed. The Roman Legions stopped relying on expansion to pay their saleries, but instead local taxes.And soon the warlords became petty kings, the Angles and Saxons overwhelmed the Britans. Stopping expansion killed the traditional Roman model.
Maybe history, if anyone literate and philosophical survives, will reguard our insane wall on the Mexican border and our stupid NAFTA highway as the high water mark of the Industrial West. So, if you are inclined, bury your hoard and go on a last driving vacation.
I like your analogy also. It goes to show how you run a expansionist based economy on renewable resources :)
You make some very good points and this is probably the main reason for the fall of Rome.
I think we are in agreement that the core problem is expansion stopped the slave/oil spigot began to run dry. Wealth concentrated into the hands of a few and society collapsed.
The parallel with todays society is uncanny to say the least. To me the problem is when wealth creation stumbles the natural ability of the rich to concentrate wealth effectively wrecks the society in short order only the continuous flow of wealth can keep the wealthy from destroying their own society in their ravenous quest for infinite wealth.
Note the fact that they where limited to a renewable resources so their decline was generally only from the stopping of expansion this could explain the long time that it took them to decline they did not drift far into overshoot on the resource side. While we are far from equilibrium. But the key is once resource growth stops and declines we can no longer support our ruling class and they in effect strip the wealth from the rest of society to satiate their needs.
Needless to say we can effectively do nothing until this diseased wealthy class destroys itself.
This does indicate the close correlation between the peak in monetary excess and peak export resources at first wealth is pumped in in and attempt to expand the resource base when this fails it is turned to concentration of power at the expense of all else. If you look at numerous countries that have a vast class of poor and a small elite class they are in general also the same countries that have a fixed economic system with no real growth generally its export of some resource or natural products. So to me the ties are quite powerful. Next almost all of these countries have had major financial problems that stop once power is concentrated and more important exports are stabilized.
Of course these countries are unstable to external influences such as invasion etc.
Thanks for your post.
I really hope that computers survive and esp the Oildrum website it will be a great resource for future historians.
I wonder if writings exist from Roman times that showed they knew that they where heading for destruction. You have to think they carried out the same discussions we do today.
I found this.
http://www.amazon.com/Sidonius-Apollinaris-Fall-Rome-407-485/dp/0198144725
Don't know much about it though.
And this.
http://en.wikipedia.org/wiki/Sidonius_Apollinaris
Funny, I don't see "our society" as anything different from the society that the folks standing at the home depot looking for day labor are part of. Where do people get your sense of boundaries, your sense of "us" and your sense of "them"?
I look at the Guatamallan guy looking for work on the corner and I don't have a sense that he is different from me. That could be me, and I want a society in which, if that were me, I wouldn't be treated as if I didn't have a right to be here.
Last time I checked those "illegal" immigrants pretty much came here of their own volition, and weren't imported by anyone.
Don't disagree I used to live in Vietnam and although money was a big differentiator trust me I've no us or them mentality.
I've also lived in the Holly Springs Mississippi which is a third world country inside the US. The problem is abject poverty like in Vietnam and Mississippi is a different beast.
I don't know how to describe it you have to experience real true raw poverty like this. Its not us or them but it is why the Guatemalan risked everything to stand on a street corner in the US for work. So I assure you I don't fear the loss of the American lifestyle crap but this intense poverty is not good for anyone.
Read my post again, I said "If they survive...."
One never knows how it will play out.
If it really collapses very quick then "rich" is anyone that has something the mob wants or needs, whether they can see it or someone informed them.
The most logical scenario in the US at the beginning is that "green zones" may develop in major cities.
No one can really predict it, the rich are usually not very good at street survival but on the other side then can buy the last chopper off the rooftop so to speak.
I think the biggest obstacle is that the best laid plans never survive first contact and this makes it questionable in my mind to commit to a specific plan in advance. There are a good number of basic precautions that can be in place all the time.
If it turns into a end of the world scenario, then who cares, take as many of the fu(kers as you can and save the last round for yourself.
Hi Mudlogger,
Good point about the collapse of the rich at the end of the Roman Empire. I would have to do a bit of research to figure out if your take on the Norman Conquest is accurate, though. The way I understand it, some nobility was pushed north to Scottland and/or fled to Norse ties, changed loyalties etc.. (See Thomas Becket, Henry II.'s Chancellor), where they tended to marry back into the nobility of the region. Maybe this take is somewhat wrong, ...
... but actually I wanted to comment on "French", Anglo-Saxon and the "English" language.
The "French" language spoken on the English Court died out for a number of reasons, even during the 100-Years-War, when the English/Norse nobility was claiming power over most of France. The biggest reason was that the dialect in London was quite different than that spoken on the Seine. It was probably very backwards and "embarassing". (see Chaucer's description of the prioress) Otherwise there is no reason for a society NOT to have a two-class language system.
English, meaning "Middle English" spoken from ca. 1300-1450 was no longer Anglo-Saxon. It was more of a creole - a mix between Anglo-Saxon and French. We eat "pork" (French for pig: porc) but still have swine and sows (the Germanic) in the barn.
English was NOT the language of the original wet nurse (although closer to it).
It was also NOT the language of the Norman French, although sentence structure is closer here than to the Anglo-Saxon.
But I agree:
Long live the Peasantry!
Long live White Trash!
Cheers from Munich,
Dom (an Appalatian hillbilly from the Ohian Foothills..)
----
My grandfather pumped oil with an engine-house,
my father pumped oil with a 20 lb. electric motor,
can't I just pump it online?
Perhaps I should have referred to it as Engelsc or old english.
Some did escape to Scotland after the Norman ethnic cleansing of North of the river Humber. ('The Harrying of the North').
And some made it back home to Scandinavia since by that time, the North English were Anglo-Norse.
Some actually made it to Aberdeenshire (as it now is) and settled, speaking a dialect known as Engelsc.
As for the wet-nurse theory. It is not mine, just apassing comment.
The world is a turning place...
At least in the Southern US the wet nurse theory holds. The southern English dialect I speak was heavily influenced by words and speech patterns from the African slaves and later servants. This strong bond is one reason that as racism receded in both South Africa and the Southern US you did not have as hard a time getting people to integrate as outsiders thought. Racism is learned behavior and generally does not take deep roots until your much older. I think if your interested in and example of cultural collision the more recent American slavery period is useful. Note that in general in the southern US the ratio of African to European ancestry is about 50/50. As a personal note I was raised as a young child by some old Sharecroppers their grand parents where slaves so only their parents were born free and even then only slightly after the end of the American civil war.
So a fairly direct effect of both slavery and the civil war was present in the south into the 1970's. Only after my generation did the chain break. My children for example will be disconnected in the same way from WWII and it will look to them like ancient history. It seems too take about four generations for a horrific event to leave the culture.
The freedom marches of the 1960's are not that disconnected generation wise from the civil war in fact its the first point at which both African and European descent Americans lived outside the shadow so to speak of the civil war.
Hopefully this gives you some idea how major events reverberate through societies for 100 years or more.
Next it looks like the fall of the Roman Empire was just as messy Americans tend to view it as a quick event.
'... to quit playing the game' as a solution to Jevon's paradox is exactly why Cheney describes conservation as a personal virtue.
It is also one reason the United States seems so resistant to change - essentially, it is the leading society which has arisen out of the oil age, much the same way Britain was the leading society which arose out of the coal age.
America would have to become something different, with wrenching changes, if it decided to stop playing the oil game.
Just watching how the price of gas has become a leading topic has been interesting - for non-Americans in industrial countries, a rising price of gas means walking more, or using a bicycle - in Germany, most people have a working one, after all, and the bike paths cover most routes, and riding in traffic isn't generally life threatening.
To a certain extent, Europe (in aggregate) is already following your suggestion - walking home from the store this evening, a TGV passed me - the high speed rail nets are slowly merging here, for example.
Keeping America in gasoline is a cheap price for stability, even if only in the short term - Europeans have a very long tradition of enjoying their comforts as long as possible, without undue concern. And Germans, at least, still think bicycling to a local lake to swim on a 90° day is better than driving a car to an air-conditioned mall.
Not that anyone is actually earning any money from those swimmers (except the ice cream sellers - generally Italians who also make their own ice cream). To be a bit cheeky - as a number of them swim without clothes, you can easily see that enjoyment can be stripped bare, so to speak.
If very lucky, maybe Americans can learn how to enjoy such basic pleasures - no credit card required, just time to feel the sun and water.
>still don't understand why it doesn't matter when you burn the oil and gas. Like coal, it seems like the later we did it the better.
Europe will fair no better that the US will. Those that beleve Europe will survive over other nations are in denial.
1. Europe's population is dependant upon unsustainable entitlement programs. Its workforce is aging as fewer Europeans elected to have children. The lack of a young workforce will result in a collapse of its entitlement programs (especially in a economy that is more dependant on manual labor to produce goods and services).
2. Europe has little domestic energy resources. Already its facing a near crisis as its become dependant on energy exports from Russia. Europeans will still need energy to run trains, heat thier homes, and put food on the table.
3. Europes very large population presents some major challeges. Could Europe even maintain required food production without the use of fossil fuels and petrochemicals for agriculture? Population size is dependant on the available of food to feed it. Oil and Gas provide a means to more than quadrupling crop yeilds will cutting the land use devoted to agraculture in half. Land that was once valuable and fertial farm land is now occupied be dwellings (homes, apt. buildings, factories and offices).
4. Europe's largest industrial states are depend on exports. When true global fuel shortages appear consumers worldwide will cut consumption, wether its BMW's, Phillips TVs or Wines and Cheeses.
An internal transportation system alone does not sustain an empire.
To answer quickly -
1. Since most people here think a growing population is a major problem in terms of resource depletion/sustainability, a stable or declining population is not considered a sign of problems, but a ray of hope over the long term. As for entitlement programs - yes, it is true, Europeans feel that universal health care is a mark of a decent and well functioning society, for example.
2. Germany is developing a non-fuel energy economy - just getting started, true, but getting started is the first step.
3. German agriculture has been attempting to significantly reduce its use of petrochemicals - in part, because petrochemicals seem to have long term effects which are themselves a growing problem in terms of soil. Generally, however, Europe doesn't suffer sprawl in the American sense - the small farmland plot I own cost something like 1 euro a square meter - land zoned for a house currently cost something like 500 euros - the distance between the two is about a kilometer. And when a new area is built, at least in Germany, the community is required to compensate by turning some other parcel into either agricultural or 'natural' land - the town I live in has planted over 500 cherry trees in its orchard to compensate for some new housing areas.
4. 'Empire'? What many people seem to not understand is that Europe existed before oil age, and will be able to exist afterwards. Will Mercedes be a big employer in the region? No, not really, but does this mean that the train system will stop functioning, or the barges no longer use the Rhine? At some point, sure - everything ends. I tend to be a non-doomer, except in terms of the U.S. - Europe will survive, but you are right - it won't be exporting much, and a lot of people in Germany will live like they did 50 years ago - tending land, heating one room with wood, and otherwise spending their time locally.
I can't imagine that in America's suburbia, though.
My perspective is not about business as usual - that won't be the case - but about basic infrastructure. Can Germany, for example, move food from productive land in Eastern Germany? - much was left pretty untended by the socialist system in terms of fertilzer and pesticides - it is in pretty good shape, actually - another reason Germans are trying to cut back on such things, since comparing and contrasting was pretty eye opening.
On the other hand, will climate change cause massive problems? Certainly likely.
In other words, will Europe be able to maintain itself at an 1890s level without total collapse? Possibly. Can America?
Most import is peak oil is a social problem. European society can I believe more easily deal with peak oil than America. They will and have made the right choices. Next most people that take care of themselves can work and contribute well into their 70's I suspect that Europeans will value the contribution of their aging population even if it means allowing them to work part time. Aging should not be considered another type of disability that needs to be addressed. By just working part time esp at tasks the elderly did not get to do in their younger years they could easily contribute enough to cover their own basic costs. I can think of a thousands of jobs that older people can perform well.
In closing any attempt to constrain the overshoot condition in a human manner entails dealing with a large aging population so its a problem that must and I think can be solved.
In other words, will Europe be able to maintain itself at an 1890s level without total collapse? Possibly.
Yes---if and only if all of Europe, and not just France, accepts nuclear fission to replace the coal which drove the civilization of 1890 (at a far smaller population).
Can America?
Enormous parts of suburbia? No.
In other words, will Europe be able to maintain itself at an 1890s level without total collapse? Possibly.
Yes---if and only if all of Europe, and not just France, accepts nuclear fission to replace the coal which drove the civilization of 1890 (at a far smaller population).
Can America?
Enormous parts of suburbia in hot areas? No.
Re "In other words, will Europe be able to maintain itself at an 1890s level without total collapse? Possibly."
To put things in perspective:
In Denmark- north Europe year 1650-1800 the rural society = 95% of society worked with a barley harvest of 5-7 fold - the 5 fold was without manure- and the 7 was with farm manure. I have book "Alexander the Great and the Logistics of the Macedonian Army" citing annual harvests rates of 12-15 fold in the old Babylonic (Iraq)river valleys 500 BC as well as along the Nile with annual floods. So these are possibly the max/min biomass/ food harvest rates possible in a "primitive" setup without fertilizers and pesticides.
Today studies has shown that Denmark could produce 240 PJ annually- for 5.5 million people- from wind, biomass, solar etc.- without nuclear and without fossil energy. This translates into 30 % of present energy use and approximately to 1 ton of oil energy= 6 barrels oil energy per person per year sustainably and "forever".
While this is probably too optimistic, it also shows that we are not doomed but rather that we have to make do with much less and use energy much more efficient. Finally, the fewer we are the better.
kind regards/And1
It may be time to start explaining that nitrogen based fertilizers and pesticides etc are going to be with us for a long time. If we can make electricity we can make fertilizer so assumptions that we will live in a world without chemical fertilizers are false. We may choose to not use them or they may be expensive and thus used sparingly but they will still be available and probably not much more expensive than today.
By that I mean less than 5 times today's cost. Obviously with nuclear power we effectively have as much fertilizer as needed. And we still have plenty of NG/oil left for petrochemical products if we stop burning it as fuel.
I think water/powering irrigation pumps is a far bigger factor in world food production. But Europe should be able to maintain a high level of food production. Also of course the directed use of farm machinery for some tasks such as harvesting makes a big difference. You can easily only use electric/biomass powered farm equipment for planting and harvesting and still get a great EROI. Put it this way the EROI of a horse and a tractor are at worst the same but I suspect the tractor has a far higher EROI used judiciously.
Next of course the tractors themselves could easily be shared amongst a number of farmers we are still very wasteful and redundant with farm equipment.
>We may choose to not use them or they may be expensive and thus used sparingly but they will still be available and probably not much more expensive than today.
You can bet on it that they will be far more expensive. FWIW: Making Fertializer, Pesticides and other critical chemicals using electricity is terribly inefficient. Nitrates and and Pesticides can be produced using pyrolysis much more efficiently then using electricity.
>Obviously with nuclear power we effectively have as much fertilizer as needed.
Ahem. Where does Europe get most of this Nuclear Fuel?
>And we still have plenty of NG/oil left for petrochemical products if we stop burning it as fuel.
Same goes for NG and Oil, Do you believe that Exporters will freely trade NG,Oil and Uranium in the future as they do today? Consider the possibly that NG, Oil and Uranium, become issues of national security and gov'ts will tightly control exports. Assuming that Europe is only able to import a tiny fraction of current energy imports. What's Plan B?
>In Denmark- north Europe year 1650-1800 the rural society = 95% of society worked with a barley harvest of 5-7 fold - the 5 fold was without manure- and the 7 was with farm manure.
What was the population of Denmark and the rest of Europe during that time, and what is the population level today? Your comparing Apples and Oranges.
Back then the majority of the people were directly involved with agraculture. People grew up on rural farms and few people traveled beyond more than a few dozen miles from where they were born. Today, few people are directly involved in agraculture and lack the necessary skills. Most now live in cities and rely on industrialize farming to feed them.
What's likely to happen is that as energy resources deplete unemployment will soar as the export machine comes to a grinding halt. Gov'ts will gravitate towards even greater socialism to deal with rising unemployment and declining energy resources (as they have done in the past). Farms and other basic resources will be nationalized for the greater good, leading to a form of totaliarism as Gov'ts reach for tighter control over strategic resources (food, energy, etc) and reduce personal freedoms in order to reduce crime and other social issues. Gov't will opt for quantity over qualify for food production which foods will be of lower nutrietional valuble leading to rise of malnutrietion and associated diseases.
I also suspect that there could be the potential for war in situations where one European state has a bumper crop and another has a severe crop failure. Nations will be less likely to share food and other strategic resources if food and energy production destablizes.
>Today studies has shown that Denmark could produce 240 PJ annually- for 5.5 million people- from wind, biomass, solar etc.- without nuclear and without fossil energy. This translates into 30 % of present energy use and approximately to 1 ton of oil energy= 6 barrels oil energy per person per year sustainably and "forever".
I very much doubt sufficient sustainable energy and food resources will support anywhere near these current population levels. If it was true then they would need to import far less fossil fuels.
Countries will also need to produce far more food than they currently consume because occasional acts of nature (droughts, cold snaps, investations, blights, etc) will impact crop yields. In the past, Europe faced crop failures that caused starvation and they'll happen again. When the majority of the population was living in rural region, social stresses were less of a problem. Large Cities are much more difficult to control during crisises.
Even if Europe was somehow able to meet domestic consumption, other parts of the world will not. If an act of natural event occurs, and it cuts food production significantly, then you'll have a problem without adquite reserves.
>I have book "Alexander the Great and the Logistics of the Macedonian Army" citing annual harvests rates of 12-15 fold in the old Babylonic (Iraq)river valleys 500 BC as well as along the Nile with annual floods. So these are possibly the max/min biomass/ food harvest rates possible in a "primitive" setup without fertilizers and pesticides.
That was when the populations were very small (compared with today's population). Egyptions and Babylonians only farmed the fertial flood plain and there was a natural balance between the little amount of fertial land and the population. Today, farming occurs many miles from flood plains and countries like Iraq and Eygpt have tapped into the deep aquifers belows the desert sands to irrigate crops. The available land in the fertile flood plains is no longer enough to feed the masses of today. This can be said of Europe. In addition, industrialization has polluted much of European rivers (Especially in the former Soviet block) and the contaiminated flood plains are probably unsuitable for growing crops.
>Finally, the fewer we are the better.
Getting there is the real problem. Most People refuse to lie down and die or go quitely in the night. In the past crisis always lead to riots, revolts and chaos. I would expect this will hold true in the future.
memmel said,
"In a sense the only way to win at Jevons Paradox is to quit playing the game."
BY JOVE, I THINK HE'S GOT IT! :-O
Excellent, EXACTLY on point memmel! :-)
And this is why, I assert, that the with each passing day, more and more thinkers, technicians and "doers" are moving to solar in some form, and some form of solar hydrogen.
At the end of the day, it is the only base that overcomes the problem of "death by 1000 conversions".
With solar, increased consumption of the energy does not decrease the supply! ONLY wind, solar, and in certain locations, tide and geothermal can say this (and even geothermal can pressure can be dropped if too many wells are added too close together)
Solar is the only alternative with a potential base of power in BTU or Kw that is large enough to last for centuries into the future.
Solar can be converted with ever improving efficiency with in most cases, a one or two step conversion:
Solar to heat
Solar to electricity
Solar to electricity to hydrogen
and in certain experimental systems, solar to hydrogen direct in the panel with water and light only flowing, skipping the electric step
Even at the current stage of development, solar is showing more promise than many alternatives have been able to after billions of dollars and and years of work (ethanol, switchgrass, celluostic alcohol, even bio butanol, and tar sands and oil shale, and certainly cleaner and much, much more efficient than GTL or CTL)
Solar has been endorsed and the radical nature of the solution understood by giants such as Edison, Tesla, Buckminster Fuller and Alvin Toffler, among many others.
Even the ethanol and biofuel sceptics Patzik and Pimentel of Cornell see potential in the development of solar and solar to hydrogen far exceeding the possibilities of ethanol.
memmels view is,
"So lets say to be safe you need to fix demand at 1/3 of the renewable capacity of the resource. For our current way of life this is fairly draconian but you can see that it ensures basically a endless supply if you stay within the constraints."
With solar, this is easily possible. Some have argued endlessly that we should go thermal solar, others say PV solar. We will of course go both!
Some have argued whether we should use solar to charge batteries, or should use it to produce hydrogen. We will of course do both!
Some have argued whether the collectors should be on individual homes and farms, or should be on large industrial and retail roof space, or combined at a large "solar farm" owned by the utilities. It will of course be all of the above.
Some have asked whether we should produce power by wind, by solar, or by nuclear, or be efficient in our use of remaining fossil fuels.
As Matthew Simmons once said several years ago, "The argument is not the renewables vs. the fossil fuels....we will need them all."
But the great underlying FACT about the true renewables (in fact, this can almost be considered definitional of a true renewable energy) is that no matter how much is consumed, the volume on the Earth DOES NOT go down.
Sunlight, wind can say it. Nuclear can't, bio-fuels can't, fossil fuels can't.
And for the theorists of EROEI, (I confess here to having doubts about the way EROEI is often used, but it is the EROEI argument that pushed me to the solar option as much as anything else), the EROEI of oil and gas, even if there is a lot of it left in the world, is only going to go down. The EROEI of the renewables, the true renewables that is, is only going to go up. At some point, the two lines will have to cross, and from that point on, a person will be paying a penalty to get to use the fossil fuels. Think of that: Paying a penalty to get to use the dirtier fuel. Paying a penalty to get to undermine the nations balance of payments and national security. Paying a penalty to help our nations enemies. Paying a penelty to get to use oil and gas that the poor of the world still need until they can make the transition.
The paradigm shift is coming much faster than most realize. We are at about with solar energy and solar to hydrogen where the home computer industry was in 1975. Some home builts, kit builts, tinkers working on formats. But the money crowd is getting interested. Nations are starting to see it as a potential national industry. Even strategic thinkers are starting to see the geo political advantage of it.
This is starting to look like the industry of the next third of a century plus. What choices will you and your children make to be on the right side of a revolution?
If you had known for certain what was coming in the cmputer, software, and internet revolution back in the early 1970's, can you think of at least 1000 ways in which you could have made millions?
If you know now that the renewable and solar age are the industry of growth for the rest of our lives, if we are over 35, and for the rest of our career no matter what age we are, can you think of ways to be on the wealth creating, winning side?
Knock off the thoughts of going to the retreat to learn how to plow with donkeys, folks, there is a better future than that awaiting us! :-)
And for pete's sake stop wasting time acting as apologists for the oil companies! They have the money to defend themselves, and beside, in the great scheme of things, like sailing schooners, steam engines and stage coach lines before them, their day of growth and glory has come and is beginning to go.
Allow them a peaceful decline and demise. The oil industry has, and I know this line will get me in trouble, but in my view, it has given us so much. Not just technology, but an aesthetic, a look and feel that has been priceless.
The renewable age is beginning to give us a new look and feel. We are in for a fascinating time! I only wish I were in my twenties again, to be back at the front of this wave, back in the shops and the technical colleges....it is going to be some great time for great talant!
I will shorten what memmel said:
"In a sense the only way to win is to quit playing the game."
The old game, that is! We have been playing against the house, and we know the house sets the wheel so that the house wins.
Quit playing the OLD game. Start playing the new game. It still has a straight wheel and unmarked cards! :-)
Roger Conner Jr.
Remember, we are only one cubic mile from freedom
Gentlemen, it's about time that some of you just caught your breath and re-read the stuff which came out of the Club of Rome in the mid-'60s. There was a lot of Malthusian thinking based on cheap commodities and the consequent high consumption growth rates. The market then stepped in and we went thru a couple of price spike-collapse cycles in '73 and '80. It has been ever thus with commodities. That is, price spikes result in higher production, alternative supplies and conservation.
One cannot forget that new technologies improve the supply and demand sides of the equation. We are getting into areas we never dreamed we could drill: deeper waters and smaller reservoirs. Also, recovery factors for existing reservoirs have increased because of directional drilling. New technologies have also increased our efficiency of use and has the ability to do much more. Who doesn't have more house insulation these days? We have to choice to buy and can certainly make more efficient vehicles.
At the same time, refineries will be expanded and upgraded to make more efficient use of crude oil. At the present time, US refineries convert ~ 75-80% of crude to clean products. Refineries in Europe and the Far East make closer to 50-65% of clean products. If those yields were improved by 10% that would amount to another 8 million barrels per day of clean products, wiping out about 5 years of annuall demand growth without requiring another drop of crude oil production. What was lacking for the last 15 years was refinery profitability to fund this expansion. The existing refineries are now plenty profitable and many expansion projects are now underway. It will take a few years, but the market will balance supply/demand again.
I seem to remember that, in order to avoid a major shortfall with respect to demand, Saudi Arabia needs to greatly increase its shipments in May/June.
With crude piling up in the U.S., it is no longer clear that this is the case. I would also note that the last time I looked at total OECD inventories, they were also pretty healthy, after dropping earlier. If this is still the case, the market - as far as inventories that are transparent - appears to be adequately supplied at this time.
I previously have said we would know something by summer, but we have to start pulling some crude inventories before Saudi is going to be called upon for more production.
But I wonder - where are the Koreans making up their shortfall? Between China, Japan. and the U.S., the Koreans are easily squeezed - and to no one's perceived disadvantage except the Koreans, who are the disadvantaged.
This is the point about Saudi storage - I assume that everyone who isn't an oil producer is trying to keep their inventories as high as possible - at this point, empty storage is not necessarily measured in dollar and cents. The Saudis may have fairly extensive storage, based on security concerns, not simply economic ones.
There is a market for all the oil produced currently - and as oil production declines, that market will remain in force. What is happening is the allocation of that dwindling supply.
And the awareness of that fact. Peak oil is no longer a boutique concern of the next decade.
It has essentially arrived, regardless of a few thousand barrels here or there.
And when I say storage, it is in a broad sense - tanker cargoes and the speed of the tankers reach port is certainly a way to manipulate noticeable amounts of oil - remember the Houston fog which no one but government agencies seemed to see?
Maybe the tanker games are over, with the cargoes they carry now representing maximum production without the stretched out storage buffer, especially with a certain tension in the air concerning Iran.
Just speculation, of course - but with demand reamining stubbornly high, including China's SPR, and India's desire to at least be able to withstand minor oil shortfalls/shocks, reality begins to overrule the games being played. memmel had some fascinating speculation on how the Saudis have been shuffling their wells, so to speak - and how that is now likely coming to a close, as the water front simply reduces the number of wells available.
This is not a prediction about price, or the fact that the oil industry works by a different set of frameworks than most people seem to understand, including a price crash, which could occur even in the face of declining production.
I just think that the reality will set in over the next period of time - the amount of oil available will never be higher than now.
Fascinating discussion,all
When you mention "allocation", you raise the matter of how can the US unilaterally cut its demand, and thus imports, as some remedy for PO? The unilateral cut will simply be slurped by others, yielding no lessening of overall depletion rates.
Any US cut of its imports must be accompanied by a mechanism preventing others picking up what was left on the dock, or in the well. This perhaps is accomplished by having KSA cut back production and begin putting its buyers "on allocation", in essence forcing all importers to cut imports.
Thi KSA allocation regimen can be joint US-KSA move, with unnamed others, as quiet prerequisute to mandated consumer cutbacks. This scenario would predict that soon the US/others will publicly acknowledge PO and mandate cuts in consumption. All done without mention of PO until exporter have already cut their production.
The economics and shocks willalready have gradiently been imposed.
Fascinating discussion,all
When you mention "allocation", you raise the matter of how can the US unilaterally cut its demand, and thus imports, as some remedy for PO? The unilateral cut will simply be slurped by others, yielding no lessening of overall depletion rates.
Any US cut of its imports must be accompanied by a mechanism preventing others picking up what was left on the dock, or in the well. This perhaps is accomplished by having KSA cut back production and begin putting its buyers "on allocation", in essence forcing all importers to cut imports.
Thi KSA allocation regimen can be joint US-KSA move, with unnamed others, as quiet prerequisute to mandated consumer cutbacks. This scenario would predict that soon the US/others will publicly acknowledge PO and mandate cuts in consumption. All done without mention of PO until exporters have already cut their production.
The economics and shocks will already have gradiently been imposed.
I like your line of reasoning. The US even if only to protect its military capability needs to go on a oil diet. This scenario represents a way to do it in a politically correct manner. Your right that regardless of evil plots or lack of them if the US government is peak oil aware it has to at least partially wean Americans of oil or we will have collapse. I think that plans are afoot to ensure a few are at the top of the heap but they still require the existence of the heap.
So this makes a lot of sense thanks. Of course it only makes matters worse in the third world but I think they have been written off.
Hi Robert,
Do you have a more recent source for OECD inventory?
The May 11 Oil Market report, they are still showing 2 straight quarters of approx. 1MMBPD draw.
Overall, the OECD inventory is still healthy (above average), but still drawing.
Something must be triggering this extended draw, and it doesn't prove anything...just asks the question why?
EIA Projection: http://www.eia.doe.gov/emeu/steo/pub/gifs/Slide25.gif
I wonder what a chart of crude oil inventories in non-OECD countries would look like?
Note that Brent is getting close to $72, only $2 below its post-5/05 monthly high.
I have noted that the EIA's projections are not known for being particularly accurate. If that projection does come to pass, then we will find out if Saudi can produce more. Until then, it's just another EIA projection.
And OPEC crude this week is within 30 cents of where it was this week last year. And yet Saudi has made lots and lots of cuts.
This time last year prices of oil included huge post-Katrina "hurricane" premium (and we must remember, that not only the premium was oversized, but after that hurricane season of 2006 didn't happen at all, which affected current prices as well)
So to look at the supply-demand part of the oil prices and compare them with last year's, we will have to wait till the end of the 2007 Hurricane season (and only if it will be not catastrophic like 2005)
From the EIA short term energy outlook:
Average monthly Brent spot crude oil price in the 20 months prior to 5/05: $38
Average (and median) monthly Brent spot crude oil price since 5/05: $62, within a range of $54 to $74. Currently in the $71 to $72 range (about 33% above the post-5/05 monthly low price).
Mathematically, based on HL, the world is now where the Lower 48 was in the 1970-1972 time frame, and like the Lower 48 in the Seventies, the world is responding to higher prices with lower crude oil production. The cumulative shortfall between what the world would have produced at the 5/05 rate and what we actually produced is on the order of 500 mb (EIA, crude + condensate).
Average monthly Brent spot crude oil price in the 20 months prior to 5/05: $38
Average (and median) monthly Brent spot crude oil price since 5/05: $62, within a range of $54 to $74. Currently in the $71 to $72 range (about 33% above the post-5/05 monthly low price).
No argument there, but if spare capacity is shrinking - regardless of whether production has peaked - you will see the same. And I don't think anyone would suggest that we don't have much less spare capacity today than 5 years ago.
It seems that a lot of the refineries in the third world are of the simple variety so they are not in competition for the flows of heavy sour crude but only light sweet crude. I think the pricing pressure is coming from the peak of light sweet beginning to be felt. As the worlds crude supply becomes heavier and sour the effect on countries that don't have the means to upgrade refineries to handle heavy sour crudes will be interesting to say the least. To me this implies that over the next few years at least the pricing pressure will be between light sweet crude and importing gasoline made from heavy sour crudes at complex refineries. So the crack spread will probably widen for some time. The inability of much of the world to pay for refinery upgrades will probably keep the heavy sour grades at a fairly reasonable price for some time. I think the sulfur is also a big issue for refiners since you can't run high sulfur crudes in general through a simple refinery you can run heavier crude at a lower yield. Robert might comment.
So the refining problem is I think more of a peak light sweet crude issue then anything else. Its much easier and cheaper to refine light sweet crudes and if we had not peaked in light sweet we would not have this refining bottle neck we see today. This differential will not close but it will drive the price of light sweet and refined gasoline to the same value minus a minimal refining cost. Needless to say owning a simple refinery will not be a winner in the near future.
So the focus for now is on light sweet and simple vs complex refining and more troublesome the location of these simple refineries. My opinion is that a lot of the third world is going to hit the wall very quickly especially since they have the double burden of simple refineries and subsidies.
In a year or two once the dust settles it will be a complex refinery heavy sour bidding war. This early destruction of a lot of the third world demand will give the wealthier countries additional breathing room to keep the SUV's rolling.
memmel...I've been arguing this point for awhile now...that the refining issues we are seeing are a result of contrained light, sweet crude availability, but Robert keeps showing me stats that say the inputs to refineries has not changed in 10 years, so the evidence is not there or the stats Robert is looking at don't tell the picture.
The idea you state, however, makes a lot of intuitive sense to me.
Its third world refineries that are getting hammered and running shortages. Asia is a big place and we are assuming that the cuts KSA are making are effecting only the wealthy nations. I don't know their contracts but they could well be reneging on favorable contracts with a number of the poorer nations. Until we understand the situation with light sweet and worldwide simple refineries I think Stuarts current work is not correct. Also note that given the timing of the peak of light sweet now is exactly when it should become a huge issue.
Every thing can be readily explained by the loss of 1mbpd or more of light sweet crude and it fits the current situation better some of this is of course Ghawar but thats just part of the problem.
So in this scenario, where there is a problem finding enough light, sweet crude to run through the simple refineries, there might be more pressure to obtain imports of finished product and subsequent bidding wars on this product from countries/companies that can supply the finished product?
Right.
So I think Stuart is correct on the amount of missing oil i.e 1-2 mbpd but its light sweet gone missing from a variety of sources not just KSA. So I don't agree with the KSA part of the analysis. Technically you could say they are telling the partial truth but a lot of the oil they produce is heavier and sour so the situation is they are seeing the spread on light sweet and think they can tighten it by dropping heavy sour production and the markets that can handle heavy sour are probably well supplied. Now they have been dropping supplies of the lighter sweet crudes i.e Ghawar lately and this jive with production from northern Ghawar declining as part of the light sweet problem.
The important thing is KSA if Northern Ghawar is in decline can do nothing about peak light sweet they are not really relevant to the light/sweet/simple refinery part of peak oil.
Outside of course if they manage to starve the world of heavy sour with cuts and thus this adds into the gasoline shortage by starving the complex refineries. But I don't think this is the case yet its unclear if the Asian refiners are actually short heavy sour crudes.
I think Robert is closer to correct on this situation than Stuarts current post. If KSA has managed to cause a shortage of heavy sour on top of the problems with light sweet we would be at much higher price points then we are seeing now.
The light sweet problems will probably push gas into 4 dollars per gallon then it will zoom to close to about 8 a gallon next summer if no hurricanes unless we have at least a few third world economies crater this summer late fall. If we get the hurricane strikes predicted then I'm certain a fairly wealthy third world country will soon cease to exist as a functional economy. In short we are getting time when the losers of the demand destruction game I model as musical chairs and Russian roulette start showing up. The
Someone has to go down soon. Since the poorest countries use little fuel demand destruction in them is not enough. We really need 1mbpd of light sweet freed for the rest of the market this means a fairly large third world economy is toast. So the price will rise until this happens. I can't see general conservation as a solution anymore.
The total amount of "missing" Saudi production that I am referring to is the difference between Q3 2004 production (and the very similar 2005 plateau) and production today, plus the fact that two new megaprojects (Qatif/Abu Safar, and Haradh III) came on stream and did not increase production. So something else must have declined or been turned off to offset those increases. That is 1mbd + 690kbd + 300kbd, and it's quite hard to add those together and come up very far from 2mbd.
We really need 1mbpd of light sweet freed for the rest of the market this means a fairly large third world economy is toast.
Memmel, do you know which countries in the world consume more than 1 million barrels per day?
I found this.
http://www.nationmaster.com/graph/ene_oil_con-energy-oil-consumption
Taiwan is right at this number.
So thats why I'm saying it will be a fairly big economy that goes down.
A lot of countries are at 200kbd so this is the effective destruction of 5 countries in the world like Israel or Vietnam.
Or Egypt and Malaysia for example at around 500kb each.
I think this puts the effect of just losing 1mbpd in production in perspective. So once we are down 3-4 the world
is toast. Thats 30-40 small countries without one drop of oil.
Anyone that thinks our modern society is going to last long after peak oil is sadly mistaken we basically have at most a few more years before TSHTF.
The only reason we are still stumbling now is because of storage some conservation etc. But I see a cliff coming up fast.
Just to add if you look at the small countries at 1,000kbd i.e Samoa for example its hundreds without oil.
To avert this US demand would have to decrease by almost 1mbd
and about the same for the EU and Japan. I cannot see the US/EU/Japan voluntarily dropping 4 mbpd.
The money wrench is subsidies used by many countries so the burning question is who is running out of money. And how high will oil/gasoline prices have to go until these subsidies fail and thus the economies behind them. I think its too late for most countries to gradually decrease subsidies since we are talking about and event that started this summer and round one will end next year.
http://money.cnn.com/2007/05/04/news/economy/gas_demand/
I don't have a comprehensive list of countries with subsidies. But we really should build a list of these countries and focus on ones that are not oil exporters and have serious account imbalances now and further only have simple refining capacity. The first victims of peak oil will be on this list and they better add up to 1mbpd or so in consumption.
You need to look at all these issues together.
Interesting that our pals Columbia dropped subsidies in 2002.
Maybe they were passed a tip ? I'd love to see countries that buddied up to Washington over the last few years then quickly dropped subsidies.
One more post this is a great article on the issue.
http://rru.worldbank.org/documents/publicpolicyjournal/310Bacon_Kojima.pdf
I found more info
http://peakoildebunked.blogspot.com/2005/10/120-gasoline-subsidies.html
I've actually found the peak oil debunked site useful
for info supporting peak oil.
Big pdf!
http://www.gtz.de/de/dokumente/en_International_Fuel_Prices_2005.pdf
Egypt looks like a potential trouble spot in Africa
I'd watch them carefully.
Bolivia,Ecuador,Columbia,Mexico and Suriname in the Americas.
Myanmar, North Korea, Pakistan,Indonesia,Jordan,Yemen,Syria Bangladesh, Vietnam and the Philippines for Asia probably missed a few here.
But you can combine this with the consumption numbers and
see that we will have problems fairly quickly.
I was correct to look at South Wast Asia. I left off countries with reasonable exports of oil.
Note the tinderbox of countries with little oil in the ME with subsidies and south Asia.
I would be surprised if we don't see problems out of one of these countries on the list or in the big report.
But this is enough info I think to put together the list
of countries at risk.
The price spread 10 year ago, between Tapis Light Crude (44 Gravity) and Mayan Heavy Crude (22 Gravity) was about $5.50.
Currently, the price spread is $21.
I listened to an investor presentation today by one of my favorite CanRoys a company called Baytex. They are a heavy oil producer in Alberta and have sold their oil to Frontier a U.S. refiner with refineries in Wyoming and up the road from me in El Dorado KS.. Baytex has priced their heavy oil (lloyd blend) to Frontier via a longterm contract at 71% of the WTI their 5 year contract will expire this December and they are anticipating a significant improvement in the differential against the WTI.
Reason?
The Lloyd Blend Market is now (2007)tracking at the lowest differential to WTI in years
Why?
Pipelines flows have been changed so that Canadian Heavy Oil is now flowing to the Gulf Coast which has 6 million barrel a day refining capacity for Heavy Oil. How Come? Canadian Heavy is displacing Mexican and Venezulean Heavy oils that are no longer available to Gulf refiners for reasons well known to all Drummers. For those Drummers with a couple extra deterioating greenbacks Baytex is currently yielding +9.5% in Canadian Dollars.
Presentation can be accessed thru their website:
NYSE Symbol: BTE
http://www.baytex.ab.ca/main/
First, the differentials between light & heavy crudes are almost entirely a function of the product price spreads. That is, when the difference between gasoline and residual fuel is $5/b (like it used to be 5-8 years ago) this diff'l will be low. Today when this gasoline-resid is $50-80/b, then the sweet-sour crude oil diff'l will also be huge. The factor which would indicate a shortage of sweet crude would be some observable difference in the refining margins for sweet and sour crudes. There is some indication of lower margins for sweet crudes, but not a huge issue. The market allocates crude pretty well to those who are willing to pay for it. in the longer term, those higher margins for sour crudes attract investments so the market arbitrages the refining values and margins pretty well.
The simplest possible refinery is a fractionating column (common to every refinery ever built AFAIK). This will work on every crude in existence, light or heavy, sweet or sour. You will be able to get natural gasoline (naptha), kerosene, and fuel oils. For heavy sour crudes your products will have high sulfur and you will get less of the lights and more asphalt.
If you want to get rid of the sulfur, get higher yields, or get modern gasoline blends then you have to start adding complexity.
I think your explanation is to simple even the simple refineries are more complex than this. Next of course is what are the real losses when a simple refinery is run on heavier crudes. Cracking at least seems almost a must so I think that what we are calling simple at least have some catalytic cracking but probably cannot handle high sulfur. Robert hopefully will enlighten us on this. I don't think its as trivial as your implying. Corrosion problems from the sulfur indicate to me that more is at work. So the question for Robert is can these simple refineries simply switch to heavy sour and profitably make gasoline ?
I tend to think not or you would not have such a hefty crack spread. Robert ???
Memmel, RR didn't answer your question about refinery upgrades to handle sour and heavy crude so I'm going to attempt with my non-expert, limited understanding. I will cheerfully accept clarification from chemical engineers.
First, any sour crude is very corrosive, so lines and fittings must be made out of stainless steel or other non=corroding materials, and they are a lot more expensive.
Second, crude is sweetened by bubbling sweet natural gas through the crude, then either refrigerating the natural gas or flaring it to get rid of the sulfur.
Raising the gravity of crude requires heating it with a hydrogen source with catalysts. Natural gas is the preferred hydrogen source. Yhis cracks the crude.
At any rate the costs are substantial, and thats why there is a price differential.
With no liquid water or oxygen present sour crude is not that corrosive, which is lucky because stainless steel columns and crackers would cost the GDP of Switzerland.
Refinery
A typical complex refinery would look like the first block flow diagram. The simplest possible refinery would look like the second. Note that if all you care about is fuel oil and kerosene you can dispense with most of the complexity.
Holy crap...thanks for that reference...there is a HUGE difference in complexity. This helps put the situation in better perspective.
And the funny thing is, politicians pass regulations to tighten up the specs - which I support - but this necessarily increases the complexity of the refineries. But, when maintenance problems seem to increase, they sit around scratching their heads. It is a complete mystery to them.
Robert now that you commented I really love to see you comment on refineries in the third world as everyone seems to agree light sweet has peaked. I've discussed subsidies etc in another thread if you read the news you will see many countries are rapidly dropping subsidies as they become untenable this means the world will soon be competing at market price or the governments of some countries will be bankrupt. Your aware of the the cost of building a complex refinery and I feel like we are heading to a real crisis from the combination of the peaking of light sweet crude and simple refineries that cannot be upgraded.
This does mean that the price of heavy sour will stay reasonable or more that the crack spread will widen.
Anyway enough I think you see what I'm saying but I think its a problem would benefit mightily from your analysis.
It should be a key post IMHO. I've dug a bit and the subsidy info and refinery info is available but the subsidy stuff is changing rapidly :)
TJ, thanks for the reference. I knew it was complicated! The problem with you darn engineers is that you guys are generally better at calculating than communicating, and I think that every member of the Senate Energy Committee should have a good, hard look at this!
Forward demand cover provided by total oil inventories remains around the five-year average
I think right there's your key point. All of these Saudi and OPEC cuts, and inventories are right where they normally are in the OECD, and very high in the U.S. Makes me kind of wonder if the Saudis might actually know what they are doing with these production cuts. Until we see inventories headed below average, I think they can say that these cuts - voluntary or not - have been validated by where (transparent) world inventories are today.
Note during the time that there was so much hand-wringing about falling OECD inventories - OECD inventories normally fall during that time span. It looks like from November to January, a near 1 million barrel a day draw is normal.
How important are the OECD inventories? I guess that depends on what fraction of the global oil inventories can be attributed to OECD countries.
OECD inventories are high while crude oil is trading close to its record high last year. The only way I can reconcile these two contradictory facts is by guessing that non-OECD inventories must be very low.
How important are the OECD inventories?
A funny question, that. They seem to be important and significant when falling, but pretty meaningless when rising or steady. In 2006, the OECD nations consumed 60% of the world's oil. So, it is a pretty significant amount. There will always be some who will point to the other 40% as perhaps supporting their view. What I can say is that the transparent 60% does support mine. No question.
And yet, even with very high inventories, the price keeps rising - and demand, at least in the U.S., seems intricately bound to how Americans live.
Another way of looking at things is that the Saudis have done an impressive job of getting whatever the market will bear, without losing their ability to profit from that fact.
But Saudi production seems at best to be declining, with or without OPEC cuts, replaced by 'productive capacity.' Which in a way, can also be seen as another form of storage - one impossible to measure, and one which can have any number of 'delays' - all while actual production/exports decline, as the price climbs, and as we all watch how well OPEC is managing the market.
Personally, this is more akin to a dead stick landing - and any crash you walk away from is a good one.
We'll see - the data is at best very ambiguous, when viewed through the oil industry filter. Restricting oil supplies through quotas or flooding oil markets to keep control are business practices with a long history, in an attempt to earn the most profit possible in a risky business.
Strangely, my belief that geology is becoming the dominant factor in oil production also makes me a naif - the above ground factors have dominated till now, and they remain the crucial ones in how oil is produced.
But at some point, the end of increasing production is reached, regardless of the above ground decisions.
I believe this point to have been reached around now - of course production can be curtailed, but I don't think it can be significantly raised, regardless of what the market demands. As the Koreans seem to be finding out.
And the fact that America is stockpiling, so to speak, can also have other explanations. Being tough towards Iran requires full storage tanks at a minimum, sort of like German casinos require ties - having a tie and paying admittance lets you go to the roulette wheel - but it doesn't buy you any chips. Or after Ivan/Katrina/Rita, hurricane season is something to take seriously. Or in an age of incredible financial speculation, there is a lot of money to be made buying and selling oil - especially while the dollar is worth something.
Very murky situations impacting with one another, none exclusive. But Saudi production seems to be coming into clearer focus, if only because it keeps declining.
And yet, even with very high inventories, the price keeps rising - and demand, at least in the U.S., seems intricately bound to how Americans live.
Not oil prices. Gasoline prices. After all of these Saudi cuts, oil prices are still right where they were last year. What does that tell you? The current supply - cut by OPEC - is still meeting demand at the same price. There is no bidding war for diminishing oil.
Oil is flat, not diminishing... but it is absolutely not true there is no bidding war. Ask the africans, getting off the bus so we can continue filling our suv's. Or the asians, taking the brunt of sa cuts because they don't have an army near sa... might it have been fairer for sa to cut everybody a lesser % so that asian deliveries would be cut less, and meanwhile leading to lower oecd stocks that opec wants?
Higher consumption in china/us/oil producers is accommodated by those stepping aside, and quite obviously the current price is sufficient to accomplish this redistribution at the moment. Henry Groppe, holder of the best track record for predicting oil price direction at least since the seventies, thinks there remains sufficient dd and fuel switching in poor countries to hold oil in the 60's for a few years. While I hate to go against Groppe, I think the lack of capital (both for ng burning generators and for a ng transportation system) will continue to restrict such switching, just as it has in poor places for decades, and we will see record prices this year and a higher overall price y/y as the rest of the world is barely able to replace declining sa production.
Oil is flat, not diminishing... but it is absolutely not true there is no bidding war.
I think that confuses high prices - which has caused demand destruction in Africa, with a bidding war. No doubt high prices have caused demand destruction. Demand destruction necessarily means that supply either needs to start dropping, and that was conveniently accomodated by the OPEC cuts. And here we are a year later, with OPEC crude at the same price it was during this week last year. Given that OPEC production has been cut by a lot, a bidding war for diminishing supplies should have driven the price higher, wouldn't you think?
Or the asians, taking the brunt of sa cuts because they don't have an army near sa.
I think everyone presumes that the Asians were not able to secure supplies from other producers. I have seen no evidence that this is the case. It could be, but it would be nice to have some hard evidence that they were forced to lower production at their refineries because of the cuts. I have also read that the contracts they have allow the Saudis to cut them if OPEC cuts are being enforced.
If we see lower gasoline imports from Asia which we seem to have seen then yes we have and effect. The reason oil has not taken off yet is so far the cuts in oil supply have been handled with dropping finished product exports i.e gasoline and stock draws on a wide range of oil products. I expect oil prices surge as refineries around the world try to meet US demand. So the oil price spike is coming soon. Along of course with price increases across a range of other oil products as production of gasoline increases.
Its like the puzzle that has one tile missing and you slide them to form a pattern.
What evidence, other than price, could anybody ever provide regarding relative scarcity?
There is indeed evidence that most of the world is shorter crude than we are - or, to put it another way, the rest of the world does not have as much of a refining bottleneck to throttle demand for crude... brent is at a $7 premium to cushing, normally at discount, and asian prices are similar/higher... so asians, and europeans too, remain unable to secure as much supplies (relative to their wants) as we are. Of course, this differential cannot last, even if sa remains intimidaed by the us military, others will shift cargos from NA to higher priced regions.
Too many facets for a simple reply - but in terms of scarcity, the U.S. simply produces less crude than in the past - regardless of price. That is a measure which has been relevant my entire adult life - and it has little to do with price, as it is a geologic perspective. Certainly there is much complexity - if no one drove cars, the price of oil would obviously collapse, for example.
As for the world being shorter of crude - well, yes, and depending on the society, they are either adapting or simply going without.
Only the U.S., among major industrial societies, seems to have a real problem with gasoline prices/scarcity - the 1 imported gallon of gasoline for every 8 used in the U.S. shows how much slack the rest of the world (at least that part with reliably supplied refineries) has available at need.
As crude production declines, the assumption that the market will simply provide, using price as a signal, is very simplistic. For example, if the EU decides that all exported gasoline has to pay a 10% fee (tongue in cheek - to help pay for their welfare entitlements, they decide to use trans-Atlantic oil supply as a way to siphon wealth from America to Europe) as a method to ensure adequate gasoline supplies in the EU, there is nothing the market can do about it.
But $64 was considered high last year - measured in Yergins, at least - A joke nobody makes anymore, as we have all become accustomed to the idea of $60 a barrel being 'normal.' I seem to recall it was considered expensive then, too, and when it started to go below $60, much relief was heard that things were returning to normal - except from OPEC, who insisted $60 was just fine by them, and started cutting quotas (even if Saudi Arabia jumped first - for whatever reason).
This is complex - I also believe the America economy has driven off a cliff, but has yet to lose enough forward motion to start noticeably plunging down. And at some point, OPEC's cuts and America's forced demand reduction (recession/depression) are likely to look like market synchrony, which it very well might be.
And that refining issues are playing a major role in the U.S.
To me, using price as a measure of peak oil is not very useful, though it remains the focus for most discussion - which is reasonable, in itself.
But price does not change what is in the ground, nor what is no longer in the ground, nor significantly change what can be pumped today.
Stuart's work is starting to bring another perspective into the debate - what is actually going on, at least in one significant oil producing region, not what is projected, modelled, anticipated, demanded, required, hoped for, planned, etc.
The interplay of many factors still hinges on the basic reality of what comes out of the pipeline - and to the best of anyone's knowledge, we have reached a plateau.
For example, we could try to tie in declining North Sea production to American prices - part of the trans-Atlantic oil circulatory system has also peaked, when looked at in a certain way. There is no slack anywhere in a system which functioned well for decades - the Russians have been likely balancing the North Sea decline in Europe, but at this point, Britain and America are either competing or about to compete for gasoline. Russian oil isn't very likely to become a major trans-Atlantic commodity, in my opinion, if only because the Russians have no interest in supporting a nation which seems to be threatening their existence with a Star Wars system from the days of Reagan and the evil empire.
Keeping up with what is going on is becoming very, very hard. And lacking very reliable data, speculation is easy.
That seems a bit disingenuous, Robert. Prices were hitting record highs last year and they are approaching that territory again and could move beyond last year's record highs. They have risen again from the $50s to the $70s globally. What will you say if they move beyond last year's highs? Someone is outbidding someone else for that oil or else the price would not be rising. That is blatantly obvious. The reaction of the market proves there is a bidding war going on.
Now we had a respite when oil fell back into the $50s but that bidding war is ongoing again right now both in crude and in gasoline. You can argue that the oil supply was adequate when we were in the $50s and falling but you cannot make that argument when we are in the $70s and rising. (And WTI price doesn't count anymore for reasons that have been discussed here.) Just because the US is well supplied, you cannot argue that everyone is when the price is rising. Otherwise you are saying the market is not working which leads us right back to silly conspiracy theories.
No one can deny the following facts:
1. Oil production is roughly flat for the last 2 years.
2. Demand is UP in the US, China, India, and even in the Middle East itself over the last 2 years.
3. Demand is roughly flat in Europe over the last two years.
Ergo, to meet #2 above, someone else has to be doing with less or with an alternative. They MUST be doing with less or an alternative. There is NO other possible answer. Just because you cannot see these people does not mean they do not exist. The demand destruction is real as is the bidding war going on right now.
Brent is near $71 per barrel right now.
This is the same price range as last year at this time when we all thought this was a bad sign then. Why is it suddenly "good"?
I think you are stretching a bit and your claim just doesn't make sense to me when you claim that both $50 oil and falling prices and $70 oil and rising prices support your position. I'd appreciate any clarification because this doesn't pass the sniff test yet.
Ghawar Is Dying
The greatest shortcoming of the human race is our inability to understand the exponential function. - Dr. Albert Bartlett
Just to underscore this statement, look at what happened today with regard to gasoline and the different crude types.
It's like we are importing only Brent crude to refine into gasoline any more or importing all of our finished gasoline offshore.
COMMODITY / PRICE / CHANGE / %CHANGE
GASOLINE RBOB FUT (cents/gallon) 235.690 4.650 02.01
BRENT CRUDE FUTR ($/barrel) 70.720 0.120 00.17
WTI CRUDE FUTURE ($/barrel) 64.180 -1.590 -02.42
http://www.bloomberg.com/markets/commodities/cfutures.html
This is the same price range as last year at this time when we all thought this was a bad sign then. Why is it suddenly "good"?
Nobody is arguing that demand destruction didn't take place. Certainly, it has. But last year at this time OPEC oil was $64/bbl. In the meantime, Saudi cut and cut and cut and cut. Now, if they weren't cutting to meet reduced demand - that is to say that their cuts were involuntary and not a response to the market, you would expect the price to rise and trade in a higher range than it did a year ago. On the other hand, if $64 oil destroyed demand such that the then production rates were resulting in an oversupply situation, and Saudi cut crude until they believed supply and demand were once again in balance, then it is understandable why twelve months later their production is well off the highs and yet OPEC crude price is flat.
Supply and demand for crude are apparently in roughly the same balance as they were a year ago. If this doesn't validate the cuts they made - again involuntary or not - then I don't know what does. As I have said a number of times, if the cuts are involuntary, they were certainly well-timed: just as demand fell, their production fell.
Whoa! Demand is not down. The stats show that and the consumption numbers show that. Global demand is the same as last year. Global production is the same as last year.
KSA did cut (voluntarily or involuntarily) but someone else did manage to increase production. If production had increased you and others would be pointing at this as evidence that we had not peaked (and would be right) yet the peak still holds even with KSA's loss of 1mbpd. OPEC's basket price today (from their website) is $66.18. So yeah production is FLAT.
Now what has happened? Demand has not reduced overall at all. Total production is still about 85 mbpd and it's all getting consumed. In other words the situation is largely as it was last year at this time with the difference being that 1mbpd of KSA oil came off the market to be replaced with someone else's oil production increases.
Thus I don't think you can say that this authoritatively determines that KSA reductions were voluntary or not. It doesn't disprove your position but I don't see that it proves it either. It simply leaves the question unresolved.
Ghawar Is Dying
The greatest shortcoming of the human race is our inability to understand the exponential function. - Dr. Albert Bartlett
what was the inventory picture to go with that $64 oil of yesteryear and what is the inventory picture today ?
Are inventories for heavy and light crude kept separately? If so is there data? If not, does anyone measure the grade in the stocks?
The problem is that the graph of OECD crude oil stocks is a little dated, going only to Feb 2007. OECD Stocks are supposed to increase from February to May, but it's not clear that they have. The weekly EIA stats show that the U.S. has increased (in oil, not gasoline). Japan was down a little in March: http://www.paj.gr.jp/english/statis.html.
Does anyone have later data?
Nymex Crude - WTI was 39.6 API a very light crude. Have read reports it was discounted because there was no pipeline to send it to a sea port.
Brent was heavier at 38.3 API, but light by international standards. It was trading higher than WTI as it may be loaded into tankers.
OPEC Basket was heavier at 32.7 degrees API. It was trading at close to Nymex prices because it was close to export facilities and was demanded from points all across the globe.
The shortfall in this market is in the limited supply of clean products, ie, refinery capacity. I note that worldwide commercially held crude oil inventories are normal and in fact higher than normal in the US. Further I note that refining margins in the key US market are at historic highs of $5 to $20/B. This indicates that clean products shortages are leading crude oil prices higher, not the other way round. If feedstock (crude oil has no intrinsic value, except for the products one can make from it) shortages were doing this, refining margins would be very low.
In fact the rhythm of the energy market is keyed to the northern hemisphere heating season. Consequently, this is considered the slow season where demand is minimized in the 2nd & 3rd qtrs and max in the 1st & 4th qtrs.
It is entirely understandable that OPEC has cut back production in this slack season. Producing more crude now would only hand refiners more margin and not reduce consumer prices much at all. I note that prices for prompt crude oil are discounted some $5.B versus later deliveries. This is a clear indication of a glutted crude oil market. However, prompt US Gasoline supplies are at a $3 premium to next month deliveries; an equally clear indication of a tight clean products market.
This is even true for the US where maint occurs in Feb-April, then refineries are supposed to go to max gasoline for the driving season, take a short maint. in Sept, max heating oil make in the 4th qtr. However, US clean product demand has outgrown ref. cap'y such that utilization needs to be maximized year round. Note that US gasoline imports 5 years ago were < 0.5 MBD, but now are > 1.0 MBD. It is the cost of imports, and plentiful crude oil feedstocks which are supporting US refining margins at these historic levels. Don't believe me? Look at the US refining company stocks like Valero or Tesoro. 5 years ago you could have bought Valero stock for $10/share, having split once, it is now 15 times higher at $75/share. The stock market knows what is in short supply.
No, the swing producer isn't running out. It is entirely typical that Aramco cuts supply to Asian customers in the April-July time frame when demand there is at a minimum and refineries there are cut back for seasonal maintenance. As >75% of those customers consume Arab Light, that's what they cut back. That AL is likely going to the Atlantic Basin customers.
Aramco's crude oil storage cap'y in Kingdom is purely operational, amounting to ~ 50 Million barrels. of which 70% serves the export terminals at Ras Tanura & Yanbu. This amounts to ~ 5 days of storage. Outside of Kingdom storage is also minimal and operational: 10 million barrels in the Carib, some at Sidi Kerir, Egypt and a little in Rotterdam, maybe 15 million barrels total.
Hm, on graph http://www.theoildrum.com/files/saudi_summary_may07.png I can see falling AvgProd from 2006 through 2007, while from 2004 to 2006 I see production rising, 8,5 to 9,5 mbpd.
Seems that I'm not able to see those 1 million barrels "off". Can someone help? Thanks.
My guess is you are looking at the blue line (opec quota) rather than the black line in the tangle of other lines (average production)
If we are to believe in things we cannot see or touch, how do we tell the true belief from the false belief?
My guess is you are looking at the blue line (opec quota)
No, I am referring to a solid black line, described als "Avg Prod" below. This line starts to rise in 2004, from fairly above 8 mbpd to 9,5 mbpd at the end of 2004.
So this tells me Saudi have significantly ramped up production during 2004.
That's right. They were at 9.5 mbpd at the end of 2004.
They are at 8.5 now.
So they are off 1 mbd since Q3 2004.
Am I missing something?
You are right - comparing the numbers from qu3 2004 until today shows a decline. Only 6 months earlier - qu1 2004 - will show an increase.
Why did he choose qu3 then? It was not the last time Saudi produced 9.5 mbpd (that was qu2 in 2005) and apparently in qu2 2003 they also produced nearly 9.5 ..
And all production rates fit almost perfectly with OPEC quota ..
Your comment echoes those made by rapier. However, many at tod compare the sa response to rising prices in 2004 with what they subsequently did in 2006:
in 2004 sa responded to higher prices with higher production - at this time they clearly had some available reserve capacity, and they brought it on line - quite consistent with their long held idea that moderate prices avoid substitutes and therefore are good for their long term economic health. However, begining in 1q06, production began declining even tho prices continued to rise, and the fall in output continued thru the aug price peak. These declines advanced long before the nov 06 cuts were agreed to... and, speaking of opec cuts, sa, with 30% of opec production, made 80% of the cuts. All of this makes sense to some at tod because their super giant fields have been in production for over half a century, some regions are clearly very depleted, and they have no new fields.
Robert's view of these events is that sa may have responded to rising inventories last summer rather than price, and that this may explain why sa reduced production, further noting that even now, after months of draws, oecd inventories are around the five year avg. My own view of inventories is that inventories should reflect higher five year avg consumption, and anyway the fundamental change in futures (switching from always lower to continuously higher end 2004) strongly encourages refiners to hold much higher stocks. And, while data on non-oecd stocks is poor, imo would likely show that stocks in many less developed regions are near zero. Naturally not significant where they can no longer afford oil, some asians that can afford to pay current price presumably have lower stocks than desired specifically because sa has reduced shipments to these politically not significant regions (having an army nearby naturally keeps us at the top of their preferred customers list.)
Low world wide gasoline stocks explains why crude stocks are not even lower... as refineries come fully on line in response to the spread, crude stocks will fall further, leading to a 'call on opec', at which point robert hopes sa will spring to life (personally , I am pessimistic - sa was sympathetic, but produced no additional oil during the hurricanes...)
Shippers are crying, drillers are celebrating...
Low world wide gasoline stocks explains why crude stocks are not even lower... as refineries come fully on line in response to the spread, crude stocks will fall further, leading to a 'call on opec', at which point robert hopes sa will spring to life...
Actually, that's not what I hope. It's what I believe will happen, but I actually hope that they don't. Because if they don't, oil will get truly expensive and perhaps we will finally start to get some changes in policy. This would be a wake up call that I think congress would finally heed.
If we can bump along on a plateau for a while, we will have a much better chance. If Saudi does bump up production, population grows by another billion, and then they peak, it's just going to be harder for everyone.
I'm in full agreement that the sooner we get to reduced production and high prices, the sooner we will move towards alternatives, some of which will hopefully be sustainable. However, groppe thinks the third world has more dd/fuel switching that they can do, meaning that prices will not climb as fast as we would like... one might have thought that increasing consumption in china, the us, and the exporters of 1-2mb/d would have resulted in sharply higher prices in the face of flat production (eg I thought that the three year price ramp would not end last aug, as it did do), but in the event we see flat/lower world/us prices.
Much attention is logically focused on murky sa, the #1 exporter, but russia is now #1 producer... maybe somebody has time to think about whether they are or are not at peak.
Stuart, great post. Nice to have it understandably explained .
I agree with higher prices for consevation. I think they will happen like it or not.
I believe that in the US the gov will be so distorted and impractical with thier responses that oil co's might be the better hope.
After reading yesterday that they are interested in ethanol, probably for the subsidies and tax benifits, I'm thinking we are truelly screwed.
What an epic event this is really. To be alive during the time the most technically advanced civilization does the "Thelma and Louise".
Speaking of which, local hero's and members of the local peak oil group (NC Powerdown) have produced a movie with this theme that received a glowing review at: http://www.culturechange.org/cms/index.php?option=com_content&task=view&...
Sorry for this shameless local advertisement but TS Bennet and Sally Erickson certainly deserve wide recognition.
From what I can see there appears to be a big issue with the analysis. The elasticities of gasoline demand paper refers to US demand. Yet everything else is global demand, supply, costs, etc.
Given that what is thought to be happening is that third world countries are being forced from the market (demand destruction) - how can US figures tell us much?
The reverse of this is more interesting. If you assume that the elasticity figures for the US are only correct for relatively small increases in cost - to what level do costs have to rise to affect a phase change in US response? How does that compare to the effect on demand worldwide?
Much depends on the speed rather than magnitude of the cost change, but it should be noted that the US is relatively exposed to increases in cost due to little tax, high built in usage and high debt levels.
I do not believe that the elasticity of oil in the third world is much below that of gasoline in the US. Most of the third world is using diesel generators, so while the US wastes its petroleum in a suburban lifestyle, the rest of the world either gets diesel or goes back into the dark ages. They lack any means to switch to anything else, lacking capital for investment. See Senegal for the latest example.
Ghawar Is Dying
The greatest shortcoming of the human race is our inability to understand the exponential function. - Dr. Albert Bartlett
As much as one might wish the demand destruction to fall equally on rich and poor, I don't see that happening. The reports of power cuts, riots and general breakdown paint a picture where the demand destruction falls disproportionately on the poor who simply do without entirely. I would really love to see some up to date per country consumption data since I would expect to see some sizeable percentage losses.
Given our expectations for demand increases over the past few years, that excess demand that hasn't appeared has got to have come from somewhere, and I don't see any evidence in the US consumption figures that it as fallen on the them.
"Given that what is thought to be happening is that third world countries are being forced from the market (demand destruction)"
It's largely a myth that most of the conservation is happening in the developing countries. The data show a pretty complex pattern without obvious large scale conclusions like this. See Consumption Winners and Losers.
I think this is because of the widespread use of subsidies.
Its when they are gone or greatly reduced that the blood will start to flow and our predictions will fall inline.
So the current conditions are very artificial.
Just to expand in the link you posted you did not include subsidies in the equation. I think you will see thats the key issue that keeping things together for the time being.
Right. Now that the price of petrol has increased by 25% overnight in Iran, you will see consumption go down.
Ditto for other countries.
On that graph http://www.theoildrum.com/files/linear_brent.png most of the points are at low oil prices. Also near all points of hight oil prices (> $1,50) are anomalous hight by your model.
In other words, your model seems to underestimate gas prices for hight oil prices. And the majority of the points being for low oil prices may "delude" you, making you underestimate the error you are getting.
From that graph http://www.theoildrum.com/files/model_data_comp.png, one can conclude that all hight oil prices (Am I right, or those graphs have different time intervals?) are due to 3 peaks, one at 2005, one at 2006 and one now. And your model failed both at 2005 and now.
Does it imply that there are similar factors acting at 2005 and now, and your model is right? Or that your model is wrong and 2006 was anomalous?
The model is not either "right" or "wrong". It is a decent approximation (for a single factor model!) that explains 95%+ of the variance in gas prices over the period, and has an average residual of 10% of the price or so (though with heavy tails in the residual distribution). Discrepancies at high oil prices look bigger visually, but they are not larger in percentage terms.
Nice work.
The disaparity between crude price and gasoline would obviously be greater if you had used WTI price instead of Brent (the very reason you used Brent). But it would be less using Tapis Asian oil price which today rose above US$79, just three dollars short of its high last year.
When Asian oil price hit $82 last year, we paid AUD$1.44 for petrol here in Oz (Melbourne). With our crude supply at $79 petrol is back at $1.39. So petrol prices here are still very consistent with crude price - only a much smaller proportion (<10%?) could be attributed to ripple effect of tight refining capacity in the US.
Given large Saudi cuts to Asian refiners, it seems clear that they could refine more (and send more gasoline to the US) if only they could get their hands on the crude.
cheers
Phil.
Tapis as a price indicator for the FE is pretty lousy. There's only 2 cargos/month reaching a real market. Oman or Dubai is a better indicator.
Yes, FE refiners are producing gasoline for the US market, those who can meet US specs, that is.
There's plenty of crude available to FE refiners if they want to increase runs - that's why the Saudis cut back shipments to the FE customers. Keep in mind that the Saudi cuts to the Atlantic Basin customers were much larger - 20-35% of contract, compared to ~10% for FE customers. Why? Because there were plenty of alternatives in the Atlantic Basin, even considering the declines in Mexican and Venzuelan output. Canadian exports to the US have ramped up from 1.2 million barrels/day 5 years ago to > 1.5 MMBD lately. So too have Angola, Chad, Sudan ramped up production.
The world just didn't need more Saudi oil - that's why they cut - not because the North Ghawar was running out. There's plenty left and more reserves to develop in KSA. The sky isn't falling now or anytime soon.
First off, thanks for the gasoline price graph! I was looking for a good one the other day.
In Unhappy Motoring, I covered the UC Davis study.
Reasonably enough, you use the approximate mid-point for the 2001-2006 period. If it were not for the PE trend, gasoline prices would not be where they are.Furthermore, without doing the math, I pointed out that gasoline prices pace oil prices. If you're worried about future gasoline prices, worry about the oil price.
(See the original for links not included in this text)So, we're generally thinking along the same lines. Of course, I wouldn't touch your Saudi Arabia conjecture with a ten foot pole at this point
Have a good one, Stuart.
Dave
The change in price elasticity (PE) value from the 1970's to the present is interesting, if disturbing. My suggestion is that a lot of the difference in PE could be due to the ability of people to charge gas purchases today on credit cards. This would, at the least, greatly increase the lag time between a jump in gas prices and a change in behavior, since CC debt can take a while to crimp consumer behavior.
At most gas stations, last month, when I was in the United States it is a hassle to pay with cash. So you just put your credit/debit card in the slot.
Buying gas seems painless if you don't have to part with a wad of $20.00 bills.
Ed
Ed, the problem is the people that charge it. If you pay the cards off in full at the end of the month it is better then a cash purchase as it earns rebates (as much as 5% on gasoline in some cases) while incurring no fee or interest expense.
http://financialplan.about.com/cs/creditdebt/a/UrgeToSplurge.htm
Sure, but I go further.
There is no doubt in my mind that there is a significant number of people charging on credit cards with no intent of paying them whatsoever.
Never mind the usual serial bankruptcy welfare establishment.
All the people that lied to get approved for the creative mortgages can already predict that they will have to walk from their houses which equals bankruptcy. They claim all sorts of outrageous things and maybe delay it for 6 months or a year.
So? what is the additional penalty to them to default on the credit cards? Nothing. And in the meantime they charge.
Yeah, the increased ability to borrow is also my best guess. Works until it doesn't.
Dave, most studies on this issue generally compare inflation-adjusted price of gasoline for the periods in question. On that basis, I can see the point. However, I wonder if one looks at a family's gasoline expense in terms of percentage of disposable income, might a different picture emerge? Perhaps people have more money to 'shift around' in their budgets today than in the 70's.
Zackly! Check out Stankeys testimony at the recent Senate sub panel meeting on gas prices (TOD has a link). Basically as a % of disposible income, we are about 50% of we were in the early 80's...
Replying here and to Murray down below. From the discussion of the study (page 16).
As always, I suggest you read the paper yourself before jumping to conclusions.
best,
Dave
I realized, after hitting the post button, that another point is the issue of a valid inflation rate. If one accepts that the 'official' inflation rate is somewhat under-reported, which I do, then we haven't yet reached the price equivalence of ca. 1980 gasoline price yet. When I get more time, I may try to find some figures on this.
It isn't that I reject the notion that gasoline demand is less flexible, I believe it is [less flexible]. I just don't think the price has reached a critical level or tipping point in terms of mass behavior change in consumption patterns.
Hello Dave,
First--Thxs to SS for the keypost.
Dave's Quote: "It is not clear to what extent Americans can't reduce consumption, as opposed to won't."
This is an excellent and crucial consideration, IMO. I hope this will be examined more on TOD.
Recall Dan Yergin's long ago prediction of $38/barrel. Using a CERA/IHS proprietary database and inside sources unavailable to the TOD 'amateurs' =) the First World economies should be currently and quite happily motoring along in truly unbridled bliss. I am assuming that CERA/IHS has long had a full department of world-class petroleum reservoir engineers more skilled than F_F, SS, Euan, et al.
This glaring CERA misprediction must be due to the fact that Yergin blew it in estimating the global amounts of: "can't reduce consumption, as opposed to won't." His economic experts must have assumed that most of the world would be now radically conserving by gladly pedaling bicycles and pushing wheelbarrows so that the USA's soccer moms could continue to drive their SUVs while yapping on cellphones.
In short: I think Yergin forgot that one barrel of crude = 25,000 physical man-hours. If he and his corporate staff did this for a week:
http://www.uni-kiel.de/sino/ar/sk/12a_1970s.jpg
...then I think his future predictions will be much more similar to what we see here on TOD.
Incredibly mind-boggling, cruel, and horrific demand destruction will have to occur first for his $38 'Yergin Unit' prediction to come true:
http://www.youtube.com/watch?v=CUz_JHeM59M
Sadly, most bullets are cheaper than a gallon of gasoline.
It is not clear to what extent Americans can reduce global destruction, as opposed to won't.
I hope 150 million bicycles and wheelbarrows becomes the preferred choice, otherwise I remain a fast-crash realist.
Bob Shaw in Phx,Az Are Humans Smarter than Yeast?
Andrew McKillop did a study about 2 years ago and concluded that gasoline prices had to reach $3.80/gal in the USA to get average household gasoline expenditures to the same % of net household income as in 1981, when the price was high enough to curtail consumption. That number is probably neare $4.00 now. This % of disposable income change may be the main factor that has changed elasticity. Murray
Actually, it's $4.38...
Stuart,
I noticed that the OPEC quota system seems to be reactionary (mostly), until lately. Is there any reason for this?
Thanks, D
One might argue that the world couldn't have refined the extra oil, had Saudi Aramco produced it (thereby causing much larger violations of the historical relationship between oil and gasoline prices). Global refinery utilization data is poor enough to make this a difficult argument to evaluate.
You might also factor in that any well-managed refinery will schedule any maintenance that takes a large amount of time when it looks like either their demand is low (preferable) or their crude supply is low. The low refinery utilization could be more of an effect that a cause.
I think its two things a recognition of peak light sweet and a rush to complex refining which is non trivial and means of course that little expansion of light sweet refining capacity was done. This burp if you will as the refining industry that can transitions is a big part of our current issues. So I believe we have a real but temporary oversupply of heavy sour crudes.
I think that the loss of 1mbpd of light sweet is the issue not KSA I hate to disagree with Stuart but I suspect his match up is a coincidence and the real culprit is light sweet.
So I think we need to understand the dynamics of light sweet crude and simple refineries before we can look at other issues.
Daqing Oilfield
Found a new article this morning about the 1st QTR 2007 production of Daqing as an average 848,000 BOD.
http://www.chinadaily.com.cn/bizchina/2007-04/18/content_853658.htm
The 2005 average production was 899,000 BOD
http://english.people.com.cn/200601/04/eng20060104_232857.html
Giant Oilfields
There are only three oilfields in the world producing more than a million barrels a day, down from four in 2001. All three of these are past their peak production outputs.
Kashagan in the Khazak Caspian might reach 1.5 MBOD capacity next decade.
Manifa (Saudi Arabia) is supposed to be on line in 2011 and might reach a maximum output of 1 MBOD.
The ACG project in the Azeri Caspian is a combination of three fields tied into an undersea pipeline that might peak in production of about 1 MBOD in 2011.
Iran has imported a semi-submersible rig built in China and is expected to be searching for oil in the Caspian Sea this year. There were potential multi-billion barrel prospects in the Iranian Caspian Sea offshore. Recent evaluation well discoveries in the Turkmenistan offshore Caspian have been announced.
World oil prices were rising with output increases of 1.5% per year during the first half of this decade. Output has been more stagnant over the past two years. Some companies were diverting resources from oil E&P to LNG liquefication projects as it was difficult for those outside of the Caspian, West Africa, North Africa, Brazil, China, and the Deep GOM to find new reserves of lighter grades of oil. Russia and Venezuela have threatened to nationalize some foreign capital investments. Persian Gulf countries were yet finding numerous smaller fields. Iraq is shut in due to civil war, if the war will end they might be able to produce 4 million barrels of oil a day sustainable.
Hi Stuart
Another great post!
On IEA production data they include Biofuels (0.34mbpd) and syncrude from tar: Venezuela (0.6mbpd) and Canada (1.0mbpd) all figures as best I can tell. So for March 07 total production less biofuels and tar were 83.57mbpd according to the IEA. They do break the biofuels out, but not the tar.
I believe Venezuela is reducing syncrude from tar production to 450k bpd from end May. I guess the US is going to have to swallow that - another 150kbpd to find elsewhere!
Taking that number - the IEA total less biofuels and tar; production totals are gently declining. If KSA continues along its current trajectory things will come sharply into focus in just a few months.
Thanks for all the great work. I; and I am sure all of us, have a much better understanding thanks to you, Euan, Robert, FF and all the rest.
General question: If US refineries can’t handle more capacity, why don’t we just buy more finished product? According to the EIA, we’ve increased Finished Motor Gasoline imports by 1.2% from last year. Why wouldn’t we go to 2.0 % or higher? If OPEC thinks that the US can’t refine more than 15 to 16 mbd of crude, wouldn’t it be to OPEC’s advantage to provide this service?
And for R2, or anyone so inclined, what percentage of the fuel increase is due to the dollar’s devaluation?
Stuart…fascinating as always.
Hi Stuart:
Nice work, but a numerical methods question for you: In your first figure you show "Two estimates of total global liquid fuel supply, with 13 month centered moving averages recursed once".
I assume that means you slid the avg. window across the raw data to produce a series "S1" then slid the window across S1 to produce a series "S2", which is what you plotted? If thats what you did then it's a bit confusing to say "recursive". There are a class of digital filters, like for example Chebyshev filters, which are commonly (ummm thats if anything as arcane as digital signal processing can ever be "common") refered to as "recursive" but it seems like maybe thats not what you have done here?
If this is correct then I wonder why you are doing the second averaging pass, and not just plotting "S1"?
Alternativly have you considered the merits of doing a power spectrum on the raw suppy/production data to see where the signal and noise actually are i.e. view the data in the frequency domain rather than the time domain, then construct a filter based on that?
I ask because it's not clear to me if you really want to "low pass" filter the data, or "notch filter" the data at a frequency of 12 months to discard annual variation...
Either way a purpose built filter for the frequency range of interest might be "kinder" to the data.
Just a thought...
Please help Stuart get this distributed.
New slashdot procedure, go to this address:
http://slashdot.org/firehose.pl
Search for the title of the article, and after you have logged in, vote it "up."
Don't forget reddit, digg, stumbleupon, and all of the other link farms either.
You're down to purple already.
Having had stories on Slashdot before, can I suggest that if you want to get them accepted you need to appeal a bit more to the populous?
For this one I'd suggest something more like:
Its difficult to catch the eye of the general Linux fiend in the firehose, but editors tend to go for descriptions that provoke comment and interest, and which often ask an implied question.
Thanks Gary. Go ahead and resubmit it to /., title it differently and use this description...
(Yes, we need money for a PR person. That's been me, but I'm just a political scientist. *laugh*)
Proff Goose, I'd gladly kick in a couple of Benjamins. How about figuring out a fondraising scheme? Jim Baldauf at ASPO is thw smartest guy I know at public relations and fundraising, let's get hum to give a suggestion or two!
Had a go but didn't get anywhere. Engineering the social network sites is definitely an art form - not sure its one that the marketeers or PR people have really caught up with. Its also one that continually changes.
If the aim is to get the message out to as wide a swathe of the public as possible then a potential approach is to distil down a message into a press release and put it on the wires - on a day when there is little else happening. The right message, and not too much techie details, could find interest in the wider press. I can see certain reporters going for an angle "plucky amateurs, open source analysis, no political standpoint, worrying conclusions".
I'll try and find the time to put a few thoughts down in a longer missive and send it to you direct.
http://www.energybulletin.net/30032.html
Published on 23 May 2007 by Falls Church News-Press. Archived on 23 May 2007.
The peak oil crisis: The minimum operating level
by Tom Whipple
I dont mind you guys having our gasoline, as long as you stand in line at the pump to buy it [7+ $ a gallon]. Trouble is - you get our wholesale duty free price! So the wholesale price has to rise to our retail price to stop you buying. At that point we will be paying about 20 $/gallon..
Interesting - on Wednesday, there was a short news filler about gas prices, with people's reaction and some harder data.
Peak oil was in no way mentioned - no surprise, as the idea that oil runs out is not controversial, though the implications of that reality are not really debated.
What was intriguing is the level of detail concerning the gasoline market in terms of American consumption. Also basic knowledge, but the numbers remain interesting to hear.
Interestingly, the item ended with some older, somewhat authorative voice saying that the only way to have lower prices was to reduce demand - with the concrete suggestion that people should walk and bicycle more as the price rises.
Almost amusing in a way - except that quite literally, that will be the way more of us will get around more often in the future. Whether it will bring the price of gasoline down is another question.
Stuart - you set the bar high!
Do you have a job?! Amazing work....I don't know how you find all the time for these posts (same goes for Robert, Euan, etc).
The decline of KSA is probably behind the OECD inventory draw of nearly 1MMBPD - since demand is barely softening.
I defintely agree that the weakening US economy/dollar will adversely affect the US ability to import oil and gasoline.
So, I also agree that the gasoline situation/price may be a good thing as it might begin to condition higher costs for energy and HOPEFULLY a lower per capita usage. Now, if only we could stop the population growing(ie. negates lower per capita).
Can anyone hazard a guess as to the cause of the discrepancy between the EIA and IEA "total liquids" figures? Over the past year or so, the gap has grown to nearly 1 MB/D; I'd say that's pretty significant!
Here's a nice fact about the refinery business that popped at the Senate hearings yesterday:
It'd be nice if one of the gasoline "market" experts here might come with a series of such facts, so we could actually see the architecture of so-called market.
Instead we now get a trip over to Saudi and once again a a skirting of the fact that price spike in the last few months has been publicly acknowledged by the industry to have been caused by refinery "breakdowns."
But better is the oil industry on the front page of the NYT threatening they won't do any additions to refinery capacity because of ethanol. Hah, just trust us! And why is the public so ignorant of peak oil, when no one at the top of the industry acknowledges it? It's downright mystifying, right guys.
I support $5 a gallon gasoline and as little of it as possible going to the industry.
It'd be nice if one of the gasoline "market" experts here might come with a series of such facts, so we could actually see the architecture of so-called market.
Why don't you do a bit of homework, and tell us all how that compares to other industries? You might feel stupid after finding out. Here, I will help you along:
Compare that to more than 95 percent for auto makers and more than 85 percent for seven other industries.
What a tool.
Valero is one of the new major refiners. They have been buying up old refineries for years, modernizing them to enable them to handle heavier grades, and expanding their capacity (it is often said the us has not built a new refinery for 30 years, which is true, but many refineries have been largely expanded and our refining capacity has grown, just not as fast as our consumption, explaining the growth in imports. As an aside, and as noted above, sa starving asia of product reduces the asian capacity to ship us gasoline.)
If the us ever sees a need for new refineries, they will relax the environmental thicket that makes a new one somewhere between impossible and prohibitively expensive.
The following is from an energy letter I receive... sadly, the graphs did not come through.
Gasoline - Refining
The most frequently asked question in recent media interviews: "Are high gasoline prices caused by a conspiracy?" The only thing better than a conspiracy is a secret conspiracy theory. It can never be subject to verification. After all, if it is a secret conspiracy then you can't be expected to find any evidence. It's a secret!
There hasn't been a new refinery built since 1978. If you are in the U.S. you have heard that statement once a week for the past few months if not years. It is a true statement but not as strong as it could be. The U.S. has less refinery capacity than it did in 1981 would have even more impact and it is true. There were 324 refineries in the U.S. in 1981 verses 148 today. However, refineries on average are over twice the size of those in 1981 with an average capacity of 118,000 barrels per day.
In contrast to the negative statistics, U.S. refinery capacity has increased by 14% in the last 10 years.
Let's look at some history behind the refinery data. It is not surprising that there was a big drop in refinery capacity from 1981 to 1986. High prices in the late 1970s, the fuel switching that followed, introduction of the CAFE standards for automobiles and other improvements in efficiency assisted by back to back recessions caused a dramatic decline in consumption between 1979 and 1983.
The decline in consumption starting in 1979 coupled with increasing refinery capacity through 1980 caused utilization rates to fall from 89.6 percent in 1978 to 68.8 percent in 1981. When you look at utilization rates it is important to note that they are aggregate rates. Most refineries when operating attempt to run as close to 100% of capacity as possible because it takes almost as much fuel to operate at 70% capacity as it does at 100%. In the wake of falling demand and greater capacity the smaller less efficient refineries shut down and contributed to most of the capacity loss in the early 1980s.
In the last two years capacity increased 230,000 barrels per day. This is the equivalent of a good sized refinery and a little less than half the size of the largest refinery in the U.S. The 2 million b/d increase over the last decade is equivalent to current output of the four largest refineries.
NYMEX Prices for May 22, 2007
NYMEX Light Sweet Crude -1.30
$64.97
IPE Brent -0.97
$69.52
RBOB Gasoline NY Harbor -0.0950
$2.3063
Heating Oil NY Harbor
-0.0437
$1.9072
NYMEX Natural Gas -0.112
$7.801
However, the industry has not been able to fully utilize its capacity for almost two years. If there is a conspiracy to limit supplies of gasoline to drive prices up it started in September, 2005 and must involve arranging for hurricanes Katrina and Rita to make landfall in the area where the U.S. has its highest concentration of refineries. Since that time refinery utilization averaged 3.1% lower than the 5-year average before the hurricanes.
Over one percentage point of today's lower utilization rates can be attributed to the ongoing maintenance at the BP Texas City refinery. The work there is due more to problems arising from inadequate past maintenance than from hurricane damage. The BP refinery is not expected to reach full capacity until later this year keeping about 200,000 barrels per day of capacity off line during the driving season.
It is important to understand that in most cases major refinery maintenance requires at least a year of two of planning. Every 2-3 years catalytic crackers, where most of the gasoline is made, must be shut down to replace the catalyst and perform other maintenance tasks. To minimize the time it takes for repairs a refiner may hire as many as 2,000 temporary workers. These are people with specialized skills who often work at several refineries over the course of a year. There are firms that contract these specialized workers to refiners and due to the limited supply of qualified people the arrangements are often made over a year in advance.
The hurricane problem has been compounded by legislation that required a switch from MTBE to ethanol as an oxygenate in summer blends of gasoline last spring. In addition last fall refiners had to meet more stringent requirements lowering the amount of sulfur allowed in over-the-road diesel. Both requirements resulted in additional down time for refiners to configure their refineries to meet the new specifications.
While conspiracy theories abound it is hard for us to imagine the manager of a refinery willingly shutting down production at a time when the spread between gasoline prices and crude oil is three times normal.
On top of all that, according to today's New York Times, refiners are now saying that the projected increases in ethanol are discouraging them from building any more refining capacity. So, are politicians now going to insist that we have more refinery capacity while simultaneously subsidizing the crap out of the ethanol industry? Jesue, we can't even get bad policies right. Somehow, that doesn't seem to make a great deal of sense. Wasn't the point to reduce our demand for gasoline and to cut back our addiction to oil.
Earth to congress!! Decide what the hell you want to do and get back to me.
Assuming that we actually want to cut oil consumption and cut greenhouse gases, we should be pleased as punch that the oil companies and refiners haven't built even more capacity.
In congress, the right hand doesn't even know what the right hand is doing much less knowing what the left hand is doing.
Earth to American people. There are all sort of reasons for the rise in gas prices but the primary driver is that you are fat, unhealthy,lazy pigs who think that luxury vehicles as big as small buildings are necessary for your well being. Prices are high and will get higher. Get used to it. If you are smart and paying attention (which is doubtful) you will make other arrangements.
Well, excuuuuuse me! I didn't know we actually wanted unrealistically high production of ethanol and unlimited gasoline supplies. And I guess we can throw in higher food prices in as a bargain.
As for me, I am staying home this weekend. The parade of fools are headed my way as I live in a tourist area.
FWIW, here's a picture of US "operable" refinery capacity, inputs to refineries (green), and "idle" capacity (plum) which is operable but not operating.
The definitions of the terms are:
This is monthly data that goes through Feb 2007, so doesn't show the period of the last few months when gas prices have gone so sharply above what oil prices would predict.
"...when gas prices have gone so sharply above what oil prices would predict."
Perhaps you are comparing the wrong crude/gasoline prices... compare us gasoline with ex-us crude.
Asian refiners exporting gasoline into the us market are just as happy with a high gasoline/crude spread as are us refiners, resulting in their bidding against each other to get the crude they need to send us more gasoline. In this case, high us gasoline prices are driving both ex-us crude and gasoline prices.
Another example where fungible crude/gasoline shows that it does not matter whether sa restricts shipments to asia or the us, the reduction directly and almost immediately affects us prices in one way or another.
Stuart:
One of the problems that we must deal in models is determine what constitutes a baseline for comparison and what constitutes the best model. I actually became quite interested in this last year when both oil and gasoline prices were on the rise. I was surprised by the results.
I use the 1992 calendar year as a baseline where both oil (WTI weekly spot market average) and gas prices track extremely closely. If you then compute the "current value" relative to the baseline average for both oil and gasoline you see something rather interesting.
First, you can see the effect of gasoline taxes on the rate when oil prices dropped in the late 1990's. For a period of time gasoline prices (relative to the 1992 baseline) were much higher than the relationship to oil prices would suggest. However, as oil prices recovered, gasoline and oil price came back in-line with each other.
That is until July of 2004 where gasoline prices, compared to oil prices (again weekly averages of WTI spot market) showed a marked departure from the 1992 baseline. While oil prices were rising, gasoline prices were falling. It appears somewhat different from the Brent data, however, the price differential between Brent and WTI was opening up particularly late in 2004.
This devaluation of gasoline prices relative to the WTI oil price has continued until the end of January and first weeks of February 2007 where the rate of change of gasoline prices has increased substantially compared to oil prices actually bringing the two datasets back into "alignment."
Also, this data is highly auto-correlated, but "adverse" effects on a derived correlation model seem relatively minor. And when looking at the residuals, issues like heteroskadicity don't seem to be in play. When plotting the time series, the "half-dome effect" on gasoline prices (where gasoline prices rise quickly and then fall slowly) is much more prevalent in the 1990's data, less so since 2001.
I also use an exponential model as opposed to a linear model. For all data since 1992 to present, there is not a statistically significant difference between an exponential model and a linear one. Some years, like 2005, just aren't on the curve no matter which correlation model you use (I've got them color coded so each year is easily discernible).
However, when modelling more recent data (from 2002 to present) the exponential model gives a better fit than a standard linear regression and 2005 does not standout so much in this approach (though both a number of outliers relative the oil prices in the past few months is apparent).
Note that last year's oil price showed a considerable undervaluation of gasoline in my dataset.
I've been too lazy to drop the data into SAS and see if I can tease out a more refined relationship with the oil and gasoline stocks data. I looks like there should be. But the Excel spreadsheet is good enough to tease out these simpler relationships.
Perhaps we should compare notes.
Recent Ghawar Drilling
Stuart has given his best guess as to how much oil is left in 'Ain Dar based on correlations between the Linux Supercluster 3D and various Ghawar maps plus other evidence:
Another piece of evidence comes from what KSA has been doing in response to this situation. Where have they been drilling?
One of the graphs used by Stuart (refered to as the "industry" map or IM) showed oil well locations superimposed on Arab-D contours. It is not known how recent the location data is, but the figure originates in 2001-2002. I have endeavored to correlate the IM with satellite images in Google Earth. Shown below on the left is part of the IM as a GE overlay, and shown on the right is the overlay with the exact positions indicated for wells which correlate with the IM locations. There is fairly good agreement, with only a couple of IM-indicated wells that can't be found. (Exact well locations shown as red dots)
However, there are many wells present in the satellite image which are not in the IM map. Shown below on the left are wells which are operating but are not among the IM set (green square dots), and shown on the right are locations where wells are either very "fresh" looking or are under development (brighter green dots). It is obvious that their efforts are rather concentrated.
What do these wells look like? Below are images showing an older well (left) and one being developed (right, although it could be a new Wal-Mart). Note that in the right image the square region being graded is about 140m wide.
We can then check how well these new wells correlate with Stuart's analysis. Shown below are overlays with the 'Ain Dar remaining oil plot and with the Asphaltene Map where Saudi Aramco has discussed gas cap issues:
I guess you might as well drill where the oil is (and the water isn't). The date of the satellite images is not known, unfortunately.
Similarly, we can also use the industry map to look at the recent drilling in Uthmaniyah (left, with the locations of newer wells as green dots), and then overlay with the figure from Stuart's analysis showing where the remaining oil is:
They have definitely been drilling in the saddle region like mad. Note that the resolution on the east side is too poor to identify oil wells conclusively.
I will post the Google Earth data on the GE users BBS after I tidy it up a bit.
Well here we go!!!
I'm SURE some one on TOD can pull up an older (2003) satellite map and then get a newer noe and do this anaylsis even better. This guy has shown us the way! Maybe even divide new wells by new drilling rigs and see if it makes sense. This is the REAL smoking gun because they can't hide from the eye in the sky...
Outstanding!!
My initial read is this is very compatible with my analysis - is that your interpretation also?
I think you've basically mapped the MRC campaign to maintain plateau and get at the last of the oil in North Ghawar.
Also, am I understanding correctly that the lack of new wells in the lower half of north Uthmaniyah is due to lack of data to do the analysis, rather than a conclusion that there are no new wells there?
This should be it's own guest post.
Also worth noting is that I added a 20% width correction to Uthmaniyah based on my view that the Croft map (which you have above) shows it too narrow. The drilling data you have inferred seems to be generally consistent with that also.
Isn't it a bad sign that they seem to be drilling the most recent wells right on top of the gas caps?
It's hard to conclude much from the wells in the gas cap areas - the well might be intended mainly to produce the gas for all we know.
I'd very much doubt that - more likely that they are new gas injection wells. At some point GaryP sent me pictures of drilling locations on the Crest of Ain Dar and he pointed out they could also be drilling for Khuff gas - in fact injecting Khuff gas into Arab D may be a sensible secondary / tertiary recovery strategy.
I don't know if there would be a difference for gas wells drilled for reinjection purposes, but the gas wells in Haradh look like this:
Do you have any reason to believe these are gas wells? I read them as MRC wells. Their age and configuration in Haradh III certain read as such (eg new between 2003 and 2006, arranged in a horseshoe inside the water injection wells).
PS see posting below.
I could be completely wrong.
I assumed that they were gas wells because:
Just east of Haradh III, near the airstrip and just north of the line of irrigation circles.
Gas processing station or GOSP? To me its a new design GOSP and the pipelines seem to feed into it.
Put it this way, if they are not the MRC wells, they are in the right place. You are right though, they infill more than data suggests they should. Someone has been telling at least some white lies. However, if you say each produces 10,000 barrels then I'd estimate maybe an extra 100-150,000 barrels if these are producing.
Hmmm, maybe its worth giving the south end another look...
It's apparently both a floor wax and a dessert topping:
http://www.hydrocarbons-technology.com/projects/haradh/index.html#haradh5
I'm sure my post would be happy to be upgraded.
JB - I'd certainly like to see this as a guest post. This is fantastic work - showing that we are entering the end game in North Ghawar. With all those new wells in Uthmaniyah - why is Saudi production falling? I will stick to my view that this is voluntary restraint.
Do you have anything on Shedgum?
I'd like to see an estimate of the number of Ghawar wells drilled / year - and how many rigs might have been required to achieve this? I'm not sure I see any evidence here for an accelearted drilling program - and still beleive that the modest growth in rigs (absolute terms) is related to pre-drilling wells on Khurais and other new field developments - though happy to accpet that their may have been an acceleration of drilling on Ghawar too.
The charts are from my bare Saudi post. If you want the spread sheet to get at average no of rig days / well - then send me an email.
http://www.theoildrum.com/node/2372
I'm sure my post would be happy to be upgraded.
If you want to send me the post - formatted as it was when you posted it (with any changes or additions you want to make) - I will put it in the posting queue. My e-mail address is in my profile.
Yes. While aligning the Arab-D structure with the satellite images (without benefit of the actual data) is somewhat subjective, it is clear that their efforts are concentrated on particular areas.
Correct. Do you have any other figures which show oil well locations?
BTW here is the map at OWC offset +465, which is what my model and the cumulative production graph for 'Ain Dar/Shedgum says should have been the situation in 2001 (the date of the 'Ain Dar well map source paper).
Holy crap. Great work.
Holy crap - I thought you were on holiday!
Anyone taking a commercial flight over Ghawar with a high speed camera ?
I'm only half joking.
Can we please have this moved up as a key post ?
Really great work, seems to correlate very well with stuart's... best case is they are drilling thru the gas caps because all the remaining oil is just below the gas, worst case is north ghawar is now a gas field, most likely the former, but no matter what, north ghawar is toast... isn't this where they produced 3.9Mb/d?
this approach could be extended to all the very old middle east fields, maybe even all of the world's super giants... things look pretty peaky to me.
Yes on the 3.9mbd.
I'd also like to point out that there is one last big prize to be had here. "Carl" the other day hinted at the possibility of Saudi Aramco raising production and shortening plateau in south Ghawar to partially compensate for the losses in the north.
If that were so, it would have to show up as a big recent drilling campaign in South Uth, Hawiyah, and down into Haradh. If someone can correlate the wells in the Voelker thesis well simulation picture with Google Earth, it might be possible to detect and characterize that activity.
Just thinking out loud...
The big multilaterals on S Ghawar are probably choked back - so raising production might be achieved by opening the valves a bit.
Been there, tried that.
The problem is Hawiyah and Haradh I are only covered at relatively low resolution. Haradh II & III show up, Haradh III with the (then) new MRC work. Infill is slightly higher than the well location data would suggest, but nothing that really screams mass emergency drilling.
One thing I was going to say earlier, doing this analysis of GE wells suggests that viable wells do not seem to follow the simple gravity driven waterflood view. N & S Ain Dar appear to have too much going on in supposedly dead areas circa 12 months ago to be over.
For example here is what looks like an MRC construction, still ongoing, 1 year ago, and off the crest. Elsewhere there appears too much activity continuing to be on its very last legs.
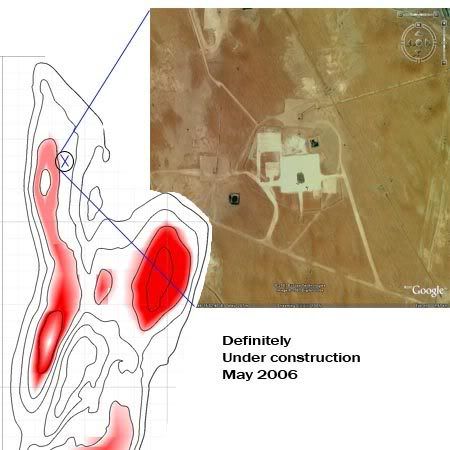
I don't think the free version has this feature. I haven't used it for some time. This feature in the Plus version allows you to look not just down but to change the angle of view to be horizontal, look along the horizon. With just the PLUS version I can do this. It allows you to see the "sides" of things. Works really well.
Also to me, I see a slight jump in resolution when I do this at lower altitudes. This would be helpful in trying to identify exactly what you are looking at. Birds eye is tough except for experts imo.
It also shows you the elevation rises, which Stuart was trying to describe in his article. The height of the field is a long slope. You can see this using this feature.
The control bar/circle for NSEW on the top right corner, do you have another bar above that, just a horizontal line. Moving this changes the Angle of View.
FYI I don't think the money to go to PLUS is expensive. Like 25 or 3 bucks for the year I think. Might be a little more. Well worth it if you use Google Maps.
Quid Clarius Astris
Ubi Bene ibi patria
I suspect that a lot of bypassed oil will exist because of the super k zones I've read about. It would be nice to get info on how many bypassed zones exist. Also I think your losing your perspective this is a field coming off a 3.9 mbpd or so peak so its still going to still produce a lot of oil. Even dying Ghawar will rank as a giant for some time.
Wow, spectacular work JB. My gut feel is that this does indeed show that North Ghawar is in serious trouble. However, let's think of what the possible interpretations are
1) (the obvious one) wells on the flanks are becoming unproductive as the waterflood front moves up past them, necessitating drilling further up the crest of the structure - the new wells being drilled are producing wells - and given that they are being drilled right in the centre of the structure this is the last step in the (secondary recovery) life of North Ghawar
2) (similar to the above, but not quite as bad) - wells on the flanks are still productive, however with water-cut higher than expected. This explains why KSA production has dropped rapidly - it's being limited by water handling volumes, requiring throttling back of productive (but high water cut) Ghawar flank wells. New wells are being drilled into the dry oil in the center of the structure to allow overall water cut to be decreased and more of KSA's oil (rather than water) processing and export capacity to be used.
3) some other possibility. Pressure maintenance? Seems unlikely - what would they be injecting? Ghawar has aquifer support doesn't it, so this would be unlikely. Gas production? Again, surely unlikely - unless they've built a NGL or LNG plant that they're keeping secret.
My bet would be that 2) is nearer the truth than 3)
Cuchulainn
Sources: the EIA, Senator Lugar's website, and World News Network.
Saudi Arabia has said the section of the IPSA pipeline within the kingdom is now being used to transport natural gas and has ruled out its re-use as a crude conduit from Iraq.
Much of Saudi Arabia's natural gas production seems to come from the eastern part of the country, the offshore fields in the Persian Gulf and the NG associated with the Ghawar oil field.
The IPSA pipeline was intended to be a way for Iraq to export oil via the Red Sea port of Mu'ajiz, near Yanbu, during the Iraqi Iranian War. Yandu & is a major industrial city utilizing NG for energy. Considering the Saudi push to expand domestic NG production and use, it seems to make sense KSA would use the IPSA to move NG west to the Red Sea. Except that the IPSA doesn't appear to be the route of choice. If the IPSA is being used for NG, it could be fed from the Trans Arabian/Jordon pipeline, though a connection between the 2 would have to have been built.
In Oct of 2002 Saudi Arabia did complete a $4 billion natural gas processing plant at Hawiyah, near the middle of the 164 mile long Ghawar oil field. In 2004 a natural gas processing plant was opened near Haradh, the southern tip of the Ghawar oil field. Natural gas production from these plants can free up significant quantities of crude for export.
1) October 2002, new natural gas plant.
2) June 2003, IPSA is said to have been converted to natural gas.
3) Summer 2004, new natural gas plant.
Rest of Diary:
http://www.dailykos.com/storyonly/2007/4/28/17138/6463
JoulesBurn
Great minds...
Can you get in contact. I've got something very similar that I've not had the time with work pressures to finish off. Combining and cross checking seems sensible.
You can reach me at [tod at igo4 , co , uk]
PS the maps are traceable to 2003 and 2006
I will contact you.
How did you ascertain the date of the (satellite) maps?
Enable the DigitalGlobe coverage layer at the bottom, to see where they line up. This will tell you the acquisition dates.
Joules, please contact me: mike@plan99.net, I may be able to help you.
Off shore, Khurais, the empty quarter.
Beware the flood....
Watch 'um folks, thar' fairly dangerous men...
(apologies to Charlie Danials Band)
RC
Remember, we are only one cubic mile from freedom
Very very nice work JoulesBurn, you've opened a new front for quantitive analysis as well as support the Ghawar work by Stuart. Where does everyone get the time to do all this?
I use google earth for some other research I do. JB do you have the "free" version or is this a payfor version. Could you post a ..Lat long.. for the area to save a little time. I will check it on my version and see how close to ground I can go before it blurs.
It varies on how good the source was. These are most likely sat pics. I doubt they paid or were allowed for a fly over to map. How old they are could possibly be found out by using the lat long and emailing cust. service for an answer.
I have a paid version, but not the type used by the big guys. Some maps I can get close as a few hundred feet. Might be able to make out the buildings etc better.
Does anyone know of someone that has the PRO version of google earth. Going in and taking some snapshots and a fly over at low altitude
Also, I might save these, several people just in case. Google has taken to wiping and replacing maps. Note the pics of new orleans. Who knows where else.
You know this site is watched, right, don't be silly and think that this site is not on a list. Heck after Stuarts work in the last few months, it's also a source perhaps. Tell us Prof Goose or leanan. How many interesting IP's you get a day. How many have a gov address, and thats the ones not hiding.
Quid Clarius Astris
Ubi Bene ibi patria
Hello PrisonerX,
I doubt if we are a source for the NSA/CIA, but I am sure they monitor our progress. Hi guys!
Please consider that classified military spec satellites and other equipment probably map worldwide oilfields daily [along with other stuff]. Everything from infrared spectral analysis, high-res photography, minute acoustic vibration in pipelines, GOSPs, refineries, etc. Whatever in the electromagnetic spectrum that can be sensed.
They could probably tell us exactly what MiddleEast wells are in production and what pipelines are being used on a daily basis. But I highly doubt we can get access to that info.
Bob Shaw in Phx,Az Are Humans Smarter than Yeast?
Looking around Ghawar my google earth version tells me I'm looking at a map that is copyrighted 2007. The map that shows my house is also an updated version. The version I looked at a few months ago was several years old.
I can get to within 3-5km height with very good focus at the worst. some places I can get down into the 1k. Though the PRO version could get you much closer unless Google earth has been told, or does not allow it.
I was referring to identifying what the structures might be.
Stuarts work is worthy of the praise. The way he did it was top notch. I was being a little tongue in cheek, because they do have access to much better images and "other". Though I do wonder if they do have better images he used for underground. Its a state secret that stuff. Valerie P was rumored to have been involved in trying to crack that nut. Busted and outed and any contact she may have developed, well,..
Joules had a great idea in looking, I thought about it, but I don't have a clue as to what I would be looking at or finding the area. I couldn't tell what was what so I didn't do it. I also thought that the images would be old at best. Some though are "blocked' in a weird way so its hard to make out.
If someone could give me the boundaries for the section SS used I can see if the images are decent and post them so others can see if they show active wells etc perhaps.
If these are 2007 images, and that is what Joules is getting then I think it is valuable.
Quid Clarius Astris
Ubi Bene ibi patria
All versions of GE use the same imagery database and can fly to the same altitude. Upgrading will not get you anything in this case. It is easy to see the dates of images if they are sourced from DigitalGlobe, you can do it within the program. Alternatively give me lat/longs and I will look it up for you. Most of these images seem to date from July 2006. Ignore the copyright notice at the bottom, that doesn't reflect the true date of acquisition.
Meanwhile, trouble in Export Land. . . this gives you an idea of the difficulties that exporters will have when they try to reduce domestic consumption.
http://www.guardian.co.uk/iran/story/0,,2086764,00.html
Ahmadinejad faces backlash over plans for petrol rationing
Robert Tait in Tehran
Thursday May 24, 2007
The Guardian
To follow an emerging topic upthread, perhaps KSA cutbacks are at least partially voluntary, in conjunction with US, part of an effort to push crude costs up enough to create such domestic pressures as described in this article - to get rid of an unruly neighboring regime? Regime is therefore torn between exporting and keeping more at home for rising domestic demand as their production falls.
Since Iran imports a lot of Gasoline if its feasible for the US to do a "gas" squeeze then this would make sense. I just can't see KSA. With that said a good look at light sweet production vs gasoline prices is needed to ferret out the truth I think. Also this would imply that KSA would favor cutting of the best grades of crude they produce and at least from their press reports until recently its been cuts in heavy sour crudes which in general the market is well supplied with.
One thing for sure whats happening now is a complex global interplay of a lot of factors. Peak oil is the underlying cause I agree but its surprising how complex its playing out.
I think I'll just wait a year and let good old depletion build and give a clear signal :)
http://en.wikipedia.org/wiki/Google_Earth
The google earth satellite photography was less than three years old, exact dates unknown.
1-15 meter resolution, 15 meter more common.
Not much drilling in areas already flooded with water is the best way to describe what I thought I was looking at.
Thanks for your endurance.
Iran could easily reduce their gasoline imports to zero. The problem is that a huge percentage of their cars are old and ridiculously inefficient and polluting. If fuel-efficient cars were provided without tariffs instead of subsidizing the old technology cars being made by Iranian car makers, Iran could easily reduce its gasoline consumption by 30-40%.
So essentially what I'm saying is that the government is extremely stupid when it comes to energy policy, but of course the leadership are looking after their own interests, which involves profiting off the Iranian car companies by tariffing new, fuel-efficient cars from the rest of the world. Instead of this simple and environmentally friendly solution they are turning to gasoline rations.
I don't think that's that much different than how it will play out here. Most people, incl. most drivers, pay minimal taxes so tax incentives won't really work. I suppose the govt. could give out vouchers but for how much? The reality is that as real incomes drop crapped-out cars will be in bigger demand while new cars, whether they be fuel efficient or not, will be less so.
Matt
By the way, I completely forgot to mention that I emailed the author of the "Linux Supercluster" paper and he told me where the famous 3D viz picture of Ghawar comes from. It is Fig 13 of this paper.
It doesn't change the situation radically, but fleshes out the picture a bit. Makes it seem like the most likely year of the image is 2003, not 2004, but doesn't nail it for sure. The model in question has 9.6 millions cells (the maximum at the time) and 2960 wells. So it's major full-scale model of the field.
Cool.
Judging by wording in the references, the paper was finalised between June and October 2003. So the image must be earlier than that?
cheers
Phil.
Well, my working assumption has been that 2003 means 2003.0, so that would be my guess.
What the paper actually says is that five years of production were simulated in the tests of the model (the main focus on the paper is performance analysis of the model running on various hardware combinations). So probably it's 1998.0-2003.0 and they put up the last year. Someone could argue it might be a prediction study of 2004.0- 2009.0 and you couldn't rule that out from the paper text, I don't think.
So we are still back to requiring other evidence to correlate to this picture to constrain it's dating. However, we have a lot of that now, and another increment with the amazing hard work JoulesBurn reported on upthread.
Computer geeks think a like :)
I still say 2002 but 2002-2003 is close enough :)
One thing I'd like to add is the the US can do a much better analysis of all the above ground oil structures in every country so I suspect that they have a detailed understanding of the current state of the oil industry for all countries.
They can of course correlate this information with other sources. This means detailed reports on KSA probably exist and might be accessible via the Freedom of Information act. The trick seems to be to get the exact index or id of the reports.
Yet more evidence that the US government is fully peak oil aware.
I agree with you that the Govt. knows and is going to take extreme measures to prevent the public from knowing. Look at the graph linked below:
http://blogs.salon.com/0002007/2007/05/23.html#a1873
This is an alarming graph!
Look at how the inflation corrected price after the early 80's just kinda bumps along without drastic swings UNTIL 2005. Now every summer we are geting wild swings in price because there isn't enough oil. Soon even the winter will not dampen demand enough and it will be up, up, up for good.
Now also notice how every summer the last few yrs we have something huge to distract the publics attention, 2004 waas Iraq, 2005 was Katrina, 2006 was Israel-Lebanon war, and 2007 is ??? maybe Iran War???
Yes the gov knows.
Yeah right, like they just "knew" Saddam had all those WMD... really this absurd exaggeration of the technical prowess of the US government into an omniscient entity is complete tosh. Perhaps it gives people like you some reassurance that there is a "God" somewhere that knows everything, but whatever the reason, it's irrational.
The sad fact is that governments are generally clueless and stumble about like everyone else. Is that idea too scary for you to believe?
Hello Bob,
Paying attention by the people in charge to what is given to them is not the same as not knowing. WMD please lets not discuss what agency knew what when. Don't tell me you're relying on the mass media for your info on this.
here is a link to
http://www.theblackvault.com/
the blackvault might have some info. Search terms etc.
EDIT. I just went there and its changed. Its not like it was a couple of years ago. I had heard it had changed and looking around I see it has. If you register maybe you can do more. I had heard thru the grapevine that the 'mods" seemed to be a tab bit right of normal is now confirmed by what i saw. Disturbing, this seems to be a common theme I am seeing lately with many different sites. "personality" shifts so to speak.
I used this site to view the document that told Reagan about using "peak oil theory" basically to bring down Russia.
the idea:
Ask KSA to pump huge amounts of oil and flood the market. This would make Russia's crude to expensive to sell.
No records on what happened, but history says the Saud's pumped, Russian wells stopped, and the country went bankrupt, and the wall came down.
Downside to this plan, or the new media term is "blowback". Putin was in the K..G .B and understands all to well this strategy. Take a look at the hardball game he is playing right now.
The US govt. doesn't understand whats going on. I think they have more than a clue. Policy and use of that info is another complete animal of another color.
Search terms for that plan.
alphabet agency beginning with a C
then some description of words having to do with the plan laid out above.
its there, and its real.
you need to go down a few rabbit holes or your going to be zigging when you should zag perhaps.
Oh yes, remember this is a conspiracy theory you are dealing with, and the Black vault caters to that need of all theories.
enjoy.
Quid Clarius Astris
Ubi Bene ibi patria
Hello SS,
I assume you politely asked for the latest 2007 version? =)
Stuart, does this chart not show 2 million barrels per day spare capacity?
I'd be happy to go along with 300,000 bpd per year capacity erosion leaving around 1.1 million bpd spare. But then you need to add back new capacity that has been built in exsiting fields.
Well, it either shows 2mbd of spare capacity, or 2mbd of involuntary declines, or 2mbd of some linear combination. I wrote the post above to be neutral on this particular question, but I remain of the opinion that it's likely that a substantial fraction of it is involuntary (the arguments I laid out before on relative timing of price/megaprojects, and production changes continue to make far more sense to me than voluntary restraint. I could believe some additional voluntary restraint starting when oil got back down to $60 again, though the fact that June allocations to Asian refiners are being cut when Brent is $70 argue otherwise.
Looking at information in this and related threads, and thinking it is already 2-4 years old, I can imagine that north ghawar production is crashing, maybe down 25% in the past year, along with an equal decline in some of their other ancient fields. If this is true, we will see most of ghawar's remaining production disappear by 2010, aided I suppose by further declines in old fields but ameliorated by their planned projects, if and when they begin.
SA is only 10%... wonder how russia is doing...
Only if you believe KSA reductions were voluntary. That could mask a 2mbpd collapse with 1 mbpd of new production giving the appearance of only 1mbpd total loss.
The truth is probably somewhere between those extremes.
Ghawar Is Dying
The greatest shortcoming of the human race is our inability to understand the exponential function. - Dr. Albert Bartlett
I'm not sure I agree with your assumption that the US supply of oil decreased following the world supply reduction. You said yourself that the Saudi's are cutting shipments to Asia but not the US. If the US is not seeing the reductions, then there would be no pressure on price. On the other hand. we are seeing reductions from other countries. Therefore, I think your calculations should look at the US supply of crude not the world supply.
Comparing the 2005 EIA forecasts for 2006, and the actual 2006 production, it appears that the US production also fell short compared to what was expected.
Actually EIA is almost permanently forecasting an increase of domestic production for the coming year, but it really never happens.
june 2005 :
june 2006 :
Current (may 2007)
I estimate that since January of this year, that here in the U.S., crude oil price has accounted for 25% to 40% of the increase in gasoline price. The range is based on whether I used Brent, which incresed by $14/barrel since January, or WTI, which increased by $9/barrel since January.
Retsel
Well, I think we are looking at a concerted attempt at misdirection with the refinery capacity red herring.
Just over a month ago Bush announced that he was assigning the task of formulating aggresive energy policy by 2010. Then a week ago Wednesday he re-issued this announcement with the date moved up to the end of 2008. Hmm, some change in urgency here?
This Wednesday CNBC had a reporter planted in front of the BP Whiting, In. refinery, he claimed that their problem was due to a 'power outage'. Interesting, Whiting refinery has dual power capabilities, both from external utilities and an internal generation plant. Whatever the case, to the best of my info it is the cat cracker that is down, roughly halving gasoline production. Total present design throughput there stands just over 400,000 bpd last I heard.
(Up from 250,000 in the late 80s.)
BP Texas City, Tx. cat cracker is also down with equivalent results. Only thing I have heard are rumours of a fire, unsubstantiated. Last I heard, 5 years ago, 500,000 bpd throughput capability there.
BP Toledo, Oh. down to roughly half throughput also, have not been able to confirm if it is the cracker or a specific reason or rumour even. Last I heard throughput roughly 175,000 bpd.
I have no info from the Los Angeles and Louisiana refineries, which are sizeable operations.
Here we have just over 1 million bpd throughput in these 3 refineries alone roughly halved, taking half a million bpd of crude demand off the market. Yet crude inventories have stubbornly refused to grow by a coresponding ammount.
Very convenient...
As of yesterday, it appears that ALL of the anaylsts have bit on this 'refinery issue' as the present cause.
All the PTB need now is to make it into the end of 2008 when they can release their 'solution', hehe. Isn't there supposed to be an election around then?
Here we have just over 1 million bpd throughput in these 3 refineries alone roughly halved, taking half a million bpd of crude demand off the market. Yet crude inventories have stubbornly refused to grow by a coresponding ammount.
You are quite wrong about that:
http://tonto.eia.doe.gov/oog/info/twip/twip_crude.html#stocks
Crude stocks have gone up by several million barrels a week. How does that impact on the conspiracy theory? You are also ignoring the fact that when units are down, refiners don't buy as much crude. BP's purchases have certainly gone down as a result, so you shouldn't expect to see a million bpd piling up on that basis.
Operant word in that phrase was coresponding...
From these figures we see an 11 million bbl. increase in 42 days, or roughly a build of 261,900 bpd, which of course assumes a resolution far beyond what is actually present in EIA figures. Let's round that to 250,000 bpd, (or, ahem, a puny 1.75 million bpw, not 'several million') may put us in the right general neighborhood.
Ok, that takes care of the Texas City throughput 'lost'. One refinery down, how many to go? Still think I am 'quite wrong about that'? Rather supports my, uhm, 'conspiracy theory' now, eh?
FWIW I sold the last of my BP stock last week, apparently I wasn't the only one, nice little dip in the chart there, maybe should re-enter Tuesday. Barring unforeseen events, it should recover and continue the trend for at least one more surge yet. After taking the BP severance package I made my house payments for a few years playing stocks, mostly small caps, a LOT of energy plays (check out that RIG chart long term, been bery good to me) and got halfway decent at reading charts. (BTW, no top in on the crude chart yet, not by a very long shot.)
Yes, I feel like a newbie Fringe Lunatic when I think along these lines. I have yet to receive my membership card, must still be in the mail.
I was in the business over 30 years and have to say it is hard not to roll my eyes when I hear people talking about those evil oil companies, hehe. I have to say they have done a bang up job over the decades in finding that next batch of crude to bring into production and deliver to the consumer. I am proud to have done my small part.
But it is readily apparent that the game has changed over the last few years. There is now precious little wiggle room anywhere and we have seen a huge rise in the rhetoric coming out of virtually every player in the game. Misdirection and just plain BS is at an all time high. It seemed to pick up dramatically in 2004. This alone should be a sign to make one sit up and pay closer attention.
Not buying as much crude? There is a certain ammount of time lag built into the system and it just doesn't respond very quickly to day-to-day events. That's what happens when ones supply line is thousands of mile long. One could easily advance the hypothesis that throughput had been purpousfully decreased to cover the fact that shipments were not going to replace stocks. (And incidentaly to prepare for heavier crude blends.) 5 years ago I would have said that this could never happen, profit being so closely linked to increasing throughput, now I am not at all sure.
Wheels within wheels so to speak.
In a previous life, lol, I got quite good at Chess. I played 1st board for 3 years, did not lose a single match or tournament game and led my team to the state championship of Minnesota. This did not happen by falling for fakes and feints.
Too bad the oil business isn't as straightforward as Chess, rofl, I would be rich by now.
One must make every attempt to remain objective at all times. A problem that I personally must ensure never happens is turning into just another embittered ex-employee.
It could color decisions just too much.
I remain fully invested solely in energy stocks. BP was the last of my major vertically integrated holdings however, and I probably will not re-invest. (Man, how about that Russian thing, eh?) The reserve slide is just too damning and should eventually come home to roost. I continue to hold off-shore drillers, oil sands, wind, and the most fun- micro-cap domestic drillers and well re-workers. Ethanol stocks are fun plays on interest but I don't spend more than a few days in any particular one, I believe that it is basically a dead end.
Oops, not quite all in energy, apartment buildings also, the beginning of the slide in real estate was not at all hard to call, was 5 months out in front on that one, still holding, although uncertainty rises, not at all sure how long to hold now.
What an amazingly complex subject. One could ramble on forevor, but the Indy 500 is about to begin, (ADM has to love this, lol) have to go watch one of my favorite conspicuous consumptions.
Hope I have not offended you, but I am convinced that there is much more going on than meets the eye. In such an important arena, I just don't see how it can be otherwise.
I like small us e&ps. I compare them with
reserves/produciton x net/ev
Results should be over 1.0... but presently adjusting for low ng price.
This formula identified ard/gmxr/gpor in march 2004
Have a look at gpor, boosted recently with good results in their hackberry field. IMO, we will see a ng crunch this year, I see prices rising to 10+/mcf this year, for ng I like gmxr. Also ard, but imo they will not grow so fast this year, and oxy, a prime takeover target... as you noted major's reserves are all in poor shape.
Patrick Kerr of OilGasFutures.Com Stuart, Once again excellent article. One thing i've noticed in the futures markets over the last 9 months or so---is that everytime crude oil seems to be losing price momentum, gas prices seem to "pull crude back up"----as a far the markets go, this indicates strong underlying demand for gasoline and the energy complex in general---it is great to read about the fundemental factors that are contributing to the price movements and looks like gas and crude oil prices will continue their ascent, right now i'd say crude oil and gas futures look very interesting on pullbacks if and when we get them----pk