A New World Model Including Energy and Climate Change Data
Posted by Chris Vernon on April 3, 2009 - 10:18am in The Oil Drum: Europe
Abstract: An updated systems model of global climate, resources, and energy extending the original World3 (“Limits to Growth”) model by inclusion of climate change and it's interaction with resources and energy. Outcomes are derived for total energy resources, human population, nutrition, consumption, economic activity and other parameters. Long-term outcomes are derived for a 1900 C.E. to 2100 C.E. time sequence, with human population decline.
1. Introduction
Perhaps the best known global model of all is World3, popularized in the book The Limits to Growth, A report to the Club of Rome, by Donella H. Meadows, Dennis L. Meadows, Jørgen Randers, and William W. Behrens III. I have taken some of the equations in the latest version of the World3 model (World3-03) and I have added some more data and feedback loops to reflect some of our present knowledge of climate change and energy issues (there aren’t any energy variables in the model, the closest one is “non-renewable resources”). The aim is to have a model that is more useful for the purpose of testing in theory different policies that could be applied to resolve some of the current challenges our world is facing, that have all at the root the fact that we are reaching the limits to growth.2. The broader issues
Before going into the details of the model I propose, it’s worth asking if there’s any purpose in the exercise at all. Specifically, these two questions need asking:- Is a global model useful at all?
- If global models can be useful, is it appropriate to use the equations of World3 as a base for a new model?
These are my personal answers to those questions:
2.1. Is a global model useful at all?
One of the criticisms levelled at World3, that has been often repeated with other global models, is that there is so much uncertainty in so many of the relevant variables, that there isn’t any point in the exercise of modelling at all. While it’s true that there is a lot of uncertainty, it’s worth remembering that this won’t stop people making models of the world. Even if there were no computer models of the world at all, people still have mental models, rough ideas of where the world is heading in many different aspects. And what’s more, decision-making and policies will be based on those mental models. So there is a very valid justification for any attempt to make those mental models as correct as we can, with whatever tools we have. A computer model containing the best available data and reviewed by experts seems likely to produce insights into the future of a better quality than the hunches of policy makers.2.2. If global models can be useful, is it appropriate to use the equations of World3 as a base for a new model?
Modelling has advanced a lot since the original World3, and there are good arguments to say that incorporating new equations and variables to World3 isn’t appropriate. However, I believe there are several advantages to this approach, the main one that many experts have already studied World3 and are familiar with it, and their observations may be also relevant to a new model that contains many of its equations.3. The proposed model
3.1. Energy variables
Energy variables are conspicuously absent from World3. The closest thing to an energy variable is “non-renewable resources”, that is meant to include not only fossil fuels, but also minerals and other resources. When considering how to best include energy in the model, I chose to eliminate the variable “non-renewable resources”, on the grounds that, in a world with unlimited energy, any chemical compounds useful as a raw material but not as an energy source could be easily obtained (if necessary, elements found rarely on Earth could be mined from other parts of the Solar System, or created with the appropriate nuclear reactions). Fossil fuels are the only true non-renewable resources.To incorporate energy issues in the New World Model, I had to create three new sets of equations: equations about energy supply, equations about energy demand, and equations about energy source allocation. Most models I have seen model only energy demand or supply, but this is clearly insufficient. Modelling energy demand and assuming that it will somehow be met ignores the important issues of fossil fuel depletion. Modelling energy supply and ignoring demand doesn’t help to judge the soundness of policy proposals to switch usage of fossil fuels by “clean electricity”, which often sweep under the carpet the question of where the electricity may come from and the energy losses of any conversion of other energy sources to electricity.
3.1.1. Modelling energy supply
To model energy supply, I distinguished six types of energy sources: coal, oil, gas, nuclear power, renewable electricity, renewable thermal and biomass. The distinctions were made based on the differences between them in renewability and usability for the different types of demand. Energy sources similar in both counts were grouped together.The estimates on ultimate reserves for fossil fuels were taken from Jean Laherrere. Fossil fuel production was determined by two factors: demand and possibility of supply. When it’s possible to supply the demand, production equals demand. When demand falls sharply, production will drop but keep some inertia. When demand goes up, production may or may not increase, depending on the amount of fossil fuel remaining. The equation that determines the maximum increase in production for fossil fuels is:
Increase in production = 0.2*(fraction of fossil fuel remaining-0.5)*current production
This means that at the beginning of exploitation of a resource it’s possible to increase production very quickly, up to 10% a year. When half of the reserves have been produced, production reaches its peak and can’t increase any more. From that point onwards, production will always decline.
One important aspect of the modelling of energy supply was calculating declining EROEIs (Energy Returned On Energy Invested) of non-renewable resources. The available data on EROEI is very spotty, but it’s such a crucial concept to explain what may happen in the future with energy sources that I believe a model would be inaccurate if it didn’t include it in some way. The energy source that has been most studied for declining EROEI in time is oil. Available data for oil in the USA is the following (Charles Hall, 2008):
- 1930 – About 100:1
- 1970 – About 30:1
- 2000 – About 11-18:1
This suggests a relationship between EROEI and the fraction of remaining oil that is approximately proportional to the square of the fraction of oil remaining:
EROEI of oil = (fraction of oil remaining2)*100
An additional reason to go for this simple relationship is because it has the following property: it takes the same amount of energy to extract the first half of the oil as it takes to extract half of the remainder (a quarter), and so on. This fits well with the intuitive idea of declining EROEI.
However, the data is too limited to say this formula holds true with any certainty, and I’m using it only as a best guess. The results of the model are similar if other declining functions are used.
Once the EROEIs of all energy sources are calculated, the weighted average is then used to estimate the fraction of industrial capital needed to obtain energy. This again is speculative, but a couple of datapoints are known: at an EROEI of 1:1, 100% of the industrial capital would be needed. At high EROEIs, it appears that 5% of the industrial capital is used (from the “cheese slicer model” by Charles Hall, Robert Powers, and William Schoenberg, 2008). The intermediate points can be estimated by assuming that the fraction of industrial capital needed is roughly proportional to the amount of energy needed as an input for energy production.
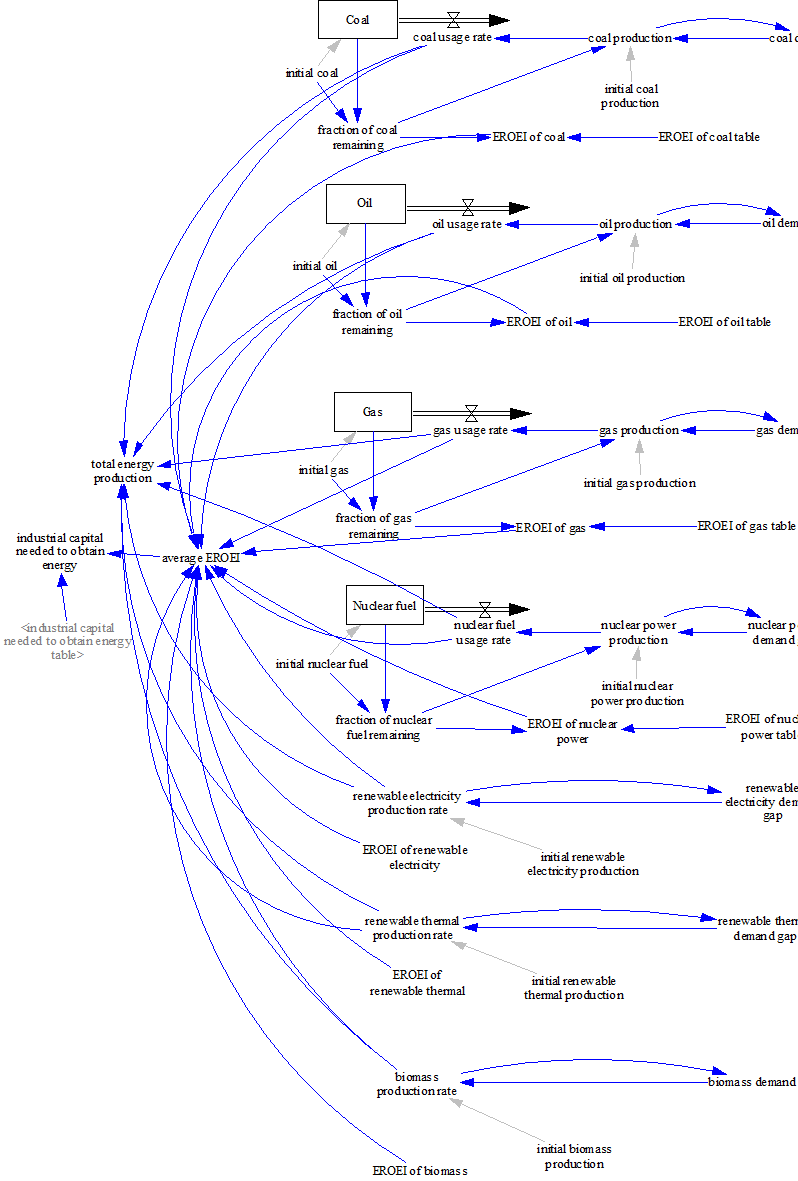
Graph 3.1.1.1 – A section of the flow diagram of the equations used to model energy supply. Click to see whole flow diagram.
3.1.2. Modelling energy demand
One factor that many energy models seem to forget is that people don’t demand energy sources like oil, nuclear power or hydro. What people actually demand is electricity, heating and transport.Electricity demand is calculated in the model as a function of GDP, with the data based on historical data for electricity consumption from the World Development Indicators Database. Heating demand is calculated as a constant of 400kg oil eq. per capita per year. Transport demand is calculated as the sum of the transport needed for freight and for passenger transport. I couldn’t find world data on freight and passenger transport, but it appears that both in the USA and the EU about 25% of the energy use goes into freight and 75% into passenger transport. So I assumed the relationship holds for the rest of the world. The total energy used for transport was deduced from the historical data on oil consumption.
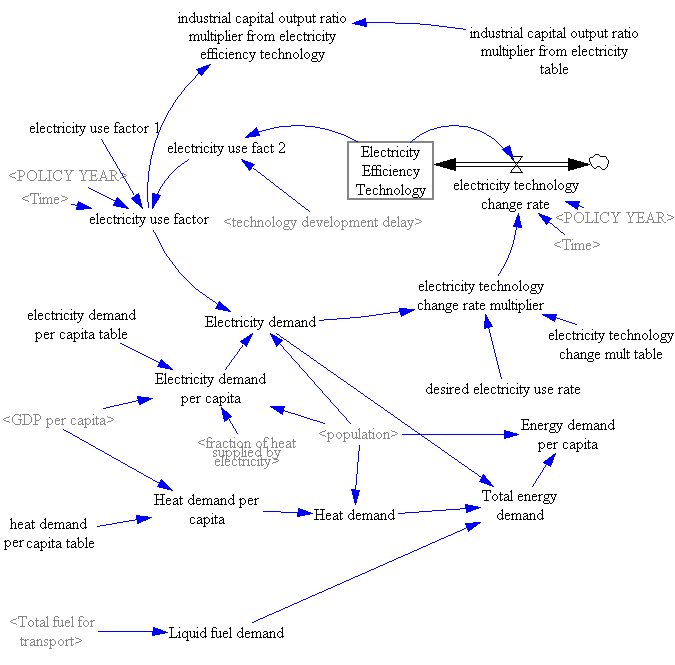
Graph 3.1.2.1 – Flow diagram of the equations used to model energy demand. Click to open in a new window.
3.1.3. Modelling energy source allocation
Once demand and supply are calculated, matching them is a non-trivial exercise, as anybody who has looked at the electricity mix of any country can tell.There are two fundamental ideas that I have used to do the matching:
- Market forces follow EROEI: the most efficient sources of energy are also the most profitable. This seems to make sense intuitively but is disputed.
- Energy companies are conservative: they will not start reducing the usage of an energy source until its EROEI falls below the average of all sources. Also, the reduction or increase in any energy source is gradual.
My model successfully reflects historical changes in use of different energy sources with no other input but the variations of EROEI in time, which suggests that the approach can’t be entirely misguided. The production data the model generates is only a rough approximation of the real data, but clearly on the right track, and further work on the relevant parameters could refine the results. For a comparison, historical data on world production of fossil fuels can be found in work by the Netherlands Environmental Assessment Agency.
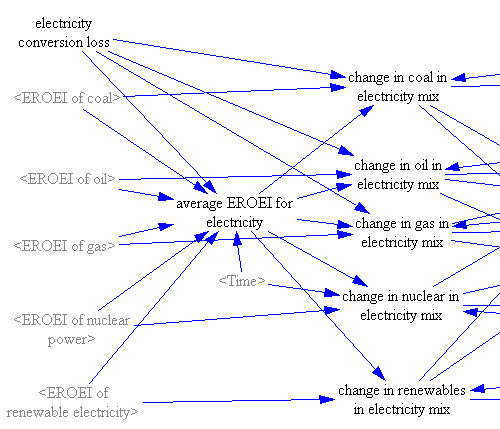
Graph 3.1.2.2 – A section of the flow diagram of the equations used to model energy source allocation.
3.2. Carbon emissions
Carbon emissions and climate change are absent from World3, mostly because there wasn’t much knowledge on the matter at the time. For the purposes of including carbon emissions in the model, I took the equations for pollution in World3 and modified them. Unfortunately, this means that the New World Model lost the original pollution equations (clearly designed to represent chemical pollution), which may need to be re-introduced.The calculation of carbon emissions is, of course, fundamentally different than the calculation of pollution, and is made by adding up the emissions from each of the fossil fuels and from land development (deforestation). Another important difference is the assimilation rate, which is clearly different for carbon dioxide and for chemical pollutants. I couldn’t find reliable information on carbon sinks, so the model only contains data for the known historical levels of carbon assimilation by the Global Carbon Budget Team, and extrapolates linearly from there, which is probably excessively conservative.
The model doesn’t attempt to make any detailed analysis of climate change, but only an estimation of the levels of carbon dioxide in the atmosphere and its possible consequences for food production. Climate change models can provide much greater detail into specific consequences of climate change, but this isn’t the aim of this model. The aim, instead, is to estimate how climate change may affect other important variables in the world.
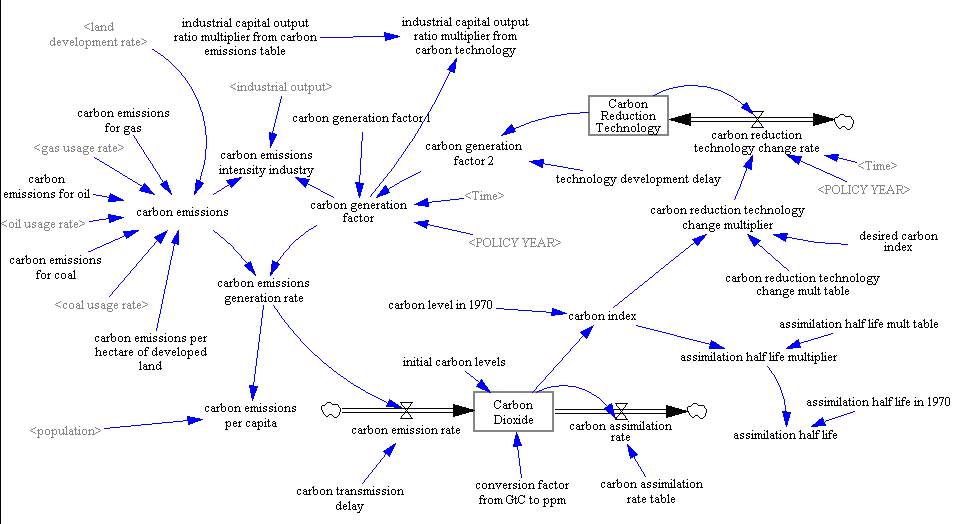
Graph 3.2.1 – Flow diagram of the equations used to model carbon emissions. Click to see whole flow diagram.
3.3. Food production
The equations for agriculture were taken straight from the World3 model, with two importnt changes:- The land yield is affected by the levels of carbon dioxide in the atmosphere. There is still a lot of uncertainty on the effects on food crops of different levels of carbon dioxide, but there is agreement that climate change will reduce crop yield. The model assumes 2% reduction on yield at 370 ppm, based on current data on the reduction in crop yield so far (David B Lobell and Christopher B Field, 2007). There is still a lot of discussion on future reductions on crop yield due to climate change. This model assumes a 10% reduction at 500 ppm, which seems like a reasonable figure based on the IPCC data. If there are better figures available, I will include them.
- Food production is reduced in proportion to the amount of biomass production.
3.4. Economy
World3 has several variables measured in dollars and some variables relevant to the economy, such as jobs. This was never meant to model the economy such as understood by financial institutions, but rather the physical economy, the real things on the Earth that have physical limits.Even so, it’s surprising that the model didn’t contain a GDP variable, representing in some way the “real” GDP, meaning with this not inflation-adjusted but representing some aggregate measure of agriculture, industry and services produced. I have added this variable to the New World Model, which also helps in the calculation of other minor variables that traditionally are based on GDP but that in World3 were using industrial output as a proxy for GDP.
3.5 Demographics and carrying capacity
Because population is such a critical variable in the model, additional demographic variables were added to track if the historical values of population were on the right track: the global crude birth rate and the global crude death rate. Adjustments were done whenever the demographic variables were going far off the track.Two calculations of the carrying capacity of the Earth were added to the New World Model:
- The maximum feedable population, representing the maximum population that could be fed at subsistence level with the current food production.
- The maximum sustainable population, representing the maximum population that could live on the planet if the total human footprint was allowed to rise to 1 planet. The calculation of human footprint was done by adding arable land, urban land and the land needed to absorb the current rate of generation of carbon emissions.
4. The results of the model for the “business as usual” scenario
4.1. Main variables: population, food and industrial output
In the “business as usual” scenario the pattern was one of collapse of human population, food production and industrial output, in a way similar to what happens in the World3 business as usual scenario. The decline is gradual, starting somewhere around 2030:
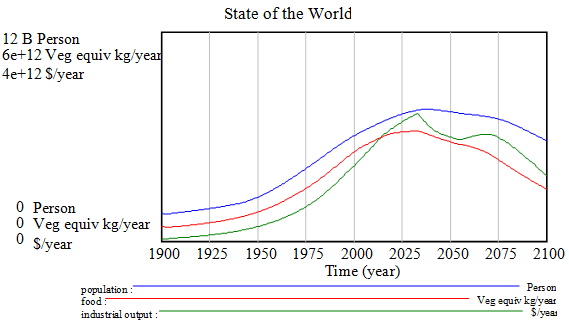
Graph 4.1.1 – Food production and industrial output in the New World Model
4.2 Energy usage
Energy supplies are substituted for each other as EROEI declines, but eventually all fossil fuels and nuclear fuels are used up. Renewables aren’t used until the end of the 21st century, due to their low EROEI:
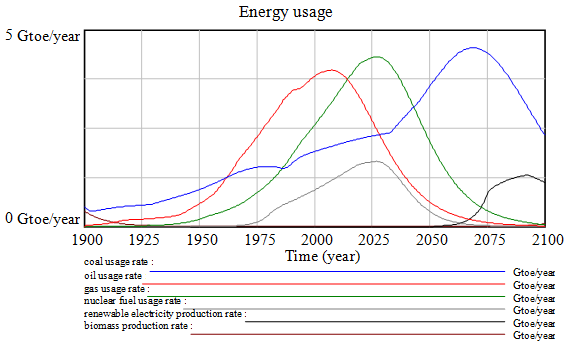
Graph 4.2.1 – Energy usage graph
4.3 Carbon dioxide
A remarkable result of the model in the business as usual scenario is that carbon emissions don’t go very high, peaking at 510ppm, which is lower than some of the emissions scenarios of the IPCC. The reason for this is double: Firstly, the limits on fossil fuel reserves mean that not as much carbon can reach the atmosphere as assumed by the IPCC even when all fossil fuels are burned. Secondly, the estimations of carbon sinks may be too favourable in the model.
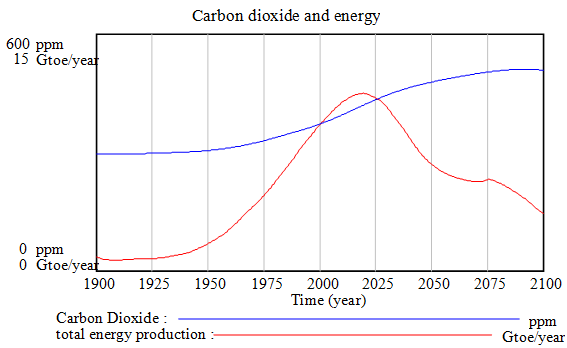
Graph 4.3.1 – Carbon dioxide and energy
4.4. Standard of living
The standard of living declines clearly by all the reasonable measures that can be made in the model: food per capita, industrial output per capita, services per capita, life expectancy, human welfare index and child mortality. The levels of food per capita by the end of the 21st century are similar to the beginning of the 20th century and are in a path of continuous decline. However, this shouldn’t be taken as any kind of prediction, because the model cannot possibly include all the relevant data.
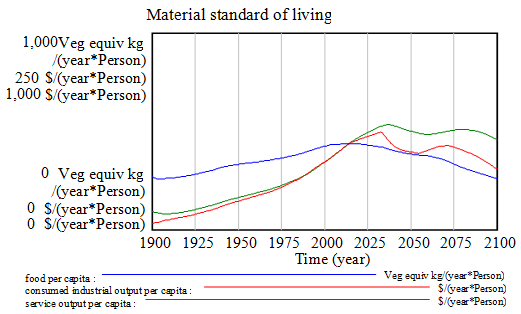
Graph 4.4.1 – Food per capita, industrial output per capita and service output per capita in the New World Model
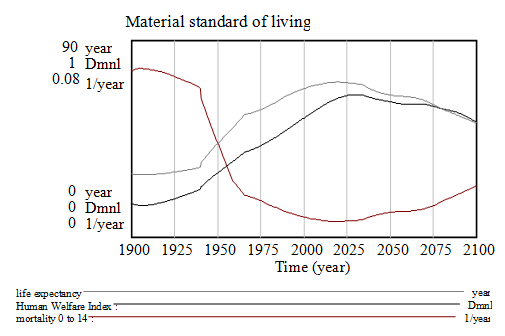
Graph 4.4.2 – Life expectancy, human welfare index and child mortality
4.5. Economic growth
The most interesting result of calculating GDP is that it allows for the estimation of economic growth. This should not be understood as the figure that economists produce, but some kind of numeric estimate of the yearly change in all the goods and services produced in the world. Interestingly, at the point of collapse, it falls dramatically, but it starts declining many years before that, providing an early warning signal.
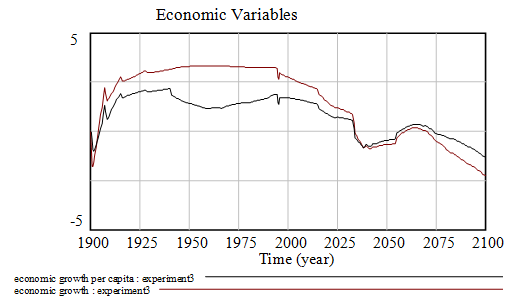
Graph 4.5.1 – Economic growth in the New World Model
5. Conclusions
The main conclusion of the results of the New World Model is that, if the world continues behaving as we have so far, decline is inevitable in the long run. This isn’t a surprise and the fact that we are on an unsustainable path can be deduced from much simpler and reliable calculations. What this model provides is some slightly more refined ideas about how this could happen and, more importantly, it’s a tool where we can experiment with our ideas on how to solve this problem.I am aware that I may have made many mistakes in producing this model, and I may have used data that is out of date or otherwise incorrect. Please consider this as a first draft, and I welcome any input you may want to provide. I would like to make this a collaborative effort. The whole model can be downloaded from here.
The software to run the model is Vensim PLE, that can be downloaded from: www.vensim.com
Finally, I would like very much to receive input on possible policies to avoid decline and eventual collapse (when all fossil fuels are consumed) that could be included in this model to see what results they produce. The Transition Network has already expressed interest in using this model for the timeline they are writing for all Transition Towns to help them design their own Energy Descent Action Plans. Of course, this will only be useful if the model includes the policies that need to be implemented for a successful transition to a sustainable world.
6. References
Charles Hall, 2008, “Provisional results from EROI assessments”
www.theoildrum.com/node/3810
Charles Hall, Robert Powers, and William Schoenberg, 2008, "Peak Oil, Investments, and the Economy in an Uncertain Future"
www.theoildrum.com/node/3412
World Bank, World Development Indicators Database
www.worldbank.org
Netherlands Environmental Assessment Agency, Production Data on Fossil Fuels
www.mnp.nl/en/themasites/hyde/productiondata/index.html
Global Carbon Budget team, 2006, “Recent carbon trends and the global carbon budget”
www.docstoc.com/docs/4117648/Recent-Carbon-Trends-and-the-Global-Carbon-Budget-updated
David B Lobell and Christopher B Field, 2007, “Global scale climate–crop yield relationships and the impacts of recent warming”
www.iop.org/EJ/article/1748-9326/2/1/014002/erl7_1_014002.html
Personnel
Editors
Contributors
Peak Oil Primers
Archives
- November 2010 (3)
- October 2010 (6)
- September 2010 (4)
- August 2010 (7)
- July 2010 (6)
- June 2010 (7)
- May 2010 (2)
- April 2010 (8)
- March 2010 (4)
- February 2010 (6)
- January 2010 (3)
- December 2009 (5)
- November 2009 (8)
- October 2009 (12)
- September 2009 (6)
- August 2009 (5)
- July 2009 (11)
- June 2009 (8)
- May 2009 (16)
- April 2009 (10)
- March 2009 (7)
- February 2009 (10)
- January 2009 (15)
- December 2008 (9)
- November 2008 (9)
- October 2008 (9)
- September 2008 (13)
- August 2008 (10)
- July 2008 (14)
- June 2008 (23)
- May 2008 (16)
- April 2008 (12)
- March 2008 (16)
- February 2008 (9)
- January 2008 (13)
- December 2007 (13)
- November 2007 (16)
- October 2007 (22)
- September 2007 (8)
- August 2007 (9)
- July 2007 (16)
- June 2007 (8)
- May 2007 (7)
- April 2007 (7)
- March 2007 (10)
- February 2007 (10)
- January 2007 (12)
- December 2006 (9)
- November 2006 (15)
- October 2006 (4)
- September 2006 (5)
- August 2006 (5)
- July 2006 (9)
- June 2006 (5)
- May 2006 (10)
- April 2006 (9)
- March 2006 (13)
Vital Trivia
License

This work is licensed under a Creative Commons Attribution-Share Alike 3.0 United States License.
Quite ambitious of you to take this on, kudos to your hutzpah and persistence. In order to provide detailed feedback, I'd need to see actual algorithms for what you've abstracted (e.g., graphs 3.1.2.1, 3.1.2.2). I note that your GHG focus is solely on CO2, though I would suggest planning on adding other GHGs and forcings (feedbacks included), or deriving input from external models to manage complexity.
Model equations are here: http://www.uploading.com/files/NSTMFGEG/WRLD3-03-energy-sources.mdl.html
I had to scroll down a ways on the download page to get to the download link. Don't be discouraged by the Upload.com ads/sales pitch at the top of the page, you don't need to spend anything.
?!?
When I tried to download this file and open it, was informed that it's corrupted i.e. has some serious defects?
Has anyone of you had the same problem?
Really great post!
Point taken, however while the G20 fiddle in London the story on the ground is that the flames are leaping higher by the moment.
http://money.cnn.com/2009/04/03/news/economy/jobs_march/index.htm?postve...
2 million jobs lost so far in '09
Unemployment rate spikes to 8.5%, a 25-year high, as 663,000 jobs lost in March. 5.1 million jobs have now been lost since the beginning of 2008...
...To put the three-month loss in context, if no more jobs are lost over the next nine months, 2009 would still be the fourth worst year for job losses since the government started tracking the number of workers in 1939.
Who are they trying to kid?!
FMagyar,
"Unemployment rate spikes to 8.5%, a 25-year high, as 663,000 jobs lost in March"
The popular media always look for a headline; actually jobs(number in labor force) dropped by 160,000 in March( similar in Feb and Jan). What the news reported were increases in unemployed, ie school leavers entering workforce, those who lost jobs-gained jobs, mums going back to work, etc. Not the same thing, but with a labor force of 145 Million, a drop of 160,000 (0.12%) doesn't sound as headline catching as 660,000 "lost jobs".
When times are uncertain, those planning to retire may post-pone plans, especially if stock market is down, and stay at home mums/dads may start looking just in case things get worse, so unemployment rates are misleading, what's important is participation rates( % of those 15-65 age group working or unemployed) which is at a record high of 66-67%. So an 8.5% unemployment rate means about 5.7% of the 15-65 group are looking for work, 61-62% have work and 33% are not looking.
In 1970 less than 60% were working or unemployed.
Well when home price fall back in line with 1970 then I'd be interested in 1970 participation numbers.
Now way can current home and auto prices be supported with a large precentage of single wage earner families common in the 1970's.
Not that I think we won't get there but your own comparison is a bit misleading. I've actually used a similar approach to show that overall we have a ways to go before we reach depression level problems since we first as you point out have to rollback to more single income families before we get a significant population with no wage earners.
For the US this means U6 has to reach 40% not 20%.
I'm not exactly disagreeing with you but even hitting 1970's participation levels is going to hammer housing prices and also of course excess cash flow and general consumer spending. Its back to the 1970's in a lot of ways.
memmel,
The point is there was not a LOSS OF 660,000 jobs in March the figure is actually 160,000; The 660,000 number refers to increased numbers seeking work. BIG difference.
Neil understood things are not quite as bad as people think they are.
I've actually argued the same point myself. I'm not at odds with you just trying to put it in perspective.
Simply going back to a 1970's economy alone will cost thousands of jobs and trillions in lost equity.
Its the differences that matter in money not the absolute value. Going from 65% -> 60% is the same as going from 60% -> 55%.
And the headline number i.e the total losses are important when you dealing with illiquid long lasting fixed assets like houses. If you have community of 100 people and 90 houses if ten people leave no big deal but if you have 90 houses and 90 people and 10 people leave then the value of the remaining houses drops 90%.
The problem at the moment is leverage everyone bet on the 100:90 ratio and its now 80:90. Your right we are not even close to real pain that years out but leverage is just as deadly over the short term.
Who are they trying to kid?!
Anyone saying that growth now is impossible.
Robert Barbera, the chief economist of ITG, points out a more disturbing trend: The Labor Department keeps concluding that its initial estimates were too optimistic.
Here are the total job losses reported for recent months, as originally reported and as shown in the latest revisions.
August 2008: Initially 84,000, revised to 175,000
September 2008: Initially 159,000, revised to 321,000
October 2008: Initially 240,000, revised to 380,000
November 2008: Initially 533,000, revised to 597,000
December 2008: Initially 524,000, revised to 681,000
January 2009: Initially 598,000, revised to 655,000
February 2009: Initially 651,000, as released today.
On average, from August through January, the first estimate was too optimistic by 112,000 jobs.
http://globaleconomicanalysis.blogspot.com/
Inquiring minds are now investigating the BLS March Employment Report for additional revisions.
Sure enough there were more revisions. However, instead of revising the February data, the BLS revised the January data a second time as follows.
The change in total nonfarm employment for January was revised from -655,000 to -741,000, while the change for February remained -651,000.
http://globaleconomicanalysis.blogspot.com/
I like tools that do everything, swiss knife style, Screwdrivers with lots of bits to them, etc. I do my yoga and this is good for physical, psychological and spiritual health so I don't waste time with one sdied practices (go to church, then the sports club, etc.)
So I like the idea of a model that simply deals with climate change, resource depletion, population growth, economic growth all in one as obviously these problems all impinge upon one another. So much of our academic disciplines are separated from one another and are therefore unrealistic as they do not take the other contingencies into consideration in their predictions.
Obviously this sort of apporach is pretty difficult but a one sided apporach is probably full of errors as in the idea of GW at 1000 ppm of CO2 in 2100 being unrealistic or GDP models with 110 million Barrels per day of oil in 2030 based on demand alone.
Keep up the good work.
I have been waiting for something like this to be produced for years now! Thank you.
Have you had much collaboration with IPCC modeling groups, such as SRES or the various Working Groups? As far as I can tell, the whole IPCC modeling suite is one of perpetual growth in the face of dire consequences that scream "Growth is bad for the planet and the people" and "How is it that growth is happening when Working Group II has some disturbing things to say about Impacts, such as less food, water, forests, etc."
So, any break in the cognitive dissonance of "we will have growth while we also have collapse?"
I dug up this link to Carl Zimmer interviewing Paul Ehrlich about his book "The Dominant Animal"
Worth a listen: http://bloggingheads.tv/diavlogs/12309
It is very unlikely that industrial output continues to rise in a post oilpeak world. If oil begins to run downhill in a few years from now several graphs will be useless. High oil prices will destroy the mass-industry and globalisation. If demand destruction will be faster then the supply destruction and oil prices fall, the economic donwturn will not be reversed. Like what is going on now, but then far worse.
This BAU model assumes that when crude oil peaks the world switches to natural gas to continue transportation and home heating. When natural gas production peaks, it assumes we switch to coal to make up for declining crude oil and natural gas. In this way the world being modeled postpones the economic collapse until the peak production of coal.
Yeah, the model really doesn't make sense.
Really, electricity (via plug-in hybrids like the Volt and plug-in Prius, electric trains and heat pumps) will replace oil. The electricity will come from wind and coal, with wind gradually replacing coal, and then solar growing quickly.
I asked around while I was in Zurich, and I learned a bit more about what the modelling groups are up to. I looked a bit more deeply into the SRES, and I wrote an email to several people (including a couple in IIASA) explaining my objections to what I can see they have in their models. The separation between economic growth and the physical reality of what climate change is supposed to be doing to the world is one of my main issues. I didn't get any replies from anybody who could make a difference.
As far as I can tell, the reason they don't take it into account is because... well, it's difficult to estimate. That's on the same level as an engineer discounting the force of the wind when building a bridge because it's difficult to calculate. If you can't estimate it, overengineer it if you must, but don't just ignore it!
Great work, thank you very much for posting!
Dear Ms. Garcia,
My issue with modeling has nothing to do with whether they work - they do. But one problem with modeling is that lay people don't understand them.
Real Climate Faq on Climate Models
Real Climate Faq on Climate Models Part II
Another is as you pointed out: Are they modeling enough? I say no. This isn't a weakness of the models per se. They have grown in complexity, accuracy and usefulness extraordinarily in recent years, as you well know, of course. The problem lies in the one thing most models can't do: model real-time human behavior.
SEAS modeling software does, but is used for emergency planning, it seems. Eg.:
A weakness of the SEAS approach, in my opinion, is that it includes only agents of government. Regular citizens are only modeled. BUT, SEAS uses real people plugged into the model in some way. The more important weakness is that the model is limited in scope, as already mentioned.
So far we have your model, which attempts to model global changes in broad categories and SEAS which models emergency actions but incorporates real time actions of real people.
We're getting close.
GCM's, of course, model climate. These are getting more and more sophisticated. Their weaknesses are 1.) what we don't know yet, so can't model, and 2.) the inputs the modeler chooses. The first only time and technology can change, and the 2nd is something that will always be a weakness, although more extensive knowledge should slowly narrow the range of what a modeler can use and have recognized as legitimate.
Getting closer.
What I propose is integrating the strengths of these three with real citizens all over the world by utilizing the Massively Multi-player Role-playing Game (MMRPG) platform. Second Life is one example of an online community that serves as an example, though not actually an MMRPG. It's actually a better fit because it involves people creating virtual reality lives.
If we take the virtues of each of these models and meld them together, we get a possible vehicle for finding real solutions faster than real time.
The Concept
* A model using millions of individuals from ordinary citizens to first responders to government officials would be built integrating the detailed scenarios of SEAS, the breadth of elements of your updated World 3, one or several of the best GCMs and the virtual reality of Second Life would be built/integrated together.
* It would be a free, online program.
* Participants could start a scenario at any time with parameters they choose (there would be millions of runs going in this case), or a random scenario generator could be used or a group of "modelers," for lack of a better term, could start scenarios at regular intervals. The idea is to have many running at any time to offer the greatest chance of a workable solution being found.
* National averages or a variety of "types" could be used to create citizens to mirror the citizens of each nation that don't participate.
* Economics... this will be tough to model given nobody knows what the hell isgoiong on at this point in time, but, still it must be included.
* Energy decline and transition (self-explanatory to any visiting this site.)
* Etc. (I don't want to use too much space.)
The positives of this concept seem obvious to me. With time seemingly as short as it is, we need a solution quickly and we need a way to communicate the urgency to as many people as possible in as short a time as possible. What other way of doing that is there?
This is a rough outline. It may seem a huge task, but all the elements already exist. The question to me is not can it be done, but can we afford not to do it? What other solution offers a chance for everyday people to have a say in national and international policy? What other scenario gives them a real voice? What other scenario would give immediate feedback on the efficacy of their actions?
I look forward to any feedback you might offer. More so, any contacts you might suggest if this idea appeals to you, but is outside the scope of your interests/responsibilities.
Cheers
Interesting proposal, ccpo, but I suspect that a combined model + human inputs system would be essentially usless as you present because the participants would be self-selected, eg. only those persons sufficiently interested in the topic to put in the time. That "interested" subset is bound to be mainly those with pre-established views on issues, not a representative sampling of world population, and I doubt that bias could be countered by the software.
1. The SEAS program seems to work just fine.
2. Averages derived from current stats of each nation are involved to reflect current responses of the masses. Millions of "dummy" nodes should balance any shenanigans.
3. A certain amount of fun being had by the participants would be part of the allure.
4. I'm hardly a math genius, but I'm sure someone could figure out how to weight online participants with #2.
5. Like any modeling software, many runs would occur, particularly over time, so an average or aggregate should develop over time as with any model.
6. A perfect possible future (Andromeda, anyone?) is not expected as a result, but some significant policy directions and overall approach should be possible.
7. It being a large, public run with public participation gets past the secrecy and politics inherent in any national/global governmental action.
Cheers
Unfortunately, there is plenty of evidence that the answers of people when they are asked "What would you do if...?" and what they actually do under the circumstances described in the question, are often very different. The Milgram experiment is a very clear example of this. So a model with human input wouldn't be particularly good to determine what would actually happen, even if people were honest and reacting for the model like they think they would react in real life.
Do you have any views on the nature of the monetary system, it's dependence on GDP growth for proper functioning, and the role of its failure in reducing demand? Does your model assume that finance somehow reorganizes to reboot the economy for an era of decline? Does it include specific mechanisms for doing so?
Exactly. It is important to factor in that our monetary system requires growth(in debt/lending). So you can't simply say that GDP is going to start to decline and not mention that the worlds entire monetary system will have to be restructured. This is SO big that no-one has got a viable answer for this.
The only viable answer that I have heard is collapse of the entire system.
To emphasise the point: We CANT have negative growth without changing our monetary system. How can you do that without war? How are you going to keep the rich people happy in a change over of monetary systems? (The ones with power over the military) I am still looking for an answer to that question!
The only viable answer that I have heard is collapse of the entire system.
And so the Self Organized Criticality Model
If current trends continue, one half of all species of life on Earth will be extinct in 100 years. — E.O. Wilson
And Backward Induction to come to a "half life"scenario
of BAU.
Right now with a SWAG it looks like 2020.
Some of the characteristics of a self-organised system Bak introduces are:
* The system is open and dissipative, and its components are metastable.
* The system organises itself in a critical state with avalanches of change at all sizes via which dissipation manifests itself. These avalanches are regular but not periodic.
* The system is embedded in a single spatiotemporal fractal structure (p. 172). Unfortunately, Bak does not make explicit exactly what he means by structure.
* A critically self-organised system might become catastrophically unstable if it were manipulated and forced into certain optimal states which take it out of its self-organised state.
Once the system becomes self-organised, periods of avalanches and stasis continue but the system does not 'organise' any further - the successive stasis states are described by the same analytical rules.
http://jasss.soc.surrey.ac.uk/4/4/reviews/bak.html
This graph of entropic cycling derives from a simulation of archetypal open, interacting systems; this kind of behaviour, with plateaus interspersed with unexpected change, seems to be typical of close-coupled open systems. Note the pattern of build-up and sudden collapse, repeated continually, but never in quite the same way. With open systems, weak chaos, self-organized criticality, chaos, catastrophe, open systems and so on, we might be forgiven for wondering if there is a different kind of physics at work both in the heavens and here in the real world; a physics of open systems, perhaps with a Second Law of System Dynamics. Observation would suggest that there might, indeed be such a law, which might be tentatively stated as follows:
Energy forms/sustains open, energetic, interacting systems, which dissipate energy over time to maintain themselves.
Like the Second Law of Thermodynamics, this putative, empirical law demands some qualification:
• Work is done to create/configure open systems
• Open systems are "entropic wells" of energy; the more energy, the deeper the well.
• Work is done/energy dissipated, to maintain order within an open system
• The lifetime of an open system increases with its potential energy/depth of entropic well, and reduces with its rate of energy dissipation.
• Open systems can exchange energy
• Groups of open systems may mutually sustain each other by exchanging energy
What can we make of these ideas of open systems and entropic cycling? Our Sun has radiant energy at the centre and some three concentric zones of convection near the outer surface. So, the Sun is self-organized, it comprises a number of dynamic, interacting systems which do work/expend energy in maintaining themselves, and the whole is driven by fusion energy which dissipates into the space around the Sun.
It is possible to see parallels between galaxies and weather patterns here on Earth. Elliptical galaxies, for instance, resemble the isobar patterns of cyclones marked on weather maps. Like galaxies, cyclones and other weather features represent a reduction in entropy as evidenced by their regular patterns.
http://www.hitchins.net/NSPaper.htm
A combo of STIRPAT and EROEI might be helpful.
James
Space-time probably has a fractal geometry. Maybe that's what was meant by "spatiotemporal fractal structure".
Space-time probably has a fractal geometry. Maybe that's what was meant by "spatiotemporal fractal structure".
Like-the more things change, the more they remain the same?
James
My model doesn't have any way of representing war, several people have pointed this out. The problem is, even though we know that world wars can happen and have a significant impact on population and other important variables in this model, I know of no way of estimating what set of circumstances is likely to trigger a major war. So, until further information, I can't really include those considerations.
The economy in my model is a very simple thing. Prices are assumed to be fixed, and GDP is calculated by simply adding the value in dollars for each economic sector (agriculture, industry and services). Financial industry is simply not part at all of the model. The implicit assumption is that the financial industry does not determine the way that the fundamental economy (that produces goods and services) operates, or not for very long periods of time. In other words, there may be speculative bubbles and such, but they don't last long. I think history suggests that this is true.
The model doesn't have any way to explain what will happen to the monetary system, the financial world, or any of these things when GDP stops growing, but it assumes implicitly that people will find some way of continuing to produce essential goods and services and to trade them, and overcome the limitations imposed by what are essentially only human laws. The limitations of the laws of nature are a different issue.
Maybe the word "collapse" should be avoided. When you talk of collapse, people think of a decline of say 30% in 3 years without recovery (e.g. a Great Depression without recovery). What the model yields is a slow decline.
Of course this applies to historic examples as well: the Roman Empire didn't really collapse - it declined during a period of more than 1200 years, from the peak at around 200 to the fall of Byzantium in the 15th century, and the decline uneven, England descending into doom Zimbabwe-Style, Italy falling apart in the 5 th century but Greece avoiding decline for a long time.
Unfortunately the historical examples you have provided do not hold for our current situation. We are now a global economy with too many inter dependencies. We require all our systems to be running smoothly to ensure that the other inter-related cogs don't stop turning. i.e. complexity theory. I understand that complexity theory explains the above collapses as well however what we have now is so far beyond that has ever been experienced before.
Either way, you have to address the monetary system directly.
i.e. How is it possible to have a declining gdp and for individuals to pay back their loans with interest. Not only that however if people stop borrowing (because the only reason they borrow with interest is because they expect to be able to make more off that money in the future. In a declining economy this is not possible.) then the monetary supply contracts. Leading to further decrease in GDP.
The difference between the examples you have provided and our current system is the fiat money system with fractional reserve lending.
So is the 30% shrinking of Ukraine's economy in just the last couple of months a collapse?
Completely bogus study.
1. The projection is for food production to fall in half by 2100 and already start causing deaths by 2030-2050.
There is excess food production now.
If there were shortages there are policies that can be easily implemented and were implemented to ration food, oil etc..The UK got by on ten times less during and after WW2. If there is an actual need that is what is triggered. There are more moderate forms for 10-30% reduction. Plus the WW2 rationing was done while there was a full military mobilization.
http://nextbigfuture.com/2009/03/sorry-collapsitarians-doomers-and.html
2. Nuclear power and uranium and thorium will not run out. This was already shown multiple times at theoildrum. No running out and no near/midterm shortages. Kazakhistan, australia, Canada, African countries area all ramping up uranium production. There is enough highly enriched uranium to downblend for fuel if needed. It is only a matter of paying enough for it.
Agricultural efficiency continues to be improved. Genetically modified plants and animals will be used. Fish farming is already providing over half of all fish that is eaten. Just as we no longer are going after wild meat and have farmed cows and chickens, so it will be that it mainly farmed fish that will be eaten. Genetically modified fish can provide meat that is only uses 1.5-2 times the weight in feed. This is instead of about ten times the weight in feed to get cow meat.
South Africa and China are working together on pebble bed nuclear. Pebble bed nuclear already has TRISO pellets at 16% burn efficiency. Work is being down to raise efficiency to 60-70% over the next ten years. That is once through efficiency of uranium usage at 16% and heading to 70%. As opposed to 5% for current light water reactors. China is building a full sized commercial module at 210 MWe now and it should be completed by 2013. China plans factory mass production and make modules in six-packs and/or eight-packs. The High temperature pebble bed can replace the coal burner and reuse the steam generator at existing coal plants and also re-use the electrical grid etc... Thus enabling nuclear retrofit of coal plants. This would be cost competitive with carbon sequestering and full retrofit of coal plants to clean them up.
There are several other deep burn options which are being actively pursued. the fuel cycle would be closed with the full development of any one of those options. Closed fuel cycle means no nuclear waste which is unburned fuel.
Almost correct, a pebble bed reactor could be built with a steam generator that outputs steam with a temperature and preassure that matches the high temperatures and preassures of a modern coal boiler. The old coal boiler would be scrap but you would probably not need to do much to the turbine string and the generator and can use the same main circulation pumps. There might be a need to add an ability to dump steam to the condensers during a turbine trip. I guess there also might be a need to add new preheaters that use high temperature steam to replace preheating done in the cooler parts of the coal boilers heat exchangers. The theoretcal ideal setup would be to bleed preheating steam from the turbine stages with the right temperature and ballance the efficiency gains against the plumbing cost and heat exchanger size and cost.
How can an incomplete model be completely anything?
I'm reading that 2 billion people go to bed hungry.
Shown or written? The opposite has also been written, here and elsewhere.
Too bad the Chinese companies and gov't aren't aware that this will solve their energy problems. They could wind down the participation in the mad scramble of the various powers for hydrocarbons in Africa and elsewhere around the globe.
In those countries with hunger and even starvation, is the overall population going up or down ? The overall population is going up.
In the countries with the more food per capita is the population growth higher or lower than countries with less food per capita ? More food per capita correlates with lower population growth across a broad range.
A drop in world food per capita of 50% does not translate into 50% losses in life and definitely not a drop in overall population. That would only be the case if we were at bare subsistence now.
China is covering all energy bets. The are run by engineer-technocrats. So they don't just cover one possible solution, they cover them all. Build up more than one form of nuclear. Plan to build or be in the process of building 100 Westinghouse AP1000 reactors (PWR 1.2-1.7 GWe range, building module factories for partial assembly line manufacturing). Building High temperature pebble beds. They have discussions of the learning curve savings when they have made several hundred modules. Building a Three Gorges Dam (18GW) of hydro power every two years. Building up wind and also various forms of coal and oil and biofuel.
This is the difference with a place that has an energy plan of appropriate scale and redundancy and people talking about going to subsistance farming and tiny generators that might keep them and their small enclave going (Oildrum Campfire).
In the discussion of uranium shortages
http://www.theoildrum.com/node/5060
The author Gail the Actuary of theoildrum post backs off the uranium shortage claim.
http://www.theoildrum.com/node/5060#comment-473281
http://www.world-nuclear.org/info/inf13.html
Highly-enriched uranium in US and Russian weapons and other military stockpiles amounts to about 2000 tonnes, equivalent to about twelve times annual world mine production. World stockpiles of weapons-grade plutonium are reported to be some 260 tonnes, which if used in mixed oxide fuel in conventional reactors would be equivalent to a little over one year's world uranium production. Military plutonium can blended with uranium oxide to form mixed oxide (MOX) fuel.
2008
Australia Honeymoon 340 tU/year
Kazakhstan Semizbai 500 tU/year
Kazakhstan Kharasan-1 3,000 tU/year in 2010
Kazakhstan Southern Inkai, 1,000 tU/year
Kazakhstan Irkol 750 tU/year
Kazakhstan Kharasan, 2,000 tU/year in 2014
Kazakhstan Akbastau LLP-Budennovskoye 3,000 tU/year
Namibia Trekkopje 1,600 tU/year
Russia Khiagde 1,000 tU/year, 2000 in 2015
2009
Iran Saghand 50 tU/year
Malawi Kayelekera 1,270 tU/year
Namibia Valencia 1,000 tU/year
2010
Canada Midwest, Sask 2,300 tU/year
India Tummalapalle 220 tU/year
Russia Gornoe 600 tU/year
2011
Brazil Itataia 600 tU/year
Canada Cigar Lake 6,900 tU/year
India Mohuldih 30 tU/year
Niger Imouren 5,000 tU/year
Niger Azelik 700 tU/year
Russia Olov 600 tU/year
2012
India Lambapur 130 tU/year
India Killeng 340 tU/year
Russia Elkon 5,000 tU/year
Billions of tons of Uranium in the crust and seawater.
A misleading statement. MOX is 1/3 Pu-239 and 2/3 U-235, so the 260 tons of weapons grade plutonium could only fuel 1/3 of all 400 power reactors for a year. Except only 30 reactors in the world actually use MOX for making electricity(and only 50 worldwide have been designed to use MOX)
http://en.wikipedia.org/wiki/MOX_fuel
Does it ever get boring being a nuke fanatic?
I think this is a statement by the mislead, or at least the miscalculated. :-)
From your own reference link to Wikipedia:
Now depleted uranium is only about 0.25% U-235. For the weapons grade plutonium under discussion, that is over 90% Pu-239. The ratio is more like 5%/0.25% = 20 parts Pu-239 to 1 part U-235, not 1 part Pu-239 to 2 parts U-235. Your statement is off by about a factor of 40.
World production of uranium oxide (U3O8) is about 40,000 tons per year. This is about 30,000 tons of pure uranium metal. As U-235 is about 0.72% of naturally occurring uranium, world annual production of U-235 is about 220 tons. So by my rough estimate, 2000 tons of weapons grade uranium in reserve is about 9 times annual world production. The 260 tons of weapons grade plutonium is about equivalent to an equal amount of U-235 for nuclear energy production, so it does appear to be about equal to the 220 tons of U-235 produced every year, worldwide.
Is the sentence about being a nuclear fanatic a question, or your signature line? :-)
Sufficient or excess food production does not translate into adequate food distribution, at least not yet.
Agricultural efficiency continues to be improved. Genetically modified plants and animals will be used.
The question is whether efficiency gains will keep up with desertification and freshwater depletion. I wouldn't bet on it.
Fish farming is already providing over half of all fish that is eaten. Just as we no longer are going after wild meat and have farmed cows and chickens, so it will be that it mainly farmed fish that will be eaten.
Unfortunately, farmed fish tend to be predator species, and they're fed fish protein from bycatch. So we're strip-mining the oceans of biomass to feed to farmed fish as well as cattle.
Barrett,
Farmed fish can be fed diets almost completely composed of grains and legumes, with a small amount of fish oil for taste. It comes down to cost of protein, by-catch was once thrown away or used as fertilizer. Most aquaculture feed is pellets whether grain/legume or fish based.
Certainly there is a large surplus of food grains, the issue is income of the 2 Billion lowest income people. Globalization is certainly lifting the incomes of India and China, the famine countries of 50 years ago. Eventually feeding grains to beef cattle will be too expensive, until then, this is the best option for Mid_West farmers( or using for ethanol). The high protein byproduct of ethanol can be used for aquaculture feed.
Farmed fish can be fed diets almost completely composed of grains and legumes, with a small amount of fish oil for taste.
More to the point, low-value aquaculture (e.g., carp) can be and is done is a relatively sustainable way in Asia.
On the other hand, high-value aquaculture (e.g., shrimp, salmon) tends to be quite destructive, requiring large resource inputs and producing large waste outputs.
Meanwhile, we continue to fish out the oceans, removing wild fish biomass at enormously unsustainable rates. The Cornucopian vision painted by advancednano isn't too likely if we don't reverse the accelerating destruction of the oceans.
Just as much of the areas on land have lessened diversity while not a good thing it does not effect the farms and ranches. The level of environment needed to keep the farms and ranches going is less than what is needed to keep something like old growth forest and amazons going. So losing the majority of the wild catch and wild species while something definitely to be avoided is not tightly coupled to being able to feed people only on farmed fish.
Worst comes to worse the farmed fish are genetically engineered to be tougher so that they can take whatever we have turned the oceans, lakes and rivers into. Just as we are genetically engineering the crops to grow on inferior soil.
However, do not pretend like that this is "less natural" option comes after mass starvation. We can try to have the luxury of being more natural and curbing our bad environmental ways, but if that does not happen then other means will be used.
I am not saying this is the best way to go, but it will come before the stupid do nothing and billions die scenario. China and Asia countries have already chosen massive fish farming and genetic engineering of crops rather than strict fishing quotas and fewer coal plants etc... China is cleaning up coal and building a lot more nuclear and hydro and wind. Will it be in time for the all natural route. It doesn't appear to me like it will. But will this type of plan prevent mass starvation and continued economic growth ? Yes, I believe it will.
I am not saying that if I were in charge that I would make Mother nature into my genetically engineered and geoengineered bitch. [I would make a faster transition to sustainable and higher growth super-tech] But if we unflinchingly look at the choices and momentum then that is happening. This will be a likely at least temporary (a few decades) part of the solution. Because we are slow on the transition. But the transition will not be one where it is accept no growth or reduce the size of the economies by ten times and reduce populations by ten times and be campfire subsistence farmers.
Technology will be dialed up a few notches. So we still go to high growth supertech that is sustainable but have a transition period where things must be done to the earth to keep things going. The growth and development will continue and transition off of fossil fuels but into more powerful tech that is sustainable and still high growth.
So the solutions are there and clearly China, Russia, India and other places have the will to make it happen. Apparently some will complain more about this than billions of dead. But if it becomes a choice of billions dead or giving mother nature a technology makeover. I know what people will choose. The same choices that have gotten us here.
I am not saying that if I were in charge that I would make Mother nature into my genetically engineered and geoengineered bitch.
Okay, I admit this made me laugh.
Technology will be dialed up a few notches. So we still go to high growth supertech that is sustainable but have a transition period where things must be done to the earth to keep things going. The growth and development will continue and transition off of fossil fuels but into more powerful tech that is sustainable and still high growth.
To my mind, we've already gone well beyond the "things must be done to the earth to keep things going" stage. Ecosystems around the world are in mass-extinction-style collapse, and it's a desperate gamble to think we can survive without ecosystem services.
But you're not in charge.
Nor I.
And the only thing I can actually do today that could positively impact the survival prospects of my family is to get my ass in gear planting vegetables and building a chicken coop and think about a pond with ducks and carp (or tilapia) and a rabbit hutch and a windmill or three.
Let me know when you get the big policy job and I can go back to relaxin' of a weekend ;)
Barrett,
This is a reference of Salmon diets replacing fish oil with various plant oils in diet.
http://www.cmar.csiro.au/e-print/open/millermr_2006b.pdf
South Australia Research and Development Organization has done work on Tuna diets replacing fish or fish oil.
Shrimp are especially easy to feed vegetable diets because they can digest starch( unlike most carnivorous fish)
These high protein fish diets do create a lot of nitrogen waste, need lots of cold clean water, fortunately Southern Australia has 3,000 km of coast line facing the southern ocean, nearest industry up-current is S Africa.
Dolores,
What are the inputs on Fig 4.2 "energy use graph" especially for hydro, wind, solar energy.
For example it appears you have nuclear at 1Gtoe in 2009, but nothing for hydro. Also is wind energy growth rates of 30% included( that's a lot of wind by 2050), but I don't see any contribution for renewables until 2050.
I suspect you are treating energy inputs as BTU equivalents rather than useful work. For example, in N America, coal only produces 25% more electricity(250GWa) than nuclear plus hydro(190GWa) but coal has 400% more toe energy than nuclear and hydro output, but 65% of coals energy is lost as heat.
My model doesn't have separate variables for hydro, wind and solar energy, they are all aggregated under "renewable electricity". This is in order to keep the model as simple as possible. In general, models are better the simpler you can keep them, there is this misconception that more complexity will make the model better, but it will only create more places where you can have an error. Added complexity is only justified if it's necessary to represent faithfully whatever you'd like to know.
The reason renewable electricity takes a long time to appear on the graph is simply that it has lower EROEI than other energy sources, and in my model people are conservative, they won't change to new energy sources unless the EROEI is higher than the average EROEI they are getting so far. The EROEI I'm using for renewable electricity is 10:1, this comes from the estimates of Charles Hall, but you may think it's too low. When I try a higher EROEI, renewables come into play earlier. I also did a trial run for Chris Vernon, that asked me a similar question, assuming there was a policy to increase use of renewable electricity, regardless of EROEI, starting on year 2000 (you may think there is such a policy already in place, more or less). The result was a generally better future.
" in my model people are conservative, they won't change to new energy sources unless the EROEI is higher than the average EROEI they are getting so far."
This isn't a good assumption. Cost is the important factor, and it has to include costs as internalized by government policy. For instance, in the US wind was 32% of new generation last year, due to government policy (which is, in effect, internalizing the low-CO2 benefits of wind). Coal plant applications are being turned down much more often than they are being approved. It's highly likely that US coal consumption will be flat, and wind production will grow quickly.
"The EROEI I'm using for renewable electricity is 10:1, this comes from the estimates of Charles Hall, but you may think it's too low. "
Yes, that's far too low. First, wind is the most important, and even Hall shows 18:1. 2nd, Hall's data is very old: wind is around 50:1, and solar (CSP and PV) is at least 20:1.
Once EROEI is above, say 10:1, it really becomes irrelevant - it's just not the basis for competitive decisions. It's useful for analyzing bio-fuels, which are below 5:1, but not for wind and solar vs coal or NG.
Finally, it's worth noting that distribution of energy reserves is important. For oil, we're only having problems now because of it. For coal, the fact that the US has the lion's share of reserves will be important in the future.
Just some initial comments - I need to re-read your piece several times.
It is certainly worthwhile trying to model what's happening in the world. If nothing else it forces one to think about what the relevant variables are. And you are certainly right in moving energy to its proper place.
Modelling is subject to all the risks you mention. My preference is for simpler models, with the minimum number of variables, and the simplest of algorithms. The best we can hope to do is get some idea of the outer limits of what's possible based upon reasonable assumptions about the accuracy of the data we employ. Therefore, if there are a few input parameters we can adjust to outer extremes, we then get a box wherein lies the probable future, even though it might be a bigger box than we'd like.
I sometimes play around with the idea of building a very simple model involving only Energy, Soil, Water and Minerals. (Edit: oops, and Population.) I leave out climate because it will play out on a somewhat longer time horizon than I choose to focus on. I leave out economics because it' s too unpredicable. I recognize your point about energy and minerals, but then the same relationship holds between soil and water in relation to energy, and then we end up with only energy, which is too simple even for me (if I've had my coffee, else its too complicated).
Although, even there (energy only) I think some interesting questions remain. For example, everyone seems to be content with the bell curve. But I suspect that the world energy production bell curve is going to badly skewed to the right. The bell curve is usually respect to time, but it need not be. It can be with respect to some function of time that is monotonic increasing. A bell curve badly skewed to the right looks like a cliff. One of the functions is population v time. Replace t in exp(-b*t^2) with p=exp(a*t) and you'll see.
Back to re-reading.
Cool model fits very well I think with what I consider the collective consensus of a lot of posters on the oildrum.
I was wondering if you would be willing to do one thing. Your model is capable of figuring out the scale of a move to renewables required to not only overcome the decline but allow growth.
I was wondering if you would be willing to run the model aggressively upping renewables to offset the decline.
My opinion and you can pretty much eyeball it off the graph is you would have to just about double economic output agianst a declining resource base. And to make matters worse you have to do it without your poor Americans having to face any real pain what so ever so growth simply continues. Its ok to have a short recession i.e what we are seeing now but what I have in mind is a fast switch to renewables with explosive growth.
I'm extremely interested in the number your model would produce.
This is pretty much the party line of people that claim we will just flip and life will be rosy and oil will never get super expensive since we will substitute first electric cars and then renewable resource for our failing non-renewables.
I argue the parameters required to replicate this scenario are obviously physically impossible.
And last but not least I think its a mistake leaving out war/government collapse. We have numerous nations on the verge of collapse right now. Pakistan may not be long for this world. On the downslope if its possible periodic regional conflicts and other large impact problems should should start cropping up. It would be very interesting to see how your model responds to various shocks representing war/civil unrest if its doable.
I think and I'd have to look at how you model it that if the system is shocked on the backside then you don't get your curves but steep collapse. If your model is correct then I think it should be highly sensitive to shocks in the decline phase. Basically past some certain point on the down side any major negative event should send the system into collapse. You could say use a war in the ME with Iran as a plausible even blocking energy flow for say one month. Other shocks are possible I don't think it matters since any shock of sufficient strength and duration should cause a rapid down spiral.
Again obviously a very interesting run and important to gauge if possible the stability of the system post peak. So basically some sort of stability analysis. I assume your equations have chaotic regimes.
So the DOD/CIA must have a lot of interest in this and similar models for realistic scenario planning.
memmel,
"Cool model fits very well I think with what I consider the collective consensus of a lot of posters on the oildrum."
Lets hope this is because the input assumptions are also the 'collective consensus of theoildrum posters". Different inputs different outcomes.
For a BAU model it fails to account for using tar sands and oil shale to produce syncrude and methane. There is also a possibility that fusion could replace fossil fuels and fission for the generation of electricity. With a peak population of 12 billion in ~2035, food production may still be a limiting factor in the form of fertalizer, water, cost or destruction of arable land.
Excellent analysis, thanks for what must have been a great deal of effort.
Is there any interest in using this model as a basis for a simulation style game? I have in mind something like the "Management Flight Simulators" popular in Systems Dynamics circles where the player assumes responsiblity for setting policies and then steps forward in time to see the results.
Also, I'm just curious, are the equations for the original World3 model available online? I downloaded the Vensim file for this model from the link given, despite that dodgy file sharing page immediately trying to install a virus on my PC.
I would be willing to devote my time and experience as a developer of interactive multimedia to a proper website for this model, and other similar projects, if people are interested in expanding this into a wider educational effort.
Cheers,
Jerry
Hi Jerry,
Vensim Personal Learning Edition comes with a set of example models, one of which is world3. I think it's world3-03.
Thanks! I'll take a look.
I don't know about a simulation game, but I'm certainly interested in any suggestions people here may have about different policies to try to simulate.
The equations for the original World3-03 model can be obtained by downloading Vensim, it's one of the sample models that come bundled in the software.
1) Energy is presented as a key, foundational element to the model:
"in a world with unlimited energy, any chemical compounds useful as a raw material but not as an energy source could be easily obtained "
2) EROEI is presented as a key, foundational element to the energy component of the model:
"The available data on EROEI is very spotty, but it’s such a crucial concept to explain what may happen in the future with energy sources that I believe a model would be inaccurate if it didn’t include it in some way."
3) This model assumes that renewable EROEI is low:
"Renewables aren’t used until the end of the 21st century, due to their low EROEI: "
4) Reneweables have high EROEI*, therefore, the energy component of the model is incorrect, and so is the overall model.
So, the model needs a basic revision to be valid.
*According to the Hall reference, it's 18:1. That's clearly high enough. OTOH, that number is outdated - the correct number is closer to 50:1. Also, Hall's numbers for solar are badly out of date, and should be much higher. Also, the idea that nuclear fuel will be depleted within the 21st century is unrealist.
Whats interesting is the more I look at the problem the more I realize that the absolute EROEI value is not all that important in a growth society. Certainly when it approach 1:1 your talking about the absolute collapse of growth civilizations.
However consider the case of a society based on a EROEI of 1000:1 this society would be much wealthier than our current one however lest assume it faces a fairly rapid drop to 500:1 and continues BAU through much of this period. Assuming it uses fiat currencies it can play financial tricks. Partial substitutions can work maybe temporarily reversing the decline in EROE etc. Eventually however the original society has to restructure.
Probably this will be painful. Its still facing declining EROEI and the new society is say quickly pressured as EROEI drops agian say from 500:1 to 250:1. We can also assume at some point doubling the effort i.e expanding the total amount of the energy base maximizes and then flattens or declines.
The point is for growth based societies its easy enough to see they are unstable as EROEI declines the absolute value is not important for the overall society. For our own we actually did not get all that far from basic EROEI of natural source of 2:1 or so in fact despite our hubris we barely went up a order of magnitude.
So you can also see how this society that hit 1000:1 has repeated chances to restructure itself and take a non growth route. With ours much closer to the bottom of the curve its difficult to see that it has any chances. Maybe at best one chance but this is debatable.
If you think about it this putative 1000:1 society would be one we would consider futuristic no reason they would not have space flight and a web of resource extraction capacities spanning the solar system. We are assuming they are depending on some resource that although powerful is finite. Lets say its something like tritium or anti-matter or He3 or some other exotic nuclear reaction of some sort that gives them power. Maybe micro black holes and say they become derlict in their duties or the equipment they use to mine or create their fabulous energy resource is itself dependent on some material thats declining it does not really matter.
However you can see how this society would have repeated chances and pressure to adopt a low energy lifestyle as its EROEI declines. They made it and they putatively could decide that they wanted stability as they slid down the EROEI curve.
However I think you can see that this advanced society could only change by choice it would have to choose to give up one growth and depleting EROEI source it would have to make a large intrinsic change. Lets say it was technologically advanced for millions of years and managed to not ever have a major collapse a silver bullet was found at each point in its rise to power. Say it went from oil to fission to fusion then beyond never once missing a beat. How could they change ? Are they even capable of changing can the even recognize the EROEI problem for what it is. Most of the societies members may well at this point be simply incapable of even thinking of the concept of EROEI. It would be like showing a 2D photo to a savage they may simply be unable to recognize its a picture.
Next of course this society will discover one of the truths about declining EROEI its only a issue if you try and maintain the standard of living for all the societies members. A obvious solution is to reduce the energy usage of a certain segment ensuring the remaining members can live comfortably on lower EROEI resources.
They can probably justify this by some sort of cultural concept that these now banished people broke some law or failed morally therefore they get what they deserve. After millions of years of growth some failure is possible. In fact they may well develop sophisticated social systems and financial systems to take advantage of falling EROEI to extract wealth from these falling then fallen people.
Back to ourselves our own society has no intrinsic reason to develop electric cars for its middle class population if energy is constrained why keep a large class of expensive marginally productive members in its society ? About half of the current middle class is now one paycheck away from ruin and leveraged to the hilt. By and large it now consists of a bunch of losers who failed to make it. They can't pay their mortgages can pay their credit card bills and their jobs been shipped overseas.
Our society brands them as losers who just don't know how to play the new game and it finds that if it ignores these people and sheds them the remaining members can find that they can indeed live quite well in this new smaller wealthy society. Periodically instead of changing all it needs to do is shed some more losers.
What prevents this from happening. Of course its obvious that as energy supplies dwindle we will substitute generally these substitutes can keep a ever smaller base at the same standard as previously. Why would this society not make the obvious step and realized that be shrinking and removing members that can no longer afford to take part in its upper echelons the remainder can do much better ?
Think of it as fencing off a shrinking commons.
Suddenly you realize the problem is not EROEI or at least that just the driver the real problem is you find that your society really has not made any social contract with its members. It has no problem reducing the lifestyle of many for the good of a few. You have absolutely no assurance that as the system contracts that those at the top will share.
In fact if you open your eyes and look around you then you should realize that they have absolutely no intention of sharing anything with anybody. They fully intend to ensure they get the lions share of the ever shrinking pie as long as their is a pie. The realize the simple fact that if you go from a 100:1 EROEI to 50:1 that you simply have to remove 50% of the demand to get the same total return. And of course we have basic simply energy sources such vegetable oils that have a terrible EROEI but can readily support a now dramatically shrunken elite class.
You can pretty much bet of course that before we fall to much farther down the EROEI curve that the remaining resources will be nationalized and militarized and rationed for the good of the nation to ensure that everyone gets their fair share. And you can be just as certain that the fair share allocated to the top will not change in size even as the overall pie shrinks.
We may have electric cars and everything your mentioning but realistically I suspect both you and me will be happy to wash these cars for their owners for enough money to eat.
Memmel, you're going way off the deep end, and worrying way too much about EROEI on the way.
If we, as a society, go from 1000:1 EROEI to 100:1, it makes no difference at all. It means that the energy input cost of providing energy has gone from .1% of the output value of the energy to 1%. That's nothing. For gasoline, for instance, it would mean an increase in cost from $2 to $2.018.
Going from 100:1 to 10:1 is larger, but not very important: energy input costs rise from 1% to 10%, and we start to deplete resources a little faster, but not that much (to be precise, 9% faster). For society as a whole, perhaps the energy sector goes from 10% of the economy to 11%. A bit of a hit (that's a one-time, effective drop in income of 1%), but in the long run not important.
Wind, at 18:1 at minimum (more like 50:1) is more than good enough. So's solar and nuclear.
memmel, i always liked the deep end.
I hope the numbers play out as happily as Nick suggests.
*Plays beach ball with Nick*
Dolores,
Figure 4.3 seems to be miss-labeled. It is showing consumption of FF and nuclear fuel(presumably just the U235 consumption. What is important for the economy is energy output, only hydro and wind would be accurately reflecting output( kWh). A wind farm only recovers 1.5% of the wind energy in the lowest 150m of air, we don't count the other 98.5% of wind energy as consumed, although strictly speaking it is because we cannot get any more energy from it.
So the 2% of electricity produced by wind in US by end of 2008, is actually using more energy than used from coal, oil and NG, just as we only recover 20% of the energy in oil and 35% of the energy in coal.
If figure 4.3 is meant to show output, show the electricity produced from nuclear, coal and NG, the work done by oil, or the heat delivered where NG and oil are providing heat.
Also looking over figure 4.2 again, world nuclear electricity production is 350GWa. Hydro is also about 350GWa. Canada(50GWa), China 80GWa( 80GW capacity under construction)for starters. So nuclear and hydro should be about equal.
Wind energy growth is where nuclear was in 1970, so should move the renewable peak from 2050 to 2009.
What EROEI was being used for wind energy? The often quoted figure 18:1 was an average of very small turbines (200-750KW) and there is a trend of increasing EROEI with size, so today's 2-3.5 MW units have an EROEI >50:1, with an ENERGY PAYBACK OF <6months!. This is much faster than nuclear(5years), so rapid growth WILL NOT require additional net FF energy inputs.
Moving that renewable peak 40 years earlier with a high EROEI(with fast energy recovery) should make all the difference in the model's outputs, as there will be no energy CONSUMPTION decline, or need for FF to grow economy.
It's true that figure 4.3 shows production figures for fossil fuels, and output for renewable energy, but I think this is the usual convention when comparing world consumption for different energy sources.
I've made an effort to make sure that the model approximates past energy consumption fairly well, but I know some parts of it may still be quite inaccurate, especially about renewables and nuclear. So any further information on those would be useful.
As I explained in a post before, all the renewable electricity is aggregated in a single variable and given an EROEI of 10:1. See previous post for additional information. I'd just like to add that in the trial run I did for Chris Vernon, there is a much earlier start for renewables, but there is still a total energy consumption decline. Economic growth collapses on 2025, then recovers around 2050, and stays close to zero for the rest of the run. But in terms of standard of living, the overall results are better.
" Economic growth collapses on 2025"
That suggests zero growth. Is that what you mean, or do you mean sharp decline in economic activity levels?
Could you present the results?
I mean the world economic growth rate goes negative. I'd be happy to show you the graph, but I haven't ever figured how you put graphs on comments.
Dolores
Complements on your model.
1) Food vs CO2
C3 crop plants (such as rice, wheat and soybean) benefit from higher CO2.
The Medieval Warm Period had higher temperatures and productivity.
Recommend comparing examples of both +10 and -10% impact of CO2 on food productivity.
2) EROEI of Renewable Energy.
Recommend exploring the impact of EROEI of 30 for renewable fuels that can fully compensate for reductions in Peak Oil.
This will probably be achieved with focused effort and creativity.
Nope.
Discussed in some detail, with a key graph present, here:
http://www.realclimate.org/index.php/archives/2008/09/progress-in-millen...
That greater productivity does not hold as temperatures rise. Discussed many times here on TOD. Many links in the archives. Feel free to search on it. Not worth a long discussion.
This simple comment of yours also ignores desertification, etc., which will reduce arable land area in key areas, not to mention extreme weather conditions that will destroy crops and are expected to increase in the future.
Your lack of scientific support is noted.
Cheers
A minor quibble; if peak oil circa 2008 is roughly equivalent to 0.5 of oil remaining then 100(0.5)^2 = 25 which is greater than the range (11,18) suggested for year 2000.
With 510 ppm max CO2 this suggests there is some best path or perhaps least-worst path on how to use remaining coal. Conversely if fusion plant was perfected tomorrow I wonder how other limiting factors might apply; notably 'lack of liquids' water and oil.
...OK, its getting late (12.10am Friday night) but upon a quick scan it seems to me that "Kunstler Armaggedon" might be postponed. Phew. I will keep keep the plans to my civilisation saving hydroponics system for the next generation -boy ARE THEY gonna need it...
Nick.
Chris:
It's not clear to me what portions of, or points on, the graphs in your post are actual historical observations as opposed to predictions from the model. Could you clarify please?
Actually, no portions of the model are actual historical observations. A lot of initial information is given for year 1900, and the model runs all the way from there to 2100. Different parameters can be adjusted if the model doesn't seem to reflect very accurately the historical observations, and the idea is that if the model reflects something close to historical observations, your parameters are about right and the predictions are roughly valid.
Of course, the past doesn't equal the future and I can think of many ways that the same parameters can work well for the past but not the future. In general, common sense and good reasoning are important, and any prediction from any model like this should be taken with general doses of salt. It's more important to look at the sort of things that don't happen, however much you twist the knobs (like, permanent growth in energy consumption), than at the things that happen in one particular scenario.
Chris, good effort. Some comments:
(A) point 3.3 food production is dependent on oil
(B) After our experience with the financial crisis, you need to introduce "debt" as an additional variable in the model. Debt is now a limiting factor. On page 91 of the Limits to Growth book (30 year update) capital is needed at 3 different points when using oil
(1) discovery
(2) production
(3) combustion
(they forgot (4) geo sequestration of CO2)
(C) 510 ppm is very high. This means a different planet Earth
(D) The coal usage under 4.2 will never go up in the 2nd half of the century as by that time nature will have thrown at human mankind many nasty climate change events, physically forcing us to abandon coal
(D) it would be more useful to do more detailed modelling for the next 10 years. When you look at Khebab's future oil production curves
http://www.theoildrum.com/node/4820
and take away the new fields ("New Supply Unsanctioned") because discovery and production capital are short in supply, we are going to see some dramatic declines in oil production.
One of the most critical climate tipping points is likely to be the disappearance of the Arctic summer sea ice:
National Academy of Sciences of the USA
http://www.pubmedcentral.nih.gov/articlerender.fcgi?artid=2538841
That may happen as early as 2013 (4 years from now)
State of the Arctic Sea Ice. Wieslaw Maslowski. Naval Postgraduate School
http://www.nwc.navy.mil/cnws/wardept/documents/State%20of%20Arctic%20Sea%20Ice%20(NPS).pdf
My worst case scenario for the next 10 years is that by the time the world wakes up to how urgent it is to reduce CO2 emissions and then extract CO2 from the atmosphere so that we come back to the natural CO2 concentration in an interglacial period of 300 ppm, that at that critical moment in the history of human mankind, we have diesel shortages and all those massive projects needed to get rid of coal will get bogged down.
What is required is indeed a system dynamics approach to this problem, including bar charts which projects are needed and where the fuels for their implementation will come from. We had 3 Pearl Harbours already. Katrina in 2005, Lehman Brothers in 2008 and peak oil (May 2005 - July 2008) at around 74 mb/d of crude. So the response must be accordingly. For, example, we have to re-tool our car factories to manufacture components for electric rail and renewable energies.
Market forces will not do this.
"(A) point 3.3 food production is dependent on oil"
Not really. What about electric tractors?
Where will the primary energy come from for electric tractors? Coal?
No, wind. It's scalable and high E-ROI.
Nice things about that: US farmers tend to have great wind resources, and can generate their own power!
Matt,
The Mid-West grain belt is also the wind belt,wind power supplies 2% of US electricity as of Jan 2009, would be more now(approx 7%increase in 3 months) say 2.14%.
Doesn't matter. Tractors don't help us produce more food from the same area of land, they help us produce the same food with less labour.
Machinery doesn't increase land yields much, it just decreases labour. For example, in the following picture the machine is not helping anything grow, it's just letting people harvest the field with three people in one day instead of ten people in a week.
In a fossil-fuel-constrained world which has made no attempts to adjust ("business as usual" scenario), people will have lost their jobs in the hundreds of millions, so there'll be lots of cheap labour for farms.
It's artificial fertilisers and irrigation that increase land yields, and it's those which will have difficulty in a fossil fuel-constrained world.
This should not be overstated, though. Currently we produce food for about 13 billion, it's just that a large chunk goes to livestock, a smaller chunk to fuel tanks, and much is simply wasted (around a quarter of food in the West is just chucked away uneaten).
However, around 2 of the 6.7 billion of the world's population feeds itself entirely with subsistence farming, almost entirely without fossil fuel inputs. So that food for 11 billion, made with some fossil fuel inputs, is made by and goes to the remaining 4.7 billion.
This suggests, at a first level of approximation, that without fossil fuels we can only just feed ourselves on the land we have, and have some small surplus in good years; with fossil fuels, we can get 11/4.7 = 2.3 times as much as we need.
However, it ought to be borne in mind that many subsistence farmers have had substantial increases in yield without fossil fuel input by application of a few simple techniques such as water control terraces, improved or appropriate strains of grain and tuber (not GM, just normally-bred stuff), and so on. The Green Revolution wasn't, as discussed here.
All this suggests that absent fossil fuels food production does not dwindle to nothing, but that to keep it up we need a lot more people involved in producing food, and good methods of farming.
Fossil fuels let us take lots of people off the land and be pretty sloppy about how we handle it. For example, in Australia we have a region that looks like this:

and we grow rice in it. We can only do so by vast applications of water piped from far away or aquifers - most of which just evaporates in the fields on their frequent 30+C days - and lots of artificial fertilisers. It'd be much more sensible to grow sorghum or something instead - less yield per land area, but much greater yield compared to the energy and water going in.
Cheap fossil fuels don't give us lots of food, they just let us have very few farmers and poor farmers at that.
Of course if you want to keep everyone off the land then you'll need those electric tractors. But given that absent fossil fuels a lot of people will be losing their jobs, I'm not sure what else we expect them to do. Stay jobless in slums in the cities?
Here is a case in point (data from 1997)
http://banglapedia.search.com.bd/HT/I_0095.htm
I expect preferentail oil supplies from the Middle East to Bangladesh to run irrigation pumps.
A half metre sea level rise will make 30 million Bangladeshis homeless. This will all happen in this century, that is within the period covered by the World3 model. Unless this model is regionalized, the results will not be very meaningful.
"It's artificial fertilisers and irrigation that increase land yields, and it's those which will have difficulty in a fossil fuel-constrained world. "
In the US, irrigation is needed for only about 30% of agriculture, and in most cases can be done with electric pumps.
Fertilisers I'm not so sure about - certainly to some extent you can use crops that don't need fertilizer, or fix nitrogen. Natural Gas inputs can be replaced with hydrogen, though at higher cost.
"It's artificial fertilisers and irrigation that increase land yields, and it's those which will have difficulty in a fossil fuel-constrained world. "
In the US, irrigation is needed for only about 30% of agriculture, and in most cases can be done with electric pumps.
When oil goes over about $100/bbl, PV becomes cheaper than diesel for pumps, so I would think that PV & electric pumps would replace diesel irrigation pumps.
Fertilisers I'm not so sure about - certainly to some extent you can use crops that don't need fertilizer, or fix nitrogen. Natural Gas inputs can be replaced with hydrogen, though at higher cost.
Well, it sounds like you agree with McKibben. In his book Deep Economy, he says that low-input farming requires twice as much labor per acre, but then that it produces twice as much food per acre. That sounds like it requires no more labor per unit of food.
Combine that with electric tractors, and I don't understand the idea that PO will kill food production.
"given that absent fossil fuels a lot of people will be losing their jobs"
Well, there's no reason to assume that. The world economy grew about 35% in the last 4 years, even as oil production plateaued. In the medium term, oil (and NG and coal) can be replaced.
I've not read his book, but that's an inaccurate and imprecise generalisation.
Growing grains and legumes entirely by hand is very labour-intensive. It's much more than "twice as much labour". Growing fruit, vegetables and tubers, well already today those take quite a lot of labour.
The main issue is that a low-FF-input farm has to be pretty diverse in what it grows. If you can't spray fertiliser and herbicides and so on, then you simply can't have endless hectares of only wheat, or only lettuces or whatever. They'll destroy the soil and be wiped out by pests on a frequent basis. So you have to have a mixed farm, with some wheat, some legumes, some tubers, some animals, and so on.
That doesn't lend itself well to machines of any kind, because machines are typically built for fairly specialised tasks, and a variety of work will be needed.
Yields per land area are better for high-labour, low-FF-input horticulture - growing (say) tomatoes among all those other things gets you more tomatoes/ha than growing tomatoes alone. But that's only when the place is well-run. You have to be a good husbandman of the land to manage it, knowing when to rotate crops around, which plants and animals will complement each-other, all adjusted by local climate and soil and water, and so on.
That's a skill which can be learned, but it's not widespread in the West, where we just mindlessly spray stuff on the crops and soil according to a schedule on a calendar - which is why about 8% of world greenhouse gas emissions are due to nitrous oxide, runoff from excessive artificial and manure fertiliser. So if there were a fossil fuel shock, where the affordability of the stuff dropped quickly, there'd be a significant adjustment period where the farmers learned to be husbandmen. During that adjustment period there'd be less food available.
I'm going on the scenario presented above. "Business as usual" means nobody adapts to changed circumstances, or only badly and slowly. Which means that as factories etc close down, people become jobless.
The total amount of money spent grew by a large amount, yes. That's not to say that we increased world production of goods and services by a large amount, too.
GDP, "the economy", is just a measure of all the money spent. There's no distinction made between $1 million spent on cleaning up an oil spill, $1 million on building a town hall, $1 million on plastic wishbones, $1 million on currency speculation, or whatever. It all adds to GDP, and "the economy". Still less does it distinguish between some CEO's salary going from $10 million to $11 million this year, and the $15,000 salaries of 100 Mexican fruitpickers rising by $10,000 each; yet one improves the lives of people by lots, the other has no real effect.
I think it's fair to say that a lot of the money spent in the past few years has been spent in ways which do not enhance a lot of people's material well-being.
Kiashu,
I don't think a CEO or Mexican salary labor contributes to GDP, the products sold by the CEO's company or the fruit would be products that contribute. IF in both cases the extra $1million is spent, then both contribute to GDP. If the Mexicans send it home, it contributes to Mexico's GDP so they buy more US products(perhaps).
Likewise $1 million on currency speculation doesn't contribute very much unless the person makes a bundle, and spends it.
In last 45 years OECD economy has been growing 1.3% faster than energy growth. In US California has done very well( no energy growth in last 10 years).
The recession, a decline in GDP (adjusted for inflation) is because people are not spending as much on goods and services and saving more, Hedge Funds activity doesn't count in any substantial way.
"I've not read his book, but that's an inaccurate and imprecise generalisation. "
Well, here's what he said:
"What about conventional versus organic? Could we take away the fossil fuel which means, most of all, the synthetic fertilizer), put people back on the land in larger numbers, and have enough for dinner? The proponents of conventional agriculture scoff at the idea... However, organic farming techniques have steadily improved in recent decades, especially in their use of cover crops, or "green manures," which enrich the soil without needing animal waste.
The best data come from an English agronomist named Jules Pretty, who has studied two hundred "sustainable agriculture" projects in fifty-two countries around the world. They might not pass the U.S. standards for organic certification, but they're all low-input, using far less energy and chemicals than industrialized farming. "We calculate that almost nine million farmers were using sustainable practices on about 29 million hectares, more than 98 percent of which emerged in the past decade," he noted in 2002. "We found that sustainable agriculture has led to an average 93 percent increase in per hectare food production." These were not tiny, isolated demonstration farms; Pretty studied fourteen projects where 146,000 farmers were raising potato, sweet potato, and cassava, and he found that practices like cover-cropping and fighting pests with natural adversaries had increased production 150 percent, to seventeen tons per household. With 4.5 million grain farmers, average yields rose 73 percent.60 When Indonesian rice farmers switched away from pesticides, he found, their yields stayed the same but their costs fell sharply." McKibben Deep Economy p. 68, 2007 paperback .
I'd be kind've surprised if all of these farmers increased their labor input by 93%, especially those rice farmers. In any case, they've reduced FF input costs. Also, they've reduced their land costs by 50%. Whether it's a mortgage, property tax, tithe, or rent, that's important.
On page 67 he says: "The small farm grows more food per acre, but only because it uses more people per acre—low-input farming in Great Britain employs twice as many people per acre, according to a 2005 study (James Morrison, Rachel Hine, and Jules Pretty, "Survey and Analysis of Labour on Organic Farmers in the UK and Republic of Ireland," International Journal of Agricultural Sustainability, vol. 3, no. 1 (2005).)"
So, twice the food, twice the labor: no more labor per unit of food. Also, half the land cost, and sharply reduced FF costs.
What's not to like?
----------------
"Business as usual" means nobody adapts to changed circumstances, or only badly and slowly"
That seems like an odd assumption. I guess it might be a useful benchmark in some kind of study, but it's not the most likely scenario (e.g., GM and Toyota, the two largest car companies in the world, have explicitly acknowledged Peak Oil, and centered their long-term strategy around HEV/PHEVs), so it doesn't seem that useful to me.
" if there were a fossil fuel shock, where the affordability of the stuff dropped quickly, there'd be a significant adjustment period where the farmers learned to be husbandmen. During that adjustment period there'd be less food available."
As Neil notes, farms don't take a signficant % of FFs. The likely scenario is that food production would stay constant, while food prices went up. Yes, that would hurt the poor during the transition - we should indeed work to prevent that.
"GDP, "the economy", is just a measure of all the money spent. "
As Neil explains, the P in GDP stands for Product, not income.
"I think it's fair to say that a lot of the money spent in the past few years has been spent in ways which do not enhance a lot of people's material well-being."
I'd absolutely agree, but that's a different topic. The point that's relevant to this discussion is that the world economy kept on merrily increasing it's production of goods (and a lot of them) and services, even while oil stagnated.
We're talking about different things.
I'm saying that going from this -

to this -
means an increase in labour. Which it does. The first is high fossil fuel inputs, the second is low or zero.
McKibben was talking about something else. He wasn't talking about taking away combine harvesters and tractors, he was talking about people who never had those things, improving their yields. They just had the odd bag of fertiliser to spread on their fields by hand.
My case:- HIGH FF inputs --> LOW/ZERO FF inputs means a big increase in labour, with static or increasing yield/ha
McKibben's case:- LOW FF inputs --> ZERO FF inputs means no increase in labour, with static or increasing yield/ha
To demonstrate my point:
McKibben tells us there were 9,000,000 farmers on 29,000,000 hectares = 1 farmer for each 3.22ha
In the US, there are about 2,000,000 farmers, the EPA tells us, but only about half of them do it as their primary source of income - whereas I suspect all nine million of McKibben's do it as their primary income. Still, let's take that two million.
The EPA also says that 382 million acres is used for crops, and 525 million acres for livestock; 907 million acres or 367 million hectares.
That's 183ha per farmer.
Perhaps you'd like to exclude the land for livestock - though livestock are part of McKibben's nine million farmers' land, so it'd be apples and oranges. That's still 77ha per farmer left.
So, low/zero-FF-input agriculture requires 1 farmer per 3.22ha, and high-FF-input agriculture requires 1 farmer per 77-183ha. That is, low/zero-FF-input agriculture requires 24-57 times as much labour for the same land area.
With McKibben's 93% higher yield, the low/zero-FF-input agriculture requires 12-27 times as much labour as the high-FF-input agriculture, for the same output of food.
That means the US would have to go from 2 million to 24-54 million farmers to produce the same amount of food, if someone turned the tap off tomorrow. Which I don't believe will happen, it's just an extreme example for the purposes of illustration.
What I think most plausible as fossil fuels deplete is that we'll see more of the long trend of small farms disappearing, and large corporations taking them over.
While agriculture uses a relatively small proportion of all fossil fuels, still in a free market economy the farmer must pay for those things. It may only be 1% or whatever of all use, but if supply drops then the price goes up. And that cost gets passed on.
What seems plausible to me is that as fossil fuels deplete and become more expensive, many of the smaller farmers will be driven out of business, their land bought up by large corporations, who can by buying in bulk keep costs down and by their market share put food prices up.
If Farmer Jones with his 200ha finds his tractor's fuel is now $10/lt, and a result says that his 1,000t of wheat will have to sell for $200/t instead of $150/t, well the market will just not buy his wheat, it can do without a thousand tonnes, and Jones will go broke.
But if AgriCorp with their 200,000ha of farms and 200 employees (because of economies of scale, less people per ha) say their 1,000,000t of wheat will now be $200/t, well people will just pay up, the market can't let a million tonnes of wheat go to waste.
So I think that fossil fuel depletion will lead to less farmers, not more. Or rather, less farmers doing large production stuff, and quite a lot more people doing backyard gardens. It's worth growing a few fruit and vegies in your backyard, it's not really worth growing wheat or rice.
Of course this gets muddied by the likelihood of government interference in the market to keep small farms going (eg by paying them to leave their fields fallow as in the EU), or subsidise large ones (eg by removing fuel tax for them).
But given a more-or-less free market, as fossil fuels deplete and thus rise in price, it's likely that broadacre farming will be concentrated in fewer and fewer hands, and be done by fewer and fewer people, while horticulture will be done by more and more people.
"But given a more-or-less free market, as fossil fuels deplete and thus rise in price, it's likely that broadacre farming will be concentrated in fewer and fewer hands, and be done by fewer and fewer people, while horticulture will be done by more and more people."
It does seem like we're going in that direction. Although, when oil goes above about $80/bbl, electric transportation and tractors will become cheaper than diesel. Renewable electricity won't rise in price (because of it's high EROEI, and falling capital costs), so that will cap costs.
"if supply drops then the price goes up. And that cost gets passed on. "
Yeah, that's what I meant. Most people will pay a bit more, and the poor will suffer.
"McKibben tells us there were 9,000,000 farmers on 29,000,000 hectares = 1 farmer for each 3.22ha"
That's a good point. That means that developing world agriculture is very different from 1st-world ag, and needs to be analyzed separately.
"McKibben's 3rd world case:- LOW FF inputs --> ZERO FF inputs means no increase in labour, with static or increasing yield/ha"
It looks to me that for his 3rd world case, LOW FF inputs --> ZERO FF inputs means very large increases in yield/ha. That's all good.
His 1st world case: HIGH FF inputs --> LOW/ZERO FF inputs means a doubling in labour, with increasing yield/ha (he doesn't say how much). That's likely to work out pretty well. Let's illustrate that:
Let's say labor cost/acre doubles, and yield increases by 30%, and FF inputs are reduced by 75%. Let's also say that before conversion to low FF input farming, that labor is 50% of costs, land is 20%, FF is 20%, with another 10% of miscellaneous. If labor doubles, we have a 50% increase in costs. Land stays the same, FF costs fall by 15% of the base. That's a net increase of 35%.
So, output up by 30%, costs up by 35%. Now, if FF costs were to quadruple, net FF costs would stay the same as the original pre-low-input case, for a net increase of 50% in costs, vs output increase of 30%. Overall cost per food is up by 150/130, or 15%. That's not bad at all. Now, if output/acre rises by more than 50%, then it's all good.
"McKibben ... wasn't talking about taking away combine harvesters and tractors"
I'm not sure about that. In any case, why would equipment disappear? Again, electric tractors will inevitably replace diesel, and at an overall cost that's fairly close to that of today: again, when oil goes above about $80/bbl, electric transportation and tractors will become cheaper than diesel. Renewable electricity is very cheap, relative to diesel (it's the battery costs that are significant), and won't rise in price (because of it's high EROEI, and falling capital costs), so that will cap costs.
Nick,
I suspect the transition will be off-farm transport moving to rail and PHEV for pick-up owners who actually do need a pick-up( ie <5%), farm grain drying going to electric, ammonia generally using NG as a source of H2, but electric compression and heating, with NG heat used by everyone else being replaced by electric, and finally a (slow) transition to PHEV tractors, or CNG/LPG so the farmer will always be able to complete a time sensitive operations.
Sounds reasonable.
I think farm grain drying will go to coal, if we don't implement cap and trade or the equivalent soon.
"a (slow) transition to PHEV tractors, or CNG/LPG so the farmer will always be able to complete a time sensitive operations"
I don't think we need CNG/LPG. The genius of PHEV is that you have a small backup motor (probably diesel) which gives you the same range as a pure ICE tractor, in case of emergency.
Again, there's a difference between Third World subsistence farmers taking on some improved techniques, and being able to do away with their half-dozen bags of fertiliser applied by hand and gallon of diesel a week for their water pump, and some First World farmers working as employees of a large agricultural corporation running short of fossil fuel inputs.
The change is a significant one for Third World farmers, but not a profound change, in that their day-to-day lives are more or less unchanged. They still go out to the fields every day, still tend the animals and so on. What you're proposing for Western farmers is likewise not a very profound change. They just plug in instead of filling up.
Going from Green Revolution Third World farming to some kind of organic farming is not a profound change, and requires a doubling of labour, but gives us a doubling of outputs.
Going from Western farming to some kind of organic farming is a very profound change, and requires 12-27 times as much labour, and will maybe give us a doubling of outputs.
With your suggestion of electric tractors and the like, what you're trying to do is have the change be just as non-profound for Western farmers. That's the thread running through a lot of discussions of mitigating climate change and peak fossil fuels - "How can we sort it out with as little change as possible?"
We have to set that aside, and be open to radical changes. Some may be needed, some not - but we have to keep an open mind.
For example, if it turns out that the electric tractors and combine harvesters aren't available, then either the scarce fossil fuels are diverted to agriculture, or we use more labour there instead.
It's not clear that the scarce fossil fuels will remain in agriculture. Between Farmer Smith and the suburban mother dropping her obese kids off at school from her SUV, who do you think can bid higher for fuel? Large numbers of farmers around the world only manage to keep farming because they or some member of their family has an off-farm job putting money into the place. If farms are so unprofitable when fossil fuels are cheap, what will they be like when fossil fuels are expensive?
The only way the fossil fuels remain on farms is if large companies with economies of scale and ability to buy cheaply in bulk control the farms. Otherwise, we just need more labour on farms. Western and Third World farming thus start to look more similar.
By insisting that we'll use electric stuff, what you're saying is that we simply can't have more labour in agriculture. Why is this so vital? Would that be so dreadful, to have A Nation of Farmers? If they're not farming, what else should they be doing?
That's an important question, what should people be doing with their lives? If you have a large mass of people with nothing to do and no income, you get all sorts of problems, from crime to outright civil conflict.
Why so keen on the electrics? Why so keen to keep people off the land? What else do you want them to do? Again, remember that in an age of fossil fuel constraint, lots of today's jobs will be gone.
Bring in plug-in electric cars, or put everyone on trains, and there are far fewer oil refineries, and no service stations. Close down coal-fired power stations and the station workers can maintain the windmills if we build any, but what about the coal miners? And so on. Take away fossil fuels, and whether you replace them with renewable electricity or not, you take away a lot of jobs.
So the workers should support a class of permanently unemployed? Or if they don't support them, the permanently unemployed, objecting to starvation, become criminals or insurgents? Or just live quietly in slums, perhaps working for ten dollars a day as maids, labourers and prostitutes for the urbanites in their gated ecotopias?
Again, it's not clear why we should be so keen to keep this model of agriculture, the grain field seen from inside the airconditioned cabin of a combine harvester. What recommends it?
Kiashu,
"Going from Western farming to some kind of organic farming is a very profound change, and requires 12-27 times as much labour"
I think we can agree that Western farming is a very different animal than developing country farming. You can't compare the land:person ratio of western farming to that of developing country farming in that way.
McKibben's "low-input" farming includes all FF inputs. His book is very PO aware: take a look at page 63, for example, where he discusses it at length. Again, he finds a doubling of labor per acre, and and increase in food per acre. As I calculated, that gives a negligible increase in food costs; Let's say labor cost/acre doubles, and yield increases by 30%, and FF inputs are reduced by 75%. Let's also say that before conversion to low FF input farming, that labor is 50% of costs, land is 20%, FF is 20%, with another 10% of miscellaneous. If labor doubles, we have a 50% increase in costs. Land stays the same, FF costs fall by 15% of the base. That's a net increase of 35%.
So, output up by 30%, costs up by 35%. Now, if FF costs were to quadruple, net FF costs would stay the same as the original pre-low-input case, for a net increase of 50% in costs, vs output increase of 30%. Overall cost per food is up by 150/130, or 15%. That's not bad at all. Now, if output/acre rises by more than 50%, then it's all good.
" if it turns out that the electric tractors and combine harvesters aren't available"
That's just not realistic. Electric drivetrains are used for freight trains, US Army tanks, aircraft carriers, etc, etc. Electric tractors have been a little bit inconvenient, and slightly more costly (from a PO point of view) than diesel, due to the expense of batteries. To suggest that electric tractors and combine harvesters won't be available, is...just completely unrealistic.
"Between Farmer Smith and the suburban mother dropping her obese kids off at school from her SUV, who do you think can bid higher for fuel? "
The farmer, easily. That's what happened most recently: food prices rose, in part to recover FF input costs, and "civilian" fuel consumption dropped.
"If they're not farming, what else should they be doing? That's an important question, what should people be doing with their lives?"
A whole heck of a lot of other things. Someday we'll want to learn how to manage our lives and economy without this emphasis on jobs and working all the time. On the other hand, I don't think we're all that close to a "mature" economy:
1) There's a lot more to life than goods. That includes services like child care, education, eldercare, healthcare, etc etc, that we need a whole heck of a lot more of. Until all children, elderly and disabled are taken care of well, we're not there yet. Until medical research has eliminated all disease and disability, and eliminated aging (or come close to it, like the One Horse Shay), we're not there yet.
2) There's more to the world than the OECD. Until there's no more poverty in the world, we're not there yet. We bemoan globalization in the US and complain about losing jobs in exchange for our cheap goods, but in some ways it's really a process of helping the 3rd world. Hard on some of us, but good for them.
Kiashu, you say "it's just letting people harvest the field with three people in one day instead of ten people in a week." You make an excellent point. But in your picture the three people are planting, not harvesting. Or to be exact, one woman is planting, one man is driving and a second man is enjoying a ride. :)
Nick,
As far as I can work out, farm vehicles use about 1% of present US oil consumption(5gallons x 340M acres). While world ammonia synthesis uses about 2% of world energy, all can be replaced by electricity. Replacing the 55% of oil use(cars and light trucks) with EV's is going to allow a lot of tractor cultivation( sorry don't do that anymore with zero till) allow a lot of seeding spraying and harvesting. Other farm chemicals about 0.01% of present oil consumption.
Good points.
We can certainly produce ammonia fertilizer with renewable electricity. It would be more expensive - it might make more sense to go to low-fertilizer farming instead.
I've been reading McKibben's book Deep Economy: I like a lot of what he has to say. Oddly, I don't yet see any sign of a sharp choice between prosperity and, say, local and better food.
For instance, he says that low-input farming requires twice as much labor per acre, but then that it produces twice as much food per acre. That sounds like it requires no more labor per unit of food. What's not to like?
The Wieslaw Maslowski link isn't working. I found the abstract, however. I agree with its conclusions. Ice thickness is ignored by the media and under-emphasized by the NSIDC, etc., despite falling by up to 80%. Too much attention paid to area and not enough to volume.
http://www.cosis.net/abstracts/EGU2008/06425/EGU2008-A-06425.pdf
Cheers
I think it's those brackets in the file name. Use this search word: "maslowski nwc.navy.mil sea ice" in google and it's the first line
Another link is here:
http://www.ees.hokudai.ac.jp/coe21/dc2008/DC/report/Maslowski.pdf
(A) Food production is dependent on a number of industrial inputs, so it's better to put industrial inputs rather than just oil on the model. That's how it is currently.
(B) As I said in a post above, debt and other purely financial variables aren't included in the model. For a more detailed explanation, look for the post above.
(C) Agreed.
(D) Nasty climate events reducing crop yield are included in the model, and the model shows a growth in coal use nevertheless.
(E) This kind of model isn't any good for more detailed modelling for the next ten years. You'll have to look elsewhere for that.
Those aren't the EROEI figures for oil in general, but for oil discoveries and oil extraction/production. The 100:1 figure is from a 1984 science article and specifically states it's in reference to discoveries only. The figures for 1970 and 2000 specifically state they are only for extraction/discovery, and do not include the energy needed for refining/transportation compared to oil's energetic refined products.
If we're going to compare the EROEI of renewables delivering a finished product, electricity specifically, to oil, then we should at least include the EROEI of refining/transportation so we can use a meaningful comparison of both finished products, chemical energy from crude and electricity from renewables.
There's a third reason: you're only accounting for fossil fuel emissions. A bit under half of all emissions come from deforestation, livestock, overuse of artificial fertilisers and biomass decay in rice paddies, hydroelectric dams and so on, and the cement/chemical industries.
So your "business as usual" scenario is actually a "halve emissions immediately and go from there" scenario.
With declining fossil fuel availability, we can expect less livestock to be grown, but more deforestation. The reasons for the increased deforestation are many, but include:
Deforestation currently causes about 17% of our total greenhouse gas emissions, or 8Gt CO2e. In recent years the rate of deforestation has been up and down. Basically the developed countries have a static or rising area of forests, and the developing countries have deforestation all the time, but a bit less if the country has strong economic growth, ie if the people can eat and earn a living without cutting down trees.
But even in times of growth the developing countries have deforestation, because they countries supply the wood to the developed countries who are reluctant to cut their own forests down.
Nobody seems to have learned to reduce consumption of wood products; the Japanese, for example, have almost two-thirds forest cover, but this only supplies one-fifth their demand for wood products, which is supplied instead by places like Malaysia.
In a business-as-usual scenario the rate of logging rises over time, especially with it having to substitute for fossil fuels and provide more agricultural land. In a greenish scenario reforestation occurs at a high rate, but the growth in global forest cover is slowed by a demand for renewably-sourced materials like wood (rather than depleting materials like coal and iron). So as a first approximation we could expect the 8Gt CO2e emissions from deforestation to continue. To 2100 this gives us 736 Gt CO2e. This would be roughly like finding another 234 billion barrels of oil to burn over that time [based on this article telling us that, given not all crude oil's products are burned, each average barrel produces about 317kg emissions; 1t emissions come from 3.15bbl].
Does that change your scenario much?
The declining carbon sinks would be most significant, though. Basically, the biggest one is the ocean, and it's slowing in its absorbtion of carbon dioxide. This is because any liquid can only absorb so much gas, and because as it warms it can absorb less. Boil a glass of lemonade and see that it loses its fizz.
Given a business-as-usual scenario, when you combine the fossil fuel emissions with the other half, and given declining carbon sinks, 1,000ppm and 6 degrees C of warming by 2100 seem a strong prospect.
My instinct is that the disruptions to economy and society brought about by (say) 450ppm and the climate change will mean that we don't extract all the fossil fuels anyway. A Hurricane Katrina every year or two, enormous wildfires, storms and the like - when that happens, you end up burning less fossil fuels, and it becomes very hard to keep along with anything like Business As Usual.
My model does take deforestation into account. Not entirely sure if the figures are correct, but it's there.
On the issue of carbon sinks going, I'm using the projections from the IPCC on what happens to carbon sinks as carbon dioxide increases. Some people say they are optimistic, but I don't know of anything better to go on.
Composite models like this work because the component models have been abstracted away quite a bit. I am curious as to what the oil depletion part of this model looks like, since we don't have much to choose from.
I'm just curious, are the maths in the world3 model difference equations?
http://en.wikipedia.org/wiki/Difference_equations
Or differential calculus?
http://en.wikipedia.org/wiki/Differential_equation
And what, if any, is the difference?
http://en.wikipedia.org/wiki/Time_scale_calculus
I only ask because I suck at math, but I would like to acquire at least a rudimentary understanding of the equations in the world model.
If they do use difference or differential equations, then it becomes a more or less deterministic model. In my experience, adding feedback to anything that may have a stochastic outcome will just diverge all over the solution space. And I know that oil depletion has a very stochastic basis; dispersion leads to the Logistic model and the "fat tails" one observes.
They are differential equations. Difference equations are discrete (the values are expected to jump) and differential equations are continuous (they are expected to be a smooth curve). In practical terms, there isn't much difference if you don't expect values to change much from one unit of time to the next.
Thank you Dolores,
What an excellent first post! Thank you for putting in all of this effort. I really appreciate your posting the model source and the tools to run the simulation. I look forward to reading it in detail.
Your model of EROI over time is very interesting. What you did makes a great first approximation.
Now I am thinking about how to refine our understanding going forward. Could we use mining cost of depleted coal mines to understand how EROI changes over the life of the mine? How about depleted oil wells? Does anyone have data on when the wells are finally capped and abandoned? What makes a well suitable for stripper well operation over just abandonment?
All those are good questions for Charles Hall and his EROEI team, not for me.
For downloading the software, you might want to consider something like Google Docs, or some other widely used, free filesharing system. The Mdl file looks like it's just a text file, so Google Docs would accept it (you might have to give it a .txt extension).
Another poster reported that the uploading.com site gave them a virus.
I have tried to reply to the questions that were directed to me, but I have only skimmed through the comments, please forgive me if I missed yours. I'm quite busy right now with my involvement in Transition Brighton & Hove. I will read through the comments more slowly later on this week. It may be a good idea to post again your question if I missed yours.
Thank you very much for all your feedback, much appreciated!
Doly,
I very much appreciate the work you have put in for this post and for replying to my specific questions. I really think it would be valuable to have a number of simulations as was done in "Limits to Growth". Since EROEI seems to be critical to the model outputs and when renewable really kicks in ( now, 2030 or 2050).
Figures for 2005 give hydro 3%, biomass 4%, solar heat 0.5% and wind 0.3% and geothermal 0.2%, for a total of 8%. Most of these renewables( except biomass) would probably deliver X3 more useful energy than the average of oil(<20%), coal(35%) and NG(60%), ie 4%x3=12% plus 4%biomass=16%.
Wind is especially interesting because by the end of 2008(121GWc), wind has doubled from end of 2004(47GWc), and is predicted to be X4 higher by end of 2010(190,000GWc). A lot of this "predicted" increase is under construction or approved.
http://www.wwindea.org/home/index.php
While this will still be less than hydro( which is also expanding), it probably fair to say that wind energy will be kicking in about 2010 rather than 2050. Since 1BTU of wind could displace 3BTU of coal, this could stabilize coal consumption at 2010-2015 levels, giving a longer coal plateau.
As a few comments have questioned the low EROEI for renewables, is this because of the biomass/biofuel component being very low(1.3:1) rather than wind and hydro being high( >20:1 and >50:1)?? That could explain your inputs, where you have combined all renewables, BUT for future wind and solar are going to be much much larger than biomass.
I very much look forward to seeing any additional outcomes using different assumptions.
I'm not sure what you mean when you say that most renewables would deliver more useful energy than oil. Do you mean higher EROEI? If you have data to prove this, Charlie Hall would love to know. He's interested in any numbers anybody may have regarding EROEI.
I think I gave the wrong impression when I said in previous posts that solar, wind and hydro were aggregated in one variable. I didn't mean that I aggregated all renewables in one variable. I have three separate variables for renewables: biomass, renewable electricity and renewable thermal. Like Einstein said, "Keep everything as simple as possible, but not any simpler." There isn't a significant difference between getting your electricity from wind or solar from the point of view of this model, but there are differences between the three types of renewables I identified.
The 10:1 EROEI for renewable electricity comes from an attempt to guesstimate an average from Charlie Hall's numbers for photovoltaic (around 5:1), wind (around 18:1) and hydro (around 30:1). Like I said before, you may think it's too low.
"There isn't a significant difference between getting your electricity from wind or solar from the point of view of this model"
Wind has much higher EROEI, and much lower cost - that's more than enough difference.
Wind is growing quickly, in % and absolute terms. It was 32% of new US generation last year. Coal, on the other hand, is likely to struggle to maintain it's current US production, due to CO2 emissions concerns, and wind is very likely to take it's place for all new generation, and fairly soon start replacing coal.
Clearly, the model needs to take this into account.
Doly,
Thanks for replying,
What I mean about useful energy is easily understood in the case of NG.
NG can deliver heat(65-90% efficiency) or it can be used to generate electricity at about 50% efficiency ( depending upon type of generator).
To replace 1kWh of NG( MJ basis) heat with electricity from wind or solar or hydro will require about 0.7kWh , if the electricity is used in a resistance heater(100% efficient) or 0.2kWh if the electricity is used in a heat pump to heat water or air(2.5:1 energy gain).To replace 1kWh NG electricity will require 2kWh NG(BTU)
So a model should not treat kWh( or BTU) from wind energy the same as NG energy. Same for coal but using 40% efficiency to convert BTU to kWh electricity.
Now oil is a little different today because we don't generate much electricity with oil, but we do still use it for heat, so the heat conversion of oil to electricity would be x 1.4-4.0 more oil than electricity depending upon heating method.
For transport, when we look at a PHEV we can directly compare the most efficient vehicle powered by either ICE engine or battery electricity. The figures for Chevy Volt are 1gallon gasoline(130MJ)gives 50miles range or 8kWh gives 40miles range( 10kWh/50 miles). Thus 10kWh(36MJ)=1gallon(130MJ) so electricity on a MJ basis gives x3.6 more "WORK" on a MJ basis.
Bottom line for your model is: To replace all oil used for motor vehicle transport(55% of oil) would only need 1/3.6 as many MJ of electricity or to replace coal 1/2.5 on a MJ basis.
The EROEI assumptions of wind probably need to be revised if you look at the paper by Cleveland? on a previous TOD posting you will see he averages small turbines and larger(0.5-0.75MW) and all of the larger are >30:1, but now we are building 2-3MW turbines probably >50:1.
Will be higher in most of the world than in Germany because of the low capacity and low wind speeds used in Germany.