EROI on the Web part 2 of 6, (Provisional Results Summary, Imported Oil, Natural Gas)
Posted by nate hagens on April 8, 2008 - 10:30am
This is the second of a six part series on net energy research resulting from Professor Charles Hall of the SUNY College of Environmental Science and Forestry and his students during last semesters "EROI Sweatshop". While it is still in draft form, it is hoped (with some help from TOD readers) to be refined and directed into the formal peer review literature. But Professor Hall (and I) believe this type of thinking also needs to be considered outside the academy, and increasing the level of energy discourse in our nation is one reason for him choosing to display his draft essays on theoildrum.com.
This installment highlights 3 individual sections of the larger compilation: 1) a provisional summary table of updated (or as updated as we have) EROI figures for various fuels, 2) an insightful (but counterintuitive - I had to read it twice) analysis on the EROI of imported oil from the perspective of the importing country (USA), and 3) an analysis on the EROI of natural gas. If you would like to 'improve on the silence' in the comment section to help Dr. Hall and his students advance the biophysical Rubik's cube that is EROEI analysis, please share your wisdom /expertise/ links, etc. Next Tuesday will be the Appendix on the EROI of Nuclear.
Previous articles/commentary from this series:
At $100 Oil, What Can the Scientist Say to the Investor?
Why EROI Matters
EROI Post -A Response from Charlie Hall
PROVISIONAL RESULTS FROM EROI ASSESSMENTS
Charles A.S. Hall and the “EROI study team”
State University of New York
College of Environmental Science and Forestry
Syracuse, New York
Introduction
Energy return on investment, sometimes called EROI and sometimes called EROEI, is thought by many, including myself, to be a critical issue for determining the past, present and future status of human society. It is usually considered in terms of energy return on energy investment, but it can also be considered in terms of energy return on monetary investment. While much of human progress has been attributed, rightfully, to technology, much of that technology has been a means of using more energy for human ends. This is true for fire, knife blades and spear points (energy concentrating devices), the development of agriculture and the increase in its productivity and, essentially all aspects of the industrial revolution.
EROI is simply the energy delivered by an energy-obtaining activity compared to the energy required to get it. If the numerator and denominator are expressed in the same units (barrels per barrel, MegaJoules per MegaJoule) the result is a dimensionless ratio, i.e. 100:1 or 10:1). Obviously a higher ratio implies a more desirable fuel than a lower one, other things being equal (which is rarely the case). The concept is extremely simple in theory but often very difficult in execution, mostly because society generally maintains its records in monetary rather than energy terms. Another problem is that the U.S. Government has not supported such studies in a consistent fashion and it is my perception that the quality of some energy records as are kept by e.g. the U.S. Departments of Energy and of Commerce appear to be deteriorating in recent years. Thus deriving the energy cost of getting energy (or most other things) is generally somewhat, and oftentimes exceedingly, difficult. A second problem is that the usual measure of the quantity of a fuel, its heat value, often does not give a full assessment of that fuel’s ability to do economic or other work. Most simply electricity and thermal heat from e.g. coal or oil have a great difference in their ability to do work, such as we are willing to trade three or four heat units of coal or oil in a thermal plant for one thermal unit of higher quality electricity. Thus if the input and output fuels are of different quality then it is often thought desirable to weight in some way the inputs and the outputs. A third problem is that it is important to consider boundaries: how large should we draw the boundaries of the energy analysis for the inputs? We will consider these issues in far more detail in later publications but there are many reasons why it is important to make summaries of EROI available at this time even though many uncertainties exist in the numbers that we present here, and indeed with any numbers that might be possible to generate.
At this time humans are especially dependent upon oil and natural gas, collectively called petroleum, for they supply about two thirds of the industrial energy both in the US and in the world. Petroleum is an especially advantageous fuel for human society because of its abundance, energy density and, at least in the past, high EROI. The concern at this time is twofold: there are many arguments and more than a little data that we may be approaching “peak oil” for the world, as has already happened, often long ago, for the United States and some 50 other oil producing nations. A related issue is that the EROI for oil and gas nationally and globally appears to be declining fairly substantially. For example, in the US in 1930 the EROI for oil was at least 100 barrels returned for each barrel invested (i.e. EROI = >100:1), but declined to about 30:1 in 1970 to from 11 to 18: 1 in 2000 (Cleveland et al. 1984, Hall et al. 1986, Cleveland 2004). Similarly, Gagnon et al. (in preparation) have estimated that the EROI for global petroleum has been declining steadily in recent years. Were these trends to continue, and there is little to indicate that they would not, then oil and somewhat later natural gas would be not only less available due to peaking but also much more expensive in terms of society’s resources, including energy, required to obtain them. Consequently there is considerable interest, at least amongst those relatively few who think about it, about what might be the EROI and scalability of alternative fuels.
At the present time the most available (and promoted) alternative to oil as a transportation fuel is ethanol made from corn. EROI has been an important part of the debate about the desirability, or lack thereof, of this fuel (See e.g. Farrell et al. 2006 as well as the many responses to that article, including our own, in Science, June 23 2006). Different estimates of the EROI for corn-based ethanol range from 0.8:1 to 1.6:1. The debate has usually focused on whether the EROI is greater or less than one for one, as obviously it would not make sense to invest one Joule of existing oil or gas to generate less than one Joule of alcohol. (Some arguments have been made that if we would invest one Joule of lower quality fuel such as coal to make one Joule (or less) of liquid fuel it would make sense). We will argue in later papers that if proper boundaries are drawn the minimum EROI needed for a fuel to make a real contribution to society, and not be subsidized by petroleum, is not 1.1:1 but closer to 5:1. However it is not the issue of this paper to make such arguments but to simply examine what might be the EROIs of various energy sources “out there”, as well as consider the potential magnitude and environmental aspects of various fuels.
An additional critical component of the value of a fuel is its magnitude, both in actuality as well as potential. A fuel may have a very high EROI but be limited in magnitude to less than one percent of e.g. the energy use of the U.S., as is the case for wind energy now in the U.S. In addition there are many other criteria that might be used, including, as noted above, magnitude and environmental issues. Additional considerations might include labor, financial, land use and many other issues. Some of these can be quantified. A comprehensive, although controversial approach to quantification is emergy analysis (e.g. Odum 1998) whereas all environmental as well as industrial energies are considered. Nevertheless it seems obvious that not all issues can be easily quantified, and some important aspects can only be listed. In the meantime it is important to quantify what we can. Such quantification can help us to judge various alternatives, eliminate some obvious bad choices and understand how the future may be very different as we continue to exploit and deplete our highest quality fuels.
Methods
Unfortunately there does not exist at this time a large and sophisticated literature on this important problem, primarily because most records kept on energy analysis are monetary-based rather than energy-based, reflecting the obvious and understandable focus of business on the monetary end of things and the basic way that information on our economy is maintained in the US (and the rest of the world). In addition there is not yet any explicit publication or protocol by which we could agree to undertake EROI analyses, and different analysts use different methods, procedures and, most importantly, boundaries to do their particular analysis. Finally a given technology may have inherently different EROIs depending upon the location where the analysis is applied. For example, different dam sites can give enormously different EROIs, and corn grows much more efficiently in Iowa than Maine or New Mexico. While we await a more explicit protocol (which we are working on) the approach used here can only be described as “hammer and tong”, that is, using anything that can be possibly brought to bear on the problem. Our preference is for an explicit “meta analysis” using a sophisticated assessment of extensive data reported in reviewed literature. Unfortunately these conditions are rarely met, so we used whatever information we could find with some comments about the quality of the literature we found. In addition we have developed new analyses for several fuels.
Some alternative approaches that can be used to calculate EROI include:
1) Top down (National aggregate) approach:
1a) National energy/GDP ratio. The crudest approach is simply to examine the amount of energy used by the entire economy per unit of economic production to give an average amount of energy used per dollar of economic production. This is obtained easily by dividing the total GDP of the economy in question by the total energy used by that economy. For example in 2005 the GDP for the United States was 12.456 trillion dollars, and the energy used was 100 quadrillion BTU’s (English units), equal to 105.5 ExaJoules in Metric units). The quotient is 8.47 ExaJoules per trillion dollars or, in more useful terms, 8.47 MJoules used per dollar of production. This of course is not especially useful for most applications because different economic activities have different energy intensities. For example Herendeen (personal communication) estimated that in 2005 heavy construction requires about 13 MJoules per dollar of activity, and very heavy industry needs more. Nevertheless, earlier work by Hannon, Bullard and Herendeen at the University of Illinois showed that because of the extreme interdependency of our economy (i.e. different sectors purchase considerably from each other) and the concept that, perhaps, energy is in some sense the ultimate raw material for economic production (Costanza 1980) the difference was not enormous for most final demand except fuel itself.
1b) Direct energy: The approach that had been used most commonly in the past was to divide the energy generated by a resource by the energy used to obtain that resource as indicated by national assessments of the total energy used by that sector of the economy (See e.g. Cleveland et al. 1984; Hall et al. 2006). These are derived in turn by questionnaires sent out every five years by the Department of Commerce to many players in each sector and scaling up the results to the entire industry. This is sometimes called a “top down” approach because it derives the analysis for the entire industry from aggregate data collected on key players in the industry. Unfortunately this approach cannot be used for many of the alternatives to principal fuels because they are not important enough quantitatively for the Department of Commerce to maintain such data. This is a very sound way to get minimal estimates of energy used to get energy, although I and others have felt that there has been a degradation in the quality of the data maintained in recent years.
1b+) Indirect energy: In addition to the direct energy used to produce a fuel, energy is used off site (i.e. indirectly) to generate the materials used by that industry. These can be derived in various ways, most accurately by using the “Leontief I-O” approach adjusted from money flows to energy flows (e.g. Bullard et al. 1975, Bullard et al. 1978, Hannon 1981). The direct and indirect flows are added to provide a more complete assessment of energy used. An analysis using much larger boundaries and including the energy used by nature is the emergy approach (e.g. Odum 1996). While this method is controversial it is useful in generating an upper bounds for an analysis.
2) Summarizing existing literature.
Ideally this would be based on peer reviewed literature published in reputable scientific or economic journals. This is an important criterion as many such analyses as are “out there” are clearly advocacy pieces for or against one fuel or another. When such analyses are done well and include many studies as well as a consideration of the quality of the methods and results it is often called a “meta analysis”. Unfortunately such quality control is rarely possible. Thus we rank the analyses presented below as “literature summaries” and “meta analyses” based on the above criteria.
3) A “bottom up” approach
This approach scales up information for some hopefully representative part of the industry to the industry as a whole. In this case an inventory is made of the energy and materials used for an activity and all are converted to energy units (see energy intensities).
4) Other approaches
Their use is too rare and too diffuse to summarize.
All of these methods are incomplete for many reasons, because they do not include all of the energies used to create the product or all of the energy loses due to the products’ production or use. These include, but are not limited to, the energies required to overcome environmental impacts, to support the labor used and to construct the machines and infrastructure necessary to use the energy. In addition for non-renewable energies they do not include the energy used to make or replace the energy itself, but rather only that energy used for exploitation. The inclusion of these additional energies are controversial and complex, and are not used here. Hence EROI values given (that are current) are probably maximums, in some cases substantially so.
The information summarized below was obtained by an intense month-long “EROI sweatshop” where about a dozen dedicated and carefully-selected graduate and undergraduate students were directed by Charles Hall to seek whatever information might be available on the magnitude, EROI and environmental impacts of various energy sources.
Disclaimer: The results given here are preliminary, sometimes perhaps quite crude and subject to revision. Almost always we did not find enough obviously reliable information such that we could feel really certain about our conclusions. On the other hand it is our general sense that for most of the analyses presented our numbers are well within the ballpark and are unlikely to change substantially in the future, but we could be wrong about that too. Subjectively we are least certain about nuclear energy (because most of the analyses were old, although reinforced by several modern ones), coal (because the analyses are very incomplete), hydropower (because the results are so site-specific) photovoltaics (because the technologies are changing so rapidly and the materials supply for major expansion so uncertain). It is also important to remember that our results are based on existing operating technologies and not on some future perceived improvement. We welcome any additional objective and reliable information that we have overlooked.

Provisional Results Summary - TD= top down, EI= Energy intensities times dollars, LS = Literature summary, MA = MetaAnalysis, BU= Bottom up, LR = literature review, O = other. (Some are mixed)
RESULTS
We have four main results:
1) First there will be almost certainly a continued decline in the EROI of most major fuels, including especially liquid fuels, used in the U.S. economy. This problem is likely to be as much due to an intensification of effort as to the decline of the resource base itself (see 3). The probable decline in EROI includes domestic and especially imported oil and probably natural gas as well.
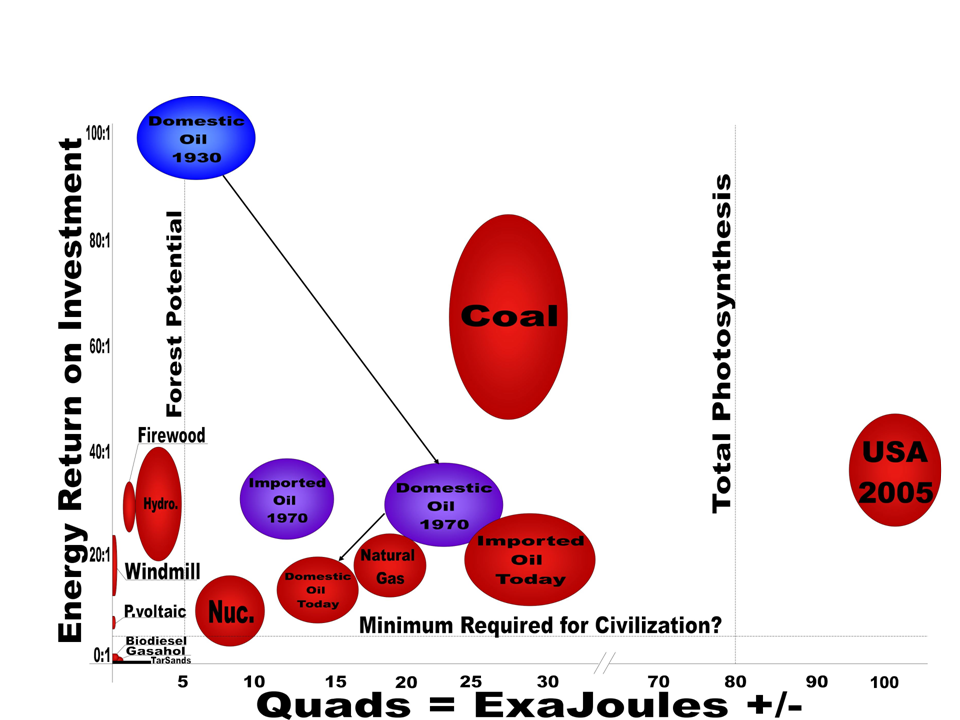
Figure 1. “Balloon graph” representing quality (y axis) and quantity (x axis) of the United States economy for various fuels at various times. Arrows connect fuels from various times (i.e. domestic oil in 1930, 1970, 2005), and the size of the “balloon” represents part of the uncertainty associated with EROI estimates. Click to Enlarge.
2) Few of the energy sources put forth as alternatives to oil and gas have anything like the quality (e.g. EROI) or quantity (total resource available at a national level) necessary to in any meaningful way act as replacement fuels for oil and gas. This is especially true for liquid fuels (Table 1 and Figure 1, See also Hall et al. submitted). Greater details are given in Appendices A-G, Hall et al. (submitted) and also other work in progress. Solar, especially photovoltaics, and perhaps nuclear, do have very large potentials but their costs at this time are very high, storage is a huge problem and material costs appear to be escalating rapidly. It is unclear for nuclear whether there is enough high grade uranium ore for conventional reactors, what the possibility of thorium is, and terrorism may present some additional problems. Now designs based on e.g. thorium might offer solutions but are only on the drawing boards.
3) The EROI benchmark required for any really useful fuel for modern infrastructure has to be substantially higher than unity, 5:1 at a guess.
4) Intensification of effort is often counter productive, leading to little or no more resource but an increase in energy used to get the fuel. Thus market incentives may have a counter productive effect (e.g. figure 2).
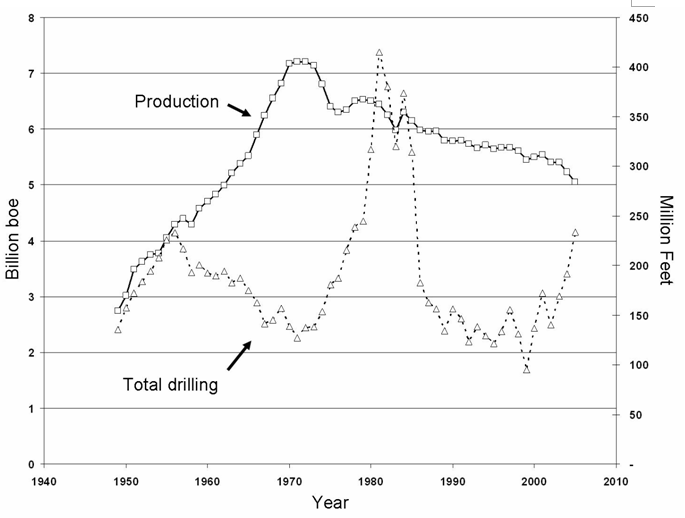
Figure 2. Annual rates of total drilling for, and production of, oil and gas in the US, 1949-2005 (R2 of the two = 0.005; source: U.S. EIA and N. D. Gagnon).
Literature cited
Bullard, C. W. and R. A. Herendeen 1975. Energy costs of goods and services. Energy policy 3: 263-278.
Bullard, C. W. , P.S. Penner and D. A. Pilati. 1978. Net energy analysis handbook for combining process and input-output analysis. Resources and Energy, 1: 267-313.
Campbell, C. and J. Laherrere. 1998. The end of cheap oil.. Scientific American March: 78-83.
Cleveland, C. 2005. Net energy obtained from extracting oil and gas in the United States. Energy 30:769-782.
Cleveland, C. J., R. Constanza, C. A. S. Hall, and R. Kaufmann. 1984. Energy and the U.S. Economy: A Biophysical Perspective. Science 225:890-897.
Deffeyes, K. J. 2005. Beyond Oil: The View from Hubbert's Peak. Hill and Wang, New York, NY.
Farrell, A. E., R. J. Plevin, B. T. Turner, A D. Jones, M. Ortare, D. M. Kammen. 2006. Ethanol can contribute to energy and environmental goals.
Science, 31 (5760): 506508.
Hall, C.A.S. 1972. Migration and metabolism in a temperate stream ecosystem. Ecology 53 (4): 585-604
Hall, C.A.S., R. Howarth, B. Moore, and C. Vorosmarty. 1978. Environmental impacts of industrial energy systems in the coastal zone. Annual Rev. of Energy 3: 395-475.
Hall, C. A. S., C. J. Cleveland, and R. Kauffmann. 1986. Energy and Resource Quality: The Ecology of the Economic Process. Wiley Interscience, NY.
Hall, C.A.S., C.J. Cleveland and R. Kaufmann. 1986. Energy and Resource Quality: The ecology of the economic process. Wiley Interscience, NY. 577 pp. (Second Edition. University Press of Colorado).
Hall, C.A.S., T. A. Volk, J. Townsend, M. Serapiglia, D. Murphy, G. Ofezu, B. Powers and A. Quaye (submitted). Energy return on investment (EROI) of current and alternative liquid fuel sources and their implications for wildlife science. Journal of Wildlife Science.
Hannon, B. 1981. Energy cost of energy. In Energy economics and the environment. Westview Press, Boulder, Co.
Odum, H.T. 1996. Environmental Accounting, emergy and decision making. John Wiley, New York
APPENDIX A.
EROI FOR GLOBAL OIL AND GAS
The EROI for oil and gas globally, and it's slope, are obviously of great concern. The problem, as usual, is in the data available: while it is straightforward to convert global oil and gas production figures (from EIA, BP and so on) into energy units, most of the cost data is in monetary units, and even that data is limited. Fortunately we have been able to work closely with personnel at John S. Herold Inc. which is a repository for financial data on “upstream” (i.e. pre sales) of oil and gas for publicly traded companies. We have derived energy intensities (i.e. energy used per dollar spent) for a number of countries and used this to convert the dollar-based Herold data into EROI estimates. The details are in a separate paper by Nate Gagnon and Charles Hall which is being prepared for submission to a journal and which is not publicly available at this time. Our preliminary estimates are that the EROI for global oil and gas has declined steadily from roughly 35:1 in 1999. Details will be available when the paper is in press, which we hope is soon.
APPENDIX B.
CRUDE AND REFINED OIL IMPORTED TO THE UNITED STATES
Palcher, Sarah, Mike C. Herweyer and Charles Hall
Definition
The Energy Information Administration defines crude oil as “a mixture of hydrocarbons that exist in liquid phase in natural underground reservoirs and remains liquid at atmospheric pressure after passing through surface separating facilities.” They define imported crude oil as “Receipts of crude oil into the 50 states and the District of Columbia from foreign countries, Puerto Rico, the Virgin Islands and other US possessions and territories.” The definition is probably increasingly inadequate because the United States imports an increasing proportion of refined oil and the total imported oil, both crude and refined, is normally what is considered. This oil can come from many parts of the world but Canada, Mexico, Venezuela, the Middle East and North and West Africa have been traditionally the major suppliers. The term “imported oil” thus refers to all oil no matter where it came from or no matter the precise form.
History
Before World War I the demand for oil was reasonably constant and few or no shortages occurred within the U.S. During World War I, however, the importance of oil for military operations and of controlling domestic oil demand came to be realized. It was the first realization that humanity was becoming dependent on oil resources, although after the war that concept was rapidly forgotten.
In the 1950s the various oil exporting countries realized that oil production could be regulated in order to regulate prices throughout the world. In 1960 OPEC (The Organization of Petroleum Exporting Countries) was formed with originally five founding members, Iran, Iraq, Kuwait, Saudi Arabia, and Venezuela. By the end of 1971 Qatar, Indonesia, Libya, United Arab Emirates, Algeria, and Nigeria had joined the organization (WTRG economics, 2006). OPEC was a very important actor in the “energy crisis” of the 1970s. Most people today view the two oil crises as one, but there were actually two separate “crises” with at least two separate causes. The first real “oil crisis” was in 1973 and was caused by the Yom Kippur War. On October 6th 1973 – on the Jewish holiday “Yom Kippur” - Egypt and Syrian troops invaded Israel following long standing altercations amongst the participants. The troops of Egypt and Syria were supported by the Arabic world, and those of Israel were supported by the US. In response to the support of Israel the OAPEC (the Arabic part of OPEC) declared an oil embargo at October 20th against the US, the Netherlands and other states helping Israel. This was the beginning of the 1973 energy crisis when the oil prices tripled. The issue was exacerbated by a main pipeline in the Middle East being ruptured by a bulldozer. The second oil crisis occurred in 1979 when the Iranian Revolution started as Iranians rebelled against the Shaw of Iran (who had been installed by US intervention some decades earlier). During this period the oil prices (corrected for inflation) rose to the highest levels ever seen in the U.S. The total increase over 7 years was a factor of ten, from $3.50 a barrel to $35.
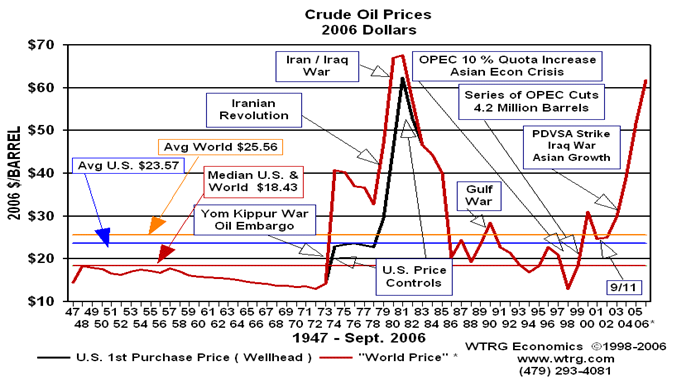
Figure 1: history of crude oil prices, in 2006 US dollars, with some main influences from political events (source: WTRG Economics). The price has increased subsequently to as much as $100 a barrel.
The US had imported small amounts of oil since the beginning of the 20th century, but after a peak in the domestic oil production in the beginning of the 70s, imports increased rapidly. The dependency on ever more expensive imported crude oil resources was a very new phenomenon for Americans and was evidenced by economic stagnation, inflation, long lines to purchase gasoline and a reduction in National confidence. But in time the US started to import less oil even though domestic production continued to decline. This was due mainly to a reduction in demand and hence price as companies and municipalities had made large investments into making plants, buildings, and equipment more energy efficient, and also the shift in electricity production from oil more towards coal and gas. Around 1986, the price of oil dropped sharply. A surplus in supply relative to demand occurred and continued until about 2000. The effects of these and other events can be seen in Figure 1. From the mid 1980s until the end of 2001 the oil supplies became more secure, the US oil demand grew steadily, but the domestic crude oil production continued to decline. In reaction the US started to again import more and more crude oil to satisfy the demand, and in 2005 about 60 percent of the US crude oil supply was imported. These oil imports cost as of 2007 was about 250 billion dollars a year, much of it paid for through debt, so that with interest the cost will in the future be larger. Figure 2 shows the historical pattern of imports of crude oil to the US.
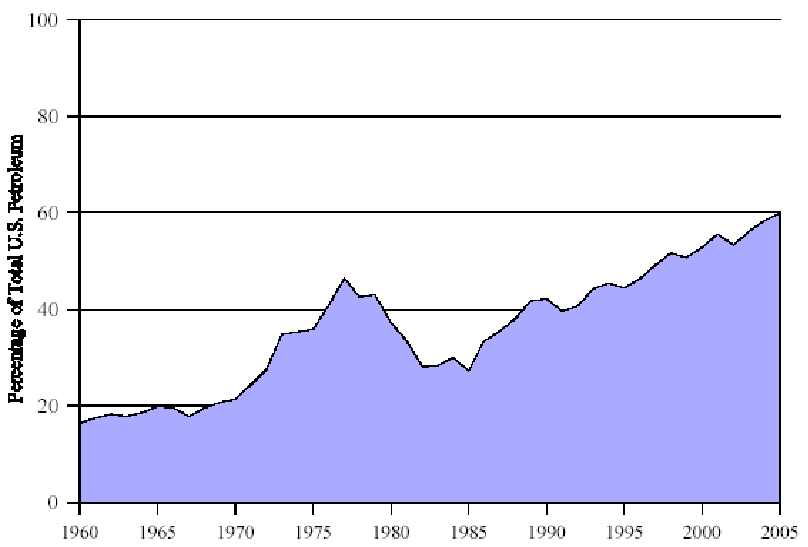
Figure 2. US dependence on imported petroleum, 1960-2005 (Source: EIA, monthly energy review, Sept 2006)
According to the EIA (The US Energy Information Agency, Annual energy review 2005)) about 52% of the total US petroleum consumption in 1950 was in the transport sector. In 2005 it was 68%. Thus today more than two thirds of the total petroleum products consumed in the US is used by the transport industry. Since there is no ready substitute for this petroleum on the scale required this is the most vulnerable aspect of the US energy situation.
Resource base
The crude oil resources which can be found outside the US are still large, although “large” depends on the definition and who is doing the analysis. The world has consumed about one trillion barrels as of 2006, which can serve as a benchmark. There are probably at least 3 to 5 trillion barrels left in the ground, but the trick is, what proportion of that can be extracted? The usual proportion that can be extracted is given as about 35 percent, but there is a huge variation depending upon the specifics of the field (Deffeyes 2005). The US Geological Survey undertook a very exhaustive survey in 2000 (USGS 2000). They gave a 95 percent confidence (i.e. very high probability of that much oil being ultimately produced) of 1.9 trillion barrels, a median (50 percent probability) value of 2.9 trillion barrels, and a high (5 percent probability) value of 4.0 trillion barrels. These numbers imply that the world has extracted and consumed from about a quarter to about one half of all of the oil it will ever extract. Much of the variability in those numbers depends upon what proportion of the oil in place can be extracted. Obviously increasing the proportion extracted usually increases the energy cost of that barrel, but it might make the reserve estimates substantially larger.
According to the Oil and Gas Journal (Dec 19th, 2005) the world’s proven reserves of oil (crude oil, natural gas liquids, condensates and non-conventional oil) amounted to 1.293 trillion barrels. About 62% of these reserves are located in the Middle East and North Africa. Figure 3 shows the top twenty countries with proven oil reserves. There are two caveats that go with this figure: the first is that there is considerable controversy about the actual size of the reserves of most OPEC nations as there was a suspiciously large jump in reserves of these nations following the 1986 agreement to allow pumpage in proportion to reserves. Thus as much as a half of the reserves of some nations might be “political” vs “geological” reserves. The second is that the majority of the reserves for Canada are “unconventional” crude oil resources (mainly oil sands). While these reserves are large their rate of exploitation is likely to be restricted by the needs for water, natural gas or environmental or social issues.
Given that the United States is the world’s largest consumer its need to import is obvious. These estimates represent values with, at least in theory, a very high probability of actually being extracted. In addition it is likely that an unknown quantity of other oil resources will be found and added to these reserves. If that number is small and Canada’s unconventional oil sands are not included then this assessment would not be too different from the USGS (2000) low value. Thus if the USGS median or high quantities of conventional oil are to be realized a great deal of additional oil must be found, which would require a large change in the finding patterns we have witnessed since about 1970.
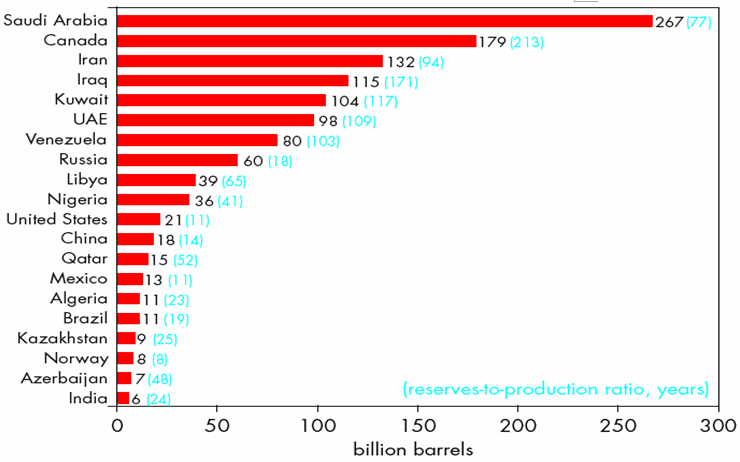
Figure 3, Top twenty countries proven oil reserves (at the end of 2005). Note that Canada includes non-conventional proven reserves. (Source: Oil and Gas Journal, December 19th, 2005). The reserves to production ratio indicates the number of years of production at present rates that would exhaust known reserves.
EROI
Methodology
The EROI of imported oil for the US (from the perspective of the US), must be calculated differently from how it is done for most other fuels. The EROI for actually getting the oil to the surface (i.e. the oil produced divided by the energy required to get it) is covered in a forthcoming publication on global oil and gas (Gagnon and Hall,Appendix A) and was roughly 35:1 and declining as of 1999. But the actual energy cost to the importing nation is not simply the energy cost of recovering the oil from the ground and shipping it across the ocean but rather is the energy that must be used to generate the goods and services that in (a net sense) must be traded for that oil, and this depends on the price of a barrel of oil relative to the prices of the goods and services exported to get foreign exchange (Hall, Cleveland and Kaufmann 1986, chapter 8, originally authored by Robert Kaufmann). This methodology can be applied only to an individual country and has little to do with the fundamental EROI of global oil and gas. In a sense the money we spend to provide our imported oil supports export nation’s government subsidies (both as dollars and the energy associated with those expenditures) to the burgeoning populations and the often opulent life-styles of their leaders. These supplier nations, of course, gain enormous financial leverage because of the US’s and the world’s increased addiction to a resource that most countries can no longer fully supply for themselves, and for which there are no, or certainly no easy, substitutes. In addition, since almost all US economic transactions are done in terms of dollars and not energy, we are forced to, again, translate economic transactions done in terms of dollars to energy values using energy intensities of economic activities. (If you are unhappy with this use of energy intensities of economic activity then you must ask the government (or someone) to keep a separate set of books based on Joules!) The EROI for an imported fuel can change dramatically as the price of oil relative to our exported goods and services increases and decreases due to economic, political, meteorological, psychological and other factors, and the cost to the U.S. recently is far above production costs (in both dollars and energy) due, I suppose, mostly to the geography of supply and demand. As imported oil gets more expensive and diverts more of the total economic activity of importing nations, then, as suggested in our first post, the discretionary money and energy available to the population becomes less. We have examined these issues in some detail for Costa Rica and other countries, where they may have an even larger impact than in e.g. the U.S.
We exclude from this analysis the interest on the debt with which we increasingly pay for oil—but that would increase the energy cost of the oil assuming the debt is eventually paid. We derive the EROI in a way similar to other EROI calculations in that we divide the energy of the delivered crude oil by the energy required to obtain it. However in this case it is the energy used in the general economy to generate enough exported goods and services to pay for that oil. More specifically, the energy delivered is determined by the energy content of one barrel of imported oil, about 6,164 MegaJoules/barrel, by the energy required to generate the dollar cost of an imported barrel, that is by multiplying the international price of a barrel of oil (i.e. in nominal dollars) by the average energy intensity of the US economy (in MJ/nominal dollar) for that specific year (equation 2). In other words to get the foreign exchange to buy one barrel of crude oil the U.S. needs to generate enough goods and services to be sold abroad to generate the necessary money to buy it. This methodology calculates the energy cost to the U.S. economy to import the energy contained in crude oil, using monetary values as a transitional stage. For an example, a farmer has to earn money to buy one gallon of gas so he has to sell some of his or her crop, much of which goes overseas. To produce the crop he has to do economic work, which is by definition an energy-intensive procedure, usually requiring oil or some other energy source. So to earn the money to buy his or her fuel he has to invest a certain amount of energy in growing and harvesting the crop. While the farmer does not pay the supplier in Mexico or Saudi Arabia directly the oil importer must, using in part that farmer’s purchases. How much energy we as a nation must invest on average to get the energy embodied in one barrel of crude oil is calculated in formula 1.
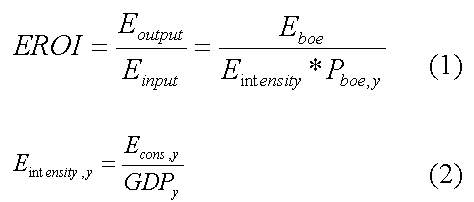
Where: Eboe = Energy content of one barrel of oil equivalent (6164 MJ/boe)
Eintensity,y = Energy intensity of the total US economy in year: (MJ/USD/y)
Pboe = Price of one barrel of oil equivalent in year: (USD/boe/y)
Econs = Total energy consumed in the US in year: (MJ/y)
GDP = Gross Domestic Product in year: (USD/y)
This study is based on Kaufmann’s (1986) analysis of EROI of imported oil. Kaufmann calculated the EROI of imported liquid petroleum by calculating the energy needed for sector-specific exports. However we could not follow the original methodology because much of the data needed is no longer collected by the US government. Thus we use the average value for the US national economy. The results of Kaufmann’s study, however, can be used to validate our results.
Results
Our estimated EROI values for crude oil imported to the US from 1968 until 2005 varies from about 45 to about 5 barrels of oil obtained per barrel invested in the general economy to make goods and services for export. These values are plotted as a time series in figure 4 along with the price of a barrel of oil in international markets. The effects of the first and second oil crisis can be seen clearly. In 1973 - after the first oil crisis started - the imported EROI for oil dropped from 26:1 to 9:1 as the price of a barrel of oil increased relative to the price of our exported goods – assuming that the goods and services we exported were as energy-intensive on average as the society in general. It cost the US society almost three times more energy (embodied in money and in the goods and services exported to pay for the oil imported) to gain the imported energy embodied in a barrel of crude oil than it cost to get domestic oil. Money lost its (energetic as well as monetary) value in terms of buying a barrel of oil. A second drop in the EROI to about 5:1 can be seen in the beginning of the 1980s. From 1986 until 2001 the price of a barrel of oil dropped and remained relatively low, while inflation had increased the dollar value of exported goods and services so that the EROI increased to as much as 55:1. But starting in about 1998 the price of oil gradually increased again (and more rapidly than the inflation of goods and services) and the EROI declined, a trend that appears to be continuing. The EROI for oil imported to the US declined during this period from 27:1 in 2001 to 15:1 in 2005. Given that as of September 2007 the price of a barrel of oil has increased to nearly $80 dollars a barrel with (thus far) a relatively small increase in general price levels (about 10 percent) we might assume that the EROI has continued to decline to perhaps 10 to 12 to one (and to much less by 2008). If the price of oil continues to increase rapidly compared to the price of exported goods and services then an increasing and very large proportion of the total output of the U.S. economy will be required to gain imported oil.
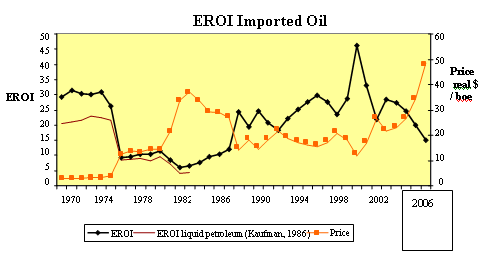
Figure 4: EROI Imported Crude Oil into the US plotted with the crude oil price from 1968 until 2005, and validated against Kaufmann’s EROI (1986) for liquid petroleum . (Data from U.S. BEA, 2007; EIA, 2007).
When the EROI is examined against the total imported crude oil, a clear trend can be seen (Figure 5). In 1973 the EROI declined, but the amount of oil imported still increased (because of the decline in domestic US production, and the slow reaction in crude oil demand). In 1979 the quantity of imported crude oil stabilized and declined until 1985, because of slowed economic growth, some efficiency improvements, conservation, and especially an increase in the use of other energy sources (coal, gas, and nuclear energy). The inflation caused by increased oil prices takes a while to work through the economy but eventually makes exported goods more expensive so that in 1986 the EROI went back up to 24:1. The EROI remained relatively constant until 2001 but began to decline again. From 1986 until 2004 the amount of crude oil imported rose steadily even as its relative price increased.
The trend from 2001 until 2005 is similar to what occurred in 1973/74. In 1973 the oil embargo happened abruptly and the US government was not well prepared. The EROI decline happened quickly and steeply. Following 2001 a less steep decline in the EROI occurred. Currently the US is faced with an increased dependence on imported oil, the same trend as in 1970s, except that now the global peak is on the horizon, so a large increase in imports might not be possible. With this knowledge we can assume that the EROI (from the perpective of the US as importer) will decline in the near future, and after a little increase in the price of crude oil imports they may decline as well.

Figure 5: EROI plotted against total energy content in imported crude oil from 1968 until 2005. (Used data: BEA, 2007; EIA, 2007)
Validation
We compared our results with Kaufmann’s (1986) analysis which we read off his graphical output (Figure 4). Kaufmann’s EROI’s tend to have a very similar pattern to ours but are somewhat lower by from about 5 to 30 percent. The lower values perhaps can be explained by the differences in research boundaries or by the possible fact that exported goods and services are more energy-intensive than is the case for the general economy. The United States used to maintain much better energy (and other) statistics. Thus Kaufmann was able to derive sector-specific energy intensities, and multiply these by the weighted value of exported goods and services. Our values are more aggregated but show very similar trends, although at about a 5-30 percent smaller energy intensity than Kaufmann’s. Thus we can say that our aggregated estimates are reasonably but not perfectly validated by an earlier more detailed study. There is little we can do to improve on this until if or when the United States decides again to again maintain more comprehensive energy statistics. In the meantime it is probably safe to say that our analyses are conservative, that is represent a high estimate of the EROI for imported oil.
Environmental impacts
The environmental and social impacts for imported oil to the US include both spillage and routine releases of transported oil (e.g. Hall et al. 1978) but also all of the general impacts associated with the entire US economy, for it is the results of that economic activity that pays for the imports.
Literature Cited
Deffeyes, Kenneth S.. 2001. Hubbert's Peak: The Impending World Oil Shortage. Princeton University Press. Princeton, N.J.
Bureau of Economic Administration, 2007
EIA (U.S. Energy Information Agency), 2007 (Accesed May 2007)
Gagnon, N. and C.A.S. Hall, Appendix A
Hall, C. A. S., R. Howarth, C. Vorosmarty and B. Moore. 1978. The environmental impact of energy use in the in the coastal zone. Annual Review of Energy 3: 395-475.
International Energy Agency, World energy outlook 2006, Paris, 2006. (www.iea.org 5-23-2007)
Energy Information Administration, 2007, definitions, sources and Explanatory notes, Website: www.eia.doe.gov , (6-29-2007)
Kaufmann, Robert. 1986. Imported Petroleum. Chapter 8 in Hall, C.A.S., C. Cleveland and R. Kaufmann. Energy and Resource Quality. Wiley Interscience, New York.
Oil and Gas Journal (Dec 19th, 2005)
US Geological Survey 2000.
WTRG Economics, 2006 (An on line oil information company).
APPENDIX C NATURAL GAS
NATURAL GAS: POTENTIAL, EROI AND SOCIAL AND ENVIRONMENTAL IMPACTS.
Sara Button, SUNY-ESF, Syracuse NY.
Bryan Sell, Department of Geology, Syracuse University
INTRODUCTION
Definition: “A mixture of hydrocarbon compounds and small quantities of various nonhydrocarbons, widely used as a fuel throughout the industrialized world; it exists in the gaseous phase or in solution with crude oil in natural underground reservoirs” (Cleveland 2006).
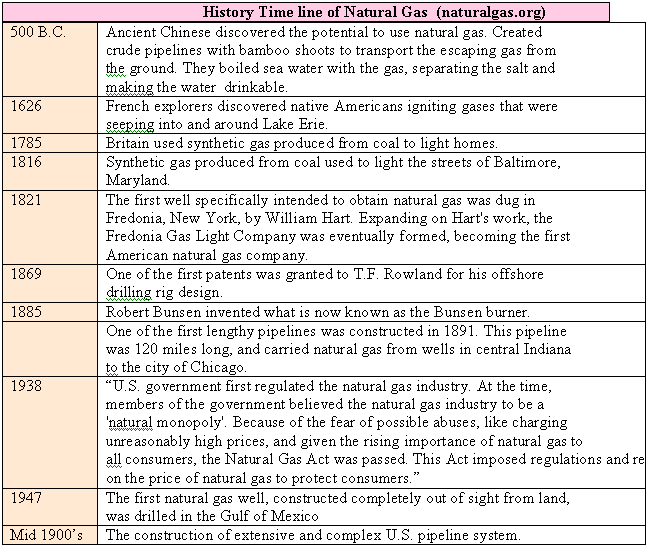
History Time line of Natural Gas (naturalgas.org)
TECHNIQUES
Natural gas is often found along with oil and hence can be found by the same geological procedures as oil is found: surface geological features (including seeps), subsurface geology (using seismic processes etc), and geophysics. As a well is drilled the substrate removed by the hollow drilling device emerges at the surface and can be analyzed for its geological, paleontological and petrochemical properties. As more and more wells have been drilled geologists have been able to construct regional maps of the underground substrate so that we have very detailed information for many oil and gas producing regions. In some regions, such as Indiana County Pennsylvania, many thousands of wells have been drilled to extract gas from relatively low yielding but very extensive fields. The spacing of wells depends on highly variable subsurface geology, although tight gas wells are more closely spaced at less than 1,000 feet. New drilling is limited by transmission pipeline availability. All sedimentary basins that have gas potential have been identified. Size and geometry of these basins are established by plate tectonic setting.
The process of drilling a gas well on land is usually more or less as follows unless the terrain is unusually difficult (such as on marshland or on permafrost). First the drilling site, chosen by seismic or other means is prepared by constructing a road, clearing the site itself (usually less than a hectare), moving drilling and gas handling machinery onto the site and then stockpiling the materials required. Once the drilling rig is assembled the drilling begins, normally using incrementally larger drill bits with the smaller cheaper holes furthest into the Earth and larger holes (usually up to 9 inches in diameter) nearer the surface. Next, casing (a kind of pipe) is inserted into the hole for it’s entire length. Once the hole and casing are finished cement is poured down the outside of the casing. At all stages the characteristics of the substrate are assessed using “wireline logging” techniques where various instruments are lowered into the bore hole. Then the portion of the pipe that is thought to be in gas-holding strata is “shot” with a series of projectiles similar to rifle bullets. The slugs go through the pipe and into the substrate, and their shock waves help to open up the substrate for some hundreds of meters. Acid is typically poured down the pipe and into the substrate to further open up the substrate. Gas then flows under its own pressure through the substrates and the holes in the pipes and to the surface, where it is collected, merged with other wells’ gas in trunk lines, separated into various fractions in holding tanks (e.g. removing brine) and shipped through pipelines to consumers. Production from mature natural gas field production tends to fall off much more rapidly than that from oil fields.
TYPES OF GAS FIELDS
In general natural gas is the end result of the “cracking” (i.e. breaking up”) of the original long chain molecules of petroleum that had once been various biological materials into shorter and shorter pieces as a result of the application of heat and pressure from the thousands of meters of sediments overlying the organic material. The type of gas depends upon how many atoms of carbon remain linked together. Methane (CH4) for one, ethane (C2H6) for two, Propane(C3H8) and butane (C4H10) are all useful gaseous forms familiar to use in routine economic activity.
Natural gas is usually divided into “conventional” (meaning from oil and gas or gas “fields” of usually limited spatial extent and specific form, vs. “unconventional” which are from more diffuse fields as indicated below). Another categorization is as “associated” (with oil—usually conventional), and “non associated” fields. The various unconventional fields include:
Coal Bed Methane (CBM) -- “An unconventional form of natural gas formed in the coalification process and found on the internal surfaces of the coal. To commercially extract the gas, its partial pressure must be reduced by removing water from the coal bed. The large quantities of water, sometimes saline produced from coal bed methane wells pose an environmental risk if not disposed of properly” (Cleveland et al. 2006)
Marginal Wells, defined as wells that produce less than 60 Mcf per day (Interstate Oil and Gas Compact Commission, 2006). Marginal currently comprise about 9% of total U.S. gas production (Sell 2007).
Tight Gas defined as “A category of unconventional natural gas that is trapped underground in extremely hard rock, or in unusually impermeable sandstone or limestone formation; tight gas requires much greater extraction efforts for acceptable rates of gas flow” (Cleveland et al. 2006).
Off Shore defined as “A general turn for oil and gas industry operations taking place along a coastline (e.g., in Louisiana) or in open ocean water (e.g., the North Sea field). Thus, offshore drilling, offshore lease, and so on” (Cleveland et al 2006).
Methane Hydrate defined as “the most recent form of unconventional natural gas to be discovered and researched. These interesting formations are made up of a lattice of frozen water, which forms a sort of 'cage' around molecules of methane. These hydrates look like melting snow and were first discovered in permafrost regions of the Arctic” (NaturalGas.org 2004).
RESOURCE BASE
Overview: The current official reserves for the United States for 2005 are 608 trillion cubic feet, compared to use of about 24 trillion cubic feet a year. Thus current reserves would last some 24 years as the simple quotient of the two, although this neglects the probably more important issue that the gas appears to have peaked in 1973 and then secondarily in 2001, that the current production appears to be falling, and that many or most major conventional fields appear to be approaching depletion. Thus it is becoming an issue of flow rate versus reserves. Production has shifted increasingly from large fields in Louisiana, the traditionally largest producer state, to often unconventional fields in the Rocky Mountain States. If one examines the rate at which gas has been found (shifted forward for 23 years) vs. produced for conventional gas there is a very close overlap and a strong indication that production , at least for conventional gas, is likely to take a strong downward course in the near future (Figure 1). Unconventional production has been flat for a decade at about one quarter the rate of conventional gas, but has recently started to increase. Some observers believe that U.S. and North American production is likely to decline sharply in the near future (i.e. Darley 2000). Natural gas is abundant, for the time being, in Russia, Qatar, Iran and some other places, but it very difficult to ship overseas. One solution to that is LNG, the liquefying of the gas (requiring roughly 10 percent of the energy liquefied) and shipping it overseas in a special “LNG” tanker. Port facilities for this in the U.S. are expensive and rare, but could be increased.
More specifically the reserves or resources of natural gas are very uncertain and depend upon the quality of the resource one might want to exploit and our ability to mobilize technology to exploit currently unexploitable resources. According to the EIA (2005) the “Technically Recoverable Natural Gas Resource Estimates for the U.S. in 2004 (EIA2, 2005) include:
Undiscovered Conventional Reservoired Fields 682 Trillion Cubic Feet
Discovered Conventionally Reservoired Fields 390 Trillion Cubic Feet
Total Conventional Reservoired Fields 1,072 Trillion Cubic Feet
Undiscovered Unconventionally Reservoired Fields 359 Trillion Cubic Feet
IMPORTED GAS
Currently the U.S. cannot meet all of its gas demand with domestic production and hence imports about 18 percent of its gas from Canada, although there are arguments that this gas will be needed to develop the Alberta tar sands. If additional gas is to be imported it will have to be done so using LNG technology, where the gas is liquefied and sent long distances in specially-designed ships. Major conventional gas resources are found in Russia, Iran and Qatar. The dollar costs for this fuel depend upon volatile international pricing and may follow oil prices. In 2006 high gas prices drove many gas-intensive U.S. manufacturing firms overseas or to close shop. The energy cost to the US depends upon the relative prices of gas and what we export as we have discussed for oil.
EROI
The problem: There appears to be little or no information that would allow us to derive the EROI from explicit national- or regional-level data about the gas industry because 1) oil and gas data, when available, tend to be combined and 2) the data maintained at the Federal level on energy costs of various industries appears less reliable than in the past. Therefore we can either give up or start “from the bottom up” to derive EROI for specific plays/regions, which is what we have chosen to do. Therefore we must make the following disclaimer: “There is no readily available literature either on, or by which, one might derive the Energy Return on Investment (EROI) of Natural Gas. Published summaries of natural gas reservoir studies and general overviews of drilling practices are sparse. Even with such a broad study, it would be difficult to assess natural gas production generally because each kind of operation is very field- specific".
However we undertook an analysis with Bryan Sell, a geology graduate student of Syracuse University who had previously worked for three years as a field driller, to calculate the EROI of a random sample of 100 wells in Indiana County, Pennsylvania. Due to the maturity of this field it may be representative of many gas operations in the U.S. This county was chosen because it is made up of a mature dry gas field composed of marginal wells (< 60 Mcf/day) and the necessary data was fairly easily accessible because of Brian’s contacts. With the completion of this specific EROI analysis a general research protocol is established that could be applied elsewhere. Most data was obtained from Pennsylvania state completion reports and electronic data of the Pennsylvania Department of Conservation and Natural Resources. Fuel consumption data was obtained from surveying industry contacts. This study explores the minimum requirements for natural gas drilling and establish a baseline for natural gas EROI studies. We used wells in Indiana County because they are relatively simple, but the drilling practices are very similar to other producing fields in the onshore United States. We extended the results by applying the energy consumption per foot of drilling in Indiana County to EIA data for national-level drilling and production data, to generate a crude estimate of the EROI of the United States (Figure 1).
We calculated the EROI for conventional dry gas wells in Indiana County, Pennsylvania. This started by assessing the amount of energy needed to drill and complete a well, which was adjusted to the energy cost per foot (about 0.35 GJ per foot, including secondary operations such as cementing). For our methods we calculated the direct energy (diesel fuel) that is principally used by the machinery drilling the wells and the indirect energy is for the materials (steel, cement, sand, water) consumed in drilling the wells. Acids and other chemicals are not yet included. Energy for cement production was obtained from Worrell and Galitsky, 2004, steel from Worrell et al. 1999, and sand from Department of Energy Report 2002. The largest indirect energy cost (approximately 60%) of drilling is from steel, principally used in the cladding.
We also calculated the indirect energy includes the energy used to produce the materials consumed (e.g.cement) during the plugging and abandonment of wells, and the energy used to generate dry holes, which have gone from 80 percent to about 50 percent of all wells, therefore the actual EROI is about one fifth to one half as much as for one successful well when they are included in the analysis. Pipelines contribute a minor energy cost and are assumed to be negligible. Operational energy costs are not yet included. The EROI value of marginal gas fields in Indiana County would decrease with a more inclusive analysis that included e.g. the energy cost of pipelines, acid, field vehicles and so on.
PRELIMINARY RESULTS
The EROI for a producing well was calculated to be about 29:1 in the early 2000’s, or somewhat less than half that if the cost of dry holes are figured in. Coalbed methane wells were calculated similarly to be 15:1. Thus as of 2005 the EROI for gas fields in the U.S. is an estimate 10:1.

Figure 1. EROI time series for Indiana County, Pennsylvania, plotted against a production curve for the U.S. (Sell 2007).
ENVIRONMENTAL IMPACTS
The environmental impacts from burning natural gas are relatively low compared to oil and especially coal because the gas is essentially pure methane with relatively few impurities. It’s CO2 emissions are about half that of coal and about two thirds that of oil. Carbon Dioxide Emissions in U.S. from Natural Gas in 2005 (DOE 2006) was 261.7 Million Metric Tons of CO2 from residential sources and 166.3 Million Metric Tons of CO2 from industrial sources. There are virtually no emissions from sulfur dioxide and there were 80% less emissions of nitrogen oxides than from the combustion of coal. The water produced as a by-product of Coal Bed Methane (Keith et al. 2003) can be a problem when discharged or impounded as it impacts salt sensitive plants (including agricultural plants) and animals. Although discharging this water (or brine) is not allowed for new wells, it still occurs through past “grandfathered” systems. The drilling technique called “hydraulic fracturing,” is a potential polluter of underground drinking water is exempt from the Safe Drinking Water Act. These pollutions occur in part because natural gas companies are exempt from the Federal Water Pollution Control Act for their construction activities surrounding gas drilling. The density of wells in many gas producing regions of Eastern and Western United States has interrupted once-continuous ecosystems and destroyed any sense of wilderness in these areas.
SOCIAL IMPLICATIONS
• Land Rights
o Companies can buy mineral rights to coal found under private lands. With the mineral rights to the coal they are legally allowed to drill coal bed methane wells on private property (Hopey 2007). However, overall the area taken up by a gas operation, while destroying the continuous nature of the environment, is not a large proportion of even intensely developed regions and hence in most cases interferes little with agriculture and forestry. It does interfere with the “wilderness” sense of the region.
ECONOMICS
• The U.S. may have reached a peak or plateau in natural gas production. “Production decreased by 2.7 percent in 2005, declining below the 2000 level, and reaching the lowest production level since 1993” (EIA 2006). “The number of producing gas wells has increased each year since 2000, rising from almost 342,000 wells in 2000 to more than 405,000 wells in 2004. However, production has not increased proportionally” (EIA1 2006). Thus it has not been possible to increase production simply by drilling more. This is the case despite the subsidies $1.035 billion and regulatory rollbacks in the energy bill of 2005 (Public Citizen 2005):
Annotated Bibliography
:
Cleveland, Cutler J. Energy Encyclopedia. Elsevier Science, 2004.
Cleveland, Cutler J. and Christopher Morris. Dictionary of Energy. Oxford: Elsevier, 2006. pg. 82, 292, 308, 450.
Darley, Julian. 2004. High noon for natural gas.: The New Energy Crisis. Chelsea Green Publishing.
Cutler J. Cleveland, Jr. and Robert Costanza. 1984. Net energy analysis of geopressured gas resources in the U.S. Gulf Coast Region Energy 9: 35-51.
Energy and Environmental Profile of the U.S. Mining Industry. Prepared by BCS, Incorporated for the U.S. Department of Energy, Office of Energy Efficiency and Renewable Energy, 2002. Chapter 9, Limestone and Crushed Rock, pages 9-1 through 9-12
Mark Gately 2007. The EROI of U.S. offshore energy extraction: A net energy analysis of the Gulf of Mexico Ecological Economics 63: 355-364
Hopey, Don. Why gas bonanza is no boon to landowners. Pittsburgh Post-Gazette. 29 April 2007.
Keith, Kristin and Jim Bauder. Frequently Asked Questions Coal Bed Methane (CBM). Montana State University-Bozeman. 2003.
Interstate Oil and Gas Compact Commission. Marginal Wells: Fuel for Economic Growth. 2006. http://www.iogcc.state.ok.us/PDFS/2006-Full-Marginal-Well-Report.pdf
Naturalgas.org. Unconventional Natural Gas Resources. 2004. http://www.naturalgas.org/overview/unconvent_ng_resource.asp
Public Citizen. Public Citizen’s Analysis of the Domenici-Barton Energy Policy Act of 2005.
Sell, Bryan. Natural Gas. Personal Communication. June 2007.
Swindell, S. Gary. Texas production data show rapid gas depletion. Oil and Gas Journal. 21 June 1999.
United States. Department of Energy (DOE). Energy-Related Carbon Dioxide Emissions from the Residential and Commercial Sectors, by Fuel Type, 1949-2005. 20 Nov. 2006.
United States. Energy Information Administration (EIA). Residential Natural Gas Prices:
What Consumers Should Know. Nov. 2006.
United States. Energy Information Administration (EIA). Annual Energy Review. 2005.
Worrell, Ernst and Christina Galitsky. Energy Efficiency Improvement Opportunities for Cement Making: An ENERGY STAR Guide for Energy and Plant Managers. Lawrence Berkeley National Laboratory, 2004. LBNL-54036.
Worrell, Ernst, Nathan Martin, and Lynn Price. Energy Efficiency and Carbon Dioxide
Emissions Reduction Opportunities in the U.S. Iron and Steel Sector. Ernest Orlando Lawrence Berkeley National Laboratory, 1999. LBNL-41724.
**Acknowledgements: I thank the Santa Barbara Family Foundation, the Interfaith Center on Corporate Responsibility, The Tamarind Foundation, Boston Common Asset Management, and ASPO USA for financial support for this research.
Previous guest posts from Professor Hall on theoildrum.com:
At $100 Oil, What Can the Scientist Say to the Investor?
Why EROI Matters
EROI Post -A Response from Charlie Hall
Additional theoildrum.com articles related to net energy analysis and EROI:
An EROEI Review
North American Natural Gas Production and EROI Decline
The Energy Return on Time
Peak Oil - Why Smart Folks Disagree - Part II
Ten Fundamental Truths about Net Energy
The North American Red Queen - Our Natural Gas Treadmill
Energy From Wind - A Discussion of the EROI Research
A Net Energy Parable - Why is EROI Important?
EROI on the Web part 2 of 6, (Provisional Results Summary, Imported Oil, Natural Gas)
PDF version
135 comments
EROI on the Web part 2 of 6, (Provisional Results Summary, Imported Oil, Natural Gas)
PDF version
135 comments
Contact
- Content: editors at theoildrum dot com
- Tech support: support at theoildrum dot com
License

This work is licensed under a Creative Commons Attribution-Share Alike 3.0 United States License.
Is there a PDF available of this posting?
EDIT: Never mind. I just printed the posting (23 pages) and it came out very well.
Thank-you very, very much, Professor Hall (and Nate). Looks like some great reading as my hound drags me around on our mid-day outing.
Prof. Hall-
Thank you for tackling this very important topic! There is one aspect of the EROEI debate that I would like to raise--I don't know if you plan to address it, or if you are even aware of a methodology for addressing it, but I think it is very important. That is what I call "bootstrap-EROEI" (if there's a more accepted term, please let me know).
By "bootstrap-EROEI," I am refering to the distortion in existing EROEI calculations created by the fact that the infrastructure used to produce energy today was built at some point in the past using a higher-EROEI energy for its creation. For example, coal being mined today may use equipment assembled from machine parts that were transported and manufactured using 40:1 EROEI oil from 1998, whereas to replace that same machinery today would use oil with today's average EROEI of about 20:1. This seems to distort the EROEI calculation of coal (in this example), and would apply to all the renewables that effectively transform some "primary energy source" such as coal, oil, or natural gas into a source for renewable energy production. As another example, consider the energy required to mine ore, smelt metals, transport metals, etc. for wind turbines.
My question is whether you have A) a methodology to estimate EROEI after this distortion is eliminated, B) the shape and length of the time-lag curve, and/or C) a reason why this distortion either doesn't exist or isn't significant.
It seems that, especially when looking to a wide-boundary EROEI analysis where direct and indirect energy are accounted for, this distortion would be very significant. Present economic activity is largely dependent on the *past* expenditure of energy, whether that's the ore, refining, and manufacturing of raw materials into capital goods, the construction of our transportation infrastructure, etc.
Jeff,
Your comments and questions lead me to posit something I call "energy banking." Here is a hypothetical example: Suppose PV currently has an EROEI of 1:1 and has a 50 useful lifespan. In other words, the PV output over its lifetime will equal the input energy from when it is first put into service. It is likely that the EROEI of the materials used to build the system will drop over the years. Therefore, the EROEI of the PV system will increase with passing time and provide "interest" on the initially invested energy.
I'm beginning to feel that maybe we should discount EROEI to some extent for sustainable energy systems with long lifetimes.
Todd
I agree. There is a difference between fixed and marginal EROI and also the timing of the flows. For wind power, high EROI would tend to favor the PURCHASERS of the wind, because it has a long duration, for biofuels, any positive EROI (we know its not high) will go to the seller, especially dueto subsidies, because the payback is on a much shorter time frame, etc. As energy prices go up, those who have invested in long duration renewable flows will be better off. In any case, my opinion is EROI is the second step. It will be best used only after we figure out sustainable scale. Ends before means.
Todd-
I think that applying banking and finance principles to energy accounting is a good idea--provided that EROEI in general is sufficiently greater than 1. As oil, coal, natural gas, etc. begin to decline in EROEI, the comparative return on existing renewable (wind, PV, etc.) infrastructure will improve. My concern (as I wrote about here) is that a certain amount of surplus energy is needed to build-out a renewable energy infrastructure. Energy for PV and wind, for example, must be expended up front before any energy is returned (same true of oil & gas, but to a different extent). I think that it takes a huge (and unacceptable) leap of faith to assume that, after we've burned off the high-EROEI fossil fuel, there will be either A) sufficient energy to build out a fully renewable energy infrastructure with lower-EROEI fossil or renewable sources, or B) that the actual EROEI of renewables like PV and wind, after accounting for the energy required to produce their full supporting infrastructure, will actually be greater than 1.
Declining production and EROEI of "primary energy sources" like coal, oil, and gas, will decrease the amount of surplus energy available to build out new renewables while simultaneously maintaining the energy required by the existing economy. Will this surplus be large enough to build out enough renewable generation capacity to make up for declines in fossil fuels, once they set in? I just don't think we have enough information, or a sufficient methodology, to answer this question at the moment. But, ultimately, I think it is the question that all EROEI analysis leads to...
Nate or Dr. Hall can correct me here, but I think this issue is where the power of Input-Output table analysis would come in. As the energy required to mine for coal increased, that would show up as increasing energy intensity in that sector of the economy. Other sectors that used coal would likewise see a boost in energy intensity per $ of steel and other sectors.
The question in my mind (you may be saying this as well, not sure) is predicting how large the repercussions will be in the future. I think we have adequate (?) theory to account for a present increase in the energy input in a given sector, but no theory to help us understand to what degree present increases in the one part of the IO table will impact another part of the table, and how long the time-lag will be. By way of example, think of our highway infrastructure, which was constructed largely on oil and coal energy that has experienced significant EROEI declines over recent years. We can't just input the new intensity of coal and oil because that highway infrastructure will last for many years--how, and over what period do we amortize the energy for that replacement? It seems workable if all we had to do was amortize over a known replacement period for the infrastructure, but because we're trying to continually incorporate a moving target (the EROEI of oil & coal) that is moving in an unknown way in the future, I don't know how to proceed...
See the response to my post below.
http://www.theoildrum.com/node/3810#comment-328100
I don't know if my numbers are right or not. But using my weird methods I also came up with 5:1 as probably the real lower bound EROI. This is mentioned in the key post.
Also in my post I think our current EROI is actually 10:1 not 20:1 my justification is simple. We where at 20:1 about 2002 and prices have increased five fold so that suggests a real EROI of 20/4 == 5:1 right now. Taking into account growth etc 10:1 makes more sense as a high estimate.
If you somewhat agree with that argument then EROI has dropped by 50% in five years with steady oil production. It makes sense that real EROI will probably drop faster once production begins to decline so instead of being at 5:1 if we are not there now in five years we probably will be less.
Of course we are not going to make the massive investments needed to keep net energy levels up so the net energy levels should be and probably are already dropping probably in line with the EROI drop. This would mean that say if EROI goes from 10:1 to 5:1 and absolute production drops by 50% then net return would be say 25% or a 75% drop.
My gut feeling has always been that if we where going to make a smooth transition from oil to alternative energy we would have had to start in the 1970's. Even if my numbers are off I don't think they are off by orders of magnitude. So I simply don't think its possible to make a smooth transition.
Considering we need to invest a significant amount of excess energy into alternatives to speed the transition say 10-25% of todays excess. You can see that when we reach the point of having only 25% of todays excess energy the rate we could make the change drops dramatically. Also of course as current energy extraction process begin to take up more and more of our economic activity they are in direct competition with alternatives. Both are chasing the same shrinking pie. I'd hazard that current approaches would generally win.
Now I'm not saying we can't make such a transition just that from what I can tell it would already be extremely painful if we made it a top priority right now and it becomes increasingly more painful as we wait. And probably worse it seems the time it takes to deploy the amount of alternatives to bring us back to our current free energy levels quickly stretches out to centuries as the ability to expand alternative energy sources contracts to a small percentage of a lot lower net energy level.
Finally as far as our current infrastructure goes very little of it is terribly useful for building out alternatives. Roads and oil based transport are not all that useful over the longer term. Rail would be but in many places it would itself need to be built out. The highway infrastructure in the US is actually in horrible shape and close to collapse and our secondary roads basically need to be rebuilt completely every 10-20 years. We have been abusing this oil investment for a very long time. Given the huge amount of deferred maintenance in roads at best they offer no total support at worst they are and additional place we must invest to simply get our rail expanded. Cars/Trucks etc also have limited lifespans generally less than 20 years again its dubious how much of this can be treated as a stable investment and how much of it would be lost in even 20 years.
Overall after all the money we have spent in my opinion our current infrastructure is only useful for about 20 years of support for investment into alternatives at best. After that we have to have new rail infrastructure in plain to continue development.
In any case pain or not we need to start transitioning off oil yesterday. If we wait to long considering the way EROI seems to work only a tiny fraction of todays population will be able to create high tech sustainable lifestyles and the rate they can expand will be painfully slow.
I happen to think we will end up with these islands of technology in a sea of misery but I'm not the most optimistic guy on the planet.
Ok, now I see what you are doing. The energy needed to refine silicon (say) does not change. But the energy to create the energy to refine the silicon goes up. And this should work for all materials.
What is the damage to society from this change? Hmmm. First pass, I would try to bound the problem to see how much trouble it could cause. So take an extreme example and push the drop from 100:1 to 10:1.
So suppose I have a 100:1 energy source powering my society. I calculate the EROI of some alternative source and it comes out 10:1 (Estimate A). My wonderful power source now declines to 10:1. What will the EROI of my alternative power source decline to? (Estimate B).
Here is my approximation. I am going to change the coding slightly to make it clearer (I would appreciate others to check the math). Society starts with a 100:1 power source that declines to 100:10 (recoded 10:1).
We want to know the impact on another EROI calculation that also has a 100:10 ratio. Ok. Estimate A would include a tiny 1% hidden cost that is the energy cost to get the power which = 10*0.01= .1 units energy. For Estimate B that would increase by 10 times. 10*0.1 = 1
So for Estimate B our alternative energy source would really end up being 100:11. That is not much change. But dropping below 10 would start to get painful. It should be possible to calculate directly this way, and put in a corrective factor. Anyone have a different view?
I wonder if this isn't addressed better as a time component of Net Energy. We need a "velocity" of energy as it moves through our economy. Energy that has become embedded in long life items is still flowing through the economy, just slower than fuels. An Embodied Net Energy concept.
Jeff,
I read your current post on your site (I disagree about the recession part) and it sounds like we sort of agree. We do have surplus energy now. As a surrogate, I would point to where it takes 10cal of input energy for 1cal of output/body energy.
Retuning to my "banking" of energy: I am unaware of any part of society that cares about EROEI. I was a process development and plant manager in the chemical industry and we didn't care about energy use as long as the cost could be passed on to other manufacturers using our products. My group developed several innovative ways to reduce reaction times...in one case from 1 1/2 hours to 45 minute and another from 30+ hours to 8 hours. The irony is that I, as the chief honcho, seemed to be the only one who could do this stuff. I want to put this in context - I was never a chemical reactor operator, heck I started as a research chemist and moved into chem engineering. I would go out to my facility or the production plant in my coat and tie (naturally with hard hat and safety goggles), tell them to keep dumping in catalyst until the pressure began to surge, tell them to put on full cooling and go back to my office. Did anything come of this? Nope. I was the only person out of several hundred employees who could do it. And, I'm not kidding here - production turned it all down cold because "it took too much attention."
My point is that, today, energy only matters in a financial/profit context. There is lots of "surplus" energy that can be captured. And, I return to arguing that it makes more sense to invest this energy/money in energy that has a currently slightly negative or break even EROEI but is sustainable in the long term - with an ultimate positive return.
Todd
Todd
Alan and I talked about something along these lines a long time ago. Basically, if the oil was going to be used up anyway (Jevons's paradox) then how can we use it in a way that pays back for centuries?
I said road beds (Roman road beds have been in use "forever") and he said rail tunnels. Rail tunnels are expensive to cut, but then the trains don't have to climb or divert so they pay back handsomely.
EROEI over time is a great point. Which leads me to another thing I noticed in the article:
The EROEI numbers for CSP are ancient -- 1986??? Can't you find newer numbers? In 1986 CSP plants were fairly new and EROEI over time has been on the increase for CSP, thermal and solar towers.
I'm looking for more recent CSP numbers but I found the numbers on the ASPO site to be, in some cases, more favorable for renewables than the ones posted in the above.
Hydropower 11.2 (33.6)
Nuclear (light-water reactor) 4.0 (12.0)
Solar
Power satellite 2.0 (6.0)
Power tower 4.2 (12.6)
Photovoltaics 1.7 (5.1) to 10.0 (30.0)
Photovoltaics Thin-Film 7 (21) to 40 (120)
Solar Thermal to find
Wind 80 (240)
Geothermal
Liquid dominated 4.0 (12.0)
Hot dry rock 1.9 (5.7) to 13.0 (39.0)
Table Notes: Estimates of energy return on investment (EROI) ratios for some existing and proposed fuel supply technologies. Numbers in parentheses for electricity generation include a quality factor based on a heat rate of 2,646 kcal/kWh (10,493 BTUs/kWh) (source: http://energycrisis.com/aspo-usa/2005/).
A solar tower is a kind of CSP and here it is listed as a 4.2 EROI. It also adds a break out for thin film photovoltaics which the original post has failed to mention.
One thing I did find is that the energy payback time for CSP is 5 months to one year depending on the system:
"The energy balance is outstanding: the payback period for the energy expended in production of the components is 5 months. The materials used (concrete, steel, glass) can be recycled. The specific land use is quite low at 2 hectacres per MWel. The property needed has a very low value. There is no social or ecological problems associated with its use. There are no hidden social costs in the form of environmental pollution, additional social services, or resulting economic effects. Solar thermal plants use materials that are available and affordable worldwide. For the most part they can be constructed and operated by local labor."
http://www.schott.com/solar/english/download/schott_memorandum_e.pdf
If the energy payback time is five months then to state that the EROEI on a system that will last 25 to 50 years is 1.8:1 is ludicrous.
If you want to be taken seriously, you need to take a hard look at your data and determine if it's telling the truth as it stands today and is an accurate representation of FACTS or if it's simply a long chain of inaccurate, outdated, and issue-slanted statistics.
Surely that's exactly why the draft is posted here?
Well my refinement would be to:
1. Get more recent numbers on Concentrated Solar Power from a variety of sources. You can start with the solar towers subset from ASPO USA (1985) and then do an EROEI calculation by collecting industry figures for other concentrated sources. Some plants have been in operation now for years and you should be able to go to the industry to get good data points.
2. Break out Photovoltaic and Thin film EROEI figures.
3. Look at nuclear from within the US RE regulatory issues and outside the US. I'd be very interested to see what kind of numbers you'd get in France, for example, which seems very successful in nuclear at the moment.
When I saw these old numbers I had to laugh. EROEI for a renewable infrastructure in place will scale upward over time even with the added cost of maintenance etc.
Here's another EROEI list I found that seems to scale with the ASPO data and supports a CSP (solar tower) EROEI estimate of approx 4:1.
http://www.eroei.com/eroei/evaluations/net-energy-list/
Also, I found a study by Lorin Vant-Hunt, professor of physics at the University of Houston, that referenced the EROEI for a concentrated solar power system to be 27:1 over 30 years for the system:
http://www.ases.org/divisions/electric/SED_April06_nwsltr.pdf
The newsletter cites a study in 1991 that did a comprehensive EROEI study of a solar tower or heliostat with molten salt storage on site. The researcher also noted that though she had not performed a study on trough or Sterling CSP systems she thought EROEI numbers would be similar to the ones she found for the heliostat.
The primary reference for the work is an article: "Solar Thermal Electricity: an Environmentally Benign and Viable Alternative" pp 157-166 published 1992-1993.
In all, I think this represents a more rational current range with conservative estimates for CSP at around 4:1 and optimistic estimates up to 27 or more. Lorin Vant-Hunt noted 40+ EROEIs when materials used in the heliostats were recycled.
Brad F noted that there are some miscalculations (or typos) in the table. The number without salt storage should be 34 not 44.
These values for silicon PV should be useful:
http://www.nrel.gov/pv/thin_film/docs/lce2006.pdf
Chris
I did a quick analysis of the Nevada Solar One project using googled data.
Cost $266 million.
125e6 Kwh per year (23% capacity factor).
Lifetime 40 years (length of land lease).
I used 13Mj per $ number from article above. (the whole thing is glass and stainless steel + turbines)
5.21 EROI
Operating expenses (repair, cleaning, staff) were not factored in.
Actually, looking at the tables from 1975, it looks like glass and stainless are even more energy intensive per $ than turbines. Ok. If I use glass and steel Mj/$ then we get back down to 3.4 EROI. I think that is going to be too low because the whole plant cost will include less energy intensive items. A wider boundary analysis gives the lower bound on EROI.
Sigh. No wonder they keep building coal plants.
Well, this may point to an issue with applying MJ/$ to technology that is still scaling. What level of reinvestment is being put towards growth? How are early development costs being apportioned? What is the expected cost at the anticipated optimum scale (200 MWe)? Once the cost settles then the figure you used might be usefully applied.
Bottom up may have some advantages when assessing developing technologies, but here are some cost figures for 100 and 200 MWe plants: http://www.renewablesg.org/docs/Web/AppendixE.pdf
And here is a report on an LCA for a parabolic system that comes out to EROEI~25: http://www.latermotecnica.net/pdf_riv/200702/20070215003_1.pdf
This is in italian but the same authors have IEEE publications on this subject.
Chris
I agree that later production models will have higher EROI. One off designs with custom made parts imported from around the world are going to be expensive. But I see this as setting the lower bound. And it gives those doing the bottom up analysis a rough target to shoot towards to make sure they are including everything. The one with a value of 34 left out labor & construction cost. It is very easy to leave things out of a bottom up analysis.
Finally, the 5:1 answer makes some sense in that CSP is still delivering power at higher cost than nuclear. (And you are putting nuclear at 7?) So that would be roughly correct.
I think CSP is going to take off. The newer designs are all about getting costs down and efficiency up.
I'm not so sure that the EROEI has to change to get the cost to come down. Or perhaps it would be better to say that the cost of the manufacturing plant is front ended too much to make a dollar to energy conversion useful? The learning curve effect would be a separate thing I think. Still, $0.11/kwh now is pretty similar to $0.03/kwh from a plant whose financing was set 45 years ago.
Chris
Hi Chris,
Thanks for that link to the Appendix E Solar Thermal. There were quite a few useful bits of data and I did an EROI for the last two SEGS plants at Kramer Junction.
I ended up with an EROI of 9.3 for costs as they stand today. That includes all construction costs as well as operations and maintenance. It turns out that more energy is spent in maintaining the plants than was required to build them. They have a program underway to drop the O&M cost from $25/Mwh down to $10/Mwh. If that program is successful, then the EROI will increase to 14. This assumes a 40 year plant life. If the life is shorter, then the number drops substantially.
All and all that is a pretty good number considering the output is electrical power. And it has very few environmental side effects (except water use).
As far as the Nukes value goes, I was thinking of the MIT study (now several years old) that put new nuke $0.08/Kwh. It would be higher now of course (inflation, rise in steel & concrete).
If you want the spreadsheet, send me an email.
I started a thread here: http://europe.theoildrum.com/node/3795#comment-327648
that seems to indicate that estimated costs are going up faster than inflation but the only price for nuclear power I'm really interested in (outside of energy analysis) is the price without the Price Anderson subsidy and with the full cost of waste disposal and decommisioning, which is unknown. The UK estimate of $12,000/kW for decommissioning is interesting.
The other price I'm interested in is the price of carbon dioxide to make the scenario in fig. 6 of this preprint happen:
http://www.columbia.edu/~jeh1/2008/TargetCO2_20080317.pdf
My guess is that it is impoverishing and we'd need to ration instead but maybe I'm too influenced by the inelasticity of gasoline.
Thanks for the offer though.
Chris
Hi Robert. I appreciate your frustration with studies being 20 years out of date. Lucky for you, you don't have to sit on the sidelines. Dr. Hall has published enough information that you can jump in and do the heavy lifting yourself.
Here is how I would start: Find the total construction cost (materials, labor, everything) for a CSP power plant. Then convert those $ into $(2005) then use the Mj/$ value in the article to convert that into energy. Then calculate the energy output of the plant (factoring in true capacity factors etc). With that data you should be able to get a value for EROI.
I have not read the schott memorandum, but bottom up studies tend to over estimate the EROI because anything left out causes the EROI to go up. The sloppier the math, the better (sounding) the result! So I would dig into that analysis in more detail. What was included in "energy expended in production of the components"?
Dr. Hall did a calculation for a Coal Power plant that you might enjoy reading:
Hall, 1979, "Efficiency of Energy Delivery Systems: 1 An Economic and Energy Analysis", Environmental Management, Vol3, No 6, pp 493-504 (make sure you get parts 2, 3 also).
Jeff,
I think your bootstrap concept is a critical aspect of all of this. And I think it applies widely to the structure of our society. Air travel, suburbia, interstates, server farms, Nascar, night baseball, 1500 mile Ceasar salads - well, you name it - have all been developed during a period of tremendous energy surplus. Others have noted how maintenance of our infrastructure, roads, utility lines, etc., has been deferred. It will only become more difficult moving forward to do that maintenance, as our energy surplus shrinks, let alone build new infrastructure, as you point out. Banking has been brought up. Here's a banking analogy I'm developing. We built our societal infrastructure and exhorbitant lifestyles on an energy return of 10,000% or better. (A return of 100 from an input of 1). Those days are over. We're presently running (or trying to) said society on an energy return of about 1,000% (10:1 EROEI roughly speaking). Now that sounds pretty good, but it's an order of magnitude lower than what we started with. We're also starting to use, and have plans to expand, energy sources that provide a return of more like 100% - all those that are in the low single digit to 1 EROEI. That's another order of magnitude lower. I've submitted an article to Nate discussing this. Essentially, I believe we're looking at the same concept from slightly different perspectives, but the net result (NPI) is that our window of opportunity to, as you put it, bootstrap ourselves away from reliance on FF's is rapidly closing.
Nate,
One resource which would help all others trying to calculate new EROI values would be access to the “Leontief I-O” for what ever years the tables are available. That is, if the tables happen to exist in some on line form. (The techniques to calculate the tables are described in the literature, but I have not been able to find the tables themselves.)
Good overview, with interesting backup material.
Another reference for CSP EROI can be A Low-Carbon Energy Strategy for the 21st Century by Rhone Resch and Noah Kaye, UN Chronicle.
In terms of alternative measures, GDP can be a misleading indicator. Other indicators to use could be Genuine Progress Indicator (GPI) (GPI attempts to address many of the above criticisms by taking the same raw information supplied for GDP and then adjusts for income distribution, adds for the value of household and volunteer work, and subtracts for crime and pollution) or the UN's Human Development Index (HDI) (HDI uses GDP as a part of its calculation and then factors in indicators of life expectancy and education levels).
I was a bit puzzled that the US natgas EROI w/o drywell trendline seemed less effected by the 2000 EROI drop than trendline with drywells. Does this mean that fewer drywells are being drilled?
Very interesting, I am in the process of digesting the material, and will hopefully have time to comment later.
In Table 1, you reference Powers for the row on nuclear EROEI, but I am not finding the citation for Powers. I see the one where B. Powers is listed for an article on wildlife science, but this is probably not the article that you meant?
Robert Powers - the nuclear EROI referenced will be the appendix posted next Tuesday
One trick with calculating NatGas EROI is trying to choose how much NatGas should be on the Output side of the EROI=Output/Input equation. The graph above shows the two choices:
1. You can use the total NatGas produced in the area you are trying to measure in one year. The problem is that the drilling activity for 2003-2004 is only partially responsible for the NatGas produced that year. The graph lets you see that most of the NatGas produced in 2003-2004 was actually from prior years.
This will skew the EROI higher in years with less drilling and skew lower in years with more drilling.
2. Sometimes you can get NatGas flow data by well. And if you can get the data you can calculate the amount of gas produced from that years drilling effort. See the yellow stripe. Typically, the total amount of NatGas must be forecast to reach the ultimate delivered by the wells.
Because the Canadian Government broke the NatGas data out by year, it was possible to use this second technique. Such data does exist in the US, but is commercial (no free source). If anyone has the data, and would like some help turning it into EROI values, please contact me.
Youch! Can the EROEI of CSP really be that bad? 1.6:1? What sort of energy-intensive things go into solar-thermal plants? Making the glass? Otherwise, I can't figure it out....
And is this assuming average insolation? If so, well...CSP will probably never be built in areas with just average insolation, but instead in areas like Arizona with 300+ days of direct sunlight per year.
Check the date of the study. 1986. I always wondered why so many CSPs are being made now, and why so little have been made until now.
I now know the answer.
Thank you for at least acknowledging this explicitly. I will withhold my fire until these issues are considered in detail in later publications.
Prof. Hall, thanks again for your terrific work. In the article proper, I would offer just two comments (the Appendices I am still digesting). First, where you say "perhaps, energy is in some sense the ultimate raw material for economic production", I would strike 'perhaps' and 'in some sense'. I know that as a scientist you prefer to state things cautiously, but as a layperson, I feel no reservation in saying that energy clearly underlies everything we do economically, and, as you pointed out last week with your example of a trout, ecologically as well. Second, under bullet 4, where you discuss the limitations of your analysis resulting from leaving out some difficult to quanitfy inputs, you say that this means your ERO(E)I is doubltless a minimum. Since inputs are being left out, don't you mean your figures establish a maximum ERO(E)I, as any additional imputs would reduce the ratio? Thanks.
(Nate, I'll shortly be submitting to you what I hope will serve as a companion keypost to Prof. Hall's excellent series.)
Watching the table of eroi, the wind and photovoltaic are the best ways now to minimice the impact of peak oil, but i don´t see any important movement, except Germany and Spain, about this metod of "generating" energy.
I think that this tipes of renewable energy must be massive incentive.
It´s only a part of the problem, but is better do something appart of transform food on oil or do wars at thousand of kilometers to get some oil left...
Thank´s.
I've thought alot about this. It's not enough to replace high EROI fuels with other high EROI fuels that pertain to different infrastructure, unless time is not a factor. Consider we have 3 main usages for energy, transportation=A, electricity=B, and heat=C. Per the Hirsch report, (and other analyses), TIME is such an important variable, as we cannot transition our transportation sector from predominantly reliant on liquid fuels to an electrified system quickly (or equitably).
So the real issue is we may increasingly have a mismatch of fuels for what society demands, while liquid fuel EROI declines, leaving less for non-energy sector. We DO have high EROI alternatives but none of them are liquid fuels. We have EROI X Scale for liquid fuels which is declining while EROI X Scale for alternative fuels is much smaller but growing.
If we were somehow able to replace the QUALITY (e.g. liquid) and (QUANTITY)(EROI X Scale)of the social aggregate EROI, then we wouldn't need to change social infrastructure. But all of our high EROI alternatives, even if they could match high EROI oil, will require us to change our infrastructure, as quickly as possible to one that could run relatively well on electricity. I don't think we have enough time and energy to devote to both the infrastructure change AND the scaling of alternative energies while still leaving enough liquid fuels for the productive 'service' economy. Serious choices are going to have to be made.
as we cannot transition our transportation sector from predominantly reliant on liquid fuels to an electrified system quickly (or equitably).
We can electrify 20% of our 178,000 miles of railroads in about 7 years with "maximum commercial urgency". Under the 80/20 rule, this 20% implies 80% of our RR freight ton-miles.(and the pace of electrification can increase in years 8 and beyond). In a decade RR capacity can be expanded, plus increased speed and reliability, so that electrified RRs can displace at least half (perhaps 2/3rds) of the trucking ton-miles. Further investment can displace at least 85% of trucking ton-miles.
Urban Rail to displace 3+% of total US oil use can start construction in 12 to 36 months. I have a specific list of "on-the-shelf" projects at:
http://www.lightrailnow.org/features/f_lrt_2007-04a.htm
Completion dates vary, but well-run projects (perhaps unrealistic assumption) should all be finished in 4 (perhaps 5) years under maximum commercial urgency.
As these "on-the-shelf" projects are finished, Phase II can be planned. France is building tram lines in cities of 100,000, I see no fundamental reason why USA cities cannot as well.
I am unsure about your comment about equitably.
EROEI per year (a new concept for long lived infrastructure) should be in excess of 5, with the various components lasting 30, 40, 50, 70 years or centuries.
Best Hopes for Long Lived, Efficient Infrastructure,
Alan
PS: I do think "EROEI per year" is an interesting metric for a society in crisis. Invest X energy in a project, and once in service it will save 7.2X energy each year thereafter, until components need replacing.
Alan I actually think that electrification of existing diesel rail lines should be the last thing we do. I think we should make new RR construction electric. But its already a highly efficient form of transport even using fossil fuels.
I think you get more bang for the buck so to speak getting agressive about commuter rail, trams etc. And a mix of diesel/electric is ok. You can always electrify later.
I think in general it makes sense to go electric but the critical issue is getting people back on rail transport and out of cars.
For freight I think the market forces can to a large extent be used to transition freight from truck to rail. This already seems to be happening.
Electric trains give superior service. They accelerate and brake faster (and climb steep grades better).
This means that commuter rail schedules that convert from diesel to electric can reduce times by 15% (a 40 minute run takes 34 minutes). Faster means cheaper to operate (most costs are time dependent, like wages). Faster means more riders and more revenue.
Electric means no wasted deadheads runs to refuel, no warm-up time on cold mornings (crew gets there 30 to 45 minutes early just to start loco engines and warm them up @ idle).
Simply electrifying a freight rail line increases capacity by about 15%. A single track rail line that can handle 36 trains per day, can now handle 41 trains/day with slightly fewer delays and snafus (no refueling issues for example).
Plus the fuel savings and the creation of Non-Oil Transportation. Not just using oil more efficiently, but getting away from oil entirely.
1 BTU of end use electricity does the work of 2.5 (flat, rural lines) to 3 (mountains, variable speed urban) BTUs of diesel in a locomotive.
Alan
Ed Tennyson is a great fan of EMUs (And I concur). EMUs are self propelled "electric multiple units" that can operate alone or in trains. Mid-day service can be served by single (or dual if loads require) EMUs and they can ganged together into, say, 6 car trains at rush hour. The bulk of the rush hour service can be served by traditional loco + cars trains.
EMUs allow for more frequent service economically during low demand periods, which builds ridership. Studies have shown that frequent mid-day and late evening service increases rush hour ridership, even if rush hour riders rarely use off-peak service. A "comfort" issue.
Your missing one point I made in another post. As the EROI declines for the current liquid sources they will be competing for energy/money inputs with attempts to move to alternatives. So its not simply trying to create the alternatives in a decreasing environment it one where total net energy is decreasing and the demand for energy from the existing liquid energy infrastructure is increasing.
They of course can offer a short term promise that if you invest they will give you more liquid energy. So during the initial down turn you have to deal with disproportional flow of wealth into the existing liquid energy infrastructure and away from all other business sectors including alternatives.
EROI has reached a new level of absurdity if we are to believe that the EROI for imported oil is positive or in the area of 5:1 as claimed. The good professor in his flip flopping between EROI and monetary accounting has mistaken economic gain for energy gain.
The importing country acquires the economic gain from imported oil. Of course it will be positive and if sufficiently positive it will enable the country to import more oil for some time. That does not mean that there was an energy gain in producing the goods which are used to obtain more oil.
Using economic gain as a proxy for energy gain defeats the whole purpose of EROI analysis or am I missing something here. There is no way that there can be an energy gain from imported oil unless it is used to produce a higher EROI export.
Refining, distribution and consumption even if used to produce goods which are exported are all energy losers for the United States with the possible exception of corn which is an energy gainer as it is stored solar energy.
Prof. Hall has indeed produced a counter intuitive argument in claiming that there is a positive EROI for imported oil. I do not care who he cites to back up the argument or the data either for that matter. It may be numerically true, but the argument is logically false. Logic rules not numbers and data. Numbers and data have to conform to the rule of logic or they are nonsense. In the case of claiming the numbers and data indicate a positive EROI for imported oil, he has turned logic and reason on its head.
Huh? Why would imported oil be expected to have a "negative" EROI (I assume you mean a ratio less than 1)? Hall's numbers may be shaky, but I don't follow your logic at all!
The question isn't the energy gain on *use* of the imported oil, it's the energy gain between what is spent to acquire it, and the amount of oil thus acquired. We might spend more energy to purchase imported oil than it returned (EROI < 1) if we had some good reason - national security perhaps, keeping the oil out of the hands of somebody else. But I don't understand what your argument is here that it should always be that way (if that's what you're saying)?
I do have a question though with this analysis based on energy intensity - Hall claims:
- I take it from this that they are replacing one measure (energy cost of recovering and shipping) with another (energy to generate traded goods and services) rather than adding both together. Because it seems to me adding would be double-counting: the exporting nation would then obtain the results of energy expenditure (the imported goods and services) at no energy cost, or infinite EROI. Probably not what's intended...
Also, using the energy intensity/price measure doesn't seem to tell us much beyond just looking at the prices themselves, which is what most analysis does anyway. Or am I missing something? EROI does give us a dimensionless number from price, so I suppose it does tell us there is a kind of limiting price - around $500/barrel it sounds like, beyond which things get difficult. But I suspect we knew that anyway...
In particular I would have thought that fundamentally EROI should reflect physical, technological, and geological constraints, and so should be a relatively smooth function of time. The abrupt price swings of the oil (and gas) market through this EI interpretation give a much different picture - it just seems fundamentally wrong.
And, along with other commenters here, the EROI cost picture for CSP seems off - are we missing something there too?
x's statements are illogical, but he does have his reasons:
x wants the government to continue to mandate the use of ethanol. He doesn't want to take responsibility for the economic distortion this mandate creates and for the costs it imposes on the American public, even as he personally benefits. He wants to avoid any sense of guilt for the hunger and hurt around the world to which this mandate is contributing.
x will continue to repeat his nonsensical mantra for these reasons.
There is possibly another explanation for x's repetition of the nonsense he spouts, but since I've sworn off calling people stupid, I'll just keep it to myself.
Maybe x is paid by ADM or Cargill to spew this crap.
Once again, you have taken us through the looking glass. What good is logic if you cannot use it to express a sensible paragraph?
World Oil Magazine has published several articles on Natural Gas exploration that contain all of the information needed to calculate an EROI. (Thanks to Gail and Heading Out for finding these).
I want to explain how to do the EROI calculation in detail, so that those who are working in the industry and have access to the data can run the numbers for themselves (and hopefully keep us updated on the trend).
Data from “Plank Road fever and the Barnett Shale” by Arthur Burman.
http://www.worldoil.com/magazine/MAGAZINE_DETAIL.asp?ART_ID=3171&MONTH_Y...
Mr. Burman compares vertical wells and horizontal wells.
His average cost for vertical wells was $1.5 million with an average 5 year total NatGas extraction of 0.356e12 BTU per well.
His average cost for horizontal wells was $3.5 million with an average 5 year total NatGas extraction of 0.808e12 BTU per well.
We will calculate the EROI for vertical wells first. To get the energy produced per well, we convert BTU to Joules (1055 j per BTU).
Energy Out = 0.356e12*1055 = 3.76e14 joules.
So we have total energy produced (joules per well) we just need to convert the well cost into energy.
The oil and gas industry is energy intensive and uses about 20 Mj per $ (in 2005) which is just over twice the Energy/GDP value Dr. Hall discussed in the main article. (The Mj/$ value provided by Dr. Hall while updating the Canadian NatGas EROI).
We don’t know the year these wells were drilled, but if we did, then we would convert all the drilling costs into 2005 $s. Then we multiply the drilling cost by 20Mj. So a vertical well would be $1.5e6*20e6= 30e12 joules.
The EROI calculation is now very simple: Output/Input = 3.76e14/30e12 = 12.5 for vertical wells.
The EROI for horizontal wells turns out to be 12.2. (The article was about how the high cost of horizontal wells was hurting the profitability and we can see it in the EROI).
Mr. Burman has done several other articles on Natural Gas plays.
"The EROI calculation is now very simple: Output/Input = 3.76e14/30e12 = 12.5 for vertical wells."
times the percentage of wells which are drilled which are profitable/not dry (34% of wells by the given link, around 47% from figure 1 above), for an EROI of 4.25-6.
The Future of Unconventional Gas
Gail found several excellent references on Unconventional NatGas in the US and posted them in my Canadian NatGas EROI.
The following table comes from (PDF) A Decade of Progress in Unconventional Gas" which might be better titled "A Decade of Decline in Unconventional Gas".
Look at the "Well Productivity" columns. This is the total amount of gas expected to be recovered from each well. This number determines the Output side of an EROI calculation. They are almost all falling.
The only value that has gone up is the Gas Shales, which saw a small uptick. That was achieved by horizontal drilling and hydro frac'ing the wells. But if you go upthread, you can find the analysis that shows horizontal wells are much more expensive to drill.
Unless we see those ultimate recovery values move back upwards, unconventional gas is going down the same EROI slope as conventional. I will close with a quote from the presentation:
Very good!
Now we know we're talking about an economic argument--no thermodynamics(not ecology either it would seem)!
The expected minimum level for society is (arbitrarily) set at EROEI of 5:1. The EROEI of the US today is between 10 and 12 and was at that point in 1979.
It would be interesting to (carelessly) apply the method to different countries. Let's try this at $100 a barrel of oil( not oil equivalent). I realize EIA has 2005 figures and wiki has 2007 but things haven't changed that much.
http://en.wikipedia.org/wiki/List_of_countries_by_GDP_(nominal)
http://www.eia.doe.gov/pub/international/iealf/tablee1p.xls
Approximate EROEIs(?) using Energy Intensivity
USA: 6164/(9.28 x $100)= 6.6
China: 6164/(7.9 x $100)= 7.8
Japan: 6164/(6.5 x $100)= 9.5
India: 6164/(4 x $100)=15.4 (the big winner)
UK: 6164/(6 x $100)=10.3
Russia: 6164/(20.4 x $100)=3
Saudi Arabia: 6164/18 x $100)=3.4
Brazil(with ethanol):6164/(6.3 x $100)=9.8 (ethanol kills oil)
Venezuela (without ethanol):6164/(16.5 x $100)=3.73
Canada (with tar sands): 6164/(13.8 x $100)=4.4
Norway(without tar sands): 6164/(12.8 x $100)=4.8
These energy producers have the lowest EROEIs!
Get out of energy quick or you might collapse..hehe.
:)
You may fire when ready!
Ok, I'm lost.
You presented a table of GDP of countries, and one of energy use/GDP. So, you calculated the total energy use of each country...
So, how did you get the EROEI? There seems to be some data missing here.
It's in Hall's article.
EROEI= Eboe(6164 MJ)/ Eintensivity x Pboe( taken as $100 a barrel)
The number for E intensivity is from EIA referenced which gives BTUs per dollar, which I posted as thousands of BTUs, i.e. where I posted 9.28 for the US energy intensivity, the table says 9280 BTUs per $ of GDP.
http://www.eia.doe.gov/pub/international/iealf/tablee1p.xls
I used the conversion rate of ~1 MJ equals 1000 BTUs. (MJ is a 948.45 BTU exactly).
The ratio above is dimensionless.
Ok, got it. Thanks.
Majorie,
Professor Hall may find time to respond to your foolish distortion, snicker and all, but in the interim here are some words from his paper that may help you see your error:
"EROI is simply the energy delivered by an energy-obtaining activity compared to the energy required to get it." and,
"the minimum EROI needed for a fuel to make a real contribution to society (...) is not 1.1:1 but closer to 5:1."
But even before you tumbled into your distorted representation of eroi, you had already revealed a serious misconception. How is it that you isolate economics from thermodynamics and especially from the second law, the Entropy Law?
From Georgescu-Roegen, described by Paul Samuelson as "an economist's economist":
"The significant fact for the economist is that the new science of thermodynamics began as a physics of economic value and, basically, can still be regarded as such. The Entropy Law itself emerges as the most economic in nature of all natural laws." (The Entropy Law and the Economic Process, 1971)
The Entropy Law is "the basis of the economy of life at all levels", and is intimately related to the economic process. The economic process is inseparable from the transformation of energy from a state in which it is available to do work to a state of unavailability.
Nearly everyone who has posted a comment regarding EROEI analysis on this board has done this very thing.
I'd like to continue my dicussion of EROI over time since its relevant to both
NG and Ethanol production and the results are surprising.
First I'm not happy with the concepts of a static EROI since the outputs of a process generally become inputs into the process. Energy is fungible and in general all energy sources are linked as inputs to extraction or creation of other sources.
So first what happens when a static EROI approaches 1:1. What this means is that the second form of energy is not a source but a energy carrier. The easiest example is hydrogen. Since only small amounts are avialable as a source and it takes more energy to make hydrogen than it contians its obviously a energy carrier not a energy source.
Corn ethanol is so close to 1:1 that it can be treated as a energy carrier not a source.
Now with this naive calculation it seems that a negative EROI for a energy carrier is not a big deal as long as the input energy sources are higher than 1:1.
But here lies the problem since energy carriers such as ethanol are used in the manfacture of ethanol itself even if the static EROI of the other inputs is greater than 1:1 the overal system is declining with time as each round of production results in a decline of EROI as ethanol is reinjected into the production of the system.
As and example lets say you have a synthesis that uses the output compound as a input. Lets say its something simple say NaCl and assume that NaCl or table salt is the desired out put and your input needs say 1% NaCl lost in the reaction. If your recovery is 80% you get less NaCl for input each round of the process.
To use another example lets take solar cells with a nominal pay back of 20 years. So you have to use the cells for 20 years before you have covered the cost of manufacture. This means that the replacement is 40 years. So the cells have to run for 20 years to cover their own manfacture and then for another 20 to cover the cost of new ones in a perfect feedback loop. You don't get growth until they have run for and additional 20 years.
So my time eroi concept or TEROI for solar cells is 60 years to get to 20:1.
This number is not crazy since we could compare solar cells to growing trees.
A renewable forest has replacement time scales on the order of 60 years. I'm arguing that since the solar eneregy inputs and manufacturing inputs are about the same for solar cells and trees that the TEROI is about the same.
The fact that we think we do a lot better than trees with solar cells simply means we have messed up the EROI calculation.
Another example Corn well we can estimate the TEROI for corn fairly easily using the old adage of 7 years fallow for organic crops and looking at US population growth before the coal age as a proxy for agricultural growth since the population cannot grow faster than the food supply.
http://en.wikipedia.org/wiki/Demographic_history_of_the_United_States#Hi...
Using this link its obvious that the US population doubled on the order of 20 years so TEROI for pre coal agriculture to reach 2:1 is about 20 years.
Note this is with effectively unlimited virgin lands with transportation bottle necks probably more important for providing food.
I think that wind is probably similar it has real payouts at around 5-10 years giving a TEROI for growth at 2:1 on the order of 15-30 years. Its intresting but not unexpected that the amount of wind energy you can capture with a windmill is similar to the amount of solar energy you would capture via crops but not surprising since wind is really a solar source. Wind has its own demographics which complement agriculture and solar but as a energy source it seems to have similar TEROI patterns.
So with these simply concepts we seem to be getting the result that real EROI wich is the time for a energy source to reach 2:1 or growth is about three times the static EROI. If your static EROI is less than 9:1 then your probably in a negative feedback loop over time. Taking the timescale of the TEROI source as a metric this means that sources with a negative TEROI go to zero EROI on the order of the time scale because of feed back. So taking a corn ethanol economy as and example it would have zero energy over time in about 20 years.
PV is positve but its time scales are mind numbing it has a doubling time on the order of 60 years not exactly a quick fix. Nuclear seems to fit between wind and solar so these have better time scales in the 15-30 year range.
What this means is that if we converted our economy entirely to these sources after we convert it would be 30 years before we would actually see growth.
Since we still have other positve EROI energy sources its not all that bad since they can be leveraged but you can see once you include the fact that we need to use the energy for other stuff not just replacement we are looking at timescales on the order of 100-200 years before a alternative energy economy has the same energy density for use as we have today.
The next interesting outcome is that once your energy source drops down around 9:1 in static EROI the TEROI is at 1:1 and your system is no longer growing.
This is a pretty cool result and finally gets back on topic :)
EROI estimates for oil and NG extraction have already dropped down around the 9:1 static EROI number and indeed the world economy has begun to slow. Next because of the division by 3 as static drops lower we begin to drop faster.
For real growth you need a static EROI much higher than most people think up around 20:1 which happens to have been what oil was at as the oil economy grew.
So a 20:1 EROI implies a growth factor or TEROI of 2:1.
So in closing this simple anaylsis indicates that the growth stops and decreases as the primary energy sources have a static EROI lower than 9:1 and can grow at a TEROI of 2:1 if the input static EROI is around 20:1 this is in line with what we are seeing in the real world.
And finally back to the ancient world they did not have unlimited effectively unpopulated fertile lands to exploit and its not surprising that the growth of ancient civilization seemed to have a 2:1 TEROI of around 100 years or so.
So they actually grew their civilizations at close to the maximum rate if you include the cost of removing the natives which where much higher in Europe and Asia vs the America's. Time scales of 100-200 years approach the civilization or cultural stability points so its not surprising that these civilizations seem to rise and fall at certain predictable sizes.
In any case even if I've made errors I think the basic argument is right and we are seriously underestimating our energy needs.
Your idea is not the EROEI concept of Prof. Hall but a concept called iteration.
It's the same idea as compound interest.
Xn+1=(1+i)*Xn.
If you have an annuity the equation becomes
Xn+1=(1+i)*Xn-A
For example, you start out with a principle(seed) of $100k and get 10% constant interest but take out $10k per year how long will it last.
Answer--$10k/(1.1-1)=$100k: you will always end up at exactly $100k forever and the principle will be-self sustaining. But at $90k principle you will run out of money in about 25 years( per Excel), but at $105 principle you will double your money in about 33 years(growing your principle).
Take corn ethanol for example with an EROEI of 1.4.
Xn+1=1.4*Xn-Xoutput. So for a sustainable (FOREVER) output of 42 gallons of ethanol (or 29.1 gallons of gasoline) you'd need to start off with 72.9 gallons of gasoline and be able to trade 1.44 gallons of ethanol for a gallon of gasoline: sustainable at -29.1/(1-1.4)=72.9 gallons of starter gasoline.
The opponents of ethanol say that something is lost every time
you cycle the process( usually soil erosion). If this were true it would seem that yield per acre should fall or at least not rise (at a rate of 1.6 bushels more per year since 1940).
http://www.agry.purdue.edu/ext/corn/news/articles.03/CornYldTrend2003.html
You would think that fossil fuel inputs must be increasing to offset soil depletion. I don't think this is found anywhere as the more recent EROEI studies for corn ethanol have showed greater net energy gain per bushel than the older ones do(excluding the ever weird Pimental and Patzek)--if true you would expect increasing amounts of fertilizer and fuel would be needed now compared to 10 years ago. However, it is true that corn ethanol is still dependent on the use of vanishing fossil fuels.
Basically any process that is net energy positive, EROEI>1, is sustainable in this sense give the right amount of 'seed'.
http://www.ncga.com/ethanol/pdfs/studysummary.pdf
Looking at oil depletion,
if there is 1 trillion barrels of oil and we use 25 billion barrels of oil per year and we are depleting at a rate of 1% each year then the oil would last 34 years(Excel) but if the rate of annual world production rises at 2.5% per year we would never run out of oil--(-25)/(1-1.025)=1000 billion barrels forever(LOL!).
Basically yes this is what I'm saying. As proof I offer the fact that the pre-industrial agricultural societies barely grew. We tend to ascribe this to large numbers of deaths from disease esp in childhood. However the ancient cultures generally had large slave populations and had no problems fighting wars. If people where precious then society would have optimized human labor.
I'd also offer that in western societies people did become precious i.e labor became expensive and we did optimize by using machines and slave labor in third world countries.
So using both the concept that somehow agricultural societies are constrained by disease is wrong the other constraint is EROI. And esp this sort of iterative EROI concept.
Next as far as your calculations correct in a sense but 72.9 for inputs seems low to me. Thus I question the 1.4 estimate for corn in the first place. I'm not arguing with your math just that the answer seems intuitively to low.
But just to use round number the seed has to be 80 gallons for a 40 gallon forever yield. This would mean we would have to devote twice as much oil is we use today to growing the first 100% replacement corn crop. At that point assuming no other factors we have a replacement crop in place and your now producing if I did my math right about 140 gallons of ethanol to do this. Which seems to be my 3x idea. About 100 is going back into the process.
Now obviously you cant take twice the worlds current production and devote it 100% to corn ethanol thus if you take "real" investment which is far lower you start I believe getting the numbers I'm saying which is decades to centuries to transition. We never did finish transitioning off of coal to a pure oil/NG society for example. The move from coal fired electric plants to NG/Nuclear stalled out along the way. But going back to EROI and this you really want a EROI of 9:1
So your reinvestment level is much lower. To make it easier just say that EROI of less than 10:1 is probably impractical to have a growing society.
Xn+1=(1+i)*Xn-A
Given a input of 100 and a i = 10 gives
100 = (1+10)*100-A = 100 = 1100 - 100
Or only 10% re-ivestment needed.
At a 5:1 eroi
100 = (1+5)*100-A = 100 = 600 - 500
But to get a out put of 1000 to stay constant you need to double.
You half the EROI and your percentage re-investment goes to 20% but to stay constant in output you need to go up to 40% investment thus 40% of our economy would be devoted to energy from a low of 10% just to keep usable output level.
So as EROI goes from 10:1 to 5:1 you need to quadruple the size of your energy industry.
In the ancient world on average about half the people where farmers which implies they had a investment level of 50% or a eroi of 2:1. And we know these societies barely grew. From or view they where stagnant. Also we know we are not going to double the size mainly because they don't have a way to grow. So our excess energy will drop much more then implied when we go from 10:1 -> 5:1.
So I don't believe you can transition a society from a high EROI source to a low EROI source.
I think you need a LOT large seed input if you will to transform from a oil based economy to a renewable one then people have figured out to date.
Now as far as corn needing more inputs goes the situation is more complex since the green revolution itself just recently peaked. Genetic modification plays a big role and also crop rotation so at least two important external factors are not included. Also your still making use of the intrinsic soil fertility in addition to the fertilizers. I think Iowa has like 9 feet of topsoil so this layer is still being depleted. Eventually the yield is of course limited by the amount of solar radiation and chemical conversion efficiency. I've seen a few numbers that suggest we are probably pretty close to what the maximum is for plants.
http://www.arenergysystems.com/index.php?option=com_content&task=view&id...
So we have a pretty good idea where we would max out at about 1% photonic yield. Charts showing a increase in yield from 0.2% -> 1% are misleading.
Epidemics don't spread widely until some minimum population density is attained. Such densities weren't attained until agricultural societies were well established. The population didn't grow rapidly in pre-agricultural societies not because of epidemic disease but because population was kept in check by food availability. In other words, population remained within the carrying capacity of the environment. Likewise, large slave populations were artifacts of agriculture and didn't exist in pre-agricultural times.
An EROEI of 5 means that you put in 1 and get 5 out.
Lets say shale oil has an EROEI of 5; to get out 100 units out you would need to start with a minimum of 25 units of equivalent energy.
If you start with 26 units you get
Xn+1=5*X-100; X1=26, X2=50, X3=150, X4=650....
If you start with 24 units you get X1=20, X2=0, X3=-100, X4=-600...
If you have oil at 10, to get 100 units you'd have to start out with a minimum of only 11.1 units. Xn+1=Xn*10-100
If you start with 12 you get X1=12, X2=20, X3=100, X4=900...
If you start with 10 units you get X1=0, X2=-100, X3=-1100...
If you have ethanol at 1.25; to get 100 units out you'd have to start with 400 units. Xn+1=1.25*Xn-100
At 410 units you get X1=410, X2=412.5, X3=415.6...X10=493..X20=1267 a slow rise
At 360 units you get X1=360, X2=350, X3=337.5 a slow decline.
As you can see with higher EROEI you produce large surpluses of energy. The problem is that high EROEI fossil fuels have to come from somewhere and we are running through them rapidly.
The examples above also show that the above (your interpretation?) is probably not realistic.
Of all the EROI figures given in the table, only the one for sugarcane ethanol reached out and slapped me in the face. I've seen estimates of around 6 to 8 but never as low as corn's 1.something. Is this for Brazil's human labor version or a mechanized American style version?
Michael Salassi, an LSU professor, recently published a USDA study on the feasibility of sugar feedstocks in U.S. ethanol plants. I get the impression that they can modify a corn plant to run mixed feedstocks (corn and sugar) but the production cost for sugar is much more - $1.05/gal. for corn vs $2.40/gal. for U.S. sugarcane, presumably grown in LSU land, Florida, and near tropical U.S. growing areas.
The costs are much higher for all forms of sugar except molasses. Here you have the cost at $1.27/gal. and the capital cost to build new plants actually a little cheaper than for corn.
So the question comes to mind, why can't the U.S. import molasses from Brazil and other sugar exporters to replace corn with? Does molasses have the same good EROI as cane if it's made in Brazil and other manually grown and harvested areas? Does sugar even have a worthwhile EROI? It seems to be working well in Brazil for oil displacement.
Netfind if you follow my above analysis a society based on sugar cane is probably not viable esp used in the way we do today. Its right on the edge.
Corn ethanol is not being done for EROI its being done as a energy carrier.
We are transforming solar/NG/Coal into a liquid fuel. As long as the NG/Coal has higher EROI then then as a energy carrier ethanol is viable.
Now think about sugar cane exports as a energy source no a foodstuff. This means that if we switched we would want to grow our imports of sugar overtime up to a level at least close to our current oil imports. No way Brazil can provide this and provide for its own people. So although you could import the strain of the imports would probably cause prices to increase since the supply is not there so your quickly back where you started.
Certainly the rest of the world is not under the same politics as the US is why are they not taking advantage of cheap Brazilian molasses ?
Given the current cost of oil you would think it would be in high demand. The problem seems to be a logistic issue. If you try to import in large volumes then cost increases and your back to where you started.
This highlights that biofuels are not energy sources but energy carriers and as such are only working right now via government subsidies.
According to my approach sugar cane is about break even to slightly negative.
I never really thought of ethanol as an "energy carrier" before, being just a conversion process like CTL. It's totally worthless as a stand alone energy source, but at least it converts other things to liquid fuel besides crude.
That's from 1986. Brazil has multiplied by near 3 the average amount of ethanol it produces from a given area from the end 70's to early 2000's (86 being near the middle of a steady growth, that is from memory, so I don't know exactly what changed from then). Also, the use of fertilizers, work and machines decreased during that time.
But more importantly, several pipelines were built to transport ethanol and the technology to burn the bagass to generate energy for processing the cane was developed on the meantime.
That could very well be the EROEI of brazilian sugar ethanol.
I have many problems with the current scholarly thinking on ethanol (surprise, surprise;) but, I just want to touch on a very basic one, right now.
OCTANE!
The BTUS in ethanol are more valuable than the BTUS in gasoline because they can do more work. We've seen from my recent links that the amount of work that can be accomplished with a gallon of ethanol in a reasonably modern engine is virtually identical to the amount that can be done with a gallon of gasoline when used in the proper blends, basically e10 - e30.
Thus, when you take a gallon of ethanol that's been produced by Corn Plus you probably should compare it's 24,000, or so, total fossil fuel inputs - farm, seed, fertilizer, processing, etc. (I covered this in response to RR in the thread a few posts back) to gasoline's 116,000 btus, and, not, ethanol's 76,000 btus if you want to get a real world picture of viability. And, yes, that Would bring you up to about 5:1.
Let the Yelling, begin. :)
This is so offbase I don't even know where to begin to yell, so I will ask quietly:
KD - if you go on a trip, say from wherever you live, to Los Angeles, and use E10 the entire way (somehow), would you have to fill up your tank more or less times than if you used unleaded gasoline? (holding all else equal for the moment, which it's not)
Nate, the last I read, the DOE said I would lose about 0.5% on fuel mileage.
So, if I was getting four hundred miles between fill-ups with unleaded, I would only get 398 with e10. But, since e10 is selling for about seven or eight cents less per gallon in most places I would come out okay, I guess.
Keep in mind, though, that the newer the car, the better I'm going to come out. A 1990's engine would, almost certainly, fare worse than this. It IS interesting to note that many of the newer cars have actually been shown to get BETTER mileage when running on an e20 mixture than when running on unleaded gasoline. (I know you had to look at that link that Robert and I fought over for a couple of days.)
This is totally wrong.
Ethanol has almost 40% fewer BTUs than gasoline. How can that equate to only 1/2 of 1% less fillups??
Since you are a fan of the google, there are dozens of mileage tests showing how much more often one needs to fill up using ethanol vs gasoline (thats the same thing as lower gas mileage fyi) Here is one: Consumer reports showed 27% less mileage just using E85. Using E10 would obviously be much worse.
All else being equal (which its not, corn ethanol is horrible for environment), you will have to fill up your car 130-140% as often using E10 than gasoline.
Note, everything I've just said has NOTHING to do with EROI, its in addition
The saddest thing about this is I know you are a)well intentioned and b)a long time reader here. It really is frustrating and gives me little hope that key people are really going to be able to connect the dots in time.
KD - I'm sorry -I'm just too busy to keep debating you further, especially because Robert has already done so ad nauseum, You are either deliberately being obtuse or trying to waste peoples time here with some agenda (or I guess its possible you just are obtuse). Good Luck
*edit: I just ckecked your IP - you are in Burlington VT??!! Boy - thats got me to wondering. its a small world..
Nate, it's the OCTANE!
It's not how many btus you have; it's the Efficiency with which it's given up.
Didn't you read ANY of my links? How can you talk about liquid fuels if you don't make ANY ATTEMPT to understand how IC Engines work?
Uh, no, Nate
I'm from Mississippi
LOL - I clicked on my own IP addy by mistake. My apologies (but not about ethanol argument)
No. It's the combined impact of the two.
The links you gave were from www.ethanol.org, which was my first clue. From your first link:
This is a common example of 'decoy' or straw man. No one assumes E85 gets 30%lower mileage. I checked 6 sites that were NOT industry advocates on the first page of google, including Consumer Reports and ALL 6 showed ethanol had significantly lower mileage than gasoline. The octane efficiency improvement doesn't come close to offsetting the lower BTUs, unless of course you are referring to 'theoretical future improvements'. Meanwhile this is all being subsidized by continued cheap petroleum.
And are you employed, paid, or otherwise associated with the biofuels industry? Out of curiousity?
Come on, Nate. Just because a study is commissioned, or referred to by a pro-ethanol organization isn't a valid reason to deny it's results. That's like saying that I must work for an ethanol/farm/etc company, or organization just because I believe ethanol is a viable partial solution to our coming problem. As I stated, before: I'm a retired insurance salesman who has always wondered what my grandkids would do when we ran out of oil.
Look, the fact is that E85 does get pretty sorry gas mileage in the standard, old, low-tech V-8 engines that they've been converting to flex-fuel. The new vehicles that they're coming out with this year that have small 4 cyl, turbocharged, Direct Injection, VVT will pretty much kick butt. The whole flex-fuel thing did, pretty much, start out as a CAFE dodge; but it's not, anymore.
The thing is, the higher the ratio of ethanol to gasoline, the more compression is needed to obtain max efficiency. The beauty of ethanol is that you can greatly downsize the engine, with the attendant fuel economy, and still generate a great deal of horsepower. Keep an eye on GM, and the Denali. They could really rock and roll with a combination of their "displacement on demand," and a variable ratio turbocharger.
Anyway, you guys need to rethink the whole "ethanol is evil boondoggle" thing a bit. I think a little reading may open your eyes some. Anyway, I've hijacked this thread long enough; I'm going to go read, now, about the $115.00 Tapis. :)
Okay, One Last Thing:
Ethanol: Multiply 76,000 btus x .40 Thermal Efficiency and you get 30,400.
Gasoline: Multiply 116,000 btus x .25 and you get 29,000.
kdolliso,
what is the best burning temperature of ethanol, and what is the best burning temperature of gasoline ?
Neuroil, the best place for answers like this is, probably, planete85. Basically, what I know is that ethanol doesn't like it real cold. It runs best when it's warm. That's why it's mixed with gasoline in the U.S. It needs the gasoline for Cold Starts. That being said, it actually burns a couple of hundred degrees cooler than gasoline.
And, another thing: You've got to realize that when you're speaking of biofuels you're, basically, talking about Biotechnology. This is a Remarkable, expanding field. We're just getting started. You have stuff like this coming at you, daily.
http://www.greencarcongress.com/2008/04/researchers-mod.html#more
Also, companies like Pioneer saying they're going to increase the yield of corn by 40% in 10 years. Monsanto inventing a strain of sorghum that can grow in acidic, dry, aluminum-damaged soil.
You've got a couple dozen, if not a couple hundred, small companies working on algae. Zillions of small companies, and Universities, working day, and night, on the best cellulosic solutions. Corn Plus just had a very successful test using microwaves to cur a few thousand btus out of the Drying process. More, and more companies are adding fractionation.
In short, there's just a universe of difference between a declining industry and a Science-Based rapidly expanding industry.
How about an EROI analysis of personal computers from the mid-eighties? How foolish would you look, Today? Think about it.
Corn ethanol is a bad bad idea, get that through your head kdolliso. None of the solutions outlined above will, keep corn from raising food prices, substituting oil derivatives as a transportation fuel. Algae may hold some promise I do agree with that. I just disagree with using corn whether we raise the yields 40%. None of that also will account for the natural variability of the weather much less what global warming may do to it. I agree bio-fuels are an intermediate term wedge fix which may help, but having our transportation depend on plants is not a very good long term goal. The genetic modification such as the ones your talking about also tend to have trade-offs, ie they may have a higher yield but will probably not be as disease or drought resistant. Comparing agriculture to the computer industry is going a bit far, I don't think bio-fuels or agriculture has ever kept up with moores law, and now even computers are reaching theoretical limits.
On the lines of EROI cellulosic and corn ethanol all have terrible EROI and our unrealistic for their purpose. It's all about the minimum investment of energy, It will take 60 times more energy initially invested to retain the same amount of energy from something like corn with a ~1.3 ratio than oil and gas with a 20 to 1 ratio. Making the crop-space and yields requires to maintain the same net energy would be ludicrous. Not to mention ethanols inherent limits with it's 2/3 energy by volume of gasoline. If you say well, we don't use ethanol to make ethanol, then you are essentially arguing what we already know, that corn ethanol and low EROI bio-fuels which is currently all of them, increase our dependence on foreign oil. There may be advances in technology, and hopefully their will be but don't advocate our current bio-fuels policy which is ridiculous. There are also inherent problems with mono-cropping switch-grass which is almost as big of a farce as corn ethanol is.
Compare one of Dr. Halls major findings:
with your quote:
This is a central point to the peak oil problem. There are huge areas in society (not on the news!) that are kept going on high energy gain subsidy. Think of all the 'dry holes' that are not being included in EROI analysis, but are public costs in terms of making future oil more expensive...
The answers to this problem are not going to be found with the same thinking that created the problem in the first place.
Ah, Nate, those little ol' grad student researchers ride bicycles, and eat peanut butter sandwiches. 'Sides, if they weren't studyin, they'd be out stealin your hubcaps. :)
Here's a more technical study of intermediate blends sponsored by the EPA. Google's full of'em.
http://www.methanol.org/pdf/ISAF-XV-EPA.pdf
Nate, if you compare this study from 2005 to the more recent (and, more scientific) study from the Univ of N Dakota, and Mn State at Mankatow you'll see what a difference just two years can make when it comes to engine development.
http://www.ethanol.org/pdf/contentmgmt/ACEFuelEconomyStudy_001.pdf
Nate, in case you Didn't see it, here's the more recent study from the Univ of N Dakota/Mn State at Mankato using the EPA Test Cycle. http://www.ethanol.org/pdf/contentmgmt/ACE_Optimal_Ethanol_Blend_Level_S...
I understand better now where the gas number comes from. Thanks. This seems to be comparable with the coal value since it is at the well head, somewhat similar to the mouth of the mine. Three issues that I think might be addressed are 1) a treatment similar to imported oil for imported LNG. Don't know if it would get past a referee, but it would be consistent. 2) A comparison of the energy requirements for getting coal from the mine to the power plant and gas from the well to the power plant. Apparently the energy needed for gas could be low? This will help when making a comparison with nucelar power if you have an equivalent stopping point for fuel delivered. 3) What is the EROEI of natural gas at the well head when it is produced together with oil? This might be given in a fraction of the production since there must exist a domestic combined value. Or, one might simply assign the same EROEI for both gas and oil. This is useful for understanding how coproduced gas compares with production of gas alone. It may also be very relevant if the USGS report on the Bakken play in North Dakota due out on Thursday gives a high estimate of URRs since wells there are producing gas though some of it is still being flared off I think.
Thanks again,
Chris
dear TODers.
i found these articles. please comment on them.
First off, demand dropping by 85K barrels a day is less than 1%.
How does increased ethanol demand = 215K bpd oil demand drop? show me the math!
US Oil Demand To Fall By 85K B/D In 2008
U.S. oil demand will drop by around 85,000 barrels a day in 2008 due to the weak economy and record high oil prices, a revised government forecast showed.
The Energy Information Administration said it expected total oil demand this year to average 20.61 million barrels a day, down from around 20.7 million barrels a day in 2007.
The forecast, in the latest monthly Short-Term Energy Outlook, compares with a month-earlier projection calling for a slim 40,000 barrels a day rise in U.S. oil demand to 20.74 million barrels a day. In 2007, total oil use rose a fractional 11,000 barrels a day, after a 115,000 barrels a day decline in 2006.
Adjusting for increased ethanol demand, U.S. petroleum consumption is expected to fall by 210,000 barrels a day in 2008.
EIA said it expects U.S. gross domestic product to decline in the first half of 2008 before growing again, with an annual growth rate of 1.2%, the slowest since 2001.
The lower 2008 demand forecast comes as first-quarter demand averaged only 20.29 million barrels a day, a steep 2.3% drop of 480,000 barrels a day from a year ago. That put demand at the lowest level in any quarter since the 2003 fourth quarter.
The first-quarter demand drop was the most in any quarter since the fourth-quarter 2004, when demand fell by 572,000 barrels a day following the 9/11 attacks on the U.S.
Last month, EIA projected first-quarter demand would decline by just 170,000 barrels a day, or 0.8% from a year ago.
OPEC spare capacity is rising? HOW?
Are there numbers out there that support that from 1.7mbd to 3.85mbd?
OPEC 2Q Oil Output Seen Up 1%
Crude oil output from the Organization of Petroleum Exporting Countries is expected to rise by about 1%, or 310,000 barrels a day in the second quarter from the first quarter, to 32.59 million barrels a day, U.S. government forecasters said.
The Energy Information Administration estimated OPEC pumped around 32.28 million barrels a day in the first quarter, up from 31.65 million barrels a day in the fourth quarter.
OPEC formally agreed in March to keep its oil output steady and to review output policy in September. Ministers rejected heavy lobbying to raise output from consumer countries, chiefly direct talks between President Bush and King Abdullah of Saudi Arabia, the de facto OPEC leader and the world's largest oil exporter. OPEC ministers may meet informally on the sidelines of the gathering of representatives from oil producer/consumer countries in Rome later this month.
EIA projects OPEC output will dip in the second half of the year, to a third-quarter average of 32.22 million barrels a day and a fourth-quarter level of 31.10 million barrels a day. EIA doesn't give output projections for individual countries within OPEC.
OPEC's spare output capacity is expected to rise steadily through the year, from 1.7 million barrels a day in the current quarter, to 2.5 million barrels a day in the third quarter and 3.55 million barrels a day in the fourth quarter. Spare capacity will remain concentrated in Saudi Arabia, EIA said. In the first half of 2009, output capacity will be 3.85 million barrels a day, EIA said.
EIA cut its estimate of non-OPEC oil output growth by 90,000 barrels a day to 590,000 barrels a day in 2008 from 680,000 barrels a day a month ago because of revisions to recent historical data and delays in new oil projects. Non-OPEC output is expected to be 49.83 million barrels a day.
Nate,
considering:
-There's a huge fat 'coal' bubble up there...
-Strikes me that a good chunk of that is going to get converted ASAP to liquids which may be used/distributed with the currently invested infrastructure (distribution channels and end usage:ICE), any comments?
Nick.
1) everything else being equal, you are spot on,
but:
2) I don't believe that coal number. It was at mine mouth, and a dated analysis. Coal has various quality depths and obviously as you go to deeper seams more energy is required - I'm not an expert, but don't think the 100-1 reflects this. Our anthracite is virtually gone, etc. More analysis needs to be done here, and that is one reason for Charlies plea to the online community. He is an extremely busy chap, as are most of us, so hasn't seen an analysis that is more current than the 100:1 that is usable.
3) Three reports last year showed that our coal estimates might be dramatically overestimated.
4) As importantly, this is where boundaries come in, and straight EROI (and the market) fail. We need to allocate an environmental cost to coal, especially large scale coal liquefaction (CTL), which the latest info I've seen (Morano and Ciferno) shows a 400% incremental GHG impact from Fischer-Tropsch via processing Saudi crude. Of course, a big part of the GHG comes from the decision to drive cars.
In sum, you are right - the path of least resistance is going to be CTL in a big way
Nate,
It looks like the fusion literature has some coal analysis. From what I'm reading transportation of coal takes about as much energy as mining. From looking at the references in this thesis:
http://fti.neep.wisc.edu/pdf/fdm1181.pdf
I came to this presentation:
http://fti.neep.wisc.edu/pdf/fdm1063.pdf
Which I presume contains the results of this paper:
http://www.sciencedirect.com/science?_ob=ArticleURL&_udi=B6V3C-4177MGG-T...
Birth to death analysis of the energy payback ratio and CO2 gas emission rates from coal, fission, wind, and DT-fusion electrical power plants
Scott W. White and Gerald L. Kulcinski
Fusion Engineering and Design 48 473
This might be worth a look.
If I am working the numbers back out correctly, (I'm assuming 40% thermal to electric efficiency but can't find what they use) the mouth of the mine EROEI would be 63 and the delivered to the power plant EROEI would be 34. The thermal EROEI would be 27 or so. This tends to agree with the high number in the balloon graph for mouth of the mine at any rate.
And Daddy won't you take me back to Muhlenberg county,
Down by the Green River, with the high EROEI?
"Well I'm sorry, my son, but you're too late in askin'."
"Mr. Peabody's coal train has hauled it aweigh."
--With apologies to John Prince
Chris
Well your going to have to wait until after the military gets their CTL plants.
But yes once or probably greatly expanded military which is right now the largest single user of oil in the world and its supporting industrial military complex thats on a war time footing gets it oil. And CTL like processes for Ammonia fertilizer and CTL for farming and expansion of coal use to replace NG fired electric plants is done. Not to mention a bit of expansion as we move to electric rail and power investments in renewables etc..
Then you will get a shot at that big fat coal bubble. I suspect you will find that its now a much smaller bubble having suffered a bit of gastric bypass surgery.
And I bet the US military does not give a rats ass about global warming thats actually the sad thing about the big coal bubble.
"Well your going to have to wait until after the military gets their CTL plants".
Amen to that.
The coal reserve estimates were a big fat lie for decades, what makes them accurate now? The current mea culpa shuck and jive confession that they had it wrong for most of the 20th century, but now, miraculously through the discovery of New Math, the coal estimate are AOK now? Please. It's still political.
The coal figures are still wishful thinking and combined with Murphy's Law and the military's heroin junkie addiction to Black Smack, the public and business concerns will get the dregs of the CTL barrel.
All talk of possible solutions to PO will be laced into the strait jacket thinking of the Military/Industrial/Congressional Complex.
The US military is ironically fighting first and foremost at the moment in the ME to secure it's own oil supply!
Talk about a snake eating it's own tail.
What's the 'bootstrap' EROI of a Ouroburos?
Charles,
Assuming a minimum EROI of 5:1 and using your graph or EROI vs price of crude, the highest price that crude can reach is $180. Do you agree?
Seems like a red line that, if crossed, may kill the internal combustion engine.
I can't speak for Charles but your first statement is incorrect. A minimum societal EROI of 5:1 could include a mix of wind, hydro, coal etc. therefore not directly linked to imported oil.
Your second line, though speculative, may not be too far from the truth...Though Europe is paying the gasoline equivalent of over $200 per barrel already (the difference being taxes) and they are doing just fine.
Everyone likes a punt at future prices if only to be wowed by the sticker shock (hehe!) so here's mine FOR THE UK:
Some assumptions:
INPUTS
1. PO "Event": 2012 (after this we see a 40% per annum oil price increase -based on average 1970s increase but yearly spikes could be MUCH higher)
2. Pre-PO inc.: 5% /year
3. Tax fuel price 'Inflator' post 2012: 2.5%
4. Post PO oil increase.: 40% per annum
OUTPUTS
YEAR: PRICE (£/litre): Tax amount(70%): Petrol/Oil costs (30%): (Oil / av. $barrel)
2008 1.10 0.77 0.33 100
2009 1.16 0.81 0.35 105
2010 1.21 0.85 0.36 110
2011 1.27 0.89 0.38 116
2012 1.34 0.94 0.40 122
2013 1.52 0.96 0.56 170
2014 1.77 0.98 0.79 238
2015 2.11 1.01 1.10 334
2016 2.57 1.03 1.54 467
2017 3.22 1.06 2.16 654
2018 4.11 1.09 3.02 915
£4.11 per litre corresponds to $37.40 cents...
-Interesting point: due to our high taxation regime (and assuming that given a crisis it would be 'moderated' as in the above example) Europe/UK undergoes an approximate 4 fold fuel price increase in 10 years, whereas the US looks 'crippled' long before it could ever reach the 10 fold $37.40 level...
-These figures will be tempered by Inflation (Dollar/Sterling decline), there must be some simple way to adjust these fwd prices back to todays prices but I have not done this -i.e. they are not 'constant 2008 £s or $s' hence some of the sticker shock...
-A fourfold increase in transport costs would imply that we are paying 25% of income in petrol (unlikely) or 60% in the US.
Conclusion: Overall demand destruction is likely to kick in long before these levels are reached. Such high prices will make Fuel efficiency a top priority as well as allow a price regime where CTL, GTL, some bio and Hybrids/Electrics make economic sense to consumers.
Regards, Nick.
Nate,
Our current transportation system cannot run on wind, hydro or coal. Converting solids to liquids can substitute perhaps 10% of our needs. I take your point about Europe, but you would need to make a separate graph and the limit would be higher due to taxes. Not sure if you can compare the price directly.
If you buy Charles' formula, I think he would agree that there is an upper limit to price. After that point, we would need to electrify transportation in the cheapest manner. I think we are going to hit that price signal before we can electrify.
Our choices are:
Charlie's first response to todays post :
Dear prof Hall! If you consider the whole chain also in coal handling as you cited in a former ASPO- conference (p 67, Beyond Oil, J. Gever et al., 1991.) ; the curve stopped in a downsloping trend near 1980 to an eroi about 1:19 which can be much worse today. Then together with the low values of oil and natural gas and the limit 1:5, already by 2015 the whole fossil era can be over. It is urgent to make plan b now a plan focused on food, feed and basical needs. The only possiblity seems to me to take part in and use selforganizing units as plants, bacteria, trees, humans, and animals. It will be the biggest and fastest transition in human history.
Bo Falk
Charlie,
opened the can indeed!! A few comments.
-I notice the EROI for nuke has increased from your (Hall, Cleveland and Kauffman)figures in the 80's. ie from 4.95 to 15 today. realistic?
- Yes the very best use of oil is the manufacture of condoms/provision of vasectomies!!!
- it is an incredible indictment that the most crucial aspect of humanities future (energy availability) is addressed part time on the net. The system does not look fondly on anything that shows its frailty.
- The use of $$ in an eroi calculation must lead to significant inaccuracies. There is no connection of $$ to the physical laws that rule all activity.
- There is a significant proportion of the human species who will never understand EROI and why the world as we know it turns to custard. (see comment above) Unfortunately we ALL suffer the consequences of energy decline.
Keep up the fight
Still looking for trout...
Professor Hall is aware of this. He specifically outlined that we don't have the data in straight energy terms and the commerce department has cut its staff assigned to this type of accounting, so lacking better data, they use the method backing into energy terms, which necessitates dollars - not great, but better than using straight dollars themselves.
Nate,
CAS Hall may well be aware of it but as you can see from other posters there is an alarming number of people who do not even begin to grasp the very basics of our existence on this planet. The fact that there is no physics equation that includes the $$ (or equivalent) sign is something that should be beaten into each and every human. And of course the Laws of physics control everything we do. But not to worry of course, nature is well prepared to undertake the necessary beatings, we just might not like it of course.
"There is no connection of $$ to the physical laws that rule all activity."
This is wrong IMHO, and shows a very limited grasp of what $$ means, how prices are determined, how the market works, etc.
Re:#11 - Prof. Hall, it's under Methods, point 4 Other Approaches:
Their use is too rare and too diffuse to summarize.
All of these methods are incomplete for many reasons, because they do not include all of the energies used to create the product or all of the energy loses due to the products’ production or use. These include, but are not limited to, the energies required to overcome environmental impacts, to support the labor used and to construct the machines and infrastructure necessary to use the energy. In addition for non-renewable energies they do not include the energy used to make or replace the energy itself, but rather only that energy used for exploitation. The inclusion of these additional energies are controversial and complex, and are not used here. Hence all EROI values given are probably minimums, in some cases substantially so.
Re:#13 - Yes. And if you didn't as well, I'd have less faith in your credibility.
thanks Clif - I have changed it.
How do you know it's "small"? How small? An over parameterized model is worthless but look at all you are leaving out in order to avoid a "computational nightmare.
And it was never very good to begin with. I'm tellin' ya, analysts make up data, it's part of their job to do so. How good is their fabricated estimates? I don't know and neither does anyone else.
This is the truest & best statement I've read on TOD in the >2 weeks I've been reading it!
Uh oh. I figured this was coming!
Seems to me like there were more people listening in the '70s than are listening today. If you have no children & believe you will be dead by the time things get too nasty, then why do you even care? How you polarize the continuum with optimism & pessimism as the two extremes depends on your values. I don't tend to like mammals very much, & primates least of all (Okay, lemurs are kinda cute). I'm optimistic that the fish & herpetiles will thrive once the ecocidal ape is extinct.
He's a bit incoherent. Apparently he's a shill for corn ethanol.
Not when you take into account all the environmental costs on the I side you don't. Not to mention the photic input.
You have WAY more confidence in the peer review process than I do. Having experienced all the cronyism involved in decisions regarding what gets published & what doesn't, I have little more confidence in the primary literature than I do in what I read on the internet. Info becomes available much faster when it's just thrown online. Let whoever's interested review what you have to say. Your CV is long enuf already.
Not sure if this has come up in the comment thread already, but it's not clear to me why we need a whole new "energy accounting" EROI framework, when we already have a perfectly good financial accounting framework. Energy is a factor of production, and the quantity/quality/etc of the energy should already be reflected in the price.* If it takes a barrel of oil (not energy equivalent, an actual barrel) to extract another barrel of oil from shale, then we don't need an EROI analysis to tell us not to bother.... the accountants will have put a stop to it already.
* There are some circumstances in which the social cost of a resource does not equal its market price, mainly for externalities such as pollution and so on, but I don't think that's relevant here.
EROEI allows one to plan what to do at peak oil.
Money accounting can (and probably will at peak oil) change quite fast, not being a reliable indicator at disruptions.
It's not clear to me why money accounting would not be a reliable indicator at disruptions... nor is it clear to me that peak oil necessarily represents a discontinuity/disruption. (and yes, I agree that oil production will peak someday and then go down to zero... and yes, it might well be primarily a supply phenonmenon, and yes that might be bad news). What's wrong with gradual collapse? :)
Again, this assumption that "the market can't handle it! the market can't handle it!" seems pervasive to me, and I'm not convinced. Markets can fail to reach the best outcome (of course) due to externalities, etc, but it's not clear to me why they'd fail here.
I think that the use of conventional accounting techniques (whether it be private accounting or 'cost benefit analysis' as practice by a policy analyst) is somehow being confused by many here with "being a free market fundamentlist" who thinks that markets never fail. Nobody wants to be a free market fundamentalist (I'm not), therefore people think they need to throw out the baby with the bath water and dump financial accounting and economics too. This is not necessary IMHO, and it continues to look to me like this whole EROI exercise is an error-prone waste of effort that is not going to convince anyone other than a tiny band of economics-distrusting devotees.
As an aside, and I suppose I should be used to it, but it is a little annoying to read the various swipes at allowing the market to function from people who don't seem to understand how the market works, what prices represent, etc. Comments about how the current credit crunch shows that we can no longer use financial accounting to evaluate projects or comparing an interest in market economics to a belief in the Easter Bunny, etc, are just completely off base.
(The opposite sin is often committed by free market fundamentalists who assume, without reference to underlying physics or geology, that "the market" will solve our energy problems and make for an unbroken flow of human progress. This is not what economic theory actually states BTW.)
As someone else wrote... it is very easy to get this kind of accounting wrong (whether it's in joules or $), mainly by double- and triple-counting various inputs, or not counting some things, etc. I see no benefit in inventing a whole NEW system of accounting based on energy, full of new ways to screw up, unless the old method of accounting based on $ is shown to be inadequate. To do that you'd have to properly understand the old way first of course, and since many of the people pushing EROI appear to actively hate, fear, and mistrust conventional accounting and economics, they are not well placed to do so IMHO.
a)Anyone who DOES understand how the market functions will by definition NOT know how it functions in a world of incredibly expensive energy. Economics uses correlation/causation and treats these historical relationships as fact. Except that all these historical relationships occurred with incredibly cheap energy. Energy allows us to do work, not economics. Dollars are just the intermediary step and have value because we agree they do.
b)The market would be working better in this situation if there was 'full information' regarding oil, which is a core assumption of walrasian welfare economics. We have terrible information on oil, which is part of the reason the 'experts' have been wrong 7 years running (see Glenn Morton). only 6% of worlds oil is owned by multinationals. tough to get good data on the rest, which is why market will not provide adequate lead time to make changes.
c)Supply is one thing, but the market IS fundamentally flawed on its demand assumptions. Economics assumes we are rational actors, or at least boundedly rational, but we are anything but. An EXCELLENT new book, (which has made it to the bestseller list) by MIT Economist Daniel Ariely, called "Predictably Irrational", lays out this argument in a very lucid, interesting way, showing how marketing tricks us into choosing, when the choices are totally incomparable. We are concerned about the 'relative' not the 'absolute'. (Ariely never gives the evolutionary reasons why this is so).
But economics is ingrained in our political system, not vice -versa, so to adequately debate you would derail from this thread. I will try and write something coherent on the topic as a keypost. By the way, Dr. Hall has a new textbook out on Biophysical Economics - perhaps I could persuade him to do another guest post on that related topic.
d)IF the world central banks respond to the credit crisis by nationalizing banks (which is in effect what happened with Northern Rock, and Bear Stearns), money comes from nowhere - there is no accounting for the money that the central bank or government may create to pay for problems. An extreme example of this was Weimar Germany. If we use truly physical terms (which we can't sadly), those would give static (e.g. not moving) signals where monetary data will give different signals each year (and maybe each day).
e) furthermore, if the credit crisis results in a depression, and the market via the marginal barrel goes back down to $70-$80 oil, this will send an incorrect signal to all the renewable industries that need high oil prices to be competitive. Of course, during said depression the world will still be using close to 30 billion barrels per year of the increasingly scarce oil, though it may not 'seem' scarce at that point. It will also send signals to oil drillers to stop exploring because it is now not profitable. It will also make borrowing more difficult for the marginal oil and gas player via tightened credit restrictions. All of these things will result in a steeper decline rate once the economy reloads.
The market is a powerful thing and many aspects of it have worked quite well, and could continue to do so. But given that we now live on a planet full of people, with increasing wealth disparity, and with increasing resource limits (water, energy, GHGs), it needs a tune up at minimum.
I'm finding this exchange very interesting (exploring the limitations of economic analysis is a budding interest of mine). This response will be quite brief due to time constraints...
1. It does not seem to me that economic cost/benefit analysis (the area of economics that EROI wants to supplant) makes any particular assumption about cheap vs expensive energy. (Many areas of economics do... macroeconomic production functions, for example, typically just have labour and capital, but that's neither here nor there).
1a. In b above, you seem to be assuming that you know something the market doesn't.... "oil is running out and we have to do something about it, but the market doesn't know!" I would also suggest that $110/bbl oil argues against "the market doesn't know".
2. The Ariely book looks interesting, thx. will add to the list.
3. Credit crunches, inflation, etc, are not relevant for cost/benefit analysis.... it's the relative, not absolute, prices of inputs and outputs that are relevant.
4. I don't understand e... I don't understand how price could drop while *need* (ie quantity consumed) remained constant. (think econ 101 S/D graph). You seem to be assuming that everyone will be completely faked out by a temporary drop in oil prices except for you...all those dumb oil drillers and solar panel builders can't make oil price forecasts as well as you can, and therefore they won't do the "right" thing. Once again, you seem to feel you know something that nobody else does. With respect, I find this unconvincing.
Mark Thoma wrote an interesting article a while back (probably posted here), titled "talking to an economist about peak oil" that I found interesting. He made the point that a lot of these sorts of "market distrust" points of view seemed to rest on assumptions of widespread incompetence.
Excerpt from Charles Hall's textbook: "We pay for imported oil in energy as well as dollars, for it takes energy to grow, manufacture or harvest what we sell abroad to gain the foreign exchange with which we buy fuel."
This is exactly the kind of trouble you can get yourself into when you start messing around with inventing new accounting systems (esp. with an imperfect grasp of the old one). We don't pay for any imports "in energy as well as dollars"... it's one or the other. The dollars we earn with exports reflect the value of the export, and also reflect payments to factors of production of the export. Let's say we export a $100 doo-dad and import a $100 bbl of oil. Payment of factors of production is as follows: $5 worth of energy to make, $40 for labour, $20 for materials (of which $5 is more energy), and $35 for profit. If you say "we paid $100 for the bbl of oil, plus $10 for the energy needed to make the doo-dad", you are double counting the energy.... that is already included in the $100 price of the doo-dad (it must be otherwise you couldn't afford to sell the doo-dad for $100).
Darren,
I think Professor Hall's phrasing has led you to misunderstand his point. It seems to me that you've concluded that he is saying 'dollars PLUS energy', while I believe the point is that the dollars used to pay for the imported oil are earned on the basis of an expenditure (use) of energy.
As for a 'new accounting system', I believe it is desparately needed, though not to supplant the existing system in all regards. When policy makers are faced with decisions which have important medium and long-term consequences, the current range of cost/benefit analyses frequently fail to predict the economic fallout, indeed the viability, over time of the options being considered. (Despite x's and kollisio's ravings, ethanol mandates come immediately to mind, but there are many others from land use decisions to tar sands policy.) Indeed, the failure (to predict) rate is so high, that we might wonder if successes are accidental.
EROI analysis will not make the world perfect, but it will add a valuable tool to a species that finds itself stumbling forward propelled by present inertia. Measured with the current 'accounting tools', the ongoing massive accumulation of capital concentrated around Fort MacMurray makes sense. EROI analysis on the other hand puts into perspective the enormous opportunity costs associated with this deployment of capital in the tar sands. The capital could be employed in insulation, in durable construction, in district co-generation plants using renewable local biomass, in efficient and durable transportation options, and so on, all options that result in significantly and permanently lower energy consumption, while maintaining high levels of personal comfort and mobility, thus optimizing local and regional labour markets, for example.
Many people, even policy makers, intuitively recognize the benefit of these latter options, but current accounting procedures invariably find them more expensive than some variation of BAU, and most often financially non-viable. Current accounting procedures allow us to rationally deny what many intuitively know to be true. Our current accounting kit tells us that a stitch in time does NOT save nine, but is rather a waste of our money. It fails to tell us which straw will break the camel's back, but does encourage us to increase profits by continuing to increase the load.
An additional analytical tool like EROI analysis would force a reexamination, and, I believe, promote the restructuring of an array of policies, especially including taxation and skills formation, which fundamentally affect economic behaviour.
Ultimately, the problem lies in the mechanistic analogue of modern economics, a discipline that thus far has failed to grasp, except in a limited and often distorted use of a depreciation mechanism, the significance of the Entropy Law.
My hound is demanding to drag me around the neighbourhood.
This seems to prove my point....it is my understanding that ethanol is a failure from an economic point of view as well (it requires subsidies, which implies that the value of the ethanol is lower than the value of the required inputs) as well as from an EROI point of view. Ergo, why is the EROI analysis necessary?
This deserves a careful response.. the outline of which would be: what makes the bolded options above 'better'? Properly applied cost/benefit analysis (like financial accounting but takes externalities etc into account), evaluates projects based on what people actually value (not what we wished they would value). That seems to me like the best basis for project comparison, better than any other. For one thing, many of your proposed capital uses do not address the number one purpose of oil - transportation, ergo they are impossible to compare on an 'energy basis' - you're comparing apples to oranges and pretending they are both apples. (the VALUE of apples and oranges, OTOH, can quite easily be compared, which is how your preferred projects lost out to Fort Mac).
Why is lower energy consumption better if that's not what people want? You're worried about depletion, etc... but the price mechanism automatically takes care of that by scaring people away from energy consumption as energy becomes more difficult to produce, n'est-ce pas?
I am extremely skeptical of such a line of reasoning.... this can be used to justify all sorts of nonsense and special pleading it seems to me. With respect, I think this translates into "current accounting procedures allow us to rationally deny what I, personally, would like to see happen"
* This is a rough post... I'm actually glossing over a few things here.... perhaps externalities were NOT taken into account at Fort Mac. CBA evaluates willingness-to-pay, ergo it's not what "people" value... it's what "people who have money" value.... there are analytical techniques to try to correct for this.
Darren,
The need for subsidies (or mandates) does not in itself discredit a policy choice, especially at the time the policy decision is made. Such a need can arise because at any point in time, the policy maker is faced with a given set of financial rules, labour skills and so on. Experience bears witness to situations in which the policy maker is faced with competing options all of which require some type of market interference and all of which carry long term consequences. Given proper data collection, EROI analysis offers the policy maker information otherwise unavailable. It is a tool which enhances judgement.
How do we determine what people actually value? Current consumption patterns (voting with your dollars), like opinion surveys, provide a snapshot in time, and even then are only as good as the individual's access to and use of information. And then the expressed choice of any set of individuals is interpreted by the agency preparing the cost/benefit analysis. Moreover, those analytical techniques used to try to correct for distortions created by the existence of large numbers of people without votes (dollars) again are subject to bias.
Just as an EROI analysis can be biased by the selection of boundaries and/or the quality of available data, current cost/benefit methodologies based upon some abstraction of 'what people want', always involves an arbitrary selection of who the 'people' are.
There is no way to escape the need for judgement.
In the matter of comparing apples and oranges, and even the good old turnip, consider the use of pelletized bio-mass to heat and provide electricity via a district co-generation plant. The biomass normally displaces a petroleum product, which could otherwise be used in transportation, though at this stage I would counsel leaving the petroleum in the ground.
Non, ce n'est pas vrai. The price mechanism does not protect the resource for future generations. This is precisely why current ideology and its dogmatic high priests insist on the notion of infinite substitutability. This is a notion that exists in denial of the Entropy Law.
Overtime, we see that we have made poor allocative choices, but upon review of those decisions, we can't help but conclude that they were rational on the basis of information available and values current when made. To minimize this problem, the scope of information needs broadening. That, to me, is what EROI analysis offers, which is not to say that it is sufficient.
Reason alone will not solve our problems. And this is why I believe that it is time to reconsider the idea of God, or at least to approach the question of ethics.
Some readings: Tom Harpur, 'The Pagan Christ' and 'Water into Wine'; Chris Hedges, 'I Don't Believe in Atheists'; Charles Taylor, 'A Secular Age'. All three thinkers, I should note would be denounced by most of those who pass for 'religious leaders' today, especially in the USA. None believe in some entity in the sky with which anyone can have a personal relationship. This is about reflection on the human predicament, about what we need to help us face 'the destructive forces within human history and human nature' (Hedges' phrase, who I might add is very peak oil aware).
moved...
A few things I haven't seen here:
1. Mention of the notion of "quantum efficiency". We use all of these forms of energy (coal, crude oil, gasoline, natural gas, solar, wind, geothermal) to either do mechanical work directly (as in the internal combustion engine) or to create electrical potential energy. No process will give 100% return on the investment; i.e. energy will be lost to friction, the BTU content of one form of energy will be lower, energy will go into phase changes, and so on. We talk about the EROEI of crude oil, but no one uses crude oil to run their car or heat their house. We should be talking about the percentage yield of the conversion process from crude oil to gasoline, for example, and the quantum efficiency of this process. Various catalysts can be used to alter the quantum efficiency for this process. Finally, when we've figured out the EROEI for gasoline, we can then estimate the Energy Return on Energy Invested when we figure the mileage per gallon per weight moved a set distance.
2. Amortized cost of the physical plant required to transform, store, or convert various forms of energy into mechanical or electrical energy. Most coal plants for electrical generation have planned lifetimes of 30 years or so, after which they are taken out of service or rebuilt. The same goes for nuclear plants, and both have associated costs for storage and treatment of wastes, such as coal ash and spent fuel rods and radioactive components. Same case for oil refineries and uranium enrichment plants. I see a lot of analysis of the costs of extraction and mining, but that's only a first step. Very few raw fuels are immediately usable to create mechanical or electrical power. Even coal must be pulverized and turned into a slurry, with addition of various other compounds to enhance the percentage burned.
LoL This will get you hated on for pointing out. It violates some TOD cultural taboo. People will go all Amish on you for it. You'll be shunned as a pariah by the regs. Welcome to the ranks of the outcasts! :)
moved...
The argument that there is an energy gain on imported oil for the United States is patently false. It is preposterous. If it were true, why are we continuing to import larger and larger amounts of oil? The United States runs huge and growing trade and fiscal deficits. The whole economy has been kept afloat by funny money bubbles like the dot come bubble and the real estate bubble for the last 10+ years. Now we have a recession during war time, an almost unheard of situation. It is the negative EROI of imported oil that is a major factor causing the downturn. Saying imported oil has a positive or order of magnitude energy gain is like saying I produce energy when I drive my car.
The concept of a positive EROI for imported oil shows what a flawed idea EROI is. If it can't get it right on such an obvious major thing as imported oil for the United States, why should anyone pay any attention to it when applied to ethanol for example? Fortunately outside the insulated world of the EROI believers, no one does. EROI is a fatally flawed concept because it compares energy apples and oranges. It ignores relevant factors like price, utility, renewability and locality. It is only valid in tightly controlled comparisons where like and like are being compared thereby limiting the errors of omitting price, utility, renewability and locality.
Those who are advocating using EROI as the bases for deciding resource allocations as with ethanol or electricity are making gross logic and reasoning errors. If they can not see this, anything they say must be put under the highest scrutiny.
Dear Prof Hall, I'm rather short of time right now but hope to join this debate more actively next week.
I have one query relating to your table and that is the eroei figure of 1.6:1 for concentrating solar power (CSP). Having played around with a magnifying glass last summer (on the day that the sun was out) I found that I could burn both my hand and wood very quickly. Intuitively this seems a very simple means of gathering solar energy and a number of us had assumed that the eroei would be very high. I'm aware that Dave Rutledge is enthused by this technology and its deployment in SW USA.
Are we reading from the same hymn sheet here? If so, and your figure is correct, then CSP has no future. Would you care to comment.
If Energy Invested in obtaining an energy source, such as oil, were truly all encompassing and complete, it would have to include the 'military protection' component expended in assuring the delivery of the energy source to the point where it was going to be utilized.
As an example, if you were drilling in a very hostile environment, say like where people were shooting at your drilling rigs and crews and supply lines day and night, and you had to deploy 'protective services' to keep the mayhem at bay long enough to extract and transport the energy source from the region, that 'protective service' component would have to be included in the EROI of that energy source. If not the ensuing violence would assure that the energy source never arrived at it's use point.
If the US has to deploy enormous 'protective services' to ensure that ME oil arrives at it's use point, a certain pro-rated amount of the military's energy budget needs to be assigned to the EROI of that oil. The oil would be DOA if that military expenditure were not used. And since the US military is the largest single entity using oil energy in the World, assigning part of that 'Energy Invested' budget would probably take a huge bite out of the EROI for ME oil to the US. How could it not.
The military 'Energy Invested' is no different than accounting for the additional Energy Invested in over coming the hazards of deep sea drilling or climate hazards from the North Slope. So how come everyone is so mute on the huge chunk of the US military's energy budget expended in assuring delivery of oil to the US? It is just as much a part of the EROI equation as other factors that are added into it.
If Memmel's theory about TEROI is correct and the EROI needed is actually three times the size above and beyond the minimum required for a society's energy sources to be self sustaining over the long run, who knows were that would put the EROI of US military protected ME oil.
Underwater as far as self sustaining over the long run (Long Emergency)?
Endless war is part of EROI.
LH, you make an excellent point. Loathe as I am to mix dollars (a human construct) with energy (a real, physical thing), I do recognize why Prof. Hall has been forced in instances to do so, as the energy data just isn't available, so I offer the following in the same spirit. I took a brief look at this in my master's project 15 years ago. At that time, I found several studies that placed the cost of military protection of 'our' oil at about $60/bbl, at a time when the market price was about $12/bbl. What that means, in very elementary terms, is that if the EROEI of oil without considering the military effort (I use the word effort because it implies an expenditure of hard energy rather than just of soft dollars) was then say, 50:1, including the military aspect would make it more like 10:1. I know that's very rough, but it supports your point. All those carriers and F-15's use a lot of energy to keep drilling platforms and tankers in business. Of course, that requirement is due only to human politics, and could theoretically go away in a peaceful world, whereas the real costs of drilling through rock and keeping platforms steady in roiling seas would always exist. So I think the military energy costs should perhaps be calculated as an addendum to base EROEI. But I agree that it's an overlooked issue. And that $60/bbl early 90's cost was a baseline, yearly estimate that did not include the costs of Gulf War I, so to scale it up to today's reality, it would have to be not only inflation adjusted to today's dollars, but then have added to it the costs of Iraq. As I've said elsewhere, I think the decline in EROEI, esp. when one includes all ancillary costs on the input side, such as this BIGGIE, underlie the whole mess we are seeing unfold about us, economic meltdown, food shortages - in a word, collapse.
Very good post. Forget the sun, then, but DO include military costs along w/ environmental & aesthetic costs on the I side. Discounting ancillary inputs makes EROEI analysis meaningless.
Does the market include those ancillary inputs?
EROI is no panacea. All it is is a step in the right direction of incorporating physical inputs. In my paper this month in Journal of the Human Environment, my coauthor and I outline a framework that necessitates including environmental impacts in net energy analysis. This is all 'evolving'. But something will need to replace economics as we run out of space, resources, etc. - or should all 6.8 billion of us just acknowledge that we are eocidal apes and get it over with??
I think most of us realize that we need energy to procure energy, and that on average depletion trumps technology over time, resulting in less energy surplus for non-energy society (which includes the environment). Beyond that, each of us 'defines' EROI, and its importance consistent with our own particular experiences and world views, which are clearly not commensurate. EROI is a shotgun, not a rifle. But its better than an airgun.
I find it interesting - a bit baffling & a bit humorous at the same time - that someone assumed that since I was critical of EROEI analysis I must be pro corn ethanol. I'm not, even tho I'm currently working at an ag science center where research on biofuels is conducted. Neither do I have much "faith" (which is what it requires) in markets to sort things out. If humans were perfectly logical & omniscient then the marketplace might prove the optimum arbitrator of value. I agree with you that ERO(E)I analysis may be a step in the right direction, if done right. I'm looking forward to reading your paper on how environmental impacts might be incorporated in net energy analysis. If all ancillary inputs are included & EI is seen to be orders of magnitude greater than ER, different energy sources can STILL be compared. Of course, their rankings may be considerably different than they appear to be with ancillary inputs excluded. The rankings with inputs included should be more realistic, and thereby more useful. This is what I've been trying to say all along.
People should recognize that ecocidal apes are what we are. A cannibal species of African ape that has wiped out, and eaten, our confamilials. This doesn't mean that I recommend that we should "get it over with" via mass nuclear suicide, or whatever. I have three kids & a grandchild. I'd like to see some sort of soft landing, for their sake along with that of the Ocean Planet's biodiversity, to which my chief fealty is given. It's just that I don't have much of an expectation that the landing is going to be anything but really, really hard. Populations that overshoot K crash. Human population has overshot K by my reckoning, by ~1.5 orders. The crash landing is going to break our species' legs. The broken legged primate isn't going to be able to forage and predators (famine, war) will take it down.
You are certainly correct in stating that "each of us 'defines' EROI, and its importance consistent with our own particular experiences and world views, which are clearly not commensurate." This is really a restatement of the point I have been trying to make. What I value and think should have prominence on the I side others may be perfectly content to disregard altogether. I just don't see any consensus being reached on how to value ancillary inputs. I see posters for whom thorium fission or electric trains or oil shale deposits or EROEI analysis, or even corn ethanol, would be the panacea. Bandaids on a hemorrhage from a compound fracture severing the femoral artery. The fear is palpable. I applaud your & Dr. Hall's efforts to improve EROEI analysis & make a contribution. Just because the effort is futile is no reason for you to not make it. My best wishes for us all, Nate.
Thanks for confirming the thoughts on how military energy is left out of the EROI equations, especial here at TOD.
$60/bbl early 90's cost was a baseline
If this is even close, and those concerned were forced to include this in their EROI analysis, it would put the EROI of imported oil into the US into the Negative.
Of course, that requirement is due only to human politics, and could theoretically go away in a peaceful world, whereas the real costs of drilling through rock and keeping platforms steady in roiling seas would always exist.
I don't at present have even the Slightest hope that the $60/bbl military/ancillary EROI input will go away, and hence, anyone serious about using EROI as a tool for policy makers had better damn well wakeup and smell the java on this particular input.
It dwarfs many other inputs that seem in get an inordinate amount of attention here at TOD.
I don't at present have even the Slightest hope that the $60/bbl military/ancillary EROI input will go away, and hence, anyone serious about using EROI as a tool for policy makers had better damn well wakeup and smell the java on this particular input.
Nor do I. So again, I agree with your point. I'm reminded of the closing scene from (I think) The Oil Factor, which showed acre upon acre of US military hardware arrayed across the central Asian steppes. Chilling. We are caught in a tragic game of last man standing, I'm afraid, and I also don't have (much more than) the slightest hope that whatever we do here will change that in any significant way. One day fairly soon, not only the 1500 mile Ceasar salad, but the java will be going away, too...
$60 per barrel * 20mn barrels per day * 365 days would equal $438,000,000,000 being spent for US oil alone. If you added other country's oil (hard to just subsidie part) and then adjust for inflation and the cost of energy used by the military the number would dwarf the entire US budget, let alone military.
This sounds like a political construct, not an analytical one.
The sugar/EROI thing seems to present a fascinating possibility in the shorter term alternative fuel arena. When you survey all the worthwhile EROI transportation fuel sources that don't come from fossil sources, and that don't need decades of technological breakthroughs to be usable yet, you wind up with pretty much just one - manually produced sugar feedstocks such as molasses per the Brazilian model. All the other grains are too low in net energy. Cellulosic is many years of R&D away.
LNG as motor fuel per the Boone Pickens model is fine, but it's fossil, approaching peak, and imported from many of the same geopolitical problem areas as oil, and much more of an infrastructure build problem than the relatively quick and cheap proliferation of ethanol plants.
The problem with all the world suddenly putting sugar petro in their gas tank is, of course, it would quickly place too much demand on Brazil's sugar crop and the price of molasses would go to the moon. But what if many more countries with roomy areas of similar sugar-friendly cropland were to get in on the ethanol boom? Already, over 60% of the world's ethanol is made from sugar. The U.S. is the village idiot who uses corn. Stuart's bubble chart on energy consumption vs agri population can also be seen as where in the world are the users vs producers of biofuel:
As you can see, there is a strong inverse relationship between low energy use manual oriented agri production, and the high energy users. It's not just Brazil that finds itself in this position. If more of these governments wake up to peak oil like Brazil did 30 years ago, you could see quite a bandwagon form between the big blue circles at the poor end of this spectrum and the small blue circles at the rich end. Much of the massive flow of money from the big fuel users could be diverted away from the rich Middle East and to the poor developing nations that more desparately need it.
Many of the large sugar producers are also the large consumers food-wise. But if sugar based ethanol were to become a lucrative cash crop, they maybe would be switching to corn syrup and NutraSweet en masse! According to the USDA, two of the top four producers of sugar are India and China - the two big mega circles in the graph above. If you look at who are the big sugar producers in the world before any oil issues came along, you see this:
The top four are all on the upper part of the curve above except the EU. But the EU acts as middleman for many other countries that are in the same area as those other top 3. They have the African, Caribbean, and Pacific (ACP) program that imports raw sugar products from 17 countries, processes them and sells to the rest of the world.
If enough people come to an understanding of our net energy situation, sugar could become a lucrative cash crop all over the world, not just Brazil. After all, Brazil was waking up to all this 30 years ago - the canary in the mine shaft.
Cane sugar ethanol: A better panacea than corn ethanol, fer sure. Still a bandaid. Cut the rainforests & grow sugar cane. Good idea!
There doesn't appear to be any evidence that sugar cane production is leading to significant deforestation. In my close to two decades living in the tropics, I have found that the primary cause of deforestation is logging. Crops may be planted there afterwards, but that doesn't make them a cause. However, it seems that soy and palm oil do seem to be causing deforestation. But not cane.
Let's see... Did they clear the forest for the logs then once the land was cleared decide to grow sugar cane on it, or did they decide to clear the land to grow sugar cane and since the logs were already cut decide to mill lumber from them? Hmmm... I guess the point is that since they're growing sugar cane on deforested land now, the forest isn't going to come back. Sheesh... the level of dialog in here sometimes...
Indeed. You started with a falsehood, then intentionally twisted my correction into an ad hominim attack, all the time avoiding the issue.
I suggest your be put up as an example of bad commenting practice.
I said the primary cause of deforestation is logging and that afterwards crops are planted in the empty land, although this is usually frequently palms or soy, not sugar cane.
I advise you to stick to topics that you know about and make conclusions that you can support with an actual argument, at least for your first month.
I am encouraged to hear that you have not been impressed with the dialogue during your first month here. Maybe you will stop coming back.
Let's see... Did they clear the forest for the logs then once the land was cleared decide to grow sugar cane on it, or did they decide to clear the land to grow sugar cane and since the logs were already cut decide to mill lumber from them? Hmmm... I guess the point is that since they're growing sugar cane on deforested land now, the forest isn't going to come back. Sheesh... the level of dialog in here sometimes...
You have not made a positive contribution to the level of dialog here.
Alan
I thought most of the time they just burned out the forest because the timber was not valuable enough to process into lumber, or even chopsticks.
Not all lumber is valuable tropical hardwoods. Some is just softwood that is chopstick fodder. Some is not even consistent enough for that.
The top three sugar exporters are Brazil, Thailand and Australia. EU production is massively subsidized and not produced from cane. Also a recent WTO ruling has cut the subsidies and so I expect a more recent chart would show much less from the EU. China is a huge importer. India is close, but regulated the sector tightly.
The leading contender for the next Brazil is Thailand.
I am increasingly frustrated by arguments that focus on the "embodied energy" or energy in general as the important measure of performance for energy technologies. The primary energy per kWh of a hydro plant is three times less than that of a coal-fired plant; but, the GHG/kWh is more than 10x different! Looking at EROI or EPBT alone does not give us valuable information for decision making about these technologies. I propose that if we are concerned about the use of oil specifically, then we use a metric that reflects that - like "energy from oil return on investment" (units of oil-energy saved for every unit of oil-energy invested). I have written a conference paper proposing, instead, the use of a greenhouse gas metric for decision making: "Greenhouse Gas Return on Investment: A New Metric for Energy Technology".
Pr Hall, Nate,
I cannot do otherwise than express my admiration towards all the hard work you have put into this work. I don't know if anyone has already tried to make an EROEI assessment. I have, and I can tell that it requires a huge lot of sifting through papers, spreadsheets, conversions of unities, sorting out of data which can quickly get you lost.
I think the idea of EROEI of imported oil as being a very clever one. I had to get used to the concept of energy intensity first. Since this kind of data is much easier to obtain than that for a modern fischer-tropsch plant, I tried to replicate the calculation for France. I thought I would have to correct for the huge trade deficit in France, but then I remembered that this should be included in the GDP figure (which is supposed to subtract the amount of importations and add the amount of exportations).
Here goes for 2006 :
GDP : 1792 billion € (euros)
energy supplied : 273.2 million tonnes of oil equivalent
average price of brent crude : 65.1 $ or 51.6€
(at an average conversion €/$ rate of 1.26$) per bbl. About 387.5€/tonne of oil (counting 7.5 bbl per tonne).
EROEI of imported oil in France in 2006 = 17 if I didn't make a mistake. This is because of an economy which seems to be a lot more energy efficient than the US but also because of the Euro screening Europe from a part of the crude increases and because of the brent beeing a bit cheaper than the WTI.
references :
national energy statistics (by ministry of industry)
INSEE (national accounting statistics)