US Natural Gas Prices: "The Fix is Underway"
Posted by Gail the Actuary on April 22, 2009 - 10:26am
Figure 1: Future gas production based on final rig count drop
Source: Chesapeake Energy
-Click to Enlarge
"The fix is underway" says Chesapeake Energy in their April Investor Presentation. What they mean is that natural gas prices are going back up this winter. The number of rigs drilling for natural gas is going down. Fewer rigs means fewer new wells and eventually less natural gas and higher prices for consumers.
This is the third article investigating the possibility of a spike in natural gas prices during early 2010. In this article we look at the scenarios Chesapeake has created based on the how low the drilling rig count goes (shown in Figure 1). And we dig a bit into the other factors that could increase or decrease demand for natural gas.
Quick Summary
As a kindness to those who are busy planting tomatoes and just want to know if they should order wood pellets for next winter, here is the quick version: The number of rigs has already fallen enough to cause natural gas prices to rise next winter:"CHK sees U.S. natural gas prices at Henry Hub averaging $4-6/mmcf in 2009 and $7-9 in 2010 and beyond"
We don't yet know if drilling will be cut back enough to cause a spike into a higher $12-$13 mmcf range (like prices did in 2005 after Hurricanes Katrina and Rita).
The Spike-Dip-Spike Pattern
The last 10 years have shown a repeating pattern of natural gas price spikes and dips (covered in more detail in Anatomy of a Natural Gas Price Spike).
Figure 2: Natural Gas Wellhead Price and Production Cost
Source: EIA and Credit Suiss
-Click to Enlarge
High prices cause users to cut back on natural gas purchases and encourage more wells to be drilled. Eventually these cause an excess of natural gas and prices fall into another dip, setting up the next spike and repeating the pattern.
We are currently experiencing a dip after the 2008 price spike. (Just past arrow 5 in Figure 2). The current well head price for natural gas is far below the average producing cost, meaning that most natural gas producers cannot make a profit at these natural gas prices, and for this reason they are drastically cutting back the number of drilling rigs.
Balancing the Market
The question is how many rigs must be cut back to balance the market? And what further cut in rig numbers would cause a price spike?Chesapeake put together some scenarios and published them in their March and April 2009 Investor Presentations. They lay out their logic for calculating the balance point:
2008 U.S. gas production YOY increase of ~7%, or ~4 bcf/day
2008 natural gas rig count averaged ~1,500 rigs - this overcame first year depletion of ~25% and generated growth of ~7%, for a combined ~32% addition rate
If natural gas rig count went to zero, then all would agree this ~32% number would also become zero
So, if natural gas rig count goes down by 50% in 2009, CHK believes industry will lose nearly 40% of this ~32% production capacity increase, through which ~7% growth disappears and ~7% production declines appear by 2010.
So, YOY growth of ~4 bcf/day in 2008 will soon give way to a decrease of ~4 bcf/day, setting up a big price rebound in 2010 and 2011 if U.S. economy does not materially weaken from here
Figure 3: Decline Rate and Production Increases
Source: Chesapeake Energy
-Click to Enlarge
Figure 4: Future gas production based on final rig count drop
Source: Chesapeake Energy
-Click to Enlarge
Here I have added a red bar that allows easy comparison of when supply has fallen to or below 53 bcf/d in the last 8 years.
Figure 5: Past periods of low production
Source: Chesapeake Energy
-Click to Enlarge
Current US Rig Count
Baker Hughes reported the gas directed rig count was 760 on April 17, down 30 from the prior week.Johnson and Rice Co pointed out that the most productive rigs are shale gas rigs (discussed in Natural Gas Supply and Demand Balance). Those are mostly horizontal rigs, and Baker Hughes reports that the number of horizontals dropped by 11.
Where will the rig count end up? The last week showed a drop of 30 gas intent rigs. Does this mean that we are no where near bottom yet?
Smith Bits also keeps rig counts and they track how many rigs are setting up or tearing down. The totals for this week were 38 gas rigs setting up and 56 tearing down. We can expect the rig count to continue falling.
If those rigs do come down next week then we will have passed the 750 rig balancing point for the market and prices should recover early 2010, assuming Chesapeake's assumptions are correct. There are contributing factors, and we look at several of them next.
Contributing Factors
Johnson and Rice Co provided a list of additional factors that will adjust the supply/demand balance:Avg. LNG Import Increase: 0.5 Bcf/d
Avg. U.S. to Mexico Export Drop: 0.5 Bcf/d
Remaining Industrial Demand Drop: 1.0 Bcf/d
Canadian Import Drop -0.9 Bcf/d
GOM Production Return 0.9 Bcf/d
Steepened Decline Curve Effect: -1.3 Bcf/d
We are going to take a look at the steepened decline curve, the industrial demand drop, and add to this list: curtailments of current production.
US Decline Rate
Chesapeake provided Figure 6 on US Natural Gas Decline Rates using data from IHS Energy. It shows that the current underlying decline rate in 2008 was ~24.5% and the first year decline rate was 44.1%.
Figure 6: US Decline Rate vs Year
Source: Chesapeake Energy
-Click to Enlarge
From the CERA Press Release: "Technology Drives North American Gas Renaissance:"
"Given the increased productivity of unconventional wells, the study concludes that it is not necessary to increase drilling activity to maintain - or increase - production. After years of developing unconventional gas with its long-lived production, in the aggregate, the average decline rate will fall. This means, the study says, that a smaller quantity of new production is required to offset natural production declines."
This is in direct contradiction of JRCO which has said "We believe that the aggregate U.S. decline rate has increased from 28% in 2006 to 31% in 2009."
I must admit it is very hard to understand how unconventional wells with a first year decline rate of 60% or greater can push the national decline rate lower.
Figure 7 shows an earlier analysis by EOG Energy using IHS data. That analysis agrees with JRCO and projected a slowly increasing US decline rate.

Figure 7: EOG Energy US Decline Rate vs Year
Source: EOG Energy
-Click to Enlarge
One possible explanation is that the sheer number of new wells drilled has created a low decline rate cushion. You can see from Figure 8 that wells begin with a high decline level and slowly fall to a lower and lower rate over time (producing less and less gas however).
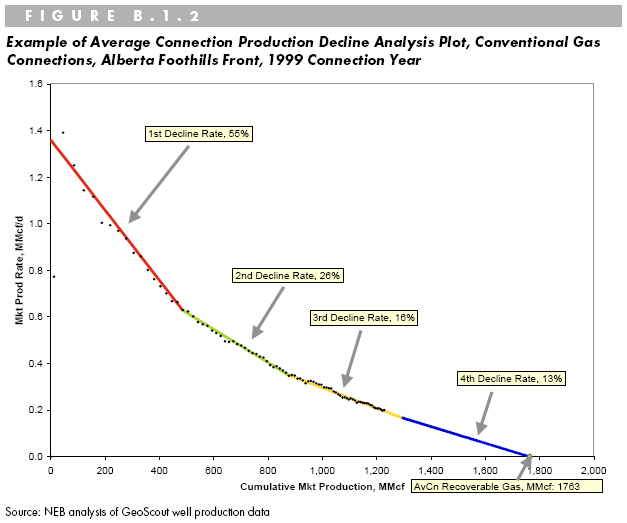
Figure 8: Typical Natural Gas Well Decline Plot
Source: Canadian National Energy Board
-Click to Enlarge
In any case, if these more pessimistic estimates of the base decline rate are correct, then a drop to 750 drilling rigs will over correct the market into a supply shortage.
Industrial Demand
With GM declaring bankruptcy and many other manufacturers shutting down, it is critical to include some estimate of the falling demand for natural gas in the industrial sector.JRCO found that industrial utilization and natural gas usage were tightly correlated and that historically a 1% drop in industrial utilization caused a 1% drop in industrial natural gas demand.
JRCO provided Figure 9 showing GDP and Industrial Utilization. I updated the chart with the April 15th Federal Reserve Statistical Release on Industrial Production and Capacity.
Industrial Capacity has fallen to 69.3%, which is a new historical low since data collection began in 1948 and 11.7 percent since first quarter 2008.

Figure 9: Industrial Capacity Utilization
Source: Johnson & Rice Co
-Click to Enlarge
JRCO also offered the very interesting Figure 10 on the history of Industrial Utilization.
Figure 10: History of Industrial Capacity Utilization
Source: Johnson & Rice Co
-Click to Enlarge
James Hamilton made the argument that the 2008 oil price spike was enough to cause the current recession. Counter arguments have been stated that if the oil prices caused the recession, why didn't demand spring back after prices fell? I think it is clear from this Industrial Capacity History chart that it takes a long time for demand to recover.
Curtailed Production
Another factor which could cut short a price spike is that gas companies may have wells they have shut in and are not producing. They will turns these wells on as prices rise allowing a rapid flood of natural gas to enter the market much faster than an increase in drilling could respond.Here is a statement from a Chesapeake Energy press release:
OKLAHOMA CITY--(BUSINESS WIRE)--Apr. 16, 2009-- Chesapeake Energy Corporation (NYSE:CHK) today announced it has elected to curtail approximately 400 million cubic feet (mmcf) per day of its gross natural gas production due to continued low wellhead prices. The reduction includes the 200 mmcf per day curtailment of natural gas production previously announced on March 2, 2009.
Oil Drum posters have been skeptical about how much production has really been shut in, given the cash flow needs of these companies. However, assuming the production has been shut in and other natural gas companies have followed suite, then there could be a bcf/d or more of natural gas production waiting to turn back on for high oil prices.
It is also likely that if storage reaches capacity there will be no choice but to shut in some production.
Such a development would be welcomed by consumers, as it would moderate any chance of a price spike even if the fall in rig count over corrects the market.
EIA Short Term Outlook
The EIA short term outlook predicts a modest price recovery in 2010. They do not see a large shortfall developing due to a drop in drilling.
Total consumption of natural gas is projected to fall by nearly 2 percent in 2009, leading to lower natural gas prices. Industrial natural gas consumption is expected to decline by more than 7 percent, as industrial production declines during the current economic downturn. However, natural gas consumption in the electric power sector is projected to increase by almost 1 percent, since the lower natural gas prices will back out some coal consumption in this sector. The Henry Hub natural gas spot price is projected to decline from an average of $9.13 per thousand cubic feet (Mcf) in 2008 to $4.24 per Mcf in 2009, then increase in 2010 to an average of more than $5.80 per Mcf.
The 1% increase in electrical generation demand for gas is about 0.17 bcf/d, which is not tiny but should be small compared to the other larger factors.
More importantly, the EIA expects the U.S. to enter the winter will storage at maximum capacity. This will help smooth out any production shortfalls.
Conclusion
The drilling rig count has fallen to the point where the market should balance in early 2010, if Chesapeake's assumptions are correct.If a further drop in the rig count happens or if the decline rate is faster than assumed, then production will fall well below demand.
Shortfalls in supply will be moderated because of a continuing decline in the industrial sector that will be slow to recover and because storage is currently high (and possible shut in production coming back into production as prices rise).
Contact
- Content: editors at theoildrum dot com
- Tech support: support at theoildrum dot com
License

This work is licensed under a Creative Commons Attribution-Share Alike 3.0 United States License.
A recent article took a look at CERA's track record in the North Sea, one of the most open and transparent producing regions on earth, and the writer found that the CERA considerably overestimated future production, even there, which led the writer to ask why, if CERA couldn't get it right in the North Sea, they would they be any better in more difficult to evaluate producing regions?
IMO, CERA is paid to produce optimistic production reports, so they produce optimistic production reports.
In any case, Matt Simmons is concerned that the industry may never again be able to match the 2008 production rate--because of the slowdown in drilling versus high decline rates.
I agree. Figure 6 is amazing in that half our production came from only the last 3 years worth of drilling. A slow down is going to take some time to recover. And how will it be funded in the credit crunch?
I am seriously worried about prices at the end of 2010 if the rig count keeps dropping like is now.
Keep an eye on electric generation demand for natural gas. The electric sector may well lead demand recovery. 2008 looks like the year increasing electric sector demand caught up to flat/declining industrial sector demand. Gas for electric generation has grown 5% per year since 2004.
A lot of balls in the air of course. The contraction hitting industrial demand this year is likely hitting electricity as well. But the rebound in electric demand ought to be faster, possibly driving a quicker return to supply shock.
I work in the oil and gas industry, but I believe that we should be going nuclear.
-Eric T. http://www.jazdoilandgas.com
I think the grass always looks greener on the other side of the fence.
I would feel better if you said you worked in the uranium industry, or the nuclear fuel recycling industry, and believed we should go nuclear. There are problems in every industry--we just understand the problems of our own industry better.
“U.S. May Never Need More Nuclear, Coal Plants, FERC Head Says”
http://www.bloomberg.com/apps/news?pid=20602099&sid=ajl3fRv9AdDI&refer=e...
I would like to see actual plans with costs attached (and how those costs are going to be paid) before such glib statements are made. Perhaps the word "may " in the statement is supposed to give him an out.
The quote comes from a LAWYER and former renewables "shill". If you read the NYTimes article, it notes at the end from the actual Energy Sec'ty:
But this is about GAS. Sorry.
David
Maybe. Never listen to company or CEO opinions unless you like losing money. All they ever do is cheer lead for their company. Why? Because they have stock options, that's why.
Nice summery as usual Gail. As mentioned before I'm not very optimistic about NG prices rebounding strongly in the next 12 to 24 months. My very rough model mimics your comment regarding the ability of many UNG wells, which have already undergone high decline rates, to provide a buffer in aggregate. Add that to the fact that should the recent successes in the sweet spots in the Haynesville and other plays continue to be drilled the results will average significantly more then wells drilled in previous years. We were drilling fewer wells in 2H08 but they were much longer (2X - 4X) laterals with many more fracs per well (10 or 12 vs. 4 or 5). Thus the newer wells had the same production increase effect as 2 or more of earlier wells.
As far as the view from inside the industry demand destruction is an obvious concern with respect to predicting a rebound. But a much bigger concern is the inability to anticipate just how much imported LNG will become available to the domestic market in the next several years. Lots of facilities coming on line in the next 24 months with over 40 LNG tankers sitting idle at the moment. I’ve seen various (unsupported) estimates of LNG reaching the US at a cost of $2.50 to $3.50 per MCF. A lot might end up in the EU given the recent disruptions from Russia…or not. A big uncertainty. OTOH, the Feds just denied a permit for an offshore LNG receiving plant in Long Island Sound. I haven’t been able to dig up an estimate for current/near term receiving capabilities. Just another big uncertainty. An unusually early/cold winter might produce a price spike but the industry won’t snap at such short term bait. But those with shut-in volumes will open up their wells.
Just a WAG but I don’t think the industry will respond as quickly to rising demand (whenever that occurs)as some might think: potential LNG imports, low residual incomes, tight credit market, financially damaged drilling industry (if the rig count remains at current levels for the next 12 months expect to see a significant contraction of existing companies). From a personnel stand point we are on the verge of massive industry layoffs. You won’t see big numbers coming from the public companies: a very large portion of their staffs are composed of consultants/third party contractors. When they “send those folks to the house” it won’t be counted in the layoff numbers. Those that can switch industries will and won’t look back. Those that can’t will just scrape by. And those close enough to retirement might just hang it up for good. But not me...my 8 yo daughter has decided to become a horse vet so retirement is no longer an option. Besides, I'm having too much fun anyway.
Rockman,
Thanks for your comments!
By the way, this article is Jon Freise's, not mine. About all I did was copy his HTML onto our server.
My impression has been like yours--it seems like it is going to be hard to get the price to come up very much for very long, because of the very high production on some of the newly drilled NG wells, and because of LNG.
Regarding all of the new LNG terminals, is there any reason we need as many additional terminals as people are looking at? It seems like we have plenty already. None of them have ever been utilized at more than at a small percentage of capacity, have they?
Gail -- I’ve just found a current assessment of US LNG import potential. Not a lot of supporting details but does seem to have a handle on the situation. His bottom line: LNG won’t be playing a big role for the US anytime soon. Now if the NG companies would just believe that.
http://www.petroleum-economist.com/default.asp?page=14&PubID=46&ISS=2535...
“And development of import capacity continues, although the pace of construction has slowed down. In 2008, three new terminals started operations, increasing US import capacity to about 9.1bn cf/d. In addition, three new terminals are expected to start up by 2010, which, combined with capacity expansions at existing terminals, will raise import capacity to well above 13bn cf/d.”
“Domestic gas-supply growth and sustained lower US gas prices will make it difficult for LNG to penetrate North American markets. Even during periods of volume influxes, US imports have never accounted for more than 3.5% of annual gas supply. Consequently, LNG will remain a marginal US gas-supply source in the short term, accounting for less than 5% of gas consumption.”
I know a guy who works at the new LNG terminal in Freeport TX south of Houston. In the last year, they have taken only two ships due to low US prices compared to the world market. Off the top of my head, they have capacity for roughly one ship every two days...so ~1% of capacity. Fortunately for them, they have long term contracts in place that keep them financially viable... unless their counterparties fail.
Gail,
The US used 22Tcf NG in 2008(62Bcf/day), so a LNG import capacity of 13Bcf/day is >20%, sounds like this capacity is vastly under utilized if only 3.5% NG was LNG imports. What about NG coming from Mexico LNG terminals? Is this counted as LNG or just pipeline imports from Mexico?
Neil -- I couldn't find country specific import data for LNG but the report below indicates that there is probably no LNG imported from Mexico. I know for some time Mexico had been a net importer of pipeline NG from the US. They have also been importing the bulk of refined products for some time also...serious lack of refining capability. I think the report indicates the situation for NG remains the same:
"In 2007, the United States received 99.8 percent of its pipeline-imported natural gas from Canada with the remainder from Mexico. Canada also accounted for 60 percent of pipeline natural gas exports, and Mexico, 40 percent."
http://www.eia.doe.gov/pub/oil_gas/natural_gas/analysis_publications/ngp...
we have this from xom's annual rept:
"by 2030 lng demand is expected to represent about 15% of the world's gas demand"
and, "exxonmobil is currently participating in lng operations in qatar and indonesia with a combined gross capacity of approximately 35 million tons per year supplying lng to markets in asia, europe and north america. this represents about 20 percent of global industry capacity. exxonmobil is participating in four additional lng trains in qatar that will increase gross capacity by over 30 million tons per year in 2009"
1 million tons of lng(methane) is about 47.4 bcf. i think i have this right:
2000lbs/ton/16lbs/lb-mole = 125 lb-moles/ton 1 lb mole is about 379.5 scf, 125 x 379.5= 47,438 scf/ton and a million tons is 47,438 x 1e6/1e9 = 47.4 bcf/million tons.
also from xom's annual report:"rasgas trains 6 and 7 - two 7.8-million-tons-per-year lng trains........with start-up planned in 2009..... train 6 is planned to supply the u.s. market,...."
7.8 million tons per yr is a little over 1 bcfd.
and a related story:
http://www.reuters.com/article/marketsNews/idAFLR4094220090427?rpc=44
Thank you for the comments. It is always great to get the inside view.
I just came across this graph from Tudor Pickering Holt which supports your first paragraph. The marginal wells are cut out first. The drop in well productivity from 2000 to 2001 as drilling ramped up, then the improvement from 2001 to 2002 as drilling fell back again is pretty neat to watch.
And the shale wells are gaining in productivity. You can see the first year production has stopped declining and is making a slow improvement.
I do have a question: Is this improvement in initial flow rates matched by an increase in ultimate recovery of the well? When a 4 stage frac job is replaced by a 10 stage, does that increase the total gas that is recovered, or does the well just pull out the gas faster?
While price interests me, I am more concerned about the shape of NG supply long term as we grapple with peak oil. And to understand that we need to know how much technology is improving our ability to capture more gas. (I wish I had a similar chart with estimated ultimates vs # wells drilled.)
Jon -- the general model suggest that URR increases significantly as lateral length and number of frac stages increase. Think of the fracs as mini wells drilled off of the main trunk. The matrix permeability of these rocks is absurdly low. I've seen analysis of core samples which would make you doubt a well would flow 100 cf/d let alone 20 million cf/d. Thus ultimate recovery will depend strictly on the area drained. Long laterals with multifracs drain a greater area.
I haven't seen much data released from the companies on URR but estimating those values from such pressure depletion reservoirs is as reliable as it gets in the oil patch: plot the rate on a log-normal scale and you get a very straight (and thus predictable) ultimate recovery. It's a very rigid volume vs. pressure decline scenario.
"The matrix permeability of these rocks is absurdly low."
wouldn't that suggest that the gas in place and permeability of the natural fractures is high, or at least a high percentage of "effective" permeability and gas in place ?
i am not that familiar with the shale gas plays, but for the bakken oil play of the williston basin, there appears to be two species. the elm coulee type where matrix porosity and permeability are low, but not absurdly low, and the parshall field type with fractures so intense that some of the rock has been described as crumbly. the performance of the two is of two species.
and wrt the correlation between ip and reserves, imo, there is a correlation, but not anywhere near a direct(1:1)correlation
as some public traded companies have claimed in analyst's presentations. in a competitive reservoir, the stronger well will probably capture more of the reserves than a weaker well. and if all the wells are on steroids, they may just recover the reserves faster.
elwood -- yep...fractures make the play for sure. Technically speaking a perfect fracture has nearly infinite permeability. What is really amazing about the shale gas plays is that the induced fractures are connecting natural fractures to the well bore in addition to draining the matrix. The one core analysis I've seen on the Haynesville Shale indicated no effective permeability of the matrix. But this well had an IP of over 7 million cf/day. That's the "absurd" aspect I was referring to. Unless matrix perm improved significantly close to the well bore then all the production was coming from the connected fracture system. But that's the rub: the fractures have great perm but volumetrically they'll contain a relatively small amount of NG. A developing theory is that the NG is being produced in a similar fashion as coal bed gas: it's actually a molecular portion of the shale and lowering reservoir pressure causes an instability which breaks those molecular bonds. That's one reason you'll see "in-place" reserve numbers stated as "mcf per cubic foot of reservoir rock" compared to "mcf per acre-foot of porosity" of a conventional reservoir. Expulsing NG from a shale gas sample of rock via conventional methods yields nothing. The sample has to be ground to a fine powder to release the NG. WRT to IP vs. URR I wasn't referring to a correlation between IP but the actual decline curve to URR. It takes about 6+ months to get a good statistic to project a good URR. Well A might have an IP twice as high as Well B due to a better fracture system. But after 6+ months of production the log-normal decline curve might actually show a higher URR for Well B. This characteristic is common to all pressure depletion NG reservoirs be they gas shales or conventional sandstone traps.
interesting, rockman. no, i didnt take it that you were using ip as a proxy for urg, only that some public traded companies seem to want the investors/analysts to think so.
spe 24320(stright,etal 1992) discusses some early testing and simulation efforts wrt fractured shales/siltstone/dolomites in the williston basin. and among the conclusions, for a specific area, are that 90% of the porosity is contained in the matrix while the fracture system accounts for 99% of the total system permeability. stright also concludes that the fractures are spaced on the order of 2 cm.
edit:
"fractures make the play for sure."
yes, i am aware of that, and maybe my comment was not crystal clear. it appears that some of these fractured reservoirs consist of the fractures and not much else. i.e. the fractures make up a significant % of the gip. the production profile could be characterized by a high rate with a steep decline for the life of the well. like a gypsy moth.
http://en.wikipedia.org/wiki/The_Gypsy_Moths
A couple of points as far as molecular desorption is concerned in this case caused by a pressure swing.
First off its very much a surface phenomena with the region that can readily absorb/desorb located in a thin layer close to the surface. Feeding this from the bulk material is a painfully slow process.
Think about filling a paper bag with paper towels then full of water. I can't imagine this would be a fast process its well understood and pressure swing desorption normally requires high surface area and a significant pressure drop.
More interesting is the probably if the shale is wet that it might be some sort of hydrate forming in the clay. This could may the desorption region larger since its also including a liquid film.
Regardless at some point the desorbed sites also begin to develop significant absorbtion capability of their on slowing the overall migration rate.
Just one link I found.
http://www.osti.gov/bridge/servlets/purl/825287-VkZW2D/native/825287.pdf
Probably whats happening is your connecting to fractures that extend through most of the formation.
These wells are effectively draining most of the formation.
If I'm right what people will find is that after a few are drilled the entire play becomes poor.
A worst case example is you drill one it connects almost all of the formation and the next well gets some gas from local fractures and thats it. Effectively only one single viable well in a formation that may extend for miles. After that you could easily find that further wells simply don't even recover costs.
Depending on the formation I really suspect this is what people will see with only a handful of wells being super producers and several poor producers in a row before giving up.
"A worst case example is you drill one it connects almost all of the formation and the next well gets some gas from local fractures and thats it."
based on my experience, a (naturally) fractured reservoir is above all else heterogeneous. a pressure response may be detected in a well miles away almost instantly, while another well nearby may not appear to be connected at all. i dont think we should expect a fractured reservoir to be fractured uniformly. look at a shattered windshield for an example.
wrt desorption rockman posted:
"A developing theory is that the NG is being produced in a similar fashion as coal bed gas: "
i am wondering at what pressure desorption will take place. for a coal bed methane well, this pressure is on the order of a few atmospheres to a few 10's of atmoshperes.
The indisutrial demand destruction which occurred during the past 20-30 years was partly due to Globalization. If those who foresee globalization unwinding due to an array of factors such as the increasing future cost of transportation, restrictions on imports from environmentally unfriendly countries, increase in protectionism etc. are right, then there will be a gradual buildup in industrial capacity within the US.
Rockman I have a question for you one aspect of NG wells I've been trying to get a handle on is the need for compressors as the well pressure drops below line pressure. These are of course expensive and right now I'm wondering if a lot of older shale wells might well be capped until it makes sense to add compressors.
I could of course be all wrong on this but I've been wondering about the dynamics of this for a bit.
Compressor station issues could be important.
Maybe :)
This is why I keep buying stock like MXC. They and others will be banking here soon.
Ditto that -Fig.2. is all the evidence I need that this sector is going to come roaring back this is easy money, any pullbacks from here will be bought into. NGas falls off more aggressively and these cuts have been far steeper than OPEC, NGas will lead the way higher IMO.
Great piece Jon, thx.
Nick.
Hi Jon,
Thanks for a terrific post. The rise in production cost in Figure 2 is arresting. If the cost doubles again during the next decade, it will make the solar thermal alternative competitive in California, where we are letting coal purchase agreements expire without renewal.
Dave
Thanks!
I am working on a post on shale gas and future cost trends. It is almost too early to say, but it looks like drilling costs go up 3 times for 2x as much gas per well. We can expect a temporary flattening, but costs will probably climb. And I think a spiral in costs will work through the economy as a whole.
Higher energy cost -> higher steel cost -> higher drilling cost -> higher energy cost until costs hit equilibrium at the new lower EROI.
My only concern would be what is the EROI of solar thermal and will the costs rise as fossil energy gets expensive. If you come across plans for a solar thermal plant with a bill of materials I would love to see it. It would make a great EROI project.
Sorry Jon. I should have thanked you but I'm in such a habit of complimenting Gail I just got lost.
Cost vs. drilling activity vs. NG prices is such a moving target. The increased rig rates/steel costs combined with longer laterals and more fracs/well produced a perfect storm when it hit the recession. Unsustainabilty became reality over night. I survived the oil patch meltdown of the early 80's but never saw the industry cut back as quickly/deepely as in the last 6 months. But in the near term costs will be dropping greatly. We dropped 14 of our 18 rigs in the shale gas plays. Guess just how negotiable new rig rates and casing costs are now. I've mentioned before that we might be on the verge of a major shift in the valuation of public NG companies. Instead of being primarily rated by y-o-y volume increases, profitability may become the new standard. Maybe...old Wall Street habits can hard to shake.
I would also love to see this. I don't think I've ever seen a post looking closely at EROEI of solar thermal, though I have for the other renewables.
I did some very back of the envelope calculations using some googled data and numbers were about 9:1 for the most detailed example.
Read down the comment thread to get the bits and pieces.
http://www.theoildrum.com/node/3810#comment-328240
To do a proper EROI you need a bill of materials for a construction project and some cost estimates for maint, operations, etc. Essentially the same thing needed to apply for a loan to build the project. That data is hard to get!
Hi Jon,
How does net energy or EROEI vary over time with the new NG wells (long laterals,etc.)? Do they require recurring fracturing or energy inputs? If so, you might not need to do a comprehensive Life Cycle Analysis (LCA) because if the net energy falls below the continuing inputs, then the wells will not reduce the total US production decline, but instead will accelerate it because they are net energy losers. A hint of where this point might be would be the shutdown date in years after it is first brought on-line. I'm assuming even though we can't get the net energy data, that the production companies are very well aware of this issue. An odd situation could also develop where the well are kept on-line even though they are net losers because financially (cost of energy, tax breaks) or politically (investor relations, stock prices,etc.), its important to keep them going.
Hi Pragmatic,
I have data on this for Canada and it is falling fast, but still above break even. I am guessing that about 3:1 is the lowest it can go and still pay for gas separation, transport etc. Here is a graph and article:
http://www.theoildrum.com/node/4376
Canadian natural gas passed peak net energy back in 2003 or so. Production has gone into decline because the EROI decline has made it more expensive than US gas.
If I can work up some data on the US EROI then I will try to do the analysis you propose and try to figure out if the US has gone over the net energy peak.
I am looking for data on horizontal well bills of materials. Or any data on well URR values. If you come across anything like that, let me know!
Prag -- the most significant future energy expendature for the shale gas plays is compression. As the wells deplete flowing pressure drops to a level insufficient to enter the pipeline. Typically these compressors are fired with the NG from the well itself. But the compressor equipment itself is rather expensive. Also, refracs are not uncommon in some plays. But coming up with a viable EROIE will always be difficult. As I've mentioned before, the industry measures economic viability by $'s in vs. $'s out. Normally prices offer a valid estimate of energy value but we're in a deflationary period (both resource prices and operational expenses) in the oil patch right now. Thus the EROIE may be more difficult to estimate then ever.
Crap I asked this up thread :)
Do I get a star for good thinking and slow reading :)
Interesting stuff, Jon.
The next price spike should cause a drop in demand from residential users. I can easily foresee more families moving in together -- like when the price of heating oil went up a couple of winters ago but on a larger scale. This could cause a drop in housing prices.
Thanks Jon, very interesting.
Does anyone know what the US gas storage capacity is? Could we hit maximum capacity this summer?
Also your previous post mentioned a weekly LNG imports report. Does anyone know where to find that report?
This likely won't be news to anyone here but the EIA measures gas in storage in discrete eastern, western, and underground regions. Here is my chart:
From appearances we are starting from a point of relative strength compared to the situation in the late 90s, but this would have to be addressed against change in consumption and the magnitude of the decline in drilling - a paper in of itself. Looking at Figure 13 from your previous piece it appears it took almost 4 years for the rig count to crawl back to the peak of '01 at ca. 1200. If this is indicative of the pace the industry can deploy derricks the possibility of breaching minimums for storage becomes ever more likely.
The EIA produced this .ppt in the wake of nearly breaching MOL in early '03: Natural Gas Prices and Supplies in the Northeast-Midwest Region. Last year came this piece examining the opposite end of the scale: Estimates of Peak Underground Working Gas Storage Capacity in the United States. Interestingly enough this suggests that peak capacity figures commonly given may be too conservative - nothing about minimum capacity issues though.
there is a lot of compressibility in gas supply. to some extent, a pipeling company can control the amount of gas they take by controling the operating pressure. the capacity of the pipeline system is vast, and the amount of gas in the pipeline can vary with demand. take a look at the balancing items from the doe.
http://www.eia.doe.gov/oil_gas/natural_gas/data_publications/natural_gas...
at the beginning of the heating season, the balancing item is typically negative wrt supply.
a correlation of gas consumption indicates that there is a "compressibility" in the system, evident by an improved correlation with heating degree days resulting from an adjustment in any month's consumption according to the trailing month's consumption.
Thanks for the reply, Elwood. Wasn't aware of this feature, seems strange that bookkeeping vagaries could provide a volumetric cushion. But graphing it out it seems to be a very cyclical feature, corresponding at a lower frequency to the larger withdrawls from storage; also over time the balance is progressively more to the negative. (These features only show up with homemade graphs, the data point plots the EIA provides only give rough approximations) How would this be utilized to give spare storage capacity? By rearranging billing cycles? Shades of Daylight Savings Time...
For the curious, here's the EIA definition of balancing items:
i dont know, dude, i dont think the doe knows either, but i offer the compressibility of gas in the pipeline system as a possible explaination.
i dont think anyone has enough information to quantify the compressibility.
A decline in current gas demand is not necessarily a bad thing from a conservation point of view. That way when it's really needed you know where to look. Major future sources of demand are combined cycle balancing of mandated windpower targets and CNG as a diesel substitute in heavy vehicles. I believe both are inevitable and one day there may have to be gas rationing. Hence save some for later but just keep enough expertise going for when that happens, say within a decade.
CHK is all hype. Taking advice from them is like getting econ advice from Geithner. A short term 4-6$ correction is likely, but beyond that we have enough unconventional sources to maintain even supply for some time. The decline curves are strong, but Marcellus and Haynesville have yet to peak.
I look toward peak gas sometime in the next 10 to 20 years, when Marcellus peaks in production it's all downhill.
wait a sec, our current rig count is 760 and at 750 we cross into over-correction territory?!?
That's correct billy. As tsr implies, Chesapeake managment is speaking directly to the fund managers who will determine the market value of their stock. They care little if their statments make sense to us. They're just tossing the funds sizzle that they can sell to their clients.
FYI for all: just read the global construction update from the O&G Journal. LNG highlights: At the end of ‘08 the Isle of Grain import terminal expansion in the UK received its first shipment. Expanded to 9.8 million tons per year. The Russian Sakhalin plant was completed in Feb with a capacity of 9.6 million tpy with 60% going to Japan on a 20 yr contract…about 7% of their total LNG imports. In March the first shipment arrived at the South Hook terminal in Wales. Capacity: 2 bcf/d later this year. LNG came from Qatar’s huge North Field in the Persian Gulf.
Gail it was a very well researched article. Well done.
David Walters
The 4/24 Rig report was out and the US dropped another 18 Gas rigs last week. Including 14 horizontal rigs. So the low prices are really starting to bite even the best production prospects.