A New Geopolitical Jevons Paradox? A Look at Non-OECD Oil Demand
Posted by Sam Foucher on November 12, 2009 - 10:29am
This is part 2 of my post
on oil demand. This time I look at the
Non-OECD demand and how it may impact global oil demand. Based on data
from the
2009
BP Statistical Review, the OECD oil consumption in
2008 decreased by -3.2% while demand within emerging economies
increased by +3.1%. The report also indicates that oil production from
OECD
countries has been declining since 1997 and is now below 23% of
the world production.
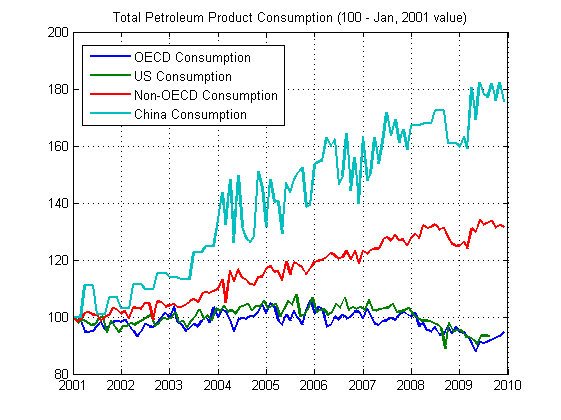
Figure 1. Increase in consumption since Jan, 2001.
Figure 1. Increase in consumption since Jan, 2001.
Non-OECD Demand
The Non-OECD consumption is well modeled by an exponential fit as shown on Figure 2. The equivalent growth rate is around 3.2% per year. One amazing observation is that there is no apparent slowdown in consumption growth due to high oil prices. This pattern is very different from what has been observed for the OECD. There are three main factors contributing to this growth:- Emerging economies (China, India) with strong population growth, high economic growth, low car ownership and very low oil consumption per capita.
- Oil resources managed by governments (NOC).
- Gasoline subsidies (especially in Middle-East oil producers such as Saudi Arabia) making those market unresponsive to prices signals.
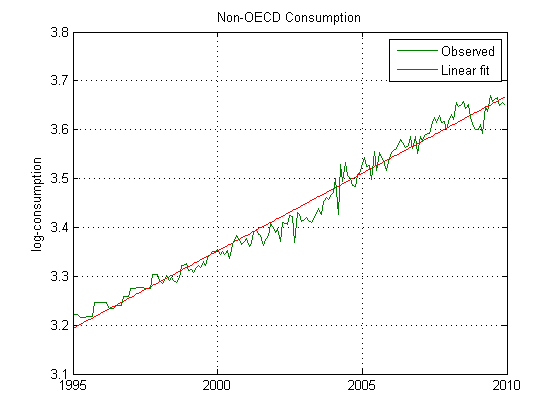
Figure 2. Linear fit in the log-domain for the Non-OECD consumption (monthly, total petroleum products), volumes in million barrels per day (mbpd).
As a result, Non-OECD consumption grew from 40% of the world demand in 2004 to 45% in 2009.
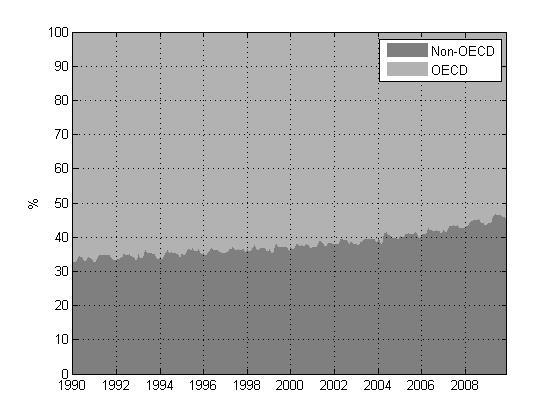
Figure 3. OECD and Non-OECD shares of the world total liquids consumption (EIA data).
The Non-OECD group is a
net
exporter (see Figure 4), and to date production has grown at the same
rate
as consumption. In contrast, total production from the OECD
countries peaked in 1997
and
has been declining at an accelerating rate ever since (see
Figure 5). The
situation is somewhat similar to the Export
Land Model. It is unlikely
that growth in oil production from Non-OECD countries can match consumption
growth
for very long (+3.2% / year), therefore their ability to export will
diminish in the next few
years.
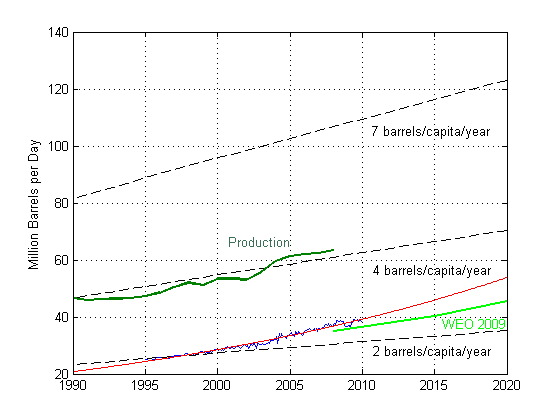
Figure 4. Observed Non-OECD consumption in blue (monthly, total petroleum products) and exponential model projection in red (see Figure 1). The light green curve is the WEO 2009 forecast (primary oil demand, excluding biofuel demand). Production data from BP.
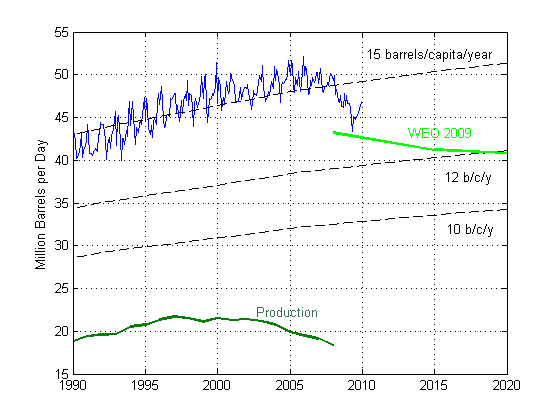
Figure 5. Observed OECD consumption in blue (monthly, total petroleum products). The light green curve is the WEO 2009 forecast (primary oil demand, excluding biofuel demand). Production data from BP.
Interestingly, the OECD is now producing less than 22.4% of world production, its lowest value since 1976.
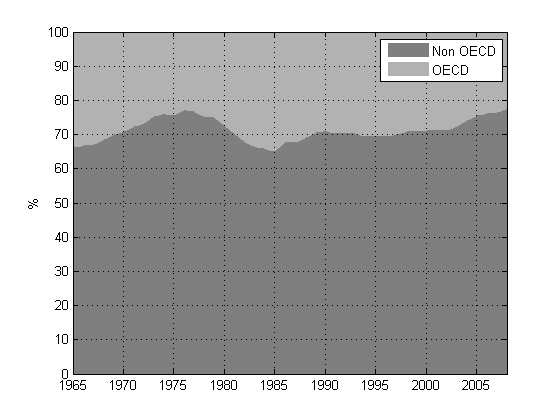
Figure 6. OECD and Non-OECD shares of the world total liquids production (crude oil + NGL). Production data from BP.
How Low Can the OECD Consumption go?
Since to date the OECD has taken the brunt of the high oil prices, the question can be asked: how low can the OECD consumption go? One interesting perspective is to look at various per capita consumption levels combined with population growth forecasts. Presently, consumption for the OECD excluding the US is hovering around 12 barrels per capita per year. In the WEO 2009, the IEA is predicting by 2015 a further consumption decrease toward 10 barrels/capita/year for the OECD excluding the US and toward 20 b/c/year for the US.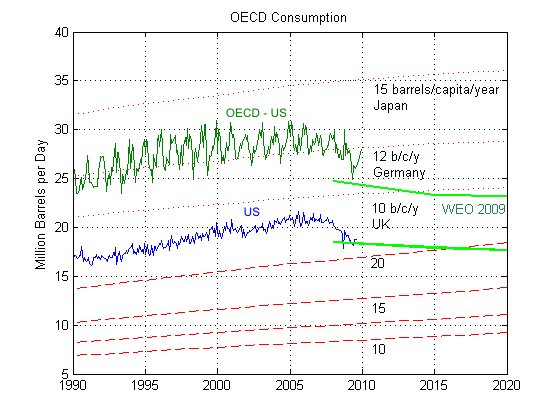
Figure 7. OECD-US and US consumption and various forecasts curves assuming different per capita consumption levels. The green curves are the WEO 2009 forecasts (primary oil demand, excluding biofuel demand).
Where Oil Prices are Heading?
The following scenario is set forth to illustrate how an asymmetric demand destruction could occur between the OECD and the Non-OECD. I don't assume a peak oil scenario for now. Instead, I simply assume that the growth in production capacity within a high oil price environment observed between 2007 and 2009 will remain the same until 2020 (see Figure 7). This is equivalent to a net addition of 0.610 million barrels per day as shown on Figure 8 below.
Figure 8. Linear fit on the production capacity (total liquid production + OPEC spare capacity) from 2007 to 2010. EIA data.
This scenario is optimistic on the supply side and pessimistic on the demand side. It is based on the assumption that the conditions observed since 2002 continue to remain the same in the future, namely:
- Long term structural changes in OECD demand are triggered mainly through economic recessions (i.e. high unemployment, etc.).
- OECD countries go into periodic economic slowdown and recessions triggered by oil prices increasing beyond $150 a barrel.
- The excess demand model and its relationship to oil prices are the one established in my previous post and corresponds to $20 per 1 mbpd of excess demand. The Non-OECD demand exceed that of follows the exponential model described above.
- There are no long term structural changes in demand within the Non-OECD.
- The world total liquid production growth is anemic, amounting to 0.610 million barrels per day per year of additional supply and is not influenced by oil prices.
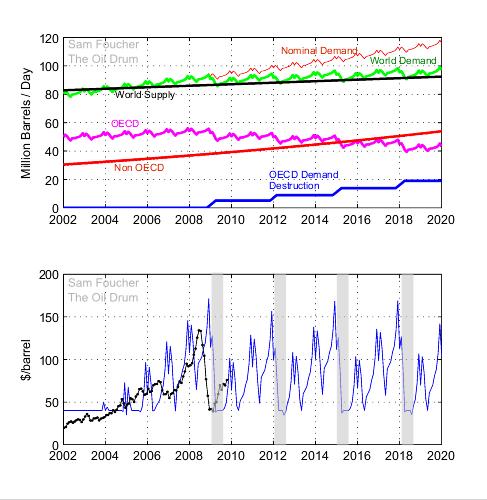
Figure 9. Hypothetical scenario where the world supply growth remains weak but constant until 2020. Ligh gray areas indicate recession periods.
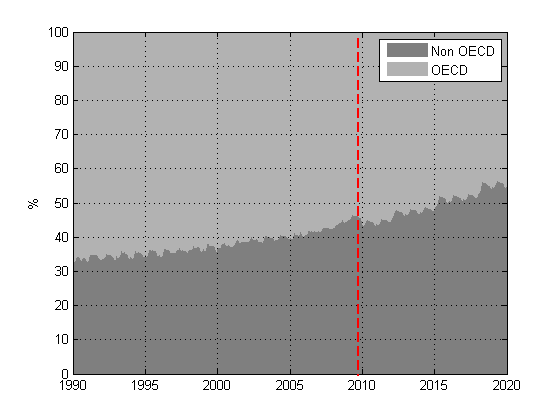
Figure 10. Corresponding consumption share.
Conclusions
In conclusion, I think there is no end in sight for high oil prices and in particular for high volatility even assuming a somewhat optimistic supply growth scenario. The Non-OECD consumption will continue to grow, partially shielded by gasoline subsidies and an increasing share of the world oil production. The void created by a rapid contraction of the OECD consumption will be filled by Non-OECD demand. In summary:- OECD oil consumption is very reactive to oil prices.
- OECD oil production has peaked in 1997 and will be increasingly dependent on oil imports from Non-OECD countries.
- Non-OECD oil consumption is quite unresponsive to oil prices.
- Non-OECD consumption will likely be the main driver behind high oil prices, but the OECD will be the first to reduce consumption (and demand).
- Are we witnessing a kind of geopolitical Jevons paradox? Structural changes in demand are very likely for the OECD, but the oil then made available will be absorbed by the relentless growth of Non-OECD.
“No civilization can survive the physical destruction of its resource base.”
—Bruce Sterling
Contact
- Content: editors at theoildrum dot com
- Tech support: support at theoildrum dot com
License

This work is licensed under a Creative Commons Attribution-Share Alike 3.0 United States License.
Following that whistleblower story in the Guardian I have written a short history how the International Energy Agency in Paris got is so wrong with their projections:
http://www.crudeoilpeak.com/?p=564
In 1998 the IEA mentioned Hubbert and Colin Campbell and had one scenario with 2000 Gb reserves and an 80 mb/d crude oil peak in 2010. Then the USGS 2000 survey was published and everything changed....
China's demand and how much the world has to save to allow their growth is covered here:
http://www.crudeoilpeak.com/?p=525
{comment shifted to the right place}
Keying off Sam's Jevons' Paradox question, it's possible that more energy efficient ways to use energy could plausibly reduce energy consumption in OECD countries, but per Jevons' Paradox, it should cause energy consumption to increase in non-OECD countries.
For example, the Zipcar folks (car rental on an hourly basis), claim that people who sell their cars and rely on walking, public transportation and Zipcars, save an average of about $600 per month--versus using a personal car full time--with a significant reduction in total energy consumption. (The key point is that there is a direct hourly cost associated with driving a Zipcar, so people drive less and combine several errands into one trip.)
However, if we apply this model to developing non-OECD countries, where an individual or a group of people could rent a vehicle on an hourly basis, as needed, one would think that it would plausibly cause the rate of increase in energy consumption to accelerate, by making motorized transport more affordable to a larger group of people. Now this would also be a factor among lower income groups in the US, but probably not nearly as much as in developing countries. In fact, I wonder if Jevons' Paradox is really a significant factor only in developing countries.
The irony is as OECD companies continue to develop more energy efficient devices and methods, it may cause total energy consumption to skyrocket, as the cost of using energy for billions of new consumers falls (compared to using prior devices & methods), among a group that has already shown increasing oil consumption as oil prices rose at about 20% per year from 1998 to 2008.
Wouldn't the number of devices have to skyrocket even faster than the deline in energy used per decice for total energy use to skyrocket? I don't see the folks in developing countries having the income to exponentially increase their purchase of energy using stuff.
As energy used becomes a vanishingly small percentage of the cost of the device over a life time I would think the uptake of devices would be inversely proportional to the cost. I would guess that material costs would become far more important than energy useage. Also, as the amount of energy used plumments the option of using local, renewable energy sources would seem to become more likely. For example, methanol fuel celss for portable electronic things and solar for LED lighting.
First of all, as annual oil prices rose at about 20%/year from 1998 to 2008, OECD consumption was flat to down, while non-OECD consumption was up significantly, which is a pattern that I expect to see continuing. So, I guess the question I am asking is--as OECD countries embark on forced energy conservation measures, using breakthroughs in energy efficiency--won't those breakthroughs in energy efficiency cause the rate of increase in energy consumption in developing non-OECD countries to accelerate?
But in any case, what we have seen in recent years is poorer developing countries outbidding richer developed countries for oil supplies. In a real sense, in terms of percentage change in oil consumption, Kenya and Morocco outbid the US for oil supplies over the 1999-2008 time frame.
Developing or non-OECD countries can ‘pay more’, or pay the high price, because the EROI, in terms of: one barrel or oil> industrial or other output is higher than in the ‘west’, even if only in terms of gains in ‘fiat currency’ or local advantage.
In the ‘west’ oil or more generally energy is pissed away on non productive pursuits, read soccer mom drives kiddos to match, to MacDos, etc.
Short version.
Fascinating! Is it your personal belief that supply is robust enough to keep gaining, even mildly? I notice that the average for overall supply contributions listed in the Oil megaprojects Wiki from 2003-2012 is 3675.6 kb/d, which seems high enough to overcome present decline rates - although some would argue those are due to jump soon when deepwater offshore begins to assume more and more of the production profile. I'm leaving off 2013 and onwards since things taper off from then on, presumably because projects due then are still being announced. The page still lists Nov 19 from last year as the last update, have you guys updated the Perl in the meantime and just forgotten to change the text?
I have to update the Wikipedia page for the megaprojects, I don`t think we can sustain this kind of supply growth. In my opinion, a slowing of supply growth under high oil prices is a precursor of peak supply that may occur around 2011-2013.
Regarding demand destruction, there is also the Automatic Earth scenario where contracting credit impacts demand ineluctably, impacting supply in turn, ahead of a geologic peak. Some of the posters there were talking about scenarios where you have fewer and fewer gas stations on highways, with truckers having to abandon entire routes as a result. Well, I have a book called the Gas Station in America which leaves out that detail from our last bout of deflation - it mentions a decline in vehicle registrations and attendant reduction in consumption in the early 30s, which was overcome in the next few years. Nothing about waves of stations shutting their doors. Some retailers even started up in the worst years of the GD. You did see more and more dominance from vertically integrated companies, but Congress also passed legislation intended to help middlemen jobbers. There was a massive reduction in auto manufacturers, however.
In my opinion, this analysis is too academic. Numerous articles mention that the world crude oils production will never exceed the 2008 one, and, at best, hover for a few years around that figure before declining. Figure 8 shows a steady increase in production. From where does the new oil come from? In any event, this oil is not cheap to produce. This will trigger all sorts of scenarios one can simulate. Figure 9 shows one that is too simplistic, repeating like clockwork the frequency of recessions, exactly the low and high price of oil, and the shape of the curve. That shows that after the given initial conditions no other influences enter the analysis. If not stopped, the model would run to the year 10,000 without any change, showing a recession every 3-4 years and the same oil prices. In reality, there will be reactions by governments, changes in population systemic habits, drive away from oil based infrastructures, etc. We are slow learners but a time will come when we say "enough is enough".
I agree with what you`re saying but it`s fairly more complex to do the same exercise assuming a declining supply, things will get fairly non-linear then. My goal was simply too show that even a sluggish growth in supply is enough to put us in trouble assuming that the Non-OECD is not responsive to prices. I don`t think increasing 0.610 mbpd per year until 2020 is a realistic scenario either (note that it is fairly close to what the IEA is predicting in the WEO 2009).
I would also agree that this is not an academic exercise at all, but very pragmatic. An "academic" economic analysis would first assume a substitution for oil of some other (unknown) energy resource and then use the conventional macro arguments.
What we want to see is what happens without the conventional spin of the economic BAU, and I think Sam has done this.
Man, you post way too fast. Barely digested the previous one :)
Seriously, thanks for this work.
To back up your argument:
Real OECD demand, corrected for grey energy use, is probably not stalling.
Source: Peter Terzakian, 'End of Energy Obesity' (hat tip to Gail for digging this up)
Estimates put grey energy consumption at c. 25-30% of total energy demand. If we assume oil consumption is 25% higher in OECD than estimated due to imported consumption from China, then c. 25% of say energy demand growing net exporting countries consumption is net energy exports to OECD).
This would have to be oil-intensity adjusted to show how much oil-equivalent demand reduction it means within the OECD. Wish I had time to compile oil-demand-growing net-exporter countries list and calculate this, but...
Well, at any rate, it is highly likely that as we (the OECD producers) are outsourcing raw material acquisition, production and logistics not only to other countries, but also to companies that have their HQ in developing countries, that is where the oil consumption will be booked.
To make matters more complicated, we have traded high-but-zero-growth oil intensive production (OECD countries) to low-but-rapid-growth oil intensive production (developing countries). We save oil in the interim quite a bit as we outsource from high-to-low intensive production, but it will be quickly run up by the increasing consumption and rapidly growing oil intensity of the developing world, unless we keep cutting our own consumption at the same rate (we haven't).
In finality, the oil will go to those who can make the best economic use out of it's use and be able to pay a higher price for it. Historically this has been the players with the money, not the ones with the debt. This would actually back up the OECD peak demand argument over the long term, if prices keep at a high level.
I have some of the above numbers (not all), but no time to dig the up. Interested parties can google them up and fill in any holes I may have made.
Excellent comments, I agree that the energy usage for the manufacturing of imported goods from Non-OECD countries should be included. That could be a follow-up on this post.
How up to date is that graph? Can't tell where the X axis ends at such a coarse scale. A graph from Duncan puts a peak in world BOE per capita in the 70s: Olduvai Theory: Sliding Towards a Post-Industrial Stone Age, by Richard Duncan.
The process is well- documented; it buys a little time but does not change the overall picture. Depletion for one is depletion for all, at some point all energy- intensive 'manufacture' will fall into the energy abyss. It's just that some will fall into it sooner.
Excellent posting, but I don't agree with your conclusion #3:
Non-OECD oil consumption is quite unresponsive to oil prices.In many Non-OECD countries the oil consumption is hardly affected by the crude oil price on the international market as domestic prices are subsidized or even politically fixed.
Also the IEA frequently complains about this issue and there are even worries of a "subsidy bubble" of public debts.
The effect of subisidies (including low taxes etc.) as an incentive for fuel consumption is well known. So as soon as these subsidies are reduced (IEA writes that there is a trend to do so) the high fuel price might well lead to demand destruction.
This might also be one of the reasons why China's official data of energy efficiency improved a lot during the last months, as the government had imposed a few hefty increases of fuel prices last year.
Of course the deferred price elasticity in non-oecd countries changes the overall result:
All countries will be affected by the high oil prices and experience demand destruction.
The only exception are the remaining oil exporting countries (= chiefly OPEC): Their rising consumption will lead to a decline in exports (see e.g. postings about the "export land model" in TOD).
Here's the digg, reddit and SU links for this post (we appreciate your helping us spread our work around, both in this post and any of our other work--if you want to submit something yourself to another site, etc., that isn't already here--feel free, just leave it as a reply to this comment, please so folks can find it.):
http://digg.com/d319q7g
http://www.reddit.com/r/business/comments/a3of5/a_new_geopolitical_jevon...
http://www.reddit.com/r/worldnews/comments/a3of2/a_new_geopolitical_jevo...
http://www.reddit.com/r/collapse/comments/a3of1/a_new_geopolitical_jevon...
http://www.reddit.com/r/energy/comments/a3oev/a_new_geopolitical_jevons_...
http://www.reddit.com/r/reddit.com/comments/a3oku/a_new_geopolitical_jev...
http://www.stumbleupon.com/submit?url=http%3A%2F%2Fwww.theoildrum.com%2F...
Find us on twitter:
http://twitter.com/theoildrum
http://friendfeed.com/theoildrum
Find us on facebook and linkedin as well:
http://www.facebook.com/group.php?gid=14778313964
http://www.linkedin.com/groups?gid=138274&trk=hb_side_g
Thanks again. Feel free to submit things yourself using the share this button on our articles as well to places like stumbleupon, metafilter, or other link farms yourself--we appreciate it!
Nice post Sam - good to see the information laid out clearly
Related to this post, if you want a good laugh look at this tard:
http://peakoildebunked.blogspot.com/2005/12/180-jevons-paradox-refuted.html
So far that is true to some extent, that being the time it takes for OECD economies to crash due to increased oil costs absorbing free operating capital and sending it to the non- OECD producers.
Naturally! 1998 was the peak of cheap oil. Coincidence?
Because, as you point out, the non- OECD countries are also oil producers who receive the excess free operating capital removed from the OECD. There is little investment infrastructure in producer countries; consumption 'tools' are imported from the West. There is little productive use for the excess free capital. What besides oil and hate- filled fundamentalist screeds are 'manufactured' in Saudi Arabia or Iran? What sort of economy does Russia, Nigeria, Angola, Venezuela, Kuwait, Iraq, Brazil ... mobilize besides resource extraction? The consequence of capital inflows in the producing countries is inflation. OECD defaults take place in the present due to capital outflows, non- OECD defaults take place later due to inflation. In no case is there a bottom- line investment return to oil consumption. Production return on energy invested - PROEI - is near zero, the balance of the world's energy budget is simply waste leading to inevitable default.
Naturally.
Nobody learns anything, all that will be left after 200 years of oil consumption will be the millions of rusting hulks of giant pickup trucks and SUV's. All that oil gone, with nothing to show for it.
An excerpt from an e-mail I sent to an acquaintance in London:
The point that we (Foucher, Brown, Silveus) focused on in our 2009 paper that I delivered at ASPO was the disconnect between the initial slow net export decline rate, versus the very rapid Cumulative Net Oil Export (CNOE) depletion rate.
For example, an actual case history--the sum of the output of Indonesia, the UK and Egypt (IUKE). They had a combined production peak in 1996 and they went to zero net oil exports in 2005. At the end of 1999, three years into the production decline, their annual net exports had only fallen at 3.1%/year, but their post-1996 CNOE had been depleted at an exponential rate of 25%/year from 1996 to 1999. So, their "Net Export Capital" was being depleted at about 8 times the rate that the actual volume of net oil exports was falling, over the initial three year decline.
There was a fascinating WSJ front page story earlier in the week about people, laid off in 2007 and 2008, who have been living off their severance payments and savings. In many cases, they made minimal reductions in their standard of living, and they are now recognizing that many of them will be totally out of money in a few months. We can do a simple model. Let's assume living expenses of $100,000 per year, and assume severance payment of $300,000. Let's assume that expenses fall by $10,000 per year for three years, so total cumulative spending after three years was $240,000 ($90K + $80K + $70K). The annual decline rate in spending would be 12%/year, but the severance capital was depleted at the rate of 54%/year (from $300,000 to $60,000).
Sam's best case for the (2005) top five net oil exporters, in the 2005-2013 time period, is that they will have a combined net export decline rate of only 1.7%/year, BUT, their post-2005 CNOE at the end of 2013 would be 52% depleted, an exponential post-2005 CNOE depletion rate of 9.2%/year.
Wt ... Mac ... it's hard to tell if this is a tragedy or a farce!
These producers are between the rock and hard place; like Mexico, they depend on capital flows for government spending so they dare not risk cutting back on extraction efforts. For how long a period can a country support domestic consumption; a) without cash flow and b) with accelerating depletion? It seems that a lot of producers become Nigeria, eventually ... maybe all of them.
I see where Brazil states it intends to reserve new offshore production for domestic consumption (except the oil sent to China, that is). What happens when Canada makes the decision to curtail exports regardless of capacity to supply 'X' million barrels a day to the US? I think it's an assumption that all countries will exhaust export capacity as a matter of course. What do you think?
As more countries become net- importers, will policy shift?
Would UK dampen domestic consumption to allow exports if it could gain hard currency? If the UK could export 800,000 bpd @ £100/bbl would they do it? Would they export @ £150/bbl? Ironically, they exported more than 50% of their oil @ £15/bbl or less. Would the UK government take the risk to alienate its oil- guzzlers among its citizens to attempt this? What would be the unintended consequences?
What if a hard- nosed US government decreed that domestic consumption would be cut 90% and half of US production exported in exchange for hard currency with the balance reserved for agriculture and emergency services? How would the Saudis react? @ $300 a barrel they would be making money but would have to compete with producers that did not previously exist. Would there be price wars or would the oil trade divide into regional monopolies? Where would 'sticky' production and 'sticky' consumption actually stick?
How would China enforce its oil purchase contracts? Would there be more military interventions knowing that such would result in lower overall oil production ... as has been the case with the US in Iraq?
We live in interesting times; I read that same WSJ article and the whole country is on the same course as the 'separated' folks in that article. The same end- game fast approaching. The cheap- capital/money/oil is running out. What happens next is hard to predict. I think if prices get high enough, more oil will be made available to the market but it won't be from physical production but will be 'administrative' production. Of course, there would have to be economic activity at the purchaser end that shows a return on investment in order to pay the high prices in a form that means something.
Re- reading the foregoing illuminates the kind of jam we've led ourselves into. There are just no easy fixes. Finance capitalism has gotten seriously out- of- whack. Oil production is accelerating its own dislocation; 'creative destruction' has become heavy on the destruction aspect, leaving the creative to ... who?
Hello? Anybody home?
The only way the UK could become a net oil exporter again would be for the government to introduce rationing of supply. This was done during and after WW2 for many essentials including oil and food. During WW2 because we were blockaded and couldn't import enough. After WW2 because we had to be a net exporter to pay off some of our national debts.
If we were to face collapse of our currency and total economic collapse, I could see a future UK government try to reintroduce rationing. Especially if the current government manages to get 're-elected'. They have already put in most of the control and management infrastructure ('anti terror' police powers, ID cards, DNA databases, CCTV, phone and internet snooping).
The 'anti terror' legislation is being used to spy on people who commit the most minor of civil offences, like dog fouling or reporting an incorrect address to get better free education for their kids.
No, everyone's still at the mall shopping...
Not according to the numbers I've seen :o
Steve -- For a significant percentage of US oil production the gov't need not pass any decree to force international sales. Today the gov't has the right to take all federal oil royalties in kind. They can then sell that oil to any market in the world. Transport costs won't really be an issue. they can just do a swap: exchange ME oil going to the EU for oil heading to the US. It's all done on paper.
"Sam's best case for the (2005) top five net oil exporters, in the 2005-2013 time period, is that they will have a combined net export decline rate of only 1.7%/year, BUT, their post-2005 CNOE at the end of 2013 would be 52% depleted, an exponential post-2005 CNOE depletion rate of 9.2%/year."
westexas,
That high hey, 9.2%.
I think it may have been Jeff Goldblum, in Indepence Day, he said "time's up"!
Or was it Bill Paxton in Aliens when he said "Game over man, game over!"
And then what he said after this...
"rusting hulks of giant pickup trucks and suv's"
Very close, but no cigar.The collapse is not apt to be fast enough to prevent these hulks from being recycled.
I doubt any will survive, beyond the handful that will be in hands of collectors or museums.
mac -- You'll get my P/U when you pry my cold dead hands off the steering wheel. Actually I'm P/Uless at the moment but when I get that big payday I'll be getting another...4WD too! Granted I'll be retired at that point and spend most of the time sitting in the garage with it listening to the Oldies station.
Rockman,I'm with you-I'll never have enough money for a new truck but I have two good older 4wd trucks and if the worst comes soon enough I will run the older one, which is carbureated, on wood.
But niether one of them is used unless the job cannot be accomplished without it-mostly off road farm work or winter time hauling on a slick road.
But you and I will be gone in fifty years, which is about WNC's time frame for his remark about the hulks.
That you'll be in the garage implies maybe your 'new' PU will be cherried out older one. Too new a truck and you best have regular paydays coming in to keep it going over time. Those mods are expensive and the main CPU does a pitiful job in pinpointing failure especially when the failure is in the main CPU, It appears to be a bit of the HAL syndrome is very alive and well in many makes and models. Gee would the programers make that so--would keep them from footing bills on thier own faulty equipment. Off point a bit here, but our damned Equinox is going back again, for another very temporary fix. I assume the stated policy to the dealers is, 'just keep 'em on the road by pushing the real and expensive fixes up past time when the warranty expires'... kind of like the IEA predictions that way...
Great Key Post and Commente (excluding mine). Thanks Sam and everyone else
Thanks for this great work. It confirms my personal prediction regarding longterm economic expectations I made three years-ago--ongoing structural recession/depression with inflation and deflation occuring in different economic sectors simultaneously due to enormous debt and refusal of energy prices to drop radically enough to fuel a recovery because destroyed demand is "rescued" by non-OECD countries. For all the folks out of work or barely working, $2.50 gas might as well be $5 or more, and few of those 44+ Million are going to be buying gifts or taking holiday trips.
I'm very glad I prepared.
A post about the rebound effect (Jevons) generally needs to include figures (that are hopefully accurate) for efficiency improvements, otherwise it's just a post about consumption trends.
Sam Foucher
Excellent post.
Just to clarify
I understand you to show OECD production declining. Did you mean "Non-OECD countries"?
you`re right, good catch, thanks.
I think the success of the non-OECD countries can be attributed to the demographics and policies of China and India, specifically
1) large labour supply for sweat shops
2) no intention to reduce coal burning.
These factors I believe are the primary drivers behind non-OECD oil demand.
When the OECD countries buy goods made under those conditions the world as a whole may be worse off. Pollution goes up and the average wage goes down. It's a race to the bottom. Would these countries do as well if they had rigidly enforced clean air regulations and unionised labour?
At the risk of being labelled 'protectionist' if the OECD got its act together on carbon emissions it could impose tariffs on imports from non-OECD countries. We have fair trade coffee so why not low carbon manufactured goods? Ultimately shortages of transport fuel may evaporate the cost advantages of non-OECD countries. I don't believe that more than a third of India's 1.2 bn and China's 1.3 bn population will ever make it to the middle class.
Because thats not what our financial elite on the OECD wanted for the last 50 years. Manufacturing in the UK means paying an asian company to actally do something and then retailing the product in the UK. We are in no position to reverse this in less than 50 years minimum. If you try to manufacture anything hi-tech in the UK you will find that the components are not UK made. We would would lose any protection war very quickly. We don't even have raw materials to start from scratch [except in our rubbish tips].
This new data from the Economist today:
China’s industrial output grew by 16.1% in October compared with a year earlier. Retail sales were up by 16.2%. The data underscore China’s rapid economic recovery, thanks in part to a huge stimulus package. Car sales, for instance, have been booming (up by 72.5% in October) because of a cut in sales tax on new vehicles. But as in America and Europe, analysts are pondering what will happen when the stimulus measures end.
Sam, a somewhat surprising article in E&P, an oil & gas trade magazine (emphasis added):
http://www.epmag.com/Magazine/2009/11/item47352.php
The most recent economic downturn is a peak oil recession
As nations and corporations consider their energy strategies for the future, their beliefs about the sources of the current recession will prove critical in strategy formulation.
Leanan noted that the author of the article spoke as ASPO:
http://www.energybulletin.net/node/50109
Thanks very much for the excerpt and link. So it's called a "lockout" or "being locked-out." Interesting framing. So we go to war against developing countries for "locking us out" from our access to cheap oil and thus economic growth.
The Shanghai Daily reported for the first 10 months of 2009 Chinese auto sales rose 37% YOY.
http://www.shanghaidaily.com/article/?id=418998
Should detect some increase in oil consumption there. One would not believe they are buying these autos to sleep in. Amazing what a deliberate disregard for the environment can do towards making a nation rich.
I do not see their life expectancies decreasing in spite of sulphur and carbon dioxide in the air and industrial chemicals in their veins.
Maybe the chemicals in their veins are keeping plack levels constant so they aren't suffering the normal fate of the newly well off ?-)
there are few alternatives to gasoline and diesel-powered vehicles
Not surprising, from an oil & gas trade journal.
At TOD, we should be better able to think outside the FF box.
I did a back of the envelope calculation on extra costs to the economy/consumer due to price increases of crude from '03 to '08 a good while back and posted about it in support of the PO-induced recession, or at least its role in this Perfect Storm we are entering.
The figure I came up with was 1 - 1.5 TRILLION over that time span in extra costs for crude. (There was an article written somewhere that I can't find now that found the same numbers.) Note that does not include *any* follow-on costs for other petroleum products or any other commodities, etc. That is *only* for the cost of the oil and *only* for the US.
This should be a relatively straightforward calculation for you or Sam. I'd love to see how much more was drained out of the economy above that 1 - 1.5 trillion.
We should note that those are pre-bailout dollars. That is, back when a trillion wasn't the new billion. That's a hell of a lot of drag on the economy; something on the order of 1.5 to 2.1 percent of the entire US economy over that time, assuming a $14 trillion/yr economy.
Cheers
It seems that the increase in proportion consumed by non-OECD countries vs. OECD can be simply explained by supply and demand. In its most simple form, global price is determined by the equilibrium of global supply/demand curves. But presumably the local demand curves in emerging economies have a different shape/position relative to developed economies. Suppose these have a "standard" form with a large change in amount demanded (slope) at high prices, and low change in amount demanded at low prices (roughly negative exponential), but the non-OECD curve is lower than the OECD curve (reflecting lower overall ability/willingness to pay a given price for a given amount, or conversely to buy a given amount for a given price). Simply put, the demand of emerging economies has not yet expanded out to the degree of developed economies.
A global drop in supply will result in a price increase as well as a drop in amount, shifting along the net demand curve. However, with the basic assumptions above, the slope of the demand curve in non-OECD countries is steeper than in the OECD in this price range (i.e. lower elasticity in the non-OECD). Hence, for the same price/amount change, the OECD absorbs a higher proportion of the reduced amount. This results in an gradual increase in proportion consumed in non-OECD countries compared to OECD.
However, over time, this means that the global demand curve will become more dominated by the still expanding non-OECD demand curve. Simultaneously, demand destruction in the OECD will shift the demand curve downward, and the two will approach each other. Once they are close, this effect will diminish (other than supply willingness effects related to the export land model).
I agree that at some point in time the effect will diminish. However, a good fraction of the Non-OECD consumption is coming from oil exporters with strong subsidies for their domestic market, I don`t expect demand from those economies to be price inelastic in the short term.
Khebab, this is a nice post. Charts, interrogating data. However, I don't like Figure 9 that much - imparts a feeling of regularity to a chaotic system, though I agree that $100 / bbl may be around the corner - followed by much hair pulling.
One from my archives...
The introduction of Cantarell, the North Sea and the North slope saved the bacon of the OECD, which I now think is in terminal decline. Competing for declining exports underpins the decline in OECD consumption.
At the human (not national) level the non-OECD are likely much more energy efficient than we are - smaller or no cars, no ski holidays etc., and they will ultimately be able to pay higher price for oil - unless we adapt fast.
CW
Sam,
Is the non-OECD consumption in Figures 1 and 2 the same data?
The last 5 years sure don't look like exponential growth to me. I think your log-chart covers too long a period.
The last 5 years don't even look linear - they look like a logistic curve.
yes it is the same, it does look a little more curvy of Figure 1, however the departure from the exponential fit is well within the standard deviation of the residuals.
Sam,
If you just eyeball Figure 1, it seems clear that the underlying behavior of non-OECD growth has changed. There's an inflection point around the middle of 2003.
I can see an exponential curve for 1995-2004.
the departure from the exponential fit is well within the standard deviation of the residuals.
That's because the data is fairly noisy; the exponential curve fits for the majority of the time period; and the deviation from the exponential curve isn't enormous. Still, the curve has clearly changed.
If I have time, I'll do an analysis of the residuals (I think you'll clearly see the error increasing, and in one direction), or an analysis of variance to show a better fit for other curves. A linear fit would be better, and a logistic/sigmoid curve would probably be best (asymptotic to something around 145, I'd guess).
That would deserve further analysis, however a logistic fit would be not be very reliable with so little data, note that the last 3 points are projections from the EIA STEO model and not real data and will be subject to significant revisions.
Well, over 5 years of monthly data we have 60 data points - that gives us a pretty strong level of degrees of freedom.
I mention a logistic/sigmoid/gompertz ( http://en.wikipedia.org/wiki/Gompertz_curve and http://en.wikipedia.org/wiki/Sigmoid_function ) curve simply because it's roughly an exponential curve for the first half, and converges asymptotically to a value in the 2nd half.
Anything that showed a declining growth rate would show an improved fit. You could use a 2nd or 3rd order polynomial, for instance.
Heck, just start by charting the original data (i.e., not transformed with a log function) and overlay the best-fit candidates for exponential, linear, polynomial and gompertz curves over it. Then look at the residuals and see which one reduces the variance the most.
I think you'll see that the gompertz and polynomial fit best, followed by the linear, with the exponential in last place. Heck, you'll be able to see it by eye.
If you'll copy the non-OECD monthly data series into a comment, I think I'd have time to do it.
You are talking Figure 1 with non-OECD data, right?
My practiced eye does not see anything worth fitting. You won't be able to do much better than Sam.
Well, I started an analysis using the BP Statistical Review annual data for 2003-2008.
The residuals for an exponential curve were 3.0% of the overall variance, while a linear regression gives 1.2% (or R squared of .988). IOW, the error for the exponential curve was 2.5x as large as for the linear regression.
If Sam will publish the monthly data he used (perhaps EIA?), I can quantify that for that data-set as well.
The question of whether non-EOCD consumption has been unaffected by oil prices and continues to be exponential in the last 5 years is, after all, the heart of this article..
If I have the chance, I'll test a sigmoid function as well.
But Sam has data from 1995 if you look at his Figure 2. Are you discarding that data? Or look at Figure 4 and you can clearly see a concavity in the curve which indicates an acceleration. If you want to use a sigmoid, I suppose this will capture the exponential increase and then the leveling off in the near term but wouldn't that imply a demand destruction in any case? This is what Sam is trying to show, without having to invoke a sigmoid. The concept is essentially to show what happens when the consumption starts hitting the rails.
data from 1995 if you look at his Figure 2. Are you discarding that data?
No, I'm suggesting that there was an exponential growth pattern from roughly 1995 to 2004, and then a slowing growth pattern (either linear or sigmoid) after that.
If you want to use a sigmoid, I suppose this will capture the exponential increase and then the leveling off in the near term but wouldn't that imply a demand destruction in any case?
Sure.
This is what Sam is trying to show, without having to invoke a sigmoid. The concept is essentially to show what happens when the consumption starts hitting the rails.
Well, Sam is concluding that Non-OECD consumption is continuing to grow just as strongly as it did before, as we see from the following:
"The Non-OECD consumption is well modeled by an exponential fit as shown on Figure 2. The equivalent growth rate is around 3.2% per year. One amazing observation is that there is no apparent slowdown in consumption growth due to high oil prices."
This leads him to the following analysis :
"This pattern is very different from what has been observed for the OECD. ...The following scenario is set forth to illustrate how an asymmetric demand destruction could occur between the OECD and the Non-OECD. "
This seems premature.
Then it also seems even more premature to assume a sigmoid. That is a direct consequence of your argument. This is not what I am saying, it is what you are saying. It's OK that you are usurping Sam's point, just as long as everyone else realizes it.
Well, yes, I am suggesting a slightly different interpretation of the data. That's the whole idea of TOD's wiki-like peer-review process, right?
I agree - linear growth fits a bit better than sigmoid for the annual data from 2004-2008.
I'll take a look at Sam's monthly data.
Nick,
Here is the data I used:
http://spreadsheets.google.com/pub?key=tzeeDGlE8tY1WgDKFAzUIew&output=html
if you want a csv file or xls file just change the 'html' at the end for csv or xls.
Thanks for the data!
Well, I see several different "regimes", or patterns.
There's a slower growth regime from 95 to middle 03. There's a sharp rise in 03-04. There's medium growth from 04 to early 08, and deceleration in 08-09.
For the period of 03-09, exponential growth has a sum-of-squares residual error of 9.8%, linear growth has 8.7% error, and a sigmoid has 8.5% error.
I'd say a Gompertz curve would probably fit the overall 95-09 period nicely, but that's a project for another day.
This sugggests that the medium higher oil prices we saw before 08 were good for non-OECD oil consumption (perhaps because of recycled petrodollars). There is a strong hint of oil consumption leveling out, though it's too early for it to be clear.
China, of course, has a strong influence, and we can see these same trends fairly clearly in it's pattern.
The IMF and OECD are asking China and other developing countries to save less and increase internal consumption. While it may help re-balance world trade and have a stimulus effect, is it not bringing forward the next price peak and accompanying recession?
I guess major governments need a follow up recession to give them cover to openly discuss peak oil and more importantly what they should do next.
Will this be inflationary or deflationary?