Current and Future Saudi and Russian Oil Production
Posted by Heading Out on November 3, 2010 - 10:40am
One of the inexorable results of the developing shortage of oil is that prices will rise. It is a prospect that does not particularly concern the Saudi Arabian Administration, Minister Al-Naimi having recently inflated the acceptable range for crude up to $90 a barrel, and JP Morgan has recently predicted an imminent rise to $100, a theme apparently now also taken up by Libya. Higher oil costs lead to higher fuel bills, and there is already a report in the United Kingdom that, in consequence , there may already be an increase in winter deaths.
Because demand for imported oil in countries such as China and India continues to increase at a steady rate, it will only be through the increase in production from the exporting nations that supply can meet such demand, and prices can be held at a relatively stable level.
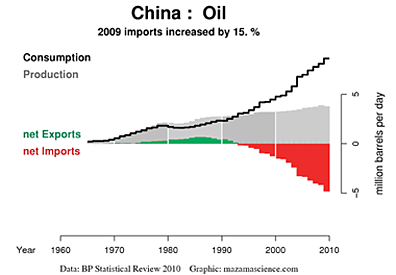
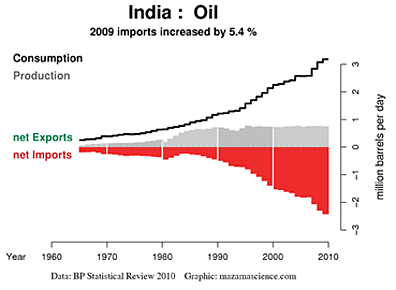
The two plots above are only illustrative of the problem, given that the volumes and relative import/export flows change around the world continuously. However, the world’s two largest producers of oil are Saudi Arabia and Russia.
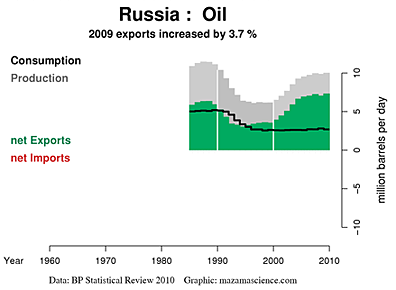
Given the likely continued increase in the world thirst for oil, it is worth reviewing again the potential for increased exports from these two countries. The first is Saudi Arabia, whose oil Minister I quoted at the beginning of this piece.
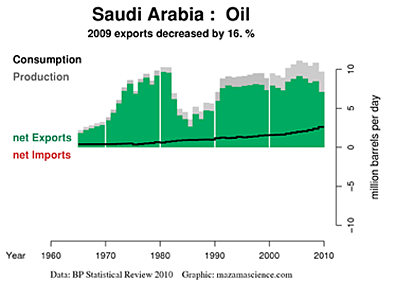
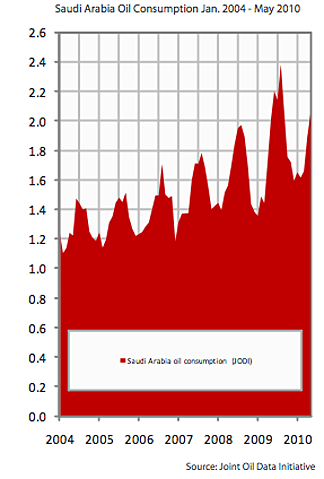
While it is likely that a significant proportion of the oil export drop in 2009 was due to the world recession, the steady rise of the black line, that showing internal consumption, is also contributing to a reduced volume available for export. That rise is perhaps better illustrated with a plot from The Oilwatch Monthly for August.
Whether Saudi Arabia will increase production, and if so by how much, is now one of the more interesting questions for 2011. They have indicated that they are increasingly more concerned with maintaining the long term potential for higher ultimate yield, which requires lower daily production rates, and have already cut their maximum planned production rate to 12 mbd in consequence. If they do not increase flows significantly, then the focus swings to Russia.
Only today Russia was announcing that production had reached a new record of 10.26 mbd for October. The gain was achieved with increased production from Sakhalin Island, and oil exports increased to 4.97 mbd. Whether this level can be sustained, however, remains a critical question.
President Putin has noted that it will take $280 billion in investment to stop a 20% fall in production over the next 10 years, and that investment will only hold production at current levels. Russian consumption has also been relatively flat over the last decade, and one has to wonder if that will continue, given the flow of money into the economy that the sale of the oil is bringing. The increased funding has already stopped the decline in oil production in the country that had been forecast only a year ago.
Production is coming from the relatively new fields such as Vankor (270 kbd), South Khylchuyu, Verkhnechonskoye (51 kbd), Uvat (78 kbd). However production from these fields has been manipulated a little, apparently, by attempts to find helpful tax breaks. Production at South Khylchuyu being a current victim of that, since the field has a potential of 150 kbd, and started at 80 kbd. That production is now all slated to go to China and China has also funded a loan for pipeline construction to Vankor, scheduled to be completed next year, that will carry that production (scheduled to peak at 510 kbd in 2014) to China. Current Vankor production is about 10% above that anticipated last year, but with that gain going to China, and overall production being about level, this suggests that the declines in production from older fields will increasingly hurt exports to the West.
"Vankor say they will do 250,000 bpd next year, but unless you're bringing on very sizeable fields every year, the five percent decline rate in western Siberia will take that out," said Russian oil analyst Oswald Clint of Sanford Bernstein. (last year).
Clearly the current prices of oil are helping to justify the increased production practices from Russia, and their investment in maximizing production.
I am, however, drawn to remember Jonathan Callahan’s presentation at the ASPO meeting. Because that is not yet up on the ASPO site I am going to include my review of it, as it drew the same conclusion as I. The bit that is important is the contrast between the British way of developing their oil reserve, and that of the Dutch.
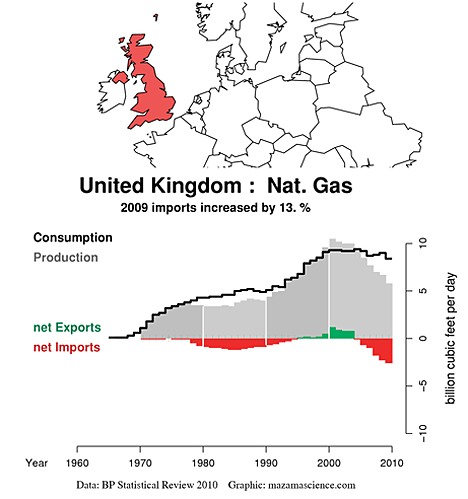
Jonathan used representative plots from the series for his talk, beginning with the UK.
Noting that the UK used town gas (made from coal) until 1959, when the first LNG was imported from LA, gas in the UK was privatized in 1986 and reached peak production in 2000, becoming a net importer of natural gas in 2004. This last winter it was necessary, on three occasions, for the National Grid to issue “Gas Balancing Alerts”, where industrial consumers should reduce use to protect domestic consumers. The situation is anticipated to get worse.
He contrasted this way of managing a resource with that of the Dutch, who have the large Groningen Gas field but which they have managed in a much more conservative way. With their different management philosophy they have retained a considerable margin for the future, over the same time interval.
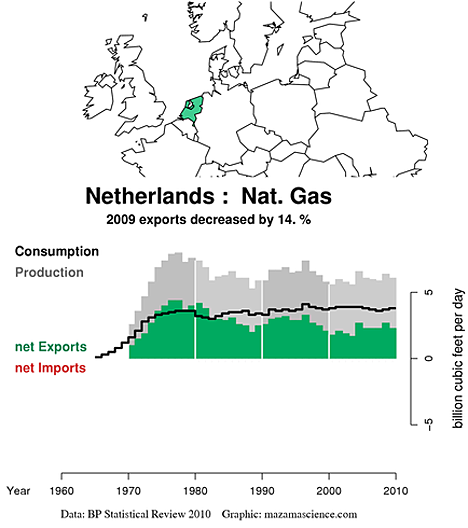
I would suggest that we are increasingly seeing the Russians follow the British model, while the Saudi’s are moving toward the Dutch model. Such changes will likely impact future supplies.
I wanted to mention, too, that in the near future, I plan to shift the focus of my Tech Talks to cover issues more closely related to my discussions in this current post. I plan to start to write about the different countries that have oil reserves (or had) and what we know about them. The idea, in much the same way as with the technical talks, will be to provide an informative set of background notes, so that, for example, if the topic of the Yamal gas fields comes up, you would know a little about where they are (a peninsula in Russia), and how much gas (maybe 30 trillion cubic meters) is there, as well as how soon they will be developed (not this year).
Contact
- Content: editors at theoildrum dot com
- Tech support: support at theoildrum dot com
License

This work is licensed under a Creative Commons Attribution-Share Alike 3.0 United States License.
Here is what Sam Foucher showed in late 2007 for actual and projected annual net oil exports for Saudi Arabia and Russia (actual data through 2006, BP). The low case and high case boundaries are shown. The middle case projected 2005 to 2015 rate of change in net oil exports is also shown (the plus or minus range reflects the low case to high case range).
Actual and projected Saudi net oil exports:
Actual and projected Russian net oil exports:
Top Five Paper:
http://www.energybulletin.net/node/38948
And here is what BP shows for net oil exports from Saudi Arabia and Russia respectively for 2005 to 2009. I suspect that Russian 2010 net oil exports will be approximately 7.3 to 7.4 mbpd.
Saudi & Russian Net Oil Exports (mbpd, BP):
2005: 9.1 & 7.0
2006: 8.8 & 7.1
2007: 8.2 & 7.3
2008: 8.5 & 7.1
2009: 7.1 & 7.3
Russia is falling along the upper end of Sam's projections, but the overall top five numbers are between his middle case and high case, and we should keep in mind that annual Russian production has been virtually flat since 2007. Sam's most optimistic projection is that by the end of 2014, Saudi Arabia, Russia, Norway, Iran and the UAE will have shipped about half of their combined post-2005 CNE (Cumulative Net Exports).
Accepting the net decline in available exports. One could surmise a rise in price; actual or relative, as countries bid on what is available. Once this is worked into the prices of goods and services, the amount of money available for discretionary spending will decrease. This will put a relentless squeeze on the economy until human effort is on parity with the price of fuel.
Am I missing anything?
No, but what's interesting is the divergence between oil consumption patterns in most developing countries and most developed OECD countries, given the long term increase in oil prices since the late Nineties.
Our short summary of our 2010 ASPO presentation, with a couple of scenarios for "Available" global net oil exports (after Chindia takes what they want):
http://www.energybulletin.net/stories/2010-10-18/peak-oil-versus-peak-ex...
It would be difficult to get the amount of 'flow through' or embedded energy in products sold to other countries from Chindia vs. the amount of 'overhead' or internal consumer use.
Given the globalization and outsourcing of manufacturing how do we figure who is consuming what in terms of energy. If we in the US outsource tennis shoes to say China. China consumers more and the US less because of this shift of manufacturing. Yet we are still the consumer.
I find this hard to articulate very well. I suspect the US has continued to rise in energy consumption over that period of time when we show a net decline of use because embedded energy is not factored in.
I understand that China's personal energy consumption (internal not embedded-exported) is and will increase.
I guess I see it very hard to determine who as an end result actually uses what.
I guess it could be argued that what I have laid out doesn't really matter in the big picture. I don't see manufacturing moving back quickly to the US, or at least not quick enough to make an impact. Global net energy decline.
I agree. There is a lot of manufacturing done now in low wage countries. There are other "benefits" of importing goods from lesser developed countries. If they get their electricity from coal, like China, their electricity is very cheap too. And their environmental rules are lax, so little money is spent on protecting the workers and the environment. So things are much cheaper for us, as we outsource to areas with cheap labor and cheap energy. Economists can say proudly how our GDP rises without rise in fossil fuel use. But somehow they are missing part of the picture.
GDP does not rise at all when we import more Chinese goods. And the economists are correct to the extent that as the price of oil rises, over time we will tend to make a transition away from using oil products. For example, if people can afford them (questionable) we could make a transition to 100% electric cars in twenty years. As the price of oil rises, Alan Drake may be able to get major political support for his rail proposals.
As you expect GDP to decline a lot during dropping oilimports, certainly you don't believe hybrids/EV's and rail can keep BAU going.
Even half our current real GDP is still a heckuva lot of GDP. I'm sure that we have the natural resources, the labor, the capital (machinery, tools, trucks, etc.), and the managerial abilities to implement Alan Drake's proposals. Raising financial capital is not an insurmountable problem, especially given the Fed's long-term trend toward easier money.
With regard to electric cars it may be that national real income will decrease so much over the next twenty years that a transition to electric cars will be impossible. It is hard to make any kind of realistic prediction about things like GDP twenty years from now. My guess is only a WAG that real GDP will be half of current real GDP in twenty years. It could be much lower--or much higher.
Then the economic system must change, because now it depends on growth.
As Leanan has stated a few times, BAU may continue much much longer than most posters on TOD believe. At some time there will probably be a decisive tipping point, but on the other hand it may be a gradual transition, as suggested by John Michael Greer in THE LONG DESCENT.
Obviously human labour will get a lot cheaper as supply exceeds demand and the unemployed get hungrier. However,
depending on how you do the calculation, current US oil consumption is equivalent to each citizen having between 30 and 100 slaves working for them full time. There are not enough people in the world to sustain that level of energy production for the US alone.
In practice, other energy sources will substitute for oil as prices rise. Most obvious is natural gas, which is in energy terms a lot cheaper than oil at present. Then other fossil fuels, nuclear and renewables are all cheaper than human labour. Of course, this substitution will only occur slowly, and the economy will continue to contract relentlessly, until supply and demand are once more in balance.
My guess is about 1890s level of economy.
The human requires fuel,the production of human fuel uses oil, human effort cost will increase with oil.
Relative energy and food costs will increase because of scarcity of oil and money. The amount of discretionary income left after the necessities are purchased will decline, sparking an overall decline in economic activity. The occupations in the supply line for items that are cheaper done at home (like making coffee) or more "fringe" items (like blow up santa snow globes) will gradually decrease as demand will decline. Unemployment will rise and the value of labor will decline from simple lack of demand. Just a decrease in the velocity of money being spent will necessarily decrease wages and increase unemployment. Energy is usually dissipated as low grade heat and work(embedded). The work part is where I think the parity between labor and energy will increase.
energy will be going up and labor down due to the surplus of hungry ppl. . kind of like human inflation.
Isn't it high time to stop these "silly" graphs? With the WE ARE HERE arrow and then a line steeply downhill? They will only look stupid in a few years time.
Graphs like this?
I bet you would get a better response by calling it a "boob" shaped production curve. Like the north sea.
" Oh! wow I get it now......"
;)
Come to think of it, there is a new restaurant chain called Twin Peaks, which promises "scenic views."
Since 2007 Russian Crude + Condensate production has risen by about 240 thousand barrels per day. 400 thousand barrels of new oil, since then has come on line from fields, Vankor (270 kbd), South Khylchuyu, Verkhnechonskoye (51 kbd), Uvat (78 kbd). Talakan and Yuzhnoe also came on line during that period but I cannot find numbers for them. All in all it is likely that at least half a million barrels of new Russian oil has come on line since 2007. But actual production has risen by less than half that amount.
But the lions share of Russian oil comes from their old giant fields. Russian oil expert Alex Burgansky stated in September of last year:
Most of those 5,000 to 6,000 new wells, I suppose, is infield drilling in their old giant fields. And there will be fewer of those wells being drilled. At any rate there is only so much oil one can suck out of old fields before they hit the cliff. If that happens it will take several Vankors to keep Russia's production from declining at an alarming rate.
Ron P.
Chart from Russia's Oil Production is About to Peak
where is samotler ?
Samotlor: Reawakening The Giant
http://www.tnk-bp.com/press/publications/5years/samotlor/
TNK-BP Completes 3D Seismic at Samotlor in 2010
http://www.tnk-bp.com/press/news/2010/4/2056/
Samotlor is 73% depleted (2006) and in decline.
TNK-BP's Samotlor Declared World's Sixth Biggest Field (2009)
yes, i am aware of that. the second pdf discusses seven satelites to be developed. it seems this would have made the megaprojects list. maybe that is the problem with megaprojects - omission.
one of the problems tnk-bp is facing is returning wells to production and installing electrical submersible pumps. that and balancing injection with production - not exactly 'new' technology. arutinoff invented the 'reda'(russian electro dynamo arutinoff)pump. too bad for russia, he imigrated to the us in 1923.
http://esppump.com/
during the collapse of the soviet union, the solution apparently was to drill new wells when the old ones watered out. evidently,they still had the ability to drill more and more wells. there are still thousands of idled wells.
the other feature of samotlor not depicted in the graph is that samotlor production is off the chart 90% water-cut or not at 650 -700,000 bopd.
Is anyone still updating the megaprojects wiki? BTW dedicated stories here built around updates would be a good way to garner interest in doing so, imo.
RZ sez Samotlor is at 37.4 mt/year, which at 7.1475121 bbl/ton would be 732 kb/d. Or, heh heh, going by TNK-BP's own Conversion Calculator, 768.5 kb/d. Massaging numbers there, guys? Looks like the field is on a steady decline of around 2.75%.
my figures are from the pdf linked in: awakening the giant
the chart in the pdf shows about 250 million barrels per year or 685kbopd.
who is 'RZ' and where do the figures come from ?
RZ=RIGZONE, in the story Pollux linked to. That TNK-BP article is a couple years old now, since it was published as part of their 5th anniversary, in 2008.
Thanks for the mention, Dave.
Until ASPO gets them up, the slides used for my ASPO talk are also available here:
Natural Gas Net-Export Trends -- A graphical review of the historical data
I look forward to your country-by-country assessments. I think we're overdue for an update and expansion of the kind of information found in Colin Campbell's ASPO newsletters. We do have a global problem but it will play out differently in each nation.
I've begun assembling a reference page of source material for my own investigations along these lines. Any suggestions for that list would be appreciated.
Cheers,
Jon
13/8/2010
Saudi Arabia lost production share to Russia
http://www.crudeoilpeak.com/?p=1800
31/7/2010
Saudi Aramco's crude oil exports peaked in 2005
http://www.crudeoilpeak.com/?p=1738
12/7/2010
Saudi King ordered oil exploration to cease. But will it matter?
http://www.crudeoilpeak.com/?p=1710
Yeah, the Russians seem to have taken the leader position as oil exporters. Of course it remains to be seen how long that lasts. The Saudis may have spare capacity and adding more whereas Russia may be producing at full tilt. Of course much of that Saudi spare capacity may be heavy sour oil that can't be refined anywhere.
I haven's seen an "Oilwatch Monthly" for the last 2 months. What's going on?
dunno - thought it just me
are still working on this ?
Forbin
HEADING OUT
I wonder if you may start with Iraq, I think it is the only country that can change overall global peak production by a few years.
http://www.theoildrum.com/node/6101
The 12 million barrels a day is probably very optimistic, but do we have enough information to rule out 7/9 by 2016 or so
cheers
The IEA seems to think so.
Iran's Falling Oil Output Means Less Revenue, Clout
This IEA chart has Iraq at about 3.5 mbd by 2015. I figure that is about all they will ever produce, even by 2020... if that.
And then we have this just released today.
IEA warns Iraq will miss 2017 oil target
Ron P.
Is this th IEA that predicted in 2005 that global oil production would hit 120 million barrels by 2030. They reduced this to 105million in 2008, where do they think this oil will come from and how reliable are their predictions.
I get the feeling that the IEA is, step by step, backing down from their optimistic predictions. Look for them, within the next four or five years, to say that we are likely past the peak of world oil production. I think they know what is happening but are afraid to unload it on the world in one fell swoop for fear of causing a worldwide panic and crashing all stock markets.
Ron P.
Two of the more interesting people at the ASPO conference were representatives of the IMF and the World Bank, the former in his official capacity, the latter in an unofficial capacity.
Darwinian
Yes it is getting to look that way, personally I share the optimistic view of Energyfiles, from their assessment of countries, they think world production will peak around 2016. Guess we will know in a few years.
regards
Well I am of the opinion that we are at peak right now and have been since 2005. The difference in any year is within the margin of error. There may be a month, or even a year that tops 2005 and/or 2008 but the difference will be so small that it will mean nothing. I believe that by 2016 we will be declining at between 1 and 2 percent per year and it will be quite obvious that the world is post peak.
Ron P.
Ron, Ron, Ron.....
Yaawn.....
Nordic.
Darwinian
The difference between us is not great, what has to be done is to highlight how wrong CERA, USGS and IEA predictions have been and still are.
http://www.econbrowser.com/archives/2006/03/another_look_at.html
From that graph in 2004 CERA thought UK sector of the North Sea would still be producing 2.5 million barrels a day in 2007.
What is still so frustrating is that our UK government still relies on the likes of these organizations for planning new airports and roads, instead of Railways and trams.
regards
I found the graph of SA consumption 2004-2010 and admit I had never seen the annual breakdown in consumption for them. Not only is the annual rate of increase impressive (which I knew) but the variability between winter consumption and summer consumption is facinating. The winter of 08/09 had a low of 1.4 mbd, and the summer of 2010 a high of 2.4 mbd. That's a pretty huge variation! Does that oil consumption in summer reflect air conditioning from burning oil for electricity? Are that many additional Saudi's adding air conditioning? Is the weather in SA subtly hotter each summer over time? I would like to see the same monthly variation adding together all exporting middle eastern countries that burn oil for electricity....
You can look at monthly Saudi consumption broken down by fuel at the unadvertised JODI databrowser.
When you break things out by fuel source you can get a better sense of how much diesel is used for power generation to run air conditioners by looking at the seasonal variation. From the chart below it looks like July, 2010 was unusually hot. ... It was. Also notice the switch to steady imports starting in 2009 and the rapid drop in stocks in the last nine months. Clearly, Saudi refineries cannot keep up with demand.
The story below for gasoline shows a steady, non-seasonal increase in consumption but a similar drop in stocks in the last year:
My question is: "How much lower will stocks go before 'something happens'?"
Note that the JODI data gathering effort is based in Riyadh so we can assume their numbers for Saudi Arabia are pretty good.
Stop the Press.
Sorry about the length, it was the best that I could do and still give you the gist of the argument from here
You have gotta keep an open mind.
I, on the other hand, am a believer.
So I shall build my yacht.
That article links to another...
http://tucsoncitizen.com/christianarts/2010/11/04/theories-of-where-oil-...
...where the agenda becomes a little clearer.
yeah, then there is theory 'c' pseudoabiotic oil, where as in some cases an oil accumulation is fed additional oil from another unknown biotic source. eugene island is often cited as an example. other possible examples are east texas, grant canyon(nevada) and labarge(wyoming).
pseudobiotic oil cases(4 by my count) seem to vastly outnumber demonstratable abiotic cases( ~ 0).
you won't find a reference to pseudoabiotic oil, i made up the term.
That's a good name!
So Bernanke knows that what he is doing cannot be wrong.
pseudoabiotic money from ben ?
fed generated oil !