| 10th ASPO Conference Program | The Oil Drum | Has the Global Economy Become Less Vulnerable to Oil Price Shocks? |
Tech Talk - A Recap in Light of Iranian Sanctions and Canadian Production Estimates
Posted by Heading Out on March 12, 2012 - 5:35pm
This series of posts has just completed a review of the different regions of Russian oil production, with the conclusion that while Russia may maintain current production levels of around 10.4 mbd for a short time, it faces rising domestic consumption levels because it is not replacing existing production at a fast enough rate to be able to sustain exports. Without more investment than is likely available, the rate of new field development (given the harsh and remote nature of the sites) means that there will be a slow decline in available oil to the market starting fairly soon. Given the large supplies of natural gas coming available, this series is going to focus a bit more on oil as we continue the review.
As the series continues and moves slightly down the list to consider the future of the oil and gas fields in Saudi Arabia, it is worth noting that while there is little that Russia can do to significantly raise production in the short term, this does not hold true for the desert kingdom. However, before moving on to KSA in detail, I pause this week to consider some contextual changes in the overall picture.
One of the questions that has been raised many times relates to the true maximum production levels that Saudi Arabia can achieve. As oil prices continue to rise, politicians call for the Saudis to increase oil production, so that prices may fall. This is a rather odd and unrealistic request when the KSA needs all the income it can get to help domestically. The EIA, in considering the global oil flow as sanctions begin to bite on Iran, have projected that OPEC has a spare capacity of 2.5 mbd, most of which comes from KSA. At present the KSA is producing at around 9.7 mbd, up some 600 kbd from this time last year, according to the EIA, although there is a little question as to how accurate that number is.
The IEA is reportedly saying that KSA is already producing at 11.5 mbd. However, the IEA counts all liquids, as Gail the Actuary has pointed out, while EIA values add up to 9.7 mbd for the crude and condensate, and though there appears to be a discrepancy, there really is not. The debate is likely to see some harder numbers in the months ahead. Iran is already having problems marketing their oil, since after January 23, the European Mutual Protection and Indemnity Club is no longer covering shipping contracts. This makes it difficult for consumers such as India to maintain supply, and they are already considering the use of sovereign guarantees for its shipping lines. At the same time, the EU is not calling for coverage to be phased out until July 1.
The EIA report notes that Iran is currently the fifth largest producer of liquid fuels at 4.1 mbd, although it consumes 1.8 mbd of that internally. Thus, the threat to the global market runs at around a 2.3 mbd reduction on current overall demand of around 88.1 mbd. This series will discuss Iranian production and its prospects somewhat later, but before getting into an analysis of Saudi Arabia, it might be worth a quick glance back at a couple of countries covered earlier.
Estimates of future production are only that, and as noted in recent posts, not all projected production or plans work out as anticipated. To give but a few examples pointed out in comments and elsewhere:
The Russian oilfield at Yuzhnoye Khylchuyu was initially estimated to hold 505 million barrels of oil, but has now been reported as only having reserves of 142 mb.. (Noted by voiceinyourhead) On the other hand, the Sarmatskoye field in the Caspian is now considered to contain double the original estimate, estimated at just under 1 billion barrels of oil equivalent in natural gas and condensate. It is anticipated to come on stream in 2016. And, while on the topic of natural gas, both toolpush and RayRay have noted that the natural gas from Sakhalin Island is not going to see the 3rd LNG train that I mentioned in the post on that topic, and that the natural gas will instead feed into a pipeline to the mainland.
In regard to the posts that cover the United States and Canada, the February monthly flow of oil through the Alaskan pipeline has fallen to an average of 609,805 bd. This is down from an average of 624,716 bd in January and gets the flow closer to the point where solidifying wax and water start to cause problems.
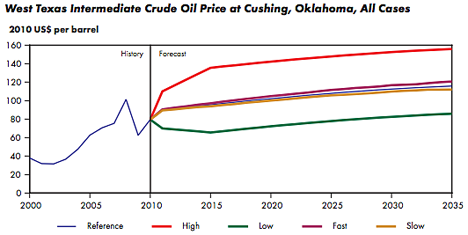
In the time since the posts were written on North American production and promise (politically, including Canada with the United States makes the overall change in production figures look better than if the figures were based solely on US production, particularly as oil from the Albertan oil sands rises to production levels of 3 mbd by 2015) the Canadian National Energy Board (NEB) released their “Canada's Energy Future: Energy Supply and Projections to 2035” report. In seeking to predict future production, the NEB anticipated that the price of a barrel of oil would rise relatively modestly over the next 20 years. Even in their high estimate, they do not see the price rising to more than $160 a barrel by 2035 (who would bet that the estimate is exceeded this year or next?).
The report estimates that in the Reference case, oil production from the oil sands will reach 5.1 mbd in 2035, which is three times 2010 production. This will come mainly from in-situ methods.
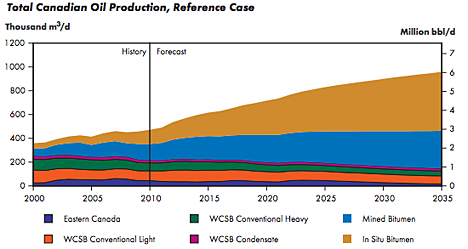
Over the ten years from 2010 to 2020, in-situ production is anticipated to grow at 9% p.a., while mining production will rise at 5% p.a. The North West Upgrader is anticipated to come on stream in 2014, with an initial 50 kbd of throughput. Carbon dioxide produced during the process will be used in Enhanced Oil Recovery (EOR) locally. If the price rises to the highest levels anticipated, then production might be estimated to rise just under 7 mbd in total for Canada by 2035.

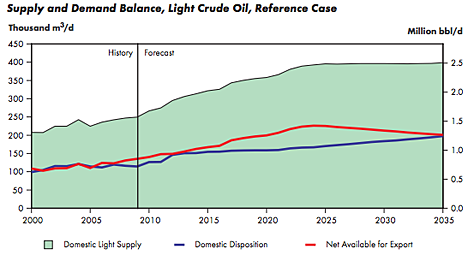
However, the NEB recognizes that domestic consumption will affect overall supply, but considers that it will likely only significantly impact the lighter crudes, and that the difference between the roughly 4 mbd of heavy crude produced and the 3.8 mbd available for export in 2035 will reflect a relatively constant 0.2 mbd of internal consumption.
Therefore, with considerably more oil being available from Canada, there remain concerns over how much will be shipped to the USA, albeit with somewhat less pressure on domestic producers. Which is likely good news, because the likelihood of US production remaining at current levels is still doubtful.
One of the hopes for the future comes from the wells being drilled in the Gulf of Mexico, with DoE projecting that gulf production will rise to some 2 mbd by 2020, from 1.3 mbd at present.
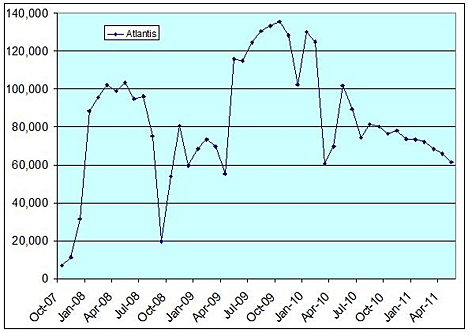
One concern that remains, however, lies in the actual levels of production that will be achieved. As Jean Laherrère has noted, the wells in the deep water have not all held up their promise, peaking on average within a year of coming on line. Jean notes that the production decline with the Mars and Ursa fields are at about 9% per year, which he notes is less than half the decline rate at Thunder Horse. Darwinian is also tracking production, and although he notes that Tahiti is performing relatively consistently at 110 kbd, Atlantis is not coming close to the 185 kbd projected.
Exploration and development in the Gulf are apparently now back to pre-Deepwater Horizon levels, and one can only hope that future developments will be less dramatic and more successful.
The speed of that recovery is encouraging, though the results to date have been a little less promising than anticipated. But, as with operations in the Arctic, investment costs are going to be high for any new finds that are viable, and will take a number of years to develop, at a time when demand is going to continue to increase. The Gulf discoveries, for example, will likely start to come ashore about the time that the Bakken and Eagle Ford plays start to fall in production, and thus, overall, may not give the boost to American volumes that are currently being projected.
Tech Talk - A Recap in Light of Iranian Sanctions and Canadian Production Estimates
PDF version
34 comments
Tech Talk - A Recap in Light of Iranian Sanctions and Canadian Production Estimates
PDF version
34 comments
Contact
- Content: editors at theoildrum dot com
- Tech support: support at theoildrum dot com
License

This work is licensed under a Creative Commons Attribution-Share Alike 3.0 United States License.
While it's certainly true that the US oil industry has done a great job of offsetting the underlying US production decline, and shown increasing production (to a level well below our 1970 peak rate of 9.6 mnpd), the declines in regional net exports (Americas and the Caribbean), in Global Net Exports of oil (GNE) and in Available Net Exports (ANE) are all far in excess of the slow rate of increase in US crude oil production. So, at least until we see a sizable overall decline in global demand, it looks like American consumers will see rising oil prices, despite the slow rate of increase in US crude oil production.
Despite rising net oil exports from Canada and Colombia, note that the combined net oil exports from the seven major net oil exporters in the Americas and the Caribbean fell from 6.2 mbpd in 2004 to 4.8 mbpd in 2010, a 23% decline in six years (BP, see list below).
And this is of course the problem with Newt Gingrich's "plan" for $2.50 gasoline. Even if we could show a massive increase in US crude oil production, in order to bring global crude oil prices down (and the WTI crack spreads show that the US is largely paying product prices at the pump that are linked to global crude oil prices), the US, and other producers, would have to offset the ongoing decline in net exports.
Recent US crude oil production, in the context of declining net exports:
Average annual increase in US crude oil production per year, 2009-2011: About 125,000 bpd per year
(An average net increase in US crude oil production of about 160 bpd per drilling rig per year)
Average annual decline in regional net oil exports from major exporters* in the Americas, 2005 to 2010: 240,000 bpd per year
Average annual decline in Global Net Exports of oil (GNE**), 2005-2010: 600,000 bpd per year
Average annual decline in Available Net Exports (GNE less Chindia's net imports), 2005 to 2010: 1,000,000 bpd per year***
Despite the slow rate of increase in US crude oil production, the dominant trend is that developed oil importing countries like the US are gradually be priced out of the global market for exported oil, as developing countries like the Chindia region consume an increasing share of a declining volume of GNE.
*Major net oil exporters in 2005 in the Americas and Caribbean: Venezuela; Mexico; Canada; Colombia; Argentina, Ecuador and Trinidad & Tobago (Total Petroleum Liquids, BP)
**GNE = Top 33 net oil exporters in 2005, BP + Minor EIA data, Total Petroleum Liquids
***I estimate that the volumetric annual ANE decline rate will increase to between 1,400,000 bpd and 2,000,000 bpd per year between 2010 and 2020.
westexas... that makes the ANE decline to be between 14-20 mbd by 2020... with an average of about 17 mbd. I just looked at the current IEA data on Mexico, and this is what is showed:
2011 DEC Production = 2.93 mbd
2011 DEC Total Demand = 2.24 mbd
2011 DEC Net Oil Exports = 0.69 mbd
The IEA shows a chart that forecasts Mexico's production to decline to 2.84 mbd by Dec 2012. If Mexico's consumption is to increase (and I believe it will as there are several large Gold-Silver mines coming online in 2012), then total demand can increase to approx 2.30 mbd by Dec 2012.
2012 Estimated Dec Production = 2.84 mbd
2012 Estimated Dec Demand = 2.30 mbd
2012 Estimated Dec Net Oil Exports = 0.54 mbd
At this rate, and with the plans for many large mining operations to come online in the next 3-5 years, it looks like Mexico, just might become a Net Importer well before 2020.
I agree with you, take a look at this graph:
http://www.eia.gov/dnav/pet/hist/LeafHandler.ashx?n=PET&s=MTTNTUSMX2&f=M
if you connect the dots, it looks like they will be net importers by 2015
I agree with WestTexas...it's a global oil market. Until world demand turns down expect higher prices. Even after demand turns down, expect higher prices. Cheers.
Regarding Saudi Arabia, their annual net oil exports* (dark blue) versus annual Brent crude oil prices:
*BP, Total Petroleum Liquids. I estimate that their 2011 net exports were between 7.5 and 8.1 mbpd, versus the 2005 level of 9.1 mbpd; the graph shows a midpoint estimate of 7.8 mbpd.
Indonesia Versus Saudi Arabia, a Tale of Two Founding Members of OPEC
It would appear that Indonesia's final production peak was in 1991, at 1.67 mbpd (Total Petroleum Liquids, BP). Note that their Consumption to Production Ratio (C/P) increased from 42% in 1991 to 52% in 1994. If we extrapolate this rate of increase, they would hit the 100% mark in 2003. The 100% C/P line denotes the boundary line between net exporter status, below 100%, and net importer status, above 100%.
The actual data for Indonesia show a C/P ratio of 94% in 2002 and 105% in 2003 (in 2010, they were at 132%).
The same BP data base shows that the Saudi C/P ratio increased from 18% in 2005 to (I estimate) between 28% and 29% in 2011. Using 28%, Saudi Arabia would approach the 100% mark around 2028. Incidentally, this projection implies that Saudi Arabia has already shipped about 46% of their post-2005 Cumulative Net Exports of oil (CNE).
Thanks for the wrapup H O
The Gulf discoveries, for example, will likely start to come ashore about the time that the Bakken and Eagle Ford plays start to fall in production
As I try to keep track of this stuff without the aid of spreadsheets could you flesh this out with a couple years
?2020-2025? ?2018-2023?
All the contradictory posts and articles I've seen on the Bakken make it very difficult for me to get a handle on just where it might be in its production curve, it seems a much larger play (set of plays) than Eagle Ford and I'm not certain how appropriate it is to lump Bakken and Eagle Ford together.
Supposing the Alaskan pipeline does begin to drop below the minimum required to maintain flow, what will the impact be on the PNW? Wouldn't it be a scenario similar to Italy's being cut off from Libya's oil, but with Seattle/Portland customers paying sharply higher prices until another source is wrangled into place?
Minimum TAPS flow is a concern but we will wait and see what the current surge in North Slope explorations turns up. If new supply isn't forthcoming I'd bet dollars to donuts we are not going to strand 300,000 plus barrels per day production. If oil is at $150 a barrel that would be $4.5 billion every hundred days. Some method, either to get the pipeline to function at lower levels or use another system of storage/transport or use some hybrid of the two should be forthcoming. The state has some money socked so it could end up a player if it goes that route.
My rough calculations indicate a 1.5' dia. pipe could carry near 1/7 the peak TAPS volume (approx. minimum for the 4' dia pipe). It would seem feasible to build such a pipe (or maybe a little smaller but better insulated) next to the existing one using almost all of the existing stanchions while the current pipe functions--just a thought--buried sections which include almost all river crossings would still be as expensive as all new but it would be interesting to see the numbers for a smaller pipe run.
There is the issue of the aging oil collection structure, it all needs money. Minimum production will never get near the stripper level, pipelines do not have year-round roads following them everywhere they traverse the permafrost underlain tundra. But $150 a barrel oil will dictate a lower minimum production level than $40 oil. A great deal of the older information out there used the latter number in its calculations.
But then all that said, a set of mishaps that forced a winter shutdown that could not be restarted before the line temperature dropped too far and it might be the best part of a year before the oil was warm enough to move again, if then. That territory is not charted and we all hope it stays that way.
I've heard stories of huge spills across portions of Siberia, I wonder if they ever had pipelines freeze up and just dumped (pushed) some cold oil out where they could to get the lines warm enougn to function.
Wouldn't the easiest solution be to run wires along the pipeline, install heaters at intervals and just heat it?
That would certainly extend the life of the pipeline to some extent.
I've seen a few possibilities thrown out there. It really depends on how much oil is expected to be moved for how long in the end game. There are all sorts of difficulties the old over-sized pipe creates that go away when a properly sized pipe is used, there will be multiple scenarios on which to run numbers. I may have misremembered about what % of river and stream crossing are buried--there are 34 major river and about 800 smaller stream crossings--about 380 miles of the pipe are buried and 420 miles elevated.
Currently we are trying to forestall the end game by finding a bit more oil in the area so crude can keep flowing through the old big pipe with minimum difficulties.
My point is that it is very unlikely we will strand 300,000 plus barrels a day production. There will be some number that just doesn't pay, but I'm guessing it will quite a bit under that so long as oil is demanding a high enough price. As always there will be a revenues dance between the producer/shippers (mostly one and the same at the moment) and the resource owners (now the state and likely in the future also the fed). But TAPS share of the nationally produced crude flow is already much diminished by the endgame it won't be much of contributor at all.
As Luke said, a new line could possibly run alongside the above ground portions, and possibly be run inside of the burried sections to reduce cost and environmental impacts.
Complete all the above ground work first, and have the sections welded and ready to slip in for the burried sections. Then a short shutdown to pull the interior pipe, and you would be back in business.
I am sure it is not that easy, but it may be a valid idea.
That may be, but OPEC has reported 9.7 million bpd for crude only for Saudi Arabia in recent months.
Does anyone has a good sense of what the substantial increase in Canadian Tar Sands production would do to the demand for input items for tar sands production (natural gas, water, et cetera?) My understanding is that the EROI for tar sands production isn't very high.
timetobike
See: Relating Financial and Energy Return on Investment Carey W. King, and Charles A.S. Hall Sustainability 2011, 3, 1810-1832; doi:10.3390/su3101810
And it makes sense why they economy cannot support those prices. A dollar represents the energy you trade (nat gas, coal) to get the type of energy you want (oil). So if the U.S. ends up getting 30% of its oil from a 3:1 EROI source (33% energy consumed to get the energy) then we would need to devote 10% of our energy supply (about half the current natural gas production) to just getting the oil out of the ground. And that does not include the energy needed to refine, transport, or build the roads and cars.
Thus we are in a situation where we are choosing between oil and jobs. Soon it will be choosing between oil and heat.
From the recent Royal Society of Canada report on oil sands it states that natural gas needed to extract in situ bitumen is 20% of the produced bitumen. Add to this the upgrading requirements, and then factor in that not all oil sand is extracted in situ. I think overall we are probably getting an EROEI of 3:1 to 4:1, so it would be safe to use that factor going forward for increased NG demand from oil sands extraction increases. Of course further innovations will reduce NG use per barrel oil produced (only up to a point) but this will be offset by the declining quality of the remaining reserves.
Robert Rapier discusses the EROEI of Oil Sands http://www.consumerenergyreport.com/2012/03/08/gas-prices-keystone-pipel...
It's interesting that Rapier estimates the ERoEI of oil sands at 8:1, based on industry figures. I don't have access to the inside industry data at this point in time, but I would have put it at around 6:1 based on my past experience and understanding of how the oil production processes work.
I think you could confidently assume that the ERoEI is in the range of 6:1 to 8:1. While this involves proprietary information which is not likely to be publicly available, companies watch the numbers closely (they express it in terms of Steam/Oil Ratio - SOR), and try to keep the SOR as low as possible, which is to say the ERoEI as high as possible. They've been making significant progress on this in recent years.
The commonly bandied-about figure of 3:1 would be uneconomic under normal circumstances so companies wouldn't be expanding their oil sands operations if it was true. I think it's something the environmental activist movement made up from who-knows-whatever sources. I'd like to see raw data, and they don't have it because it's proprietary.
Interesting figures for Canada production and consumption. Conventional crude production is at nearly 2 MM barrels per day while consumption is at 1MM barrels per day. Tar sands oil production will grow to 4 MM barrels per day but have only 0.2 MM barrels per day exported by 2035. This forecast assumes that conventional crude production will continue to rise for the next 20 years.
Two things wrong here. From what I have read on TOD over the last five years, conventional oil production in Canada is not likely to rise and will likely fall starting in the next year or two. As population of Canada rises, so will internal oil consumption, just as oil with lower EROEI produces less oil/gas to the market. If a proposed pipeline is built to take tar sands oil and conventional oil east to Ontario and Quebec, then exports of oil from Alberta will decline.
My general impression is that the forecast for Canada's oil exports is too optimistic. Should some effort be made at reducing GHG production, then Canada surely cannot ramp up tar sands production as planned.
Actually, Canadian conventional oil production has been rising somewhat the last few years. It is similar to what is going on in the US. I'm sure if it was in the US the politicians and pundits would be announcing it from the highest broadcasting towers, but this is Canada after all.
Canada has its share of the Bakken Formation in Saskatchewan, Alberta has a similar formation called the Cardium which is also being fracked to death, and oil companies are drilling out the satellite fields on the East Coast offshore fields. All of this is causing an uptick in conventional production.
At the same time, domestic consumption has been falling because consumers are fully exposed to international prices and in addition have to pay higher fuel taxes than in the US. The result is that virtually all of the new oil sands production is going to export.
Canada dropped out of the Kyoto Accord last year, and is not likely to sign a new agreement, so GHG emissions are not a constraint on oil sands development.
It would seem Canada would have conservation options very similar to those of the US. A couple questions. How fast (and where) is Canada's population growing? What is the extimated fuel mileage of the light truck/car segment for all of Canada.
Oh, and thanks for not replying to my pipeline post error before I fixed it. I knew $4.5 billion a day sounded awful big--shouldn't have posted that till I had more time, it now reads $4.5 billion every hundred days. ?-) Still a fair chunk of change that could pay for a fair piece of shipping system construction assuming that high a price and that a sizeable enough portion of the lower level of production could be maintained long enough.
I think Canada's population is growing most quickly in Alberta surprise surprise. Ontario is having economic problems as manufacturing is down but natural resources are up. People are moving west like to the energy just like leaves to the sunshine.
Canada's population is growing at about the same rate as that of the US - the two countries are similar in terms of economic, ethnic, and social profiles. It does bounce around depending on economic conditions, but generally has been averaging out to about 0.9% per year over long periods of time. The Canadian birth rate is somewhat lower, but the immigration numbers are larger.
The fuel mileage of cars and light trucks is generally better in Canada because Canadians tend to buy smaller vehicles, but this is offset by the fact that distances driven in Canada are longer (lower population density, more distance between population centers). I think that it averages out and the fuel consumption per capita is probably about the same. There are no really definitive figures.
It seems to me that while most of the world is quite worried about climate change and global warming, Canada, along with other northern nations, stands to benefit somewhat from it.
Canada has large tracts of agricultural land that would benefit from warmer weather and longer growing seasons. This would partially offset some of the losses elsewhere. Has there been anyone studying this?
Not that I am for keeping the BAU attitude, but change is not always bad. Bad effects in one area can be seen as good effects in other areas. What is the net?
Absolutely remarkable speech given by Iain Conn, head of BP refining, given at the CERA meeting
http://www.bp.com/genericarticle.do?categoryId=98&contentId=7073698
Main points:
- World GDP energy intensity 130 US $ per 1000 US $ GDP. A fallacy because not every energy is priced at brent oil.
- Atlantic bassin demand is going to shrink by about 4.5 Mio Barrels out to 2030
- Peak Oil of conventional crude has been around 2005 ( see chart on page 6 of speech)
In September of 2006, monthly oil production in the Bakken along with several other formations totaled 3 million barrels in North Dakota.
January of 2012 had a monthly production of 16.9 million barrels.
A five fold increase and a reason for gains in domestic production.
https://www.dmr.nd.gov/oilgas/stats/historicaloilprodstats.pdf
Oil fields in the North Sea whose first full year of production was in 1999 hit a production level of one mbpd in 2005, and these new fields contributed to slowing the overall North Sea decline rate to about 5%/year.
And as noted up the thread, US crude oil production rose by about 0.25 mbpd from 2004 to 2011, but combined regional net oil exports, from major oil exporters in the Americas and Caribbean, fell by 1.4 mbpd from 2004 to 2010, from 6.2 mbpd in 2004 to 4.8 mbpd in 2010 (BP, total petroleum liquids). And the decline in global Available Net Exports (ANE) was 5 mbpd from 2005 to 2010. I estimate that the total ANE decline from 2010 to 2020 will be between 14 mbpd and 20 mbpd.
You posted a thread a few months ago about Deepwater GOM production. In that post you showed a chart that had "hoped for" combined production of Atlantis, Thunder Horse and Tahiti to be about 550 thousand barrels per day. Currently it is less than half that and even more alarming the three have a combined decline rate of over 20 percent per year.
The combined production of Atlantis, Thunder Horse and Tahiti in barrels per day. The last data point is November 2011.
Ron P.
Stupid question undoubtedly. But in graphs combining multiple field output, I seem to notice it's always smoother going up and bumpier going down. This might be due to my misjudgment, or maybe a small sample size (?) But could there be something else going on to cause it to be that way?
The ramp up is always much faster than the decline because the maximum pressure is always there at first then it gradually declines. In this case however the fields come on line at different times so the ramp up is not nearly as fast.
Ron P.
Thanks.
Is there more variation in the pressure during the decline? I'm curious as to why the output is so much more variable during the descent phase.
I am not an oilman but the variation in decline is not due to changes in pressure. It is likely due to maintenance on the wells. Remember there are many wells on each platform and they can be cut out at different times because of problems or maintenance on individual wells.
Ron P.
There was a TOD key post or two maybe last spring with lots of data (charts) on GOM production. The ragged decline slopes were very evident and quite a few knowledgeable oilmen chimed in about them. It seems Thunderhorse might have been in the post title. You might find it worth while searching it out.
Does anyone know why this is? Is this due to the technology used or the properties of deep water fields? Thanks