| From Qurayyah to Khurais: Turning Water Into Oil | The Oil Drum | Global Oil Risks in the Early 21st Century |
Tech Talk - Saudi Arabian Oil Production: Part 2
Posted by Heading Out on March 25, 2012 - 10:27am
There is some debate in the mainstream press about the relative causes and impacts of the rising gasoline price on the overall economy. (I paid $4.40 per gallon in Silicon Valley on Sunday, though only $3.67 in mid-Missouri today). As noted in my previous post, the Kingdom of Saudi Arabia is unique in its potential ability to increase oil production at relatively short notice, in order to deal with a shortfall in that overall supply. With the tightening of supplies from some of the nations that have seen the impact of the “Arab Spring”, there is a concern that there may be such a disruption, as was seen during the recent turmoil in Libya. Fortunately the damage to that oil production infrastructure was minor, and the nation seems well on its way to returning to a "business as usual" situation. Unfortunately, there are still Yemen, Syria, Sudan and Iran to worry about, and so available additional supply provides some comfort to the market.
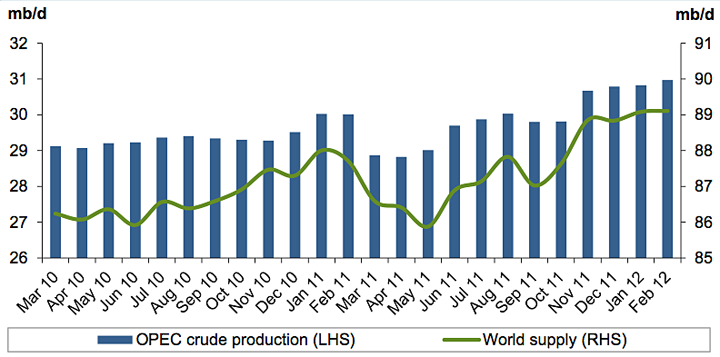
Yet in itself, some of that relief is misplaced. OPEC suggests in its March Monthly Oil Market Report (MOMR) that world oil demand is anticipated to grow by around 900 kbd this year, of which 600 kbd is expected to come from non-OPEC sources. In February, OPEC increased production by 140 kbd to average 30.97 mbd but expects that, over the year, demand for their crude will average 30 mbd. (Note that this does not include stock build-ups, and China has been building their SPR at a rate of up to 0.8 mbd). OPEC also suggests that OPEC NGL production will increase another 360 kbd over 2012. Their plot of global and OPEC oil production over the past two years is below.
In 2008, the KSA had stated that they would have an additional capacity beyond the 9.7 mbd they planned on producing in July of that year, through an available production increment of 900 kbd from Zuluf; 700 kbd from the oil fields at Safaniyah; 300 kbd from Berri; 300 kbd from Khurais; and 250 kbd from Shaybah. Future projects planned at that time were:
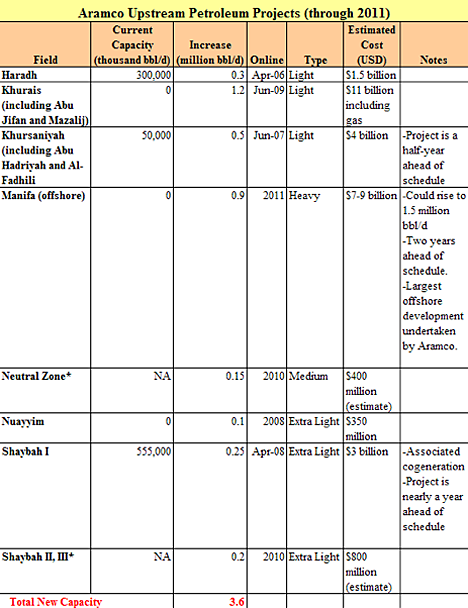
By the time that 2009 arrived with additional improved oilfield production from Khurais (to 1.2 mbd), then the addition of Shaybah (250 kbd) and production from a newly started field at Nuayyim (100 kbd), the KSA was considered to have a spare capacity of 4 mbd. This was an increase of 1.55 mbd over the previous reserve, but must be set against a production decline to 8.2 mbd to give a total of 12.2 mbd available.
Although there have been additional changes in the mix since then, Aramco does not feel the need for further expansion in capabilities. The CEO of Saudi Aramco, Khalid al-Falih, stated in November 2011 that they would stop efforts to increase capacity, and hold production at the then achievable upper bound of 12 mbd. Future development efforts will switch towards natural gas production. Yet, just this week the kingdom has promised to pump some 9.9 mbd during March and April in order to “assure consuming nations that oil supplies will be adequate.” (Ed. note: This does not necessarily mean that they will be able to immediately sell all of this production, though some nations have begun hoarding in concern over anticipated problems of supply later in the year.)
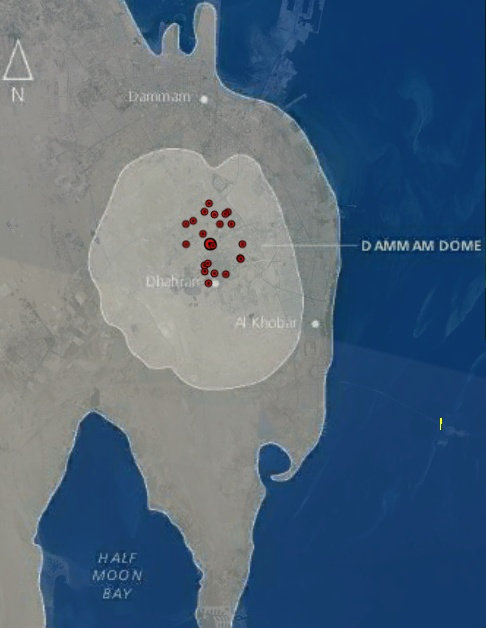
Interestingly, in order to sustain that 12 mbd target, Aramco is planning on re-opening the Dammam field, which has lain dormant for the past 30 years, and which will now be targeted to produce 100 kbd of heavy crude.
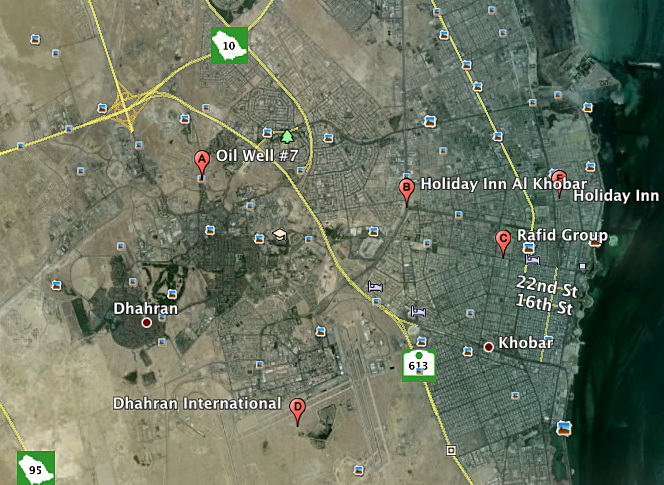
Dammam was where the first wildcat wells were drilled in Saudi Arabia back in 1935, and even though the region had been surveyed since 1933, the first half-dozen wells weren’t that much to write home about. The dome that forms the major geological feature and attracted the first effort, lies under Dhahran and has been resurveyed using 3-D seismic in order to find the best places to build the new wells.
Of course, there is the question as to whether the re-opening of these older fields, such as Dammam, is in order to make even more oil available if needed, or whether the KSA will really need that production just to sustain existing targets. As I hope to explain in the next few posts (building on the previous analysis of TOD contributors and editors), it is much more likely to be the latter than the former.
When the first wells were drilled, none of those dwellings in what is now the city of Dhahran existed; rather, the area was still a desert, and most of the local Bedouin were migratory and lived in tents. At this time the world was in the midst of the Great Depression as the Saudi King was informed that the first well was about to be drilled.
The wildcatters had already started to arrive in the Dammam Dome area where the first well, in drilling lingo, was to be "spudded in." Tents were set up temporarily on a broad terrace near a group of limestone outcroppings. A pier was started down by the shore at al-Khobar, a fishing village. In January 1935, while the geologists were out on the desert reaches continuing their surface explorations, the construction crew was digging a cellar for the first drilling rig.
Most of the pioneer group were experienced in the conditions of wildcatting far away from well-stocked oil field supply centers. They knew how to improvise. Lacking dynamite, they broke up the rock for the derrick cellar by heating the rock with a wood fire and then flooding it with cold water.
By February 19, the cellar was completed, and by mid-April the derrick was up and being rigged. On April 30, the wildcatters spudded in Dammam No. 1, the first oil well in Saudi Arabia.
The hole was first drilled by the cable tool method, a slow process being replaced by the modern rotary rig system at that time. Three crews worked around the clock to "make hole" as fast as possible.
The first well was initially drilled down to around 2,000 ft, but only produced at around 100 bd. In the next year of the effort, a second well initially produced some 3,840 bd and gave an incentive for further drilling, but then fell to a yield of only 225 bd in the same year. No. 3 came in at 100 bd, and number 4 was a dry hole, as was number 5 initially. While number 6 was still being drilled, a deeper well had been authorized as number 7, and this spudded on December 7th, 1936. On March 4, 1938, at a depth of 4,727 ft it began to flow at 1,585 bd, and within three days the flow had increased to 3,690 bd. The well had discovered the Arab D reservoir, and the Dammam well continued to flow for 44 years, producing 32.5 million barrels of oil (Matt Simmons – Twilight in the Desert). At the time, the Saudi king was presented with $50,000 in gold, as agreed.
Saudi production took a number of years to develop, as Euan Mearns discussed in 2007, when he plotted the following graph based on Saudi plans known then:
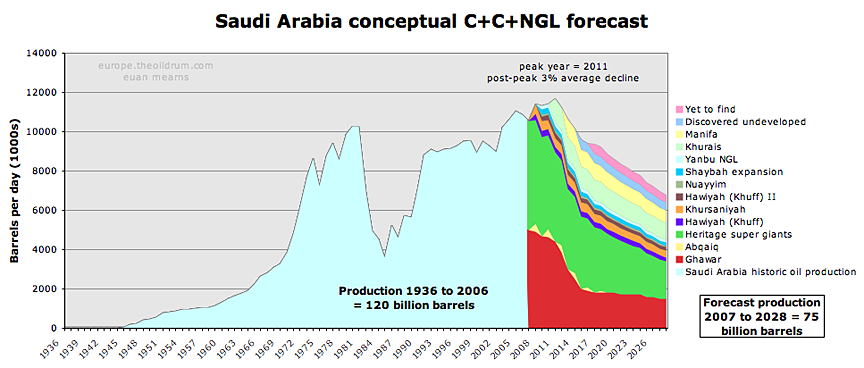
Euan’s post dealt with the decline of the historic fields. Since we are now in the phase of Saudi production in which new oil and reserves are brought on board to match those declines, the topic will focus on this aspect as we consider individual fields of the Kingdom.
Contact
- Content: editors at theoildrum dot com
- Tech support: support at theoildrum dot com
License

This work is licensed under a Creative Commons Attribution-Share Alike 3.0 United States License.
Indonesia once was as Saudi Arabia is now. Before too long, will Saudi Arabia be as Indonesia is now?
I estimate that 2011 Saudi net oil exports will be between 1.0 and 1.6 mbpd below their 2005 annual net export rate of 9.1 mbpd (total petroleum liquids, BP).
Using the lower estimate of 2011 net exports, 7.5 mbpd, Saudi Arabia would approach zero net oil exports in about 16 years, around 2027. Using the higher estimate of 2011 net exports, 8.1 mbpd, Saudi Arabia would approach zero net oil exports in about 19 years, around 2030 (in both cases extrapolating the 2005 to estimated 2011 rate of increase in the ratio (C/P) of Saudi consumption to production of total petroleum liquids). At the 2005 to 2010 rate of change in the C/P ratio, Saudi Arabia would have approached zero net oil exports by the end of 2024. So, the slope of the projected Saudi net export decline has changed slightly.
Note that the 100% C/P point marks the demarcation line between net exporter status (below 100%) and net importer status (above 100%).
A rough rule of thumb* suggests that the Saudis would have shipped half of their post-2005 Cumulative Net Exports (CNE) by the end of 2012, based on the 2010 estimate, and they will have shipped half of their post-2005 CNE by the end of 2014, based on the most optimistic 2011 estimate.
Consider another founding member of OPEC. It would appear that Indonesia's final production peak was in 1991, at 1.67 mbpd (Total Petroleum Liquids, BP). Note that their Consumption to Production Ratio (C/P) increased from 42% in 1991 to 52% in 1994. If we extrapolate this rate of increase, they would hit the 100% mark in 2003.
The actual data for Indonesia show a C/P ratio of 94% in 2002 and 105% in 2003.
*Half of post-peak CNE tend to be shipped about one third of the way into a net export decline. In other words, relatively high initial post-peak net export volumes are disguising a very high post-peak depletion rate, the depletion rate being the rate at which post-2005 CNE are being shipped. Based on the most optimistic 2011 estimate for Saudi net exports, I estimate that the 2005 to 2011 post-2005 CNE depletion rate for Saudi Arabia is about 8%/year.
Saudi production hit a new peak in December 2011 according to EIA - 11.75 mb/d (all liquids). Average production in 2005 was 11.10 mb/d. Saudi demand is up more than 0.65 mb/d since 2005 but I don't think Saudi oil exports are in steep decline (yet).
Although they matched for 2005, there was a pretty good gap between EIA and BP numbers for Saudi production in 2010 (BP was 10.0 mbpd in 2010, EIA was 10.5), which is similar to the gaps we are seeing between the Texas RRC and EIA data for Texas oil & gas production, and presumably partly because of budget cutbacks, the EIA is even having trouble getting accurate numbers for US gasoline consumption out.
In any case, the following chart shows a middle case estimate of 7.8 mbpd for Saudi net oil exports in 2011 (midway between my low and high estimates of 7.5 and 8.1 mbpd). Saudi net oil exports (estimated for 2011) in dark blue, versus annual Brent crude oil prices:
An excerpt from above:
In any case, what is not in dispute is that, as Ron noted some time ago, the higher the production level (and the higher the net export level), the higher the depletion rate. In other words, the conventional "solution" to limited fossil fuel resources is to increase our rate of depletion of finite fossil fuel resources.
Here's a visual confirmation of what westexas is talking about. If Indonesian trends replay in Saudi Arabia, the eyeball estimation would put an end to Saudi exports 20-30 years in the future.
From the Energy Export dabrowser:
Of course those trends won't play out the same. Trends simply cannot go on as they have in the past. Something must change.
And that something is consumption -- in the US in the OECD, in developing nations and in Saudi Arabia itself. Consumption will decrease one way or another, impelled by higher and higher prices.
Forewarned is forearmed.
Jon
My bet is on some version of the 2005 to 2011 trend continuing, i.e., developed oil importing countries like the US continue to be gradually priced out of the global market for exported oil as developing countries like the Chindia region consume an increasing share of a declining volume of global net exports of oil.
For a $10,000 fee now, in 2020 I will let you know what actually happened.
If you're right, in 2020 you'll tell us for free.
I guess that would be a flaw in my business plan.
You had better get that $10,000 now as in 2020 it probably will not get you more than a cup of coffee at Starbucks.:)
I doubt Starbucks would exist if that were the case.
On the other hand, during the early 1930's Great Depression, the value of the dollar was going up (i.e. prices were going down) by ~10% per year for 3 years in a row.
Note that if we compare Saudi (2005) to the ELM model, demand is rising at a much faster rate (+6% vs +2.5%)* but production is falling at a much slower rate (0% vs -5%)**.
As noted above, we see a 500,000 bpd discrepancy between the BP and EIA data bases for Saudi production in 2010, versus the EIA, which is similar to discrepancies between the EIA and the Texas RRC regarding Texas oil & gas production.
But the critical point about Indonesia is that the extrapolation of the initial (three year) rate of increase in their C/P ratio accurately predicted when they would become a net importer. Projecting my most optimistic estimate for annual Saudi data has them approaching zero net oil exports by the end of the next decade. So, I do think that the next two to three years will be critical for determining which direction Saudi Arabia goes, but as also noted above, global importers are in effect living on borrowed time, because the initial slow rate of decline in net exports obscures a sky high depletion rate.
In the case of the ELM, only one third of the way into the net export decline period, 60% of post-peak Cumulative Net Exports had already been shipped. Egypt, the UK and Indonesia showed similar patterns.
Ok, let's substract 500,000 b/d. Then we get the following:
Note that if we compare Saudi (2005) to the ELM model, demand is rising at a much faster rate (+6% vs +2.5%)* but production is falling at a much slower rate (-0.6% vs -5%)**.
*
EIA 2005-2010
2005: 1,963.6 tb/d
2010: 2,650 tb/d
**
EIA (All Liquids)
2005: 11,096.3 tb/d
BP estimated = EIA - 500,000 b/d
2011: 10,670.0 tb/d
No argument regarding ELM versus Saudi Arabia, although the BP rate of increase in Saudi consumption from 2005 to 2010 was 6.8%/year.
For my middle case net export estimate of 7.8 mbpd for Saudi Arabia, I was assuming production of 10.8 and consumption of 3.0 mbpd. The six year rate of change in production would be -0.5%/year. The six year rate of change in consumption would be +6.8%/year. The resulting rate of change in net exports would be -2.6%/year.
Note that the purpose of the ELM was to help me understand, and then explain, "Net Export Math." Based on the ELM, which is supported by multiple case histories, we have observed the following:
(1) Given a production decline in an oil exporting country, unless consumption falls at the same rate as, or at a rate faster than, the rate of decline in production, the resulting net export decline rate will exceed the rate of decline in production;
(2) Given an ongoing production decline in an oil exporting country, unless consumption falls at the same rate as, or at a rate faster than, the rate of decline in production, the resulting net export decline rate will accelerate with time;
(3) Given an ongoing production decline in an oil exporting country, unless consumption falls at the same rate as, or at a rate faster than, the rate of decline in production, net export declines tend to be "front-end" loaded, with the bulk of post-peak Cumulative Net Exports (CNE) being shipped early in the decline phase. Generally about one-half of post-peak CNE are shipped one-third of the way into a net export decline period.
As noted above, it is not in dispute that the extrapolation of the initial increase in Indonesia's C/P ratio accurately predicted the time period for their demise as a net exporter, but what we don't know is if extrapolating the increase in the Saudi C/P ratio from 18% in 2005 to about 28% in 2011 will accurately predict when Saudi Arabia might approach zero net oil exports (using BP data base in both cases). Time will tell, but regardless, the current post-2005 CNE depletion rate for Saudi Arabia is, IMO, quite high, and as noted above, my middle case estimate for the net export decline rate is about five times the estimated six year production decline rate.
westexas,
You are making the assumption that oil demand will continue in the approved exportland model. However, as point out in the article, they have switched from oil exploitation to gas in recent years. Couple that with the contracts for gas-powered powerstations and even talk of nuclear stations, and it's fair to assume that the ~2.4mbpd of oil consumption will stagnate as power generation usages decrease (0.6-1.2mbpd seasonal, could be exchanged for gas usage).
Thus although there is the expected decline in from fields being exhausted, there is scope for the growth in population to not add to their export decline rate.
If I had to guess, I'd say that those in charge of Saudi have aimed at a 'steady state'. Production capped at 10mbpd, with 2 in hand, new, harder, fields added as decline continues, and domestic demand capped as nuclear/gas gradually replace oil in power generation and the population numbers increase.
Meanwhile, they are still building new oil fired power plants:
http://arabnews.com/economy/article573057.ece
Let me also add that the price of petrol is highly subsidised meaning many Saudi Arabians will use big SUVs liberally and with no restraint. Oil consumption will go up. In addition many Arab countries also have highly subsidised energy bills so there is little incentive to conserve couple that with rapid population growth and well you know what I will say next... If there is more civil unrest the tradition response of the Saudi government is to appease its population with more hand-outs.
True, left hand meet right hand - probably via a nice backhander.
However I was describing what seemed to be the policy aims, rather than the practicality. Natural Gas production has been rising, even before the focus on greater exploitation its had since 2001. Nuclear is definitely on the cards 2020+, and you never know, they might seriously look at solar PV ...
As such I'd suggest it's dodgy to assume zero exports by 2030, etc. While they need to keep their young population sweet they HAVE to keep the oil exports going - No. 1 priority. They have multiple methods to achieve this, and appear to be taking most of them.
Baseline assumption, I'd suggest, is that the rise in domestic consumption is curtailed to flatline, by hook or by crook.
First, I usually talk about net exporters, especially Saudi Arabia, "Approaching" zero net oil exports.
Second, it's largely irrelevant to oil importers--assuming that Saudi Arabia's C/P ratio continues to increase in future years--whether Saudi Arabia is net exporting zero barrels of oil in 2030 or one mbpd. The real damage to the the long term supply of post-2005 Cumulative Net Exports (CNE) does not come at the end of the net export decline period, it comes at the beginning.
Consider the ELM. The following graph assumes a production peak in the year 2000, and they hit zero net oil exports in 2009. So, a nine year net export decline:
In the first year of the decline, one-ninth of the way through the net export decline period, Export Land shipped 23% of post-peak CNE. In the eighth year of the net export decline, Export Land only shipped 3% of post-peak CNE.
The three most overlooked aspects to "Net Export Math" are: Depletion, Depletion & Depletion.
Regarding the Indonesian case history--where the initial rate of increase in the C/P ratio accurately predicted when they hit zero net oil exports--the really important question is whether the extrapolation of the 2005 to 2010 rate of increase in Chindia's net imports, as a percentage of Global Net Exports (GNE), will accurately predict when the Chindia region's net imports might approach 100% of GNE. If we extrapolate the current data, the Chindia region's combined net oil imports would approach 100% of GNE in about 17 years, and the total post-2005 supply of Global CNE available to importers other than China & India would be about 50% depleted by the end of next year, 2013.
But you are making the assumption that the C/P ratio continues to increase.
As I said, those in charge in Saudi can recognise the issue as well as you, and better since they know what the real reserve numbers are. If the exports stop, or even slow significantly, so does the gravy train and their necks are on the line.
If, as it appears, they invest to curtail the rise in domestic consumption, then the C/P ratio could end up stationary.
Given what we know, I'd suggest that's a better base case assumption out to 2035.
Assuming, for the sake of argument, that they stabilize their consumption in the next few years, in order to maintain a constant C/P ratio, they would have to have constant production, and given the fact that the majority of their production comes from a group of old oil fields, I think that is very unlikely.
Bit Saudi Arabia has shown a two year C/P plateau of about 28%, versus 18% in 2005. So, the next two or three years will be interesting. Does their C/P ratio stay about the same, decline or increase? Of course, our model (ELM), and our case histories (UK, Indonesia, Egypt) show that an initial increase in their respective C/P ratios forecast their respective arrivals at zero net oil exports. But there are of course counterexamples, frequently related to political unrest, e.g., Colombia.
However, it occurs to me that the larger the group of exporters showing an overall increasing C/P ratio, the more likely it is that the increasing C/P trend line is forecasting all of the unpleasant things that "Net Export Math" implies. So, it could be argued that while the Saudi increase in their C/P ratio from 18% in 2005 to about 28% in 2011 is very worrisome, what is of far greater concern is that overall increase in the top 33 C/P ratio, from 27% in 2005 to 31% in 2010. And of course, then there is the ANE metric.
It's all a bit runecasting - trying to work out what the strategic decisions are of someone who has move information and connection to the aims than you. However you can pull together some scenarios from what you know:
I think you implicitly assume the 'Tragedy' scenario, and I think its the 'Goose' scenario. I'd contend that unlike, say, the UK, Saudi have in recent years shown many signs of trying to strategically plan their production and consumption towards a set of high level aims. Proof of that pudding is in the C/P ratio starting to asymptotically trend towards a value. I'd agree not much sign yet, but I only think they hit on this plan in 2000.
If it's the 'Jack' scenario then I'd expect to see that 10Mbpd (or 12 in extremes) drop over time, whilst progress is still made towards conservation.
On the larger scale, I think democracy and the 'Tragedy' scenario are correlated - which ties in to the exportland aspects. Democratic countries, or ones too scared of their populous, tend to be too 'short term' focused to really give the emphasis to long term strategic goals that it needs. Long term requires the secure belief that you are still going to be in charge down the line - which could be considered a consequential benefit of the oil funded dictators around the world.
Saudi has, in the past, cut production when the market collapsed. In 2008 they were producing every barrel they possibly could. Then most of the world's economies collapsed and they, along with most other OPEC countries, cut production. Now the economy has recovered and prices are so high they threaten to cause another recession. So Saudi and every other OPEC country is producing every barrel they possibly can. They do not want to wreck the economy... again.
From now on, unless the economy completely collapses, Saudi will continue to do what it is doing today, produce every barrel they possibly can.
Ron P.
I am basically making a quantitative argument, based on a simple quantitative model. Generally, I get qualitative responses.
ELM can be simplified as follows: Production declines are inevitable. Given an ongoing production decline in an oil exporting country, unless they cut their consumption at the same rate that production declines, or at a faster rate, the resulting net export decline rate will exceed the production decline rate, and the net export decline rate will accelerate with time.
21 of the top 33 net oil exporters in 2005 showed net export declines from 2005 to 2010. Of these 21, one of them--Nigeria--showed a consumption decline rate that was in excess of the production decline rate, and the Nigerian example is probably not one that most exporters want to follow.
Denmark is a typical case history of an exporting country (successfully) cutting their consumption. Their 2004 to 2010 rate of change in production was
-7.5%/year (BP). Their rate of change in consumption was -0.5%/year. The resulting rate of change in net exports was -18%/year, as their C/P ratio increased from 48% in 2004 to 72% in 2010.
As noted up the thread, the direction of Saudi Arabia's C/P ratio in the next few years is not a certainty, but when we sum the data for the top 33, I think that it is very likely that the top 33 combined are on the same track as the UK, Indonesia and Egypt.
And when we plug in the rate of increase in Chindia's net imports as a percentage of GNE, it suggests that half of the total post-2005 volume of Cumulative Net Exports available to importers other than China & India may have been shipped by the end of next year.
Westexas and the others are not "reading tea leaves" instead you are in denial.
They are trying to inform you that your assumptions run counter to human experience, and you ignore them.
Instead, you irrationally assume the Saudi's can reinvent humanity, and do what no other country on earth has done.
I believe that your analysis flies in the face of growth of the saudi population, depletion of aquifers, failure of KSA agricultural schemes, peaking of global exportable grain supplies, and other issues.
It is very likely that KSA's total production will or has peaked, given the age of the fields providing the bulk of their production, given the remaing fields produce primarily heavy, sour oil.
This does not mean that KSA will suddenly stop producing altogether, what it does mean, is KSA will consume virtually all it's oil internally, whether in Agricultural water schemes, petrochemical plants, transportation, or power production.
INDY
I'm really trying hard to resist the urge to unload on you. Let's see if I can manage it.
The point I'm making to westexas is that you have to be careful in assuming that either a)things must progress in an unthinking, unplanned fashion, or, b) just because some do, that all will. In short, above ground factors are as important as below ground. I'm pointing out that they have, evidentially, taken several actions which point towards at the least the possibility of a long term strategic plan they are pursuing. I suggest that drawing a line on a graph might not get you the right answer, that you need to take into account anticipation - particularly in the circumstance of a country that has one currency earning export.
I'd dispute, strongly, your assertion that humanity is defined by unthinking, animalistic, playing out of reactions to stimuli - that the future is set unavoidably by irrationality. It's there, it's important, but it's not a god.
Isn't that what gets railed against here? That we should be thinking, planning, acting? Rather than expecting the 'free' market to save us?
I'd suggest your denial of the impact, the importance, of humanities intelligence is as bad as an economists' unthinking belief that 'innovation will always provide, if the money is right'.
Suggest you give the three part series "All Watched Over by Machines of Loving Grace" a watch for some perspective on how viewing society as collections of computable automata can be horribly wrong.
http://archive.org/details/AdamCurtis-AllWatchedOverByMachinesOfLovingGrace
Gary, I would not assume that burning the oil locally is unthinking and unplanned. The key missing piece is that even at high prices, most of the value of the oil still goes the the buyer who burns it and benefits from the work created in the burning.
The US went on to not just consume all of its own production but 3x that amount. And in the process it built the worlds largest economy. That is possible because most of the value of the oil was not paid to the producer.
What we are going to see is oil producers climb the value chain and eventually consume most of the value of the oil locally. Indonesia is a perfect example.
What we are going to see is oil producers climb the value chain and eventually consume most of the value of the oil locally. Indonesia is a perfect example.
no doubt but one shouldn't extroplate too far. Indonesia has about 8x Saudi Arabia's population while Saudi Arabia produces better than 8x as much oil as Indonesia.
Latest numbers I could find, 2010, showed Indonesia using 214 Mtoe while Saudi Arabia used 182 Mtoe with Saudi's 2009-2010 energy use increase at 6.8% and Indonesia's increase for that year not far behind at 5.6%.
I mentioned the relative population growth rates of the two countries upthread (that data went to 2008--more current numbers would help).
No doubt Saudi Arabia uses energy much more lavishly than Indonesia--I would like to see the energy used in oil production parsed out seperately however.
So, the point I'm driving at, as useful a tool as the ELM is one must still use caution when using Indonesia present as a model for Saudi Arabia's not too distant future. There are great differences between the two countries that must not be ignored.
As noted up the thread, I concede the point that the future direction for the consumption to production ratio for one specific country is uncertain, but the larger the group of exporters that is showing an increase in their collective C/P ratio, in my opinion the greater the probability that the group will follow in the paths of the UK, Indonesia and Egypt--all former net oil exporters.
And the top 33 net oil exporters' C/P ratio increased from 27% in 2005 to 31% in 2010.
In any case, once a production decline kicks in, here is the key point:
ELM can be simplified as follows: Production declines are inevitable. Given an ongoing production decline in an oil exporting country, unless they cut their consumption at the same rate that production declines, or at a faster rate, the resulting net export decline rate will exceed the production decline rate, and the net export decline rate will accelerate with time.
Yes, I thought yours a very reasonable conclusion. Saudi Arabia may well be a bit of a special case--time will tell (one reason I'd like fresher population growth numbers). The simplicity of ELM gives it real sledgehammer power. The trends just slam you up side of the head.
But as Indonesia and Saudi are compared side by side repeatedly in these comments (note jonathan's charts just down the page) I felt I wasn't at all out of line pointing out some of the big differences between them as well.
As you said earlier, the three words critical to understanding the Net Export Math are 'depletion, depletion, depletion'
...as an Alaskan with TAPS over the ridge that's just out my door I'm painfully aware of that fact.
Re: Depletion, Depletion, Depletion . . .
In the specified peak production year of 2000, "Export Land" net exported 365 mb. Production then declined at 5%/year, and consumption increased at 2.5%/year. Post-peak Cumulative Net Exports (CNE) were 1,382 mb.
The following data show, from left to right, the annual volume of net exports, the remaining post-peak CNE at the end of the specified year and then the percentage of post-peak CNE shipped in the specified year.
Annual Net Exports & Remaining post-peak CNE at end of Specified Year of Decline (mb); Percentage of post-peak CNE shipped in that year
2001: 318 & 1064; 23%
2002: 274 & 790; 20%
2003: 230 & 560; 17%
2004: 190 & 370; 13%
2005: 150 & 220; 11%
2006: 110 & 110; 8%
2007: 73 & 37; 5%
2008: 37 & 0; 3%
2009: 0 & 0
If we break the net export decline period into thirds, 60% of post-peak CNE were shipped in the first third, 32% were shipped in the middle third, and 8% were shipped in the final third.
If we extrapolate the 2005 to 2010 Global Net Exports (GNE) C/P ratio data, the end of the first third of the GNE decline period would be 2020.
If we extrapolate the 2005 to 2010 Chindia Net Imports to GNE ratio data, the end of the first third of the Available Net Exports (ANE) decline period would be 2013.
Yep westexas, I tend to agree with all of that. Well, excepting Russia where I think they may follow the "Jack" scenario - they are big enough that, providing their economy is in reasonable shape, it's viable.
As I've banged on before, I see exportland as one example of the general class of unequal resource allocation models post peak - the 'lands model. Those with exports will tend to service domestic usages first, if there are no other drivers pushing them another way.
Those potential other drivers include:
These shape and reshape the resource allocation question, post peak, into new shapes. The US and China will have the muscle to force capitulation from many countries (US will force Canada, Mexico, China those countries where it already has a foothold). Europe might, but it's less certain with the impact of the eurozone collapse. Others will be out of luck and will suffer the effects of the unequal resource allocation even faster than would be expected (Africa, South America, South & SE Asia). Eventually other effects will come into play, and the issue of who's land the oil is under will matter less, as geopolitics and desperation really come into play.
According to this source, Saudi's consumption for electric power generation is expected to be 1.233 million barrels of oil equivalent, per day in 2012.
Kingdom likely to consume 450 million barrels of oil for power production.
http://www.steelguru.com/middle_east_news/Kingdom_likely_to_consume_450_...
Regarding the possibility of switching from oil to natural gas and nuclear for electricity production, it is worth looking at the overall energy production profiles for Indonesia vs. Saudi Arabia:
Just as Indonesia's oil production began declining and they started moving toward zero net exports, their production and export of coal begain skyrocketing.
Saudi Arabia will have no such happy story with other energy sources:
I tried to cover the Saudi consumption story in What is "our" oil doing in their economy. I don't see any way that their oil consumption can decrease without igniting major social unrest. As long as oil prices keep going up faster than internal consumption they can kick the can down the road for another decade or two. But it is hard to escape the reality that their population is already far beyond the carrying capacity of their landmass.
•Hydro -- not so great in the desert
but it would seem solar would have some potential, any special reason you didn't mention it?
Indonesia's population growth does look to be leveling off. It surprised me to find that it had about the same growth rate as Norway 2002-2008, but Indonesia does have more than fifty times as many people . Saudi Arabia appeared to be roaring on growing at about a seven and half times higher rate as they approached 30 million.
Obviously a lot higher oil production per capita in Saudi than in Indonesia, but then Libya had nearly as high per capita oil production as Saudi Arabia--not hard to see how there could be a lot of pressure for the latter to hold programs in place that keep the domestic oil tap flowing strong.
At $2-3/Watt, solar should be the way to go for KSA, why they are still building oil fired electricity plants is beyond comprehension. I had heard about some developments in this respect but they still appear to be niche.
http://www.solarthermalworld.org/node/3272
They are building oil/gas fired plants because thy don't have enough batteries to last all night. And no, the sun don't shine at night in Saudi Arabia either. In the summer the temperature sometimes reaches 115 degrees F and it hardly cools off any at night.
Of course they can still save fuel by using solar in the daytime, but they still must have power at night.
Saudi's power plants burn natural gas most of the time. They have only started burning oil because they don't have enough gas. But still the bulk of their electricity is generated by gas. All their power plants of course can burn either in their boilers.
Ron P.
Agreed, storage is a big problem. But there are simple solutions like pumping water overhead. Also most of the electricity demand is in the day, so solar can mitigate a lot of problems if not all.
If I were a Saudi Royal I'd be building desalination plants that run on Solar, would kill two birds with one stone.
Pumping water "overhead"? There are no rivers in Saudi. There are a a few low mountains along the Western part of the country.
So you propose that they build a giant reservoir on top of those mountains. And giant pumps to pump the water up the mountain. And generators to generate electricity as you release it. And another giant reservoir at the bottom of the mountain to catch the water as you release it.
And the electricity you would generate from such a scheme might power a small town. I think it would take a few hundred years to generate enough electricity to pay for such a scheme.
Building a very large "lake" on the side of a mountain where there are no natural boundaries to hold the lake would be a task that would cost tens of billions.
Ron P.
not to mention the reservoir evaporation issue
I would call for Spain to help building molten salt solar plants. Store and use heat during the night.
Saudi's power plants burn natural gas most of the time. They have only started burning oil because they don't have enough gas
it appears Saudi Arabia has generally generated more electricity from oil than from gas though the split has been fairly close to even for a while now. No doubt the mix would favor gas if they had more of it.
I see why Jonathan didn't mention solar--my eyes can't see any red in that chart at all
This is why they have been so desperate to find natural gas that they have invited outsiders in to help them. They know burning that oil for electricity is a terrible waste of potential oil exports.
They really do need to jump into solar big time. That graph ends before solar became cheap. Although solar is generally viewed as expensive in most places it probably makes a LOT of economic sense to do solar in Saudi Arabia where: (1) they have a lot of sunny weather; (2) low lattitude; (3) the PV power will displace oil-generated power which could be fetching $100+/barrel in the export markets.
They should really be installing solar like crazy. Yes, I know the sun doesn't shine at night but they probably are no where even close to covering their daytime peak amount yet.
China should trade them solar panels for oil.
The reason they are not using Solar more extensively is because it would blow their story there is no Oil supply problem.
I do eventually though expect to see riots at Soccer Stadiums in Saudi Arabia.
Here is what Sadad al-Husseini had to say on the subject of oil supply problems:
Interview with Sadad al Husseini—“The Facts Are There”
http://www.energybulletin.net/node/50234
Heading out, your top chart compares world All Liquids with OPEC Crude Only, apples and oranges, or almost. If you had used world crude only we would have been able to compare apples to apples.
It makes a difference. World all liquids increased by just over 2.5 million barrels per day from 2005 to 2011 or by 2.94 percent. World Crude + Condensate increased by 293 thousand barrels per day during the same period or 0.4 percent. 293 kb/d is well within the margin or error. In fact JODI has world C+C peaking in 2006.
Otherwise it is a fantastic post, thanks.
Ron P.
There is a considerable difference between what the EIA says Saudi produced and what virtually everyone else says they produced. I have charted what JODI says they produced (C+C), what the EIA says they produced (C+C) and what the OPEC Oil Market Report (Crude Only) says Saudi produced.
Saudi Arabia oil production: The EIA data is through December 2011, the JODI data is through January 2012 and the OMR data is through February 2012, in thousands of barrels per day.
Notice the great divergence that begins February 2010 and lasts for the entire year.
Ron P.
I vaguely recall a rumor about the EIA shifting to using the IHS data base for production numbers. If true, that might explain a lot, plus the ongoing budget cutbacks. In any case, with a 500,000 bpd (total petroleum liquids) discrepancy for just Saudi Arabia, between the EIA and BP for 2010, it's likely that we have, at best, only two significant figures of semi-reliable data for global production numbers.
Hi Ron,
Great Chart. I have also looked at this issue and it looks to me as though the differences between the EIA and JODI data may be due to under reporting by Saudi Arabia when OPEC quotas call for a limit to production. Many people assume that the opec members produce more crude than the official opec quota. Could the differences during 2010 possibly reflect this? I also noticed big discrepencies in both Canadian and Venezuela crude output between EIA and JODI, but this may be due to differences in how extra heavy Venezuela crude and bitumen are reported by each of these countries to JODI and how the EIA chooses to report these numbers. Besides OPEC, Canada, and Russia most other countries match up pretty well in the JODI and EIA crude data.
DC
HO,
Insight: Discoveries in the Middle East
http://www.oiledge.com/n/Insight_Discoveries_in_the_Middle_East/35442549...
and,
The Emergence of the Arabian Oil Industry
http://www.geoexpro.com/article/The_Emergence_of_the_Arabian_Oil_Industr...
I've had my doubts about the report linked by HO, as it says that the Dammam redevelopment will produce heavy oil. Based on the areal extent and thickness etc. of the Arab-D suggests that it could conservatively have at least 10 times the amount already produced (50 million barrels to date) of that 34-35 API oil.
If the oil is that plentiful and light then why hasn't Dammam been produced more heavily in the past?
A good question. Here is a brief timeline:
They had quite a few wells, but most of the oil came from #7, which they shut off in the '80s at the same time they shut down half of Ghawar, and it was reportedly still doing 1800 bpd. My guess is that the aquifer support isn't very good, and there might be some fracture problems.
Initial drilling at Dammam was dissapointing because oil on Bahrain was found in a shallower zone.
First Oil Well in Bahrain
http://www.asiarooms.com/en/travel-guide/bahrain/sightseeing-in-bahrain/...
Those were the days when finding 'anticlinal' oil could be as easy as drilling on a topographic high. There was still some controversy about the anticlinal 'theory' of oil production, because drilling on an anticline wasn't always successful. Geology was considered, by some, as little more than voo-doo.
Reference: 'Oil on their Shoes - Petroleum Geology to 1918' by Ellen Sue Balkey AAPG-1985.
If the holdup was mainly about aquifer trouble, then wouldn't that imply that they could have gotten reliable production from the field any time they wanted just by throwing a little more money at it? As if the field wasn't too far from functioning as shut-in capacity?
If that was the case then I would expect them to have used the field periodically. There has been plenty of chatter about Aramco having possibly (probably?) overproduced their huge superstar fields at times of high demand.
Saudi Aramco shut-in the field in the (late ?) '80's when oil price collapsed. Saudi Aramco's plan is to redevelope the field with all new horizontal maximum reservoir contact wells:
Dammam Dome to Get 3-D Seismic
http://www.gulfoilandgas.com/webpro1/MAIN/Mainnews.asp?id=3671
Saudi Aramco Targets $1.2B, 100,000 B/D Dammam Field Development
http://www.rigzone.com/news/article.asp?a_id=67759
Dammam is now in an industrial/residential area, so this is not a typical mega-sized Saudi Aramco project. But the cost is reasonable, by today's standards:$12,000/bopd and re-development costs of $ 2.40 per barrel.
No smoking gun here, in my opinion.
The question is whether they can recover an additional 0.5 Gb from the field, as Joules points out. I'm not sure where the 50 million barrels cummulative comes from, 32 million of which came from Dammam no. 7.
Off the top of my head -- where it probably should have stayed (I thought I read that somewhere). A 1975 Rand report said Dammam had cumulatively produced 545 MM barrels. My real bad.
great article.
The initial table provides CAPEX costs for the different projects, what would be a current "broad estimate" regarding KSA oil production average cost per barrel (including CAPEX and OPEX) ?
If I were an Iranian General, I would target all of this infrastructure in Saudi Arabia with missiles and sabotage by sympathetic Shias once the Israeli/(the same as Israeli)--USA attacks begin.
Yes, one doesn't need to block the Straits of Hormuz to curtail oil being transported through them.
Yeah, that is exactly what I have been saying. There will be no war because everyone knows it would be a mess. If we seriously attacked, Iran could launch everything they had at the Saudi Oil infrastructure that is just across the Gulf. Taking all the Saudi oil off the market would meltdown the world economy.
I wondered the same thing - why go to all the trouble to try and block the Straits when bombing Saudi oil infrastructure is so much easier and would impact world oil supply to a much greater degree and for a longer period of time? However, doing so invites the destruction of Iranian oil infrastructure. Those who live in glass houses, etc, however Amenijad is such a nut he just might. If so, with Saudi and Iranian oil off the market for say three months the world economy tanks with no forseeable recovery possible, at least not as a world economy.
When the toughest kid in your school is severely addicted to a drug and at the edge of withdrawals, you don't want to threaten his only drug dealer. The dealer might have given you rightful reason to beat him up but that's beside the point.