Global Oil Risks in the Early 21st Century
Posted by JoulesBurn on March 26, 2012 - 2:24pm
This is a guest post by Dean Fantazzini, Moscow School of Economics, Moscow State University, Moscow, Russia; Mikael Höök, Uppsala University, Global Energy Systems, Department of Physics and Astronomy, Uppsala, Sweden; and André Angelantoni, Post-Peak Living, San Francisco, CA. This paper has been previously published in Energy Policy, Volume 39, Issue 12, December 2011, Pages 7865-7873.
Abstract:
The Deepwater Horizon incident demonstrated that most of the oil left is deep offshore or in other locations difficult to reach. Moreover, to obtain the oil remaining in currently producing reservoirs requires additional equipment and technology that comes at a higher price in both capital and energy. In this regard, the physical limitations on producing ever-increasing quantities of oil are highlighted, as well as the possibility of the peak of production occurring this decade. The economics of oil supply and demand are also briefly discussed, showing why the available supply is basically fixed in the short to medium term. Also, an alarm bell for economic recessions is raised when energy takes a disproportionate amount of total consumer expenditures. In this context, risk mitigation practices in government and business are called for. As for the former, early education of the citizenry about the risk of economic contraction is a prudent policy to minimize potential future social discord. As for the latter, all business operations should be examined with the aim of building in resilience and preparing for a scenario in which capital and energy are much more expensive than in the business-as-usual one.
1. Introduction
An economy needs energy to produce goods and deliver services and the size of an economy is highly correlated with how much energy it uses (Brown et al., 2010a, Warr and Ayers, 2010). Oil has been a key element of the growing economy. Since 1845, oil production has increased from virtually nothing to approximately 86 million barrels per day (Mb/d) today (IEA, 2010), which has permitted living standards to increase around the world. In 2004 oil production growth stopped while energy hungry and growing countries like China and India continued increasing their demand. A global price spike was the result, which was closely followed by a price crash. Since 2004 world oil production has remained within 5% of its peak despite historically high prices (see Figure 1).

Figure 1. Oil production stopped growing in 2004 while demand continued to increase. The result was a global oil price spike that contributed to the subsequent economic contraction. Liquid fuels include crude oil, lease condensate, natural gas plant liquids, other liquids, and refinery processing gains and losses as defined by the EIA. Source: Hirsch (2010)
The combination of increasingly difficult-to-extract conventional oil combined with depleting supergiant and giant oil fields, some of which have been producing for seven decades, has led the International Energy Agency (IEA) to declare in late 2010 that the peak of conventional oil production occurred in 2006 (IEA, 2010). Conventional crude oil makes up the largest share of all liquids commonly counted as “oil” and refers to reservoirs that primarily allow oil to be recovered as a free-flowing dark to light-coloured liquid (Speight, 2007).
The peak of conventional oil production is an important turning point for the world energy system because many difficult questions remain unanswered. For instance: how long will conventional oil production stay on its current production plateau? Can unconventional oil production make up for the decline of conventional oil? What are the consequences to the world economy when overall oil production declines, as it eventually must? What are the steps businesses and governments can take now to prepare?
In this paper we pay particular attention to oil for several reasons. First, most alternative energy sources are not replacements for oil. Many of these alternatives (wind, solar, geothermal, etc.) produce electricity, not liquid fuel. Consequently, the world transportation fleet is at high risk of suffering from oil price shocks and oil shortages as conventional oil production declines. Though substitute liquid fuel production, like coal-to-liquids, will increase over the next two or three decades, it is not clear that it can completely make up for the decline of oil production.
Second, oil contributes the largest share to the total primary energy supply, approximately 34%. Changes to its price and availability will have worldwide impact especially because alternative sources currently contribute so little to the world energy system (IEA, 2010).

Figure 2. Fuel shares of world total primary energy supply. The “other” category includes tidal, solar and wind generation. Source: IEA (2007)
Last, oil is particularly important because of its unique role in the global energy system and the global economy. Oil supplies over 90% of the energy for world transportation (Sorrell et al., 2009). Its energy density and portability have allowed many other systems, from mineral extraction to deep-sea fishing (two sectors particularly dependent on diesel fuel but sectors by no means unique in their dependence on oil), to operate on a global scale. Oil is also the lynchpin of the remainder of the energy system. Without it, mining coal and uranium, drilling for natural gas and even manufacturing and distributing alternative energy systems like solar panels would be significantly more difficult and expensive. Thus, oil could be considered an “enabling” resource. That is, it enables us to obtain all the other resources required to run our modern civilization.
2. The production perspective
It is commonly claimed that peak oil, i.e. the concept that oil production will reach a maximum level and then decline, is only about geology. To some extent this is a result of the polarized debate that has raged between geologists, such as Hubbert (1949; 1956) or Campbell (1997; 2002), and economists, including Adelman (1990) and Lynch (2002; 2003). In fact, peak oil is the result of a complex set of forces that includes geology, reservoir physics, economics, government policies and politics. However, a solid understanding of the peaking and subsequent decline of oil production begins with acknowledging the natural laws that create a framework for everything. The intrinsic limitations of these laws eventually affect all human activities because neither economic incentives nor political will can bend or break these laws of nature.
There are a number of physical depletion mechanisms that affect oil production (Satter et al., 2008). Depletion-driven decline occurs during the primary recovery phase when decreasing reservoir pressure leads to reduced flow rates. Investment in water injection, the secondary recovery phase, can maintain or increase pressure but eventually increasingly more water and less oil is recovered over time (i.e. increasing water cut). Additional equipment and technology can be used to enhance oil recovery in the tertiary recovery phase, but this comes at a higher price in terms of both invested capital and energy to maintain production. The situation is similar to squeezing water out of a soaked sponge. It is easy at first, but increasingly more effort is required for diminishing returns. At some point, it is no longer worth squeezing either the sponge or the oil basin and production is abandoned.
Another way to explain peaking oil production is in terms of predator-prey behavior, as Bardi and Lavacchi (2009) have done. Their idea is that, initially, the extraction of “easy oil” leads to increasing profit and investments in further extraction capacity. Gradually the easiest (and typically the largest) resources are depleted. Extraction costs in both energy and monetary terms rise as production moves to lower quality deposits. Eventually, investments cannot keep pace with these rising costs, declining production from mature fields cannot be overcome and total production begins to fall.
An additional factor plays an important role. In both models, regardless of the abundance of capital or high prices, an oil well is unable to deliver net energy at some point. Hubbert (1982) wrote: “There is a different and more fundamental cost that is independent of the monetary price. That is the energy cost of exploration and production. So long as oil is used as a source of energy, when the energy cost of recovering a barrel of oil becomes greater than the energy content of the oil, production will cease no matter what the monetary price may be.”
These physical trends conspire to make oil production increasingly difficult and expensive in monetary and energy terms. Economic incentives and technological advancement can slow these trends but they cannot be stopped.
2.1 Oil production today
Production peaks occur for many energy sources ranging from firewood and whales to fossil fuels (Höök et al., 2010). Currently, around 60 countries have passed “peak oil” (Sorrell et al., 2009) — their point of maximum production. In most cases this is due to physical depletion of the available resources (e.g. USA, the UK, Norway, etc.) while in a few cases socioeconomic factors limit production (e.g. Iraq).
Attempts to disprove peak oil that focus solely on the amount of oil available in all its forms demonstrate a fundamental, and an unfortunately common confusion between how much oil remains versus how quickly it can be produced. Although until recently, oil appeared to be more economically available than ever before (Watkins, 2006), others have shown this to be an artifact of statistical reporting (Bentley et al., 2007). Further, it is far less important how much oil is left if demand , for instance, is 90 Mb/d but only 80 Mb/d can be produced. Still, the most realistic reserve estimates indicate a near-term resource-limited production peak (Meng and Bentley, 2008; Owen et al., 2010).
Total oil production is comprised of conventional oil, which is liquid crude that is easy and relatively cheap to pump, and unconventional oil, which is expensive and often difficult to produce. It is vital to understand that new oil is increasingly coming from unconventional sources like polar, deep water, and tar sands. Almost all the oil left to us is in politically dangerous or remote regions, is trapped in challenging geology or is not even in liquid form.
Today, over 60% of the world production originates from a few hundred giant fields. The number of giant oil field discoveries peaked in the early 60s and has been dwindling since then (Höök et al., 2009). This is similar to picking strawberries in a field. We picked the biggest and best strawberries first (just like big oil fields they are easier to find) and left the small ones for later. Only 25 fields account for one quarter of global production and 100 fields account for half of production. Just 500 fields account for two-thirds of all the production (Sorrell et al., 2009a). As the IEA (2008) points out, it is far from certain that the oil industry will be able to muster the capital to tap enough of the remaining, low-return fields fast enough to make up for the decline in production from current fields.
All oil sources are not equally easy to exploit. It takes far less energy to pump oil from a reservoir still under natural pressure than to recover the bitumen from tar sands and convert it to synthetic crude. The energy obtained from an extraction process divided by the energy expended during the process is the Energy Return on Energy Invested (EROEI). It is a return on investment calculation applied to a physical process. As Hubbert noted, regardless of the price the market is willing to pay for oil, just as we won’t spend a dollar to receive only a dollar in return, when we expend as much oil as we get back from a particular oil deposit, production will stop.
The EROEI of US domestic oil production (chiefly originating from giant oil fields) has declined from 100:1 in 1930 to less than 20:1 for developments in the 2000s, e.g. Gulf of Mexico,(Gately, 2007; Hall et al., 2008; Murphy and Hall, 2010). Since giant and super giant oil fields dominate current production, they are good indicators for the point of peak production (Robelius, 2007; Höök et al., 2009). There is now broad agreement among analysts that the decline in existing production is between 4-8% annually (Höök et al., 2009). In terms of capacity, this means that roughly a new North Sea (~5 Mb/d) has to come on stream every year just to keep the present output constant.
In 2010, the IEA (2010) abruptly announced that the peak of conventional oil production was reached in 2006. The IEA also again lowered their estimate of total world oil production to less than 100 Mb/d by 2035. However, it has been shown that the IEA oil production model is flawed. To reach the production level in their model, they assume oil field depletion rates that are so high that they have never been seen in any oil region before (Aleklett et al., 2010). The remaining oil simply cannot be produced as quickly as would be required to push the production peak as far into the future as they project, thus the peak must occur sooner than the IEA asserts. Miller (2011) found that the IEA had not addressed any of the recent critique and concluded that the IEA outlooks likely remain too optimistic.
Most discussions about oil focus on the size of the resource left. However, in the near term, it is far more important to pay attention to production flows and the constraints operating on them. Peak oil is the point in time where production flows are unable to increase. It is not just underinvestment, political gamesmanship or remote locations that make oil production increasingly difficult. The physical depletion mechanisms (increasing water cut, falling reservoir pressure, etc.) will unavoidably affect production by imposing restrictions and even limitations on the future production of liquid crude oil. No amount of technology or capital can overcome this fact.
3. The economic perspective
3.1 The economics of oil supply
One important feature of oil supply is its cyclical boom and bust cycle in prices and production. Maugeri (2010, p. 12-13) describes this phenomenon: “if petroleum becomes scarce and there is no spare capacity...oil price climbs. This rise in prices fosters a new cycle of investment from which new production will flow. It also triggers gains in energy efficiency, consumer frugality and the rise of alternative energy resources. By the time the new production arrives at the market, petroleum demand may have dropped. This vicious circle has been a feature of all oil crises of the past.”
However, oil production recently became less responsive to traditional economic stimuli. The first decade of this century witnessed a dramatic increase in oil exploration and production when the price of oil increased (Sorrell et al., 2009; 2009a). Unfortunately, as noted already, total world oil production seems to have reached a plateau nonetheless. To a large degree this is because the oil that remains tends to be unconventional oil, which is expensive and takes more time to bring to market. Some consequences of having extracted much of the easy oil are the following:
a) It takes significantly more time once a field is discovered to start production. Maugeri (2010) estimates it now takes between 8 and 12 years for new projects to produce first oil. Difficult development conditions can delay the start of production considerably. In the case of Kashagan, the world’s largest oil discovery in 30 years, production has been delayed by almost 10 years due to difficult environmental conditions.
b) In mature regions, an increased drilling effort usually results in little increase in oil production because the largest fields were found and produced first (Höök and Aleklett, 2008; Höök et al., 2009).
c) Because the cost of extracting the remaining oil is much higher than easy-to-extract OPEC or other conventional oil, if the market price remains lower than the marginal cost for long enough, producers will cut production to avoid financial losses. See Figure 3.
d) Uncertainty about future economic growth heightens concerns for executing these riskier projects. This delays or often cancels projects (Figure 4).
e) Most remaining oil reserves are in the hands of governments. They tend to under-invest compared to private companies (Deutsche Bank, 2009).
f) Possible scarcity rents have to be taken into account. Hotelling (1931) showed that in the case of an depletable resource, price should exceed marginal cost even if the oil market were perfectly competitive (the resulting difference is called scarcity rent). If this were not the case, it would be more profitable to leave the oil in the ground, waiting to produce it until the price has risen. Hamilton (2009a, 2009b) noted that while in the 1990s the scarcity rent was negligible relative to costs of extraction, the strong demand growth from developing countries in the last decade together with limits to expanding production “could in principle account for a sudden shift to a regime in which the scarcity rent is positive and quite important.” In this regard, the Reuters news service reported on April 13, 2008 that “Saudi Arabia’s King Abdullah said he had ordered some new oil discoveries left untapped to preserve oil wealth in the world’s top exporter for future generations, the official Saudi Press Agency (SPA) reported.” Therefore, a possible intertemporal calculation considering scarcity rents may have already influenced (i.e. limited) current production. Although the sudden fall of prices at the end of 2008 is difficult to reconcile with scarcity rents, the following quick price recovery to the $70-$120 range during the enduring global financial crisis indicates that this aspect cannot be dismissed. This is despite the assertion by Reynolds and Baek (2011) that the Hotelling principle "... is not a powerful determinant of nonrenewable resources prices," and that "...the Hubbert curve and the theory surrounding the Hubbert curve is an important determinant of oil prices." We agree that the Hubbert curve, which defines the depletion curve of a non-renewable resource, may be the prime determinant of oil price but it is not the only one.

Figure 3. Global marginal cost of production 2008. Source: LCM Research based on Booz Allen/IEA data (Morse, 2009). The unlabeled items, from left to right are OPEC Middle East, Former Soviet Union and Enhanced Oil Recovery.
The consequence of these issues is that in the short-medium term the available supply is essentially fixed and thus relatively straightforward to compute. As Figure 4 shows, net production capacity will decline due to the difficulty in finding new reserves at an accessible cost while the existing capacity is steadily depleted. Just as occurred in 2004, by 2011 there is again no new net capacity while the world economy, and thus oil demand, has resumed growth. After 2014, it appears that global oil production will begin its decline (See the second report of the UK Industry Taskforce on Peak Oil and Energy Security (UK ITPOES, 2010), Lloyd’s (2010), Deutsche Bank (2009, 2010), the report by the UK Energy Research Centre (Sorrell et al., 2009a) and the 2010 World Energy Outlook by the IEA (2010).)
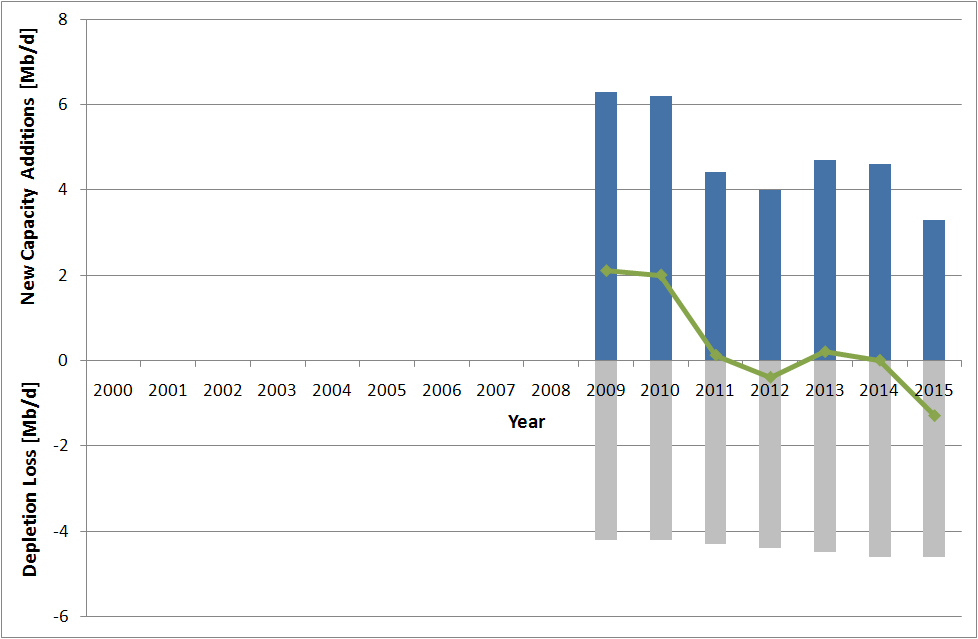
Figure 4. Global annual new gross production (blue bars), annual decline (grey bars) and net new oil production capacity (thin green line). Source: UK Industry Task Force on Peak Oil and Energy Security (2010)
3.2 The economics of oil demand
Now an important question is what are the consequences of high oil prices on world economic growth? In the economic literature, Hamilton (2009b) and Kilian (2008; 2009) attempt an answer, while in the professional financial literature, the report by Deutsche Bank (2009) is one of the most comprehensive.
Hamilton (2009b) in particular highlighted the importance of the share of energy expenditure as a percentage of total consumer expenditure. When this ratio is too high, an economic recession tends to occur. Similarly Deutsche Bank (2009) showed how each country seems to have a “threshold percentage of national income at which crude pricing meets stern resistance and demand is broken.” Deutsche Bank (2009) asserts that for American consumers this point is when energy represents 7.5% of gross domestic product. This value is close to the one calculated by Hamilton (2009b) but is based on monthly data and uses a different methodology. In a more recent report, Deutsche Bank (2010) lowered this threshold to 6.5 % because "...the last shock set in motion major behavioral and policy changes that will facilitate rapid behavioral changes when the next one comes and underemployment and weak wage growth has increased sensitivity to gasoline prices. Last time it took $4.50/gal gasoline to finally tip demand, this time it might only take $3.75/gal to $4.00/gal to do it." However, they also highlighted that "Americans have become comfortable with paying more for gasoline, and it may take higher prices to force behavior change".
Kopits (2009) suggested that when crude oil expenditures exceed 4% of GDP, oil prices increase by more than 50% year-on-year, and oil price increases are so great that a potential demand adjustment should have to reach 0.8% of GDP on an annual basis, then a recession in the US is very likely. A similar outcome was found by Hall et al. (2009) who showed a recession in the US is likely when oil amounts to more than 5.5% of GDP. We remark that the difference between the 4% (Kopits, 2009) and 5.5% (Hall et al., 2009) is simply a wholesale versus retail difference, and the result comes out the same [1].
Finally, Hamilton (2011) highlighted that 11 of the 12 U.S. Recessions since World War II were preceded by an increase in oil prices. Unfortunately, there is no clear alternative source of energy able to fully substitute for oil (see, for example, Maugeri (2010) for a recent non-technical review of the limits of alternative sources of energy with respect to oil). It possesses a combination of energy density, portability and historically very high EROEI that is difficult for alternatives to match.
4. A timely energy system transformation not assured
As oil production declines, significant changes to the current oil-dependent economy in the medium term are likely to be needed. However, it isn’t clear that there will the financial means to implement such a change. For example, Deutsche Bank (2009, 2010) suggested that the widespread use of electric cars in the second part of this decade will be the disruptive technology that will finally destroy oil demand. Apart from technology and resource constraints (lithium necessary for electrical batteries is quite abundant in nature but production is currently very limited), the availability of sufficient financial resources to transition the entire vehicle fleet seems dubious. As Hamilton (2009b) demonstrates, tightened credit follows high oil prices and most vehicles are purchased on credit. Others suggest that natural gas is the next energy paradigm. Again, will be there sufficient financial resources to switch to it as oil production declines?
Reinhart and Rogoff (2009, 2010) found that historically, after a banking crisis, the government debt on average almost doubles (86% increase) to bail out the banks and to stimulate the economy. They also showed that a sovereign debt crisis usually follows: not surprisingly we saw Iceland, Greece, Ireland, Hungary and Portugal turning to the EU/ECB and/or the IMF for financial help to refinance their public debts to avoid default. The need to switch to alternative energy sources with the enormous financial investments that such a task would require — and the simultaneous presence of large public and private debts — may well form a perfect storm.
Additional forces will play a role. New regulations to be introduced by Basel III are likely to impact investment expectations, budgeting and planning. Basel III is a new global regulatory standard on bank capital adequacy and liquidity proposed by the Basel Committee on Banking Supervision following the recent global financial crisis and whose aim is to "...to improve the banking sector's ability to absorb shocks arising from financial and economic stress, whatever the source, thus reducing the risk of spillover from the financial sector to the real economy", BCBS (2009). Demography will also be extremely important in the next decade as well. Europe and the United States have aging populations and their baby boomers are entering pension age. China faces a similar demographic problem due to their one child policy, too.
The combination of declining oil production (and thus oil priced high enough to cause recessions), high taxes, austerity measures, more restrictive credit conditions and demographic shifts have the potential to severely constrain the financial resources needed to move the economy away from oil and to alternative energy sources. Another consequence of this combination of forces is the likely contraction of the world economy (Hamilton, 2009b; Dargay and Gately, 2010).
4.1 Energy transition risks
With higher priced oil, technology substitution (such as electric cars gradually replacing internal combustion engine cars) and fuel substitution (such as natural gas replacing oil) will occur. History is filled with many such examples and they are frequently highlighted in the debate. However, one must read carefully and not overstate the simplicity of an energy transition.
For example, whale oil was – technically – an energy source in the 19th century, but the economy was based on coal at the time. Whale oil was used only for very specific purposes (primarily illumination), and the transition to kerosene was easy and occurred very rapidly. Bardi (2007) explored this in more detail and made several important remarks that pinpoint how difficult it can be to substitute energy sources. In particular, he showed that resource scarcity often dramatically increases the amplitude of price oscillations, which often slow an energy source transition. Businesses and governments struggle with alternating circumstances of insufficient cash flow to handle price spikes and plummeting prices that don't cover their cost structure. Long term planning in this ever-changing environment becomes extremely difficult and investment — even highly needed investment — can drop precipitously.
Friedrichs (2010) also cautions that after peak oil countries have several sociological trajectories available to them, they can follow predatory militarism like Japan before WWII, totalitarian retrenchment like North Korea, or, ideally, socioeconomic adaptation like Cuba after the fall of the Soviet Union. Given the recent century of conflict and the extensive weapon stocks and militaries held by modern nations (especially the United States, which spends on its military almost as much as the remaining countries of the world combined (SIPRI, 2011), there is simply no guarantee that the relatively peaceful period currently experienced by developed nations that is conducive to rapid energy source transitions will continue much longer.
Koetse et al. (2008) showed that for both North America and Europe the capital-energy substitutability over the long term is large. In other words, if there is abundant capital, the economy can respond to higher oil prices with substitution. However, if declining oil causes a credit contraction similar to the crash of 2008, there may not be sufficient capital to replace existing equipment quickly.
Even if there is sufficient capital, substitution has thus far operated with high and even increasing EROEI fuel sources. Since the transition from whale oil, each subsequent transition has been to an energy source with greater net energy profit. The energy dense fuels we are using now have allowed us to build our civilization. The difficulty this time is that we must move from highly profitable, in terms of energy, sources to lower profit alternatives like solar and wind. Researchers are beginning to ask the following important question: what is the minimum energy profit that must be sustained to allow us to operate our civilization? And, assuming alternatives are up to the job (this is not yet proven), can we complete the move away from oil before the overall EROEI gets too low? (Murphy and Hall, 2010)
A further challenge is that, strictly speaking, for the last 150 years we have not transitioned from previous fuel sources to new ones — we have been adding them to the total supply. We are currently using all significant sources (coal, oil, gas and uranium) at high rates. Thus, it’s common but incorrect to say that we moved from coal to oil. In fact, we are using more coal now than we ever have (IEA, 2010). We never left the coal age. The challenge of moving to alternative energy sources while a particularly important source is declining, in this case oil, should not be underestimated.
4.2 Net oil exports decline faster than overall production
The challenge may be greater still because net oil exports are set to fall more rapidly than overall oil production. Rubin (2007) points out that before the financial crisis many producer countries were experiencing economic booms. These countries export only the oil they don’t use themselves. The Middle East saw annual consumption increases of 5%. Russia was increasing at a 4% annual rate. It was only Russia’s increased production during the same period (accounting for 70% of the increase that came from OPEC, Russian and Mexican production during the early part of the last decade) that oil prices did not break records sooner than they did. Although the IEA has projected that oil use in OECD countries may already be declining (IEA 2010), they think that the oil appetite of non-OECD countries, which includes the producer countries, is not even close to being satisfied.
Brown et al. (2010b) show how significant the squeeze of declining gross production and increasing producer country consumption can be, which they have named the Export Land Model. Increasing producer country consumption due to population growth acts as a strong “magnification factor” that removes oil very quickly from the export market. Using the top five exporting countries from 2005 (Saudi Arabia, Russia, Norway, Iran, and United Arab Emirates), they construct a scenario in which combined production declines at a very slight 0.5% per year over a ten year period for a total of 5%. Internal oil consumption for these exporters continues to grow at its current rate (2010). In this scenario net oil exports decline by 9.6%, almost double the rate oil production declines.
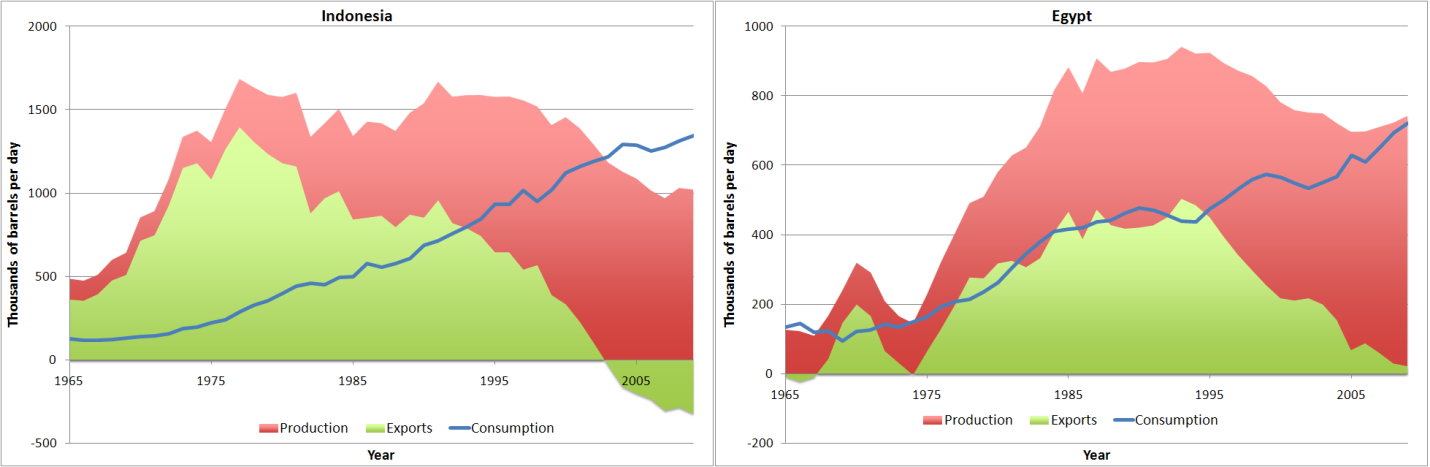
This accelerated loss of exportable oil can be seen in many producer countries that have passed their peak. Figure 6 shows the typical cases of Indonesia and Egypt. Indonesia has withdrawn from OPEC because they have no more exportable oil to offer the world market. Egypt is already incurring a public debt and is on the cusp of becoming a net oil importer, which will exacerbate already stretched public finances. As producer countries continue to grow their oil use even modestly and production declines (again, even modestly), there is an extremely high risk that net exportable oil will decline much faster than most observers are currently expecting.
4.3 Crash program may eventually replace declining oil
Hirsch (2010) points out that a crash program to create liquid fuel savings and additional liquid fuels may be able , at some point, to make up for declining oil production (Figure 7). While the alternatives are ramping up and as oil production is declining, Hirsch (2008) estimates that the world economy will contract at approximately a one-to-one ratio. In his best-case scenario, using a 4% per year decline rate, an idealized crash program to produce liquid fuels does not pause contraction sooner than ten years after the onset of decline.

Other mitigation efforts like increased solar, wind and geothermal production may not be prioritized since they do not help the situation — they produce electricity and the world’s 800 million transportation, food production (i.e. tractors and harvesters) and distribution vehicles require liquid fuel.
If the peak of oil production occurs this decade, there is insufficient time to avoid contraction because of how long it takes to transition the vehicle fleet. Even in their moderately aggressive scenario, Belzowski and McManus (2010) estimate that in a healthy, growing economy by 2050 still only 80% of the vehicle fleet in Europe and the U.S. would operate on alternative power trains.
5. Government risks
A contracting economy presents governments with a host of problems that are not easy to resolve. Promises made to the citizenry, some in the form of social welfare programs, pensions and public union contracts, will be impossible to keep as the energy base of the economy declines. Downward wage pressure and reduced business activity will lower tax revenue. With lower revenues and greater demands in the form of social welfare support by an increasingly poorer citizenry, it is difficult to see how the accumulated (and growing) government debt can be paid back without rampant inflation. Though it is still unclear whether the government response will be hyperinflation (to minimize the debts) or extensive and massive debt defaults — or both — it is not likely that business as usual will continue as oil production declines.
In business sectors that are highly dependent on oil, such as the automotive sector (Cameron and Schnusenberg, 2009), ill prepared companies that lack understanding of how price volatility may impact their firm will likely fail. In the case of the car companies some may fail a second time because their products are still not yet ready for a high-priced oil environment (Wei et al., 2010). Governments may not be willing to spend the money to rescue these businesses (such as the car company bailouts in the U.S.) and should be prepared for increasing unemployment as vulnerable sectors contract. To minimize potential future social discord, governments should immediately begin planning for contraction and educating their citizenry of the risk of contraction.
Because poverty reduction is highly correlated with capital availability (World Bank 2001), as contraction occurs due to oil production decline, some countries may see the reversal of poverty reduction gains made in recent decades. Some governments may also have to contend with food and fuel riots as they did in 2007 and 2008. Other forms of crowd behavior, namely hoarding of fuel and food, may exacerbate the situation and governments should prepare accordingly.
6. Business risks
In a joint report, Lloyd’s of London and Chatham House have advised all businesses to begin scenario-planning exercises for the oil price spike they assert is coming in the medium term (Lloyd’s, 2010). These planning exercises should scrutinize a company’s operations and balance sheet in fundamental ways.
Like governments, businesses of all sorts may experience similar difficulty paying their debts as sales decline. Banks may see asset values fall further. Manufacturers in particular will have to contend with increased difficulties making and delivering products as oil production declines (Hirsch et al., 2005). It will prove imperative that business addresses this Schumpetarian shock (a structural change to industry that can alter what is strategically relevant) in a timely fashion (Barney, 1991).
A significant benefit of cheap oil was that distance was relatively inexpensive. It is possible now to manufacture goods using far-flung operations. However, as oil declines, distance will, once again, become increasingly expensive, and oil price may begin to act as a trade barrier for many products.
Another risk as oil production declines is the possibility of oil supply disruptions. If this should occur, much modern manufacturing may be impacted. Just-in-time manufacturing systems in which warehoused parts are minimized through the frequent replenishment of parts by parts suppliers — sometimes with multiple deliveries a day — have little tolerance for delivery delays.
To prepare for this risk requires more than the drive for manufacturing efficiency that has generally characterized business. Supply chains should be examined with the aim of building in resilience and greater agility (Bunce and Gould, 1996; Krishnamurthy and Yauch, 2007), implying the loosening of tight and often brittle couplings between suppliers and manufacturers (Christopher and Towill, 2000; Towill and Christopher, 2001). With little or no slack in the system (fewer warehoused parts, etc.), just one supplier failing to deliver a part or supplier hoarding can shut down a production process.
7. Conclusion
The Deepwater Horizon incident demonstrated that most of the oil left is deep offshore or in other difficult-to-reach locations. Moreover, obtaining the oil remaining in currently producing reservoirs requires additional equipment and technology that comes at a higher price in both capital and energy. In this regard, we reviewed the physical perspective of peak oil and some of the limitations on producing ever-increasing quantities of oil were highlighted as well as the possibility of the peak of production occurring this decade.
We then briefly discussed the economics of oil supply and demand, showing why the available supply is basically fixed in the short-medium term, and highlighting the importance of a high energy expenditure share as a percentage of total consumer expenditures sounding an alarm bell for economic recessions. Moreover, we remarked that the potential financial resources available in the future to switch to alternative sources of energy will be limited due to several factors ranging from the high levels of debt (both private and public) to the aging of the populations in Western countries and China. We also noted that, even with very slight production decline rates, net oil exports decline significantly faster than total oil production as the economies of producer countries grow.
In such a context, risk mitigation practices are called for, both at the government level and at the business level to prepare for high and likely volatile oil prices. Governments should begin educating their citizenry of the risk of contraction to minimize potential future social discord. Businesses should examine their operations and balance sheets with the aim of building in resilience. It also implies preparing for a scenario in which capital and energy are much more expensive than in the business-as-usual one.
Acknowledgements
We are grateful to the reviewers and colleagues who provided valuable comments on drafts of this paper. Special thanks to Simon Snowden for outstanding assistance.
References
Adelman, M.A., 1990. Mineral depletion, with special reference to petroleum. Review of Economics and Statistics, 72(1), 1–10.
Aleklett, K., Höök, M., Jakobsson, K., Lardelli, M., Snowden, S., Söderbergh, B., 2010. The Peak of the Oil Age — analyzing the world oil production Reference Scenario in World Energy Outlook 2008. Energy Policy, 38(3), 1398-1414.
Bardi, U., 2007. Energy Prices and Resource Depletion: Lessons from the Case of Whaling in the Nineteenth Century. Energy Sources, Part B: Economics, Planning, and Policy, 2(3), 297–304.
Bardi, U., Lavacchi, A., 2009. A simple interpretation of Hubbert’s model of resource exploitation. Energies 2(3), 646–661.
Barney, J.B. 1991. Firm resources and sustained competitive advantage. Journal of Management, 17(1), 99-120.
BCBS Consultative Proposal, 2009. Strengthening the resilience of the banking sector. Available from: http://www.bis.org/publ/bcbs164.htm
Belzowski, B.M., McManus, W., 2010. Alternative power train strategies and fleet turnover in the 21st century. University of Michigan, report no. UMTRI-2010-20, August 2010.
Bentley, R.W., Mannan, S.A., Wheeler, S.J., 2007. Assessing the date of the global oil peak: the need to use 2P reserves. Energy Policy 35(12), 6364–6382.
BP, 2010. BP Statistical Review of World Energy 2010. See also: http://www.bp.com
Brown, J.H., Burnside, W.R., Davidsson, A.D., DeLong, J.P., Dunn, W.C., Hamilton, M.J., Mercado-Silva, N., Nekola, J.C., Okie, J.G., Woodruff, W.H., Zuo, W. 2010a. Energetic limits to economic growth. Bioscience, 61(1), 19-26.
Brown, J., Foucher, S., Silveus, J., 2010b. Peak Oil Versus Peak Net Exports — Which Should We Be More Concerned About? Association for the Study of Peak Oil and Gas presentation in Washington D.C., 8 October 2010, http://aspousa.org/2010presentationfiles/10-7-2010_aspousa_TrackBNetExports_Brown_J.pdf
Bunce, P., Gould, P., 1996. From Lean to Agile Manufacturing.IEE Colloquium Digest, 1996, Issue 278.
Cameron, K., and Schnusenberg, O., 2009. Oil prices, SUVs, and Iraq: An investigation of automobile manufacturer oil price sensitivity. Energy Economics, 31(3), 375-381.
Campbell, C.J., 1997. The coming oil crisis. Multi-Science Publishing, Brentwood.
Campbell, C.J., 2002. Petroleum and people. Population & Environment, 24(2), 193–207.
CIA Factbook, 2010. The World Factbook. See also: https://www.cia.gov/library/publications/the-world-factbook/
Christopher, M., Towill, D.R., 2000. Marrying the Lean and Agile Paradigms.Proc. EUROMA Conference, Ghent, 2000, 114-121.
Dargay J.M., Gately, D., 2010. World oil demand’s shifttoward faster growing and less price-responsive products and regions. Energy Policy, 38(10), 6261-6277.
Deutsche Bank, 2009. The Peak Oil Market — price dynamics at the end of the oil age. Deutsche Bank Securities.
Deutsche Bank, 2010. The End of the Oil Age. 2011 and beyond: A reality check. Global Markets Research.
Friedrichs, J., 2010. Global energy crunch: How different parts of the world would react to a peak oil scenario. Energy Policy, 38(8), 4562–4569.
Gately, M., 2007. The EROI of U.S. offshore energy extraction: A net energy analysis of the Gulf of Mexico. Ecological Economics, 63(2-3), 355-364.
Hall, C.A.S., Powers, R., Schoenberg, W., 2008. Peak Oil, EROI, investments and the economy in an uncertain future. In: Pimentel, D (Ed.) Biofuels, solar and wind as renewable energy systems. Springer, New York.
Hall C.A.S., Balogh, S., Murphy, D.J.R., 2009. What is the Minimum EROI that a Sustainable Society Must Have? Energies, 2(1), 25-47. http://dx.doi.org/10.3390/en20100025
Hamilton, J., 2009a. Understanding crude oil prices, Energy Journal, 30(2), 179-206.
Hamilton, J., 2009b. Causes and consequences of the oil shock of 2007-08. Brookings Papers on Economic Activity, Spring 2009, 215-259.
Hamilton, J., 2011. Historical oil shocks. In: Parker, R.E., Whaples, R.M. (Ed.), Handbook of Major Events in Economic History, Routledge, ISBN: 978-0415677035
Hirsch, R.L., Bezdec, R., Wendling, R., 2005. Peaking of world oil production: impacts, mitigation, & risk management. See also: http://www.netl.doe.gov/publications/others/pdf/Oil_Peaking_NETL.pdf
Hirsch, R., 2008. Mitigation of maximum world oil production: Shortage scenarios. Energy Policy, 36(2), 881–889.
Hirsch, R., 2010. The impending world energy mess. Association for the Study of Peak Oil and Gas presentation in Washington D.C., 8 October 2010, http://www.aspousa.org/2010presentationfiles/10-8-2010_aspousa_KeynoteEnergyMess_Hirsch_R.pdf
Höök, M., Aleklett, K., 2008. A decline rate study of Norwegian oil production. Energy Policy, 36(11), 4262-4271.
Höök, M., Bardi, U., Feng, L., Pang, X., 2010. Development of oil formation theories and their importance for peak oil. Marine and Petroleum Geology, 27(9), 1995-2004.
Höök, M., Hirsch, R., Aleklett, K., 2009. Giant oil field decline rates and their influence on world oil production. Energy Policy, 37(6), 2262-2272.
Hotelling, H., 1931. The economics of exhaustible resources. Journal of Political Economy, 39, 137-175.
Hubbert, M.K., 1949. Energy from fossil fuels. Science, 109(2823), 103–109.
Hubbert MK, 1956. Nuclear energy and the fossil fuels. Presented before the Spring Meeting of the Southern District, American Petroleum Institute, Plaza Hotel, San Antonio, Texas, March 7–9, http://www.hubbertpeak.com/Hubbert/1956/1956.pdf
Hubbert, M.K., 1982. Response to David Nissen http://www.hubbertpeak.com/Hubbert/to_nissen.htm
International Energy Agency, 2007. World Energy Outlook 2007. See also: http://www.worldenergyoutlook.org/
International Energy Agency, 2010. World Energy Outlook 2010. See also: http://www.worldenergyoutlook.org/
Kilian, L., 2008. Exogenous oil supply shocks: how big are they and how much do they matter for the U.S. economy? Review of Economics and Statistics, 90(2), 216-240.
Kilian, L., 2009. Not all oil price shocks are alike: disentangling demand and supply shocks in the crude oil market. American Economic Review, 99(3), 1053-1069.
Krishnamurthy, R. and Yauch, C.A. 2007. Leagile manufacturing: a proposed corporate infrastructure. International Journal of Operations & Production Management, 27(6), 588–604.
Koetse, M., de Groot, H., Florax, R. 2008. Capital-energy substitution and shifts in factor demand: A meta-analysis. Energy Economics, 30, 2236–2251.
Kopits, S., 2009. Oil: What price can America afford? Douglas Westwood Energy Business Analysts, Research Note, June 2009
Lloyd’s of London and Chatham House, 2010. Sustainable energy security — strategic risks and opportunities for business. Lloyd’s of London white paper on sustainable energy security. See also: http://www.lloyds.com/~/media/Lloyds/Reports/360%20Energy%20Security/7238_Lloyds_360_Energy_Pages.pdf
Lynch, M.C., 2002. Forecasting oil supply: theory and practice. The Quarterly Review of Economics and Finance, 42(2), 373–389.
Lynch, M.C., 2003. The new pessimism about petroleum resources: debunking the Hubbert model (and Hubbert modelers). Minerals & Energy - Raw Materials Report, 18(1), 21–32.
Maugeri, L., 2010. Beyond the age of oil. Praeger, New York.
Meng, Q.Y., Bentley, R.W., 2008. Global oil peaking: responding to the case for ‘abundant supplies of oil. Energy, 33(8), 1179-1184.
Miller, R.G., 2011. Future oil supply: the changing stance of the International Energy Agency. Energy Policy, 39(3), 1569–1574.
Morse, E., 2009. New oil market realities.National Association of State Energy officials conference presentation in Washington, D.C. 2009, LCM Research using Booz Allen, IEA data https://www.naseo.org/events/summer/2009/Ed%20Morse.pdf
Murphy, D.J., Hall, C.A.S., 2010. Year in review — EROI or energy return on (energy) invested. Annals of the New York Academy of Sciences, 1185, 102–118.
Owen, N.A., Inderwildi, O.R., King, D.A., 2010. The status of conventional world oil reserves — Hype or cause for concern? Energy Policy, 38(8), 4743-4749.
Reinhart, C., Rogoff, K., 2009. This time is different: eight centuries of financial folly. Princeton University Press, New Jersey.
Reinhart, C. Rogoff, K., 2010. After the fall. Federal Reserve Bank of Kansas City economic policy symposium “Macroeconomic Policy: Post-Crisis and Risks Ahead” held at Jackson Hole, Wyoming, on August 26-28, 2010.
Reynolds, D.B., Baek, J., 2011. Much ado about Hotelling: Beware the ides of Hubbert, Energy Economics, article in press
Robelius, F., 2007. Giant oil fields — the highway to oil: giant oil fields and their importance for future oil production. Doctoral thesis, from Uppsala University, http://uu.diva-portal.org/smash/record.jsf?pid=diva2:169774
Rubin, J., Buchanan, P., 2007. OPEC’s growing call on itself. CIBC Worldmarkets. http://research.cibcwm.com/economic_public/download/occrept62.pdf
Satter, A., Iqbal, G.M., Buchwalter, J.L., 2008. Practical Enhanced Reservoir Engineering. Pennwell Books. Tulsa.
Speight, J., 2008. Synthetic Fuels Handbook: Properties, Process, and Performance. McGraw-Hill Professional,
Sorrell, S., Speirs, J., Bentley R., Brandt A., Miller, R., 2009a. An assessment of the evidence for a near-term peak in global oil production, UK Energy Research Centre, London.
Sorrell, S., Speirs, J., Bentley, R. Brandt, A., Miller, R., 2009b. Global oil depletion: A review of the evidence. Energy Policy, 38(9), 5290-5295.
Towill, D.R., Christopher, M., 2001. The supply chain strategy conundrum ~ to be Lean or Agile or to be Lean and Agile. Proceedings of the International Logistics Symposium, Salzburg, 2001, pp 3-12.
UK Industry Task Force on Peak Oil and Energy Security, 2010. The Oil Crunch — a wake-up call for the UK economy. Second report of the UK ITPOES.
Warr, B.S., Ayres, R.U., 2010. Evidence of causality between the quantity and quality of energy consumption and economic growth. Energy, 35(4), 1688–1693.
Watkins, G.C., 2006. Oil scarcity: what have the past three decades revealed? Energy Policy 34(5), 508–514.
Wei, Y., Wang, Y. and Huang, D., 2010. Forecasting crude oil market volatility: Further evidence using GARCH-class models. Energy Economics, 32(6), 1477-1484.
World Bank, 2001. Finance for growth: policy choices in a volatile world - a World Bank Policy Research Report. Washington D.C.: World Bank.
[1]We want to thank Gail Tverberg for pointing out this difference.
Contact
- Content: editors at theoildrum dot com
- Tech support: support at theoildrum dot com
License

This work is licensed under a Creative Commons Attribution-Share Alike 3.0 United States License.
Looks like mostly a useful and thoughtful analysis.
One nit pick for now--the graph in figure 1 shows "total liquids" along the side, but the caption talks about oil.
I try to discourage folks on this site, at least, from participating in this type of confusion--it only encourages those who want to see the peak as having been pushed back by technology, and so presumably potentially delay-able for ever.
If you just go with Crude and condensate, you may find that we actually entered the plateau in late 2003.
Figure 1 caption lists "crude oil, lease condensate, natural gas plant liquids, other liquids, and refinery process gains and losses". Can the author please clarify what is included in "other liquids"? Does it include biofuels? This graph seems quite dramatic and I think it could be useful to begin to awaken the still slumbering population who remain unaware of any problem. But the details are important. I looked at the Hirsch reference and there is no more information there.
EIA Appendix C. Glossary
Orimulsion is no longer being produced and production from oil shale never will be produced. ;-)
Ron P.
Predictions anyone? Exactly when is it all going to fall apart?
Who can say, but as things move along, the doomers and the techonocopians are getting closer together. IIRC, even CERA is talking about peak oil within this decade.
It is pretty clear to me that conventional oil has already peaked, having entered its plateau almost ten years ago. Rockman's now off to Africa, but (again iirc) he used to talk about the 2013-15 period.
The more immediate question is when the next big economic step down will be. Economists are starting to admit that we may never really recover from the recession.
The next step down will put even more people out of work, reducing demand and bringing the price back down a bit. There will be fewer and fewer people able to afford gas and diesel regularly at even the reduced levels that an economic crash will bring.
But predicting the exact timing of an economic crash is not something that many have been able to do reliably.
Yes those will be the two opposing forces -- economic collapse from energy shortages causing oil prices to collapse, versus skyrocketing oil prices due to scarcity. We will likely bounce along between the two, both on a generally rising price trajectory. Of course if the monetary system collapses, as I see as inevitable, then oil price will go to infinity pretty fast.
I see the next economic collapse as being a fairly sudden cliff. All economists know how to do is print money and drop interest rates to 0%. Kind of like threading a needle with a club. It will work for a while ... until it doesn't. They don't fundamentally understand how economies work, so therefore when the rules of the game change enough that their traditional economic theories (based on unlimited energy) no longer apply, then they will no longer be able to prevent the inevitable. I predict later this year or 2013, but who knows.
Hi, Null.
That might put you in the fast-crash camp. Personally, I'm in the stair-case camp:
Of course, when it's your time to lose your job, it will feel like a fast-crash to you (relatively speaking).
So one chart that we did not include, because it was beyond the scope of the paper, is the following:
We are living in the tail end of Greer's Abundance Industrialism. We can watch the most valuable company in the world emerge in just ten years (Apple). Amazing! But this period is coming to a close, and in my view, that has already started and will accelerate this decade.
Regarding the Staircase Model, Greer and others have posited that the first step was in the early '70's, and my sense is that the next step will be more like the third one in the graphic. It's a bit like a group of buildings that were built too close to an eroding river bank. While mitigating structures have limited the buildings to settling a bit over time, perhaps a bump down now and then, eventually the underlying foundations erode to the point that the temporary supports are overwhelmed when the next even minor flood occurs. One building gives way creating instabilities that cause the others to collapse.
I see our current support structures: alternative liquid fuels; "green energy initiatives"; QE1, QE2... the bailouts in Europe; deepwater drilling and other ER schemes; attempts by modern agriculture to trick nature; increasingly costly, complex and overriding legislation (i.e. healthcare); etc., all as attempts by a clueless society to shore up against an eroding and progressively overtaxed foundation. The basic stuff that we rely on for support continues to be washed downstream and out to sea, gone forever. Our damage control strategy is doomed to fail. The buildings settle slowly, but only at first. In the meantime, folks are still moving in.
I fear we underestimate the fragile nature of our situation.
I think one of the differences between those of us who expect a shark fin collapse and those like Andre who expect a stair step decline may actually relate to our physical reality.
I'm in the boondocks, outside looking in. People like Andre in an urban area (IIRC) are inside looking out. By this I mean he is not personally responsible for most of the infrastructure that allows him to live in an urban area. Whereas I provide my own water, heat, some of my electricity and maintain my own road (plus a lot more). But the people inside looking out aren't personally responsible for these sorts of things, therefore, they can't see the tenuousness of society, i.e., its fragility and lack of resilience.
Todd
People use the Titanic analogy, but I fear we're more like a fully loaded jumbo jet with no idea of where to land. As long as the crew can keep up the velocity of fuel to the engines, everything is ok. The alternative is to slow the plane and begin to jettison cargo and passengers, maybe cut an engine or two, but at some point the stall comes and nobody planed for a soft landing. Whoops, there's a limited number of parachutes...
It's the velocity of energy, money and resources that keeps our overloaded jumbo jet flying.
I have the same image, except mine is an overloaded helicopter...
You make a good point, Todd.
The staircase diagram that I included should probably be shrunk and then repeated to be more accurate of my view i.e. lots more stairs and quite a few big ones with various small ones in between. The brittleness of our interconnected systems is not lost on me.
Noah Raford's presentation on Collapse Dynamics holds much merit:
http://news.noahraford.com/?p=48
I'm sympathetic to the shark fin, too, and convinced Greer that we should use it in the other graph. How sharp the decline will be is still to be seen but I certainly don't expect it to match the ascending part of the curve.
Raford's approach holds a lot of merit!
In these discussions about which curve one prefers I think what gets left out is that you need to either have a theory or data that generates the curve, not a preference on some vague ideas. Now since the future can't supply data that means you need a supportable theory. Both the curves you supply above appear to be based on mental models vs. theories that generate those shapes. A stair-step model is unknown in most dynamic processes unless you explicitly build in feedback loops that have pulsed dynamics separate from the dependent variable (BTW, what is the main variable; one shows fossil fuel use, the other "the economy"). Could you tell us what model you are using that generates that kind of curve?
The shark fin curve has a bit more justification in that there are dynamic models of peaking processes (like Hubbert's original) that are asymmetric about the peak. Greer's version looks like some extended tail models based on relatively smooth transition dynamics (totally unlike Raford's phase transition-based collapses). My own model is asymmetric but has a much steeper fall off resulting from the exponential diminishing EROI effects for all non-renewable energy sources (I equate "the economy" to exergy flow) offset against a slower decay rate for embodied energy assets (e.g. buildings). I also make it clear that my model is an outer boundary one, expressing the "best case" if we were able to extract all of the available raw energy we possibly could. I suspect financial considerations such as what Gail Tverberg writes about will cause a "worst case" that will look like falling off a very steep cliff.
I would urge all who want to speculate about what shape (timing and degree) collapse will take to try and develop first-principles based models rather than choose a shape that sounds about right. The reason is that such models can be argued for their principled merits rather than be voted for in a popularity contest. If we were to reach an early consensus about a model based on scientific criteria then that would be useful to make predictions with. That could be a basis for useful policies and preparations.
George
Picture of my model at this link.
If you assume a can opener ... assume that the current petroleum output is mature if not completely developed and that demand exceeds output: a stairstep can be imputed by examining the price- (click on chart for bigger version):
If Hoteling's rule does not effect the price then increased demand for crude will cause an increase in price and price declines represent declines in demand for crude (rather than new supply).
There is no point in examining the 'waste-ware to vapor-ware' transition or 'increased efficiency' pablum. We are cowards who cannot face reality but require comforting lies like small children: that the fat man will always come down the chimney and bring everyone a shiny new car.
Marginal petroleum cost + credit = price. What causes demand to decline is collapse of credit (caused by high crude prices). The feedback is through the credit system not at the gas pump. What the pump represents is the petroleum-cost of money only.
Note: demand can be infinite, consumption can never exceed supply.
What is being indicated are ongoing collapses and revivals of macro credit. Deleveraging takes place and prices fall for both crude and other goods then, central banks step in with more credit and the derelict economies find a second wind. Also, nobody in the world wants a collapse so there is institutional bias to doing everything possible to keep the current regime in force: bailouts.
As marginal petroleum costs increase the credit burden becomes unsupportable by the consumers of both credit and petroleum. Decline in nominal price of petroleum is no cure: temporary declines allow price-thwarted demand to rush back into the markets and push up the price. This decline-push dynamic remains in force until the ability of customers to meet the high price price is exhausted, when the credit runs out. The producers must then lower the price to meet a diminishing cash market.
What supports a price also supports the ability to meet it, the gap between what fuel costs and what can be returned by wasting it persists and continues to expand. Marginal costs swell to become the entire costs. Before that point is reached the system stops working as inputs cannot be had at prices users are able to afford.
The weight of costs are borne by those most dependent upon both cheap credit and cheap fuel: real estate, cars, airlines/airplanes, military/government and shipping. These sectors are failing/have failed or have been (continually) bailed out by 'outside' credit. Firm-level credit is replaced by sovereign credit which is in turn replaced by super-sovereign credit.
Peak oil and credit stripping has already torpedoed Greece. That hapless country collapsed pretty fast, but the other fuel-waste nations are still alive to waste another day ... there is your model.
The world is falling down the stairs: this will continue until credit is exhausted. W/ cheap oil long-since burned up, none of the 'high-tech' forms of petroleum will be affordable. The system stops working as inputs cannot be had at prices users are able to afford.
This last fatal step appears to be underway right now. The world is too broke/credit constrained to bid up crude past last April's $128/barrel. Once the marginal barrel price is below the cost to bring that barrel to market the game is over regardless of EROI. That looks to be $100/barrel: any link in the 'to the market' chain can be the weakest: refining, transport, distribution, finance/futures ... any link.
Hitching economies to burning up the gold for fun was and is a stupid idea.
Thanks for adding that, Steve.
Yes thanks for explicating a model that could provide a stair step dynamic. However, it seems to me a relatively short-term version. It might be a better explanation of the bumpy plateau but fail to predict a complete and rapid collapse at some time in the future (which a phase transition or chaotic attractor basin jump or a catastrophe theory might do). The stair step graph that Andre presented shows a repeated pattern of step downs and stasis all the way to the bottom. How does this model you have presented (which basically sounds like Gail's model) do in making longer-term projections to a global equilibrium? That is what we need to project what sort of actions will be needed and when.
George, you are trying to trick me into producing an unsupportable theory!
:)
Here are three things:
- From the top of each step it looks like a cliff. Any particular step can become non-linear context as the Bundeswehr put it. I have used the same chart along w/ Ugo Bardi's material to argue a cliff, the arguments work both ways! Cliff-step is a matter of scale. Japan has been bouncing sideways for 20 years, managing energy insolvency by recycling credit and arbitraging its energy flows -- turning fuels into cars that it exports -- up to the point of Fukushima, that is.
- The bottom lines are a) net energy constraints or, b) related gross credit constraints. Once that oil barrel requires more than a barrel to lift it will not be lifted. At the same time, complexity is baked into the crude supply chain. When market participants are broke because their banks have closed or there is no lender of last resort, the effect is the same as inadequate energy return.
Greece is indicative: there is oil in the ground (not in Greece) and available on crude markets but Greeks cannot afford any because they have no money. If the oil industry depended upon Greek customers it would collapse.
JoulesBurn's preceding article on Saudi Arabia's Khurais field development illustrates inelastic supply-side costs: without billion$ flowing into the country every year to service the costs of the infrastructure Khurais and Ghawar output will decline instantly.
The Greeks are thrown into the furnace so that the other states can waste Greece's share. To Greece, the process is a cliff-like collapse. The rest have that illusion of more 'growth' and 'progress' ... until the next state is heaved into the fire.
- The third item is that voluntary de-industrialization would have much smaller fossil-fuel footprint, 'collapse' would be redefined. This is impossible to imagine under current management regimes but one way or the other there will be de-industrialization, like it or not. At the cliff or the stair there is the bottom.
Your self-sustainability is admirable Todd, but you can only provide for yourself as long as you are physically able, and when other people - providing the current technological infrastructure - are not available to help you are going to be in trouble. Maintaining your own road is all well and good, but it has to link to other roads to be any use, and who will maintain them I wonder? You are aware of this of course. Collapse has happened before: ancient Rome, for example, had at its most populous (around one million people) fourteen aqueducts supplying water to the city. Political, economic and military failure, and then the subsequent population crash resulted in just one aquaduct being left functioning, and that did not supply the highest parts of the city which became depopulated and eventually turned into wastelend and eventually quarries. Water was now gathered, with difficulty and inadequately, from the Tiber and from wells. Dirty, impoverished medieval Rome contained just a few thousand people. Ancient Rome depended on political organisation, security and economic prosperity to maintain itself and yet it failed totally when the economy could no longer support a standing army; most importantly, the ruling classes were fatally complacent. Ours are too I'm afraid.
I suppose I'm in the large staircase camp. Even if the monetary system collapses next year we'll still have fossil fuel left so obviously there will be lots more stairs to fall down later on...
But I'm definitely not in Greer's gradual decline camp. The monetary system is literally the greatest ponzi scheme in the history of the world, and ponzi schemes generally don't end gradually...
Basically, the problem is that there are WAAYYYY more dollars (or debt bonds) in existence right now than could ever possibly be redeemed for real world resources. This is a result of 30 years of continually forcibly decreasing interest rates down to 0%, and the Federal Reserve forcing the world's capital into these bonds by manipulating markets to prevent the true dynamics from being expressed. There are only two ways the fundamental value of the dollar could be reconciled with the real world of Peak Resources -- through massive inflation, or by outright debt default, either one of which is a catastrophe worthy of the greatest monetary collapse ever.
I think what we'll see is ever-more heavy handed capital controls being forced on everyone. We will see restrictions on moving money out of the country, and limits placed on how quickly people can redeem their retirement savings, in order to prevent such a rapid run on the bank. But those draconian measures will merely reinforce a loss of confidence, and when the average person loses confidence in money, watch out because the whole system is hanging together with the scotch tape and rubber bands of "faith" right now.
One way or another, the current monetary system will end, fairly fast, at some point in the not too distant future. Then one has to ponder what kind of social ramifications this will lead to since the US will immediately no longer be able to buy the oil it used to. This will drop oil consumption by 2/3. Now consider that the average person won't be able to buy the remaining oil because they won't have a job because the economy isn't growing, and because the work week isn't being reduced to more equitably distribute the remaining jobs...
The possibilities for war here are easy to envision, especially given the hostile political climate pervasive even today, and an almost universal misunderstanding of the problems by the average person. It will be much easier to lynch scapegoats than rationally discuss the true cause which is the running out of resources. I guess I'm coming across quite gloomy here, maybe humanity will display greater maturity than this, who knows, I'm just exploring the logical steps that seem likely to me based on our behavior up to this point.
Just looking at ecological systems (of which we are one), Malthusian Collapses aren't pretty and orderly.
Null, you seem to have the monetary end of things worked out pretty well. Add in a geopolitical element and the picture will be more complete. Watch Iran along with China, India, and Russia. How that plays out will give you an idea of how long the current system can continue.
Yes, but when this monetary system fails (and I agree that it will), we'll replace it with another. And then possibly another after that. That's why Greer sees this process taking a century or more, and in that regard I think he's correct.
I think the ramifications of a monetary system collapse will be far greater than people realize. Historically, like a hundred years ago, people were wise to the antics of the bankers, and didn't rely so much on pieces of paper or digital bits for their personal wealth and their daily "productive" activities. Back then people were more resilient, more rural, and could take care of themselves better (which is why many survived the Great Depression as well as they did). Now, literally millions of urbanites are fully dependent on a functioning monetary system for their very survival. When it goes how will places like LA and New York be sustained? It will require rationing and military control, either that or a mass exodus of millions to the countryside.
What a monetary system collapse entails is that everyone who believed they would be getting a pension, or who has saved up a nest egg in 401K's buying bonds, will see that vanish. Of course a new monetary system will be brought in but 1) it won't be a debt based fiat currency because growth will be dead (a gold standard will have to be instituted at some point), 2) no one will trust it as a store of value for a long long time, 3) the average person's wealth will have been dramatically reduced as a result.
This will be a major downward step down the staircase, the slap-in-the-face wake-up call for the masses that things are not right. I think this will precipitate many of the other problems that are currently waiting in the wing, but not brought to the forefront yet because we are still living in a fantasyland reinforced by the previous 100 years of relatively stable growth; that will end.
Not much to quibble with in your assessment, especially "This will be a major downward step down the staircase." That's precisely why I put the big step there. That step is the failure of our monetary system.
I definitely share your view. Industrial civilization was built on cheap energy stimulating growth that was unequaled in world history. As we have run out of cheap energy and hit a decline in oil per capita, debt allowed industrial civilization to lumber on. When our monetary system fails, any replacement will face the same conditions that bought down our current system. Lack of cheap energy will force the new system to print endless money, and the FAITH in that money will have been lost forever during the death of the first system.
"and the FAITH in that money will have been lost forever during the death of the first system."
Not forever...the cycle will begin again.
Yes forever is to strong. I still feel in the short term that a new economic system would have to face the fact that there is not enough cheap energy to run industrial civilization.
What the doomers ignore is the ability to become greatly more efficient in the use of energy. The US, for example, is grossly inefficient in energy use, precisely because oil is cheap. When Europe is examined, per capita oil consumption is far less. The difference is largely because of the price of oil, which is taxed heavily there but hardly at all in the US. Further, it is a mistake to treat Europe as if no waste occurs there. Europe is simply the obvious proof that it is possible to have a rich & civilised society with much lower oil consumption.
If we assume that US per capita oil consumption will be in 10 years what it is in Europe today, that would greatly increase the room for consumption to increase in producing countries, India & China, without any "breakdown" effects. The transition, of course, would necessitate much investment in public transport, which would not be an outcome of pure market mechanisms, but there would be many other changes that would occur in response to high prices. Capitalism is an appalling system, but you can't argue that people don't eventually respond to price signals. To adopt more European lifestlyes:
1. When moving home (which happens frequently in the US), people will increasingly take the length of the commuting distance into account.
2. When buying vehicles, people will increasingly take their capacity to afford the running costs into account.
3. Recreational driving will greatly decrease.
4. House insulation will be greatly improved.
Next, there will be changes brought on by improved technology in many countries, not just the US:
1. Telecommuting will greatly increase for white collar workers.
2. Video conferences will replace a good deal of business plane travel.
3. Transformations in the manufacturing process through computerisation, miniaturisation and nano-technology will greatly reduce the level of material inputs needed and thus the energy inputs to support their production.
Jeavon's Paradox is often raised as an obstacle to transformation through greater efficiency. This is the idea that increased efficiency of use often leads to increased total use rather than decreased total use. This is true when the efficiency is being led by technological progress. When increased efficiency is being led by higher prices, however, the increased efficiency through technological change instead operates to enable the outcome (e.g. affordable transport) to be maintained in the face of input price rises.
What this means is that we have a good deal more time up our sleeves than the doomers believe we have. We will have the opportunity to make a transition to a sustainable economy with sustainable energy systems. Certainly, some extremely wasteful activities (e.g. recreational driving) will go, to be followed by spectacularly wasteful cultural phenomena (e.g. Formula 1 car races), which will become uneconomic through the loss of cultural support rather than directly from increasing costs. We will, however, be able to live civilised lives.
And I'll continue to get around on my bicycle.
You seem to think that oil production will decline to a plateau and sit there forever. And all we must do is adjust to that lower production level and things will be fine. That is the great cornucopian misconception. No, once fossil energy begins to decline, it will decline forever. Increased efficiency will be forever chasing declining supply but it will never quite catch up.
Another thing that cornucopians ignore is that decreased use of oil use will mean decreased employment. When people drive less and fly less the people involved, especially in the vacation industry, will be out of work. And when people buy fewer petroleum products there will be fewer jobs for those producing those items.
Ron P.
Another thing that cornucopians ignore is that decreased use of oil use will mean decreased employment.
How does that theory hold up against oil consumption figures around the world in the present or the past? Do you mean that, say, a 10% decrease in the use of oil will decrease employment one for one, i.e. 10%, or 0.01%, or collapse the system, what? What would a 50% decrease in oil consumption do to the US economy?
We might get some idea from looking abroad. US oil consumption was 68 bpd/1000 people in 2007 (down since then). Germany however was half that, ~30 bpd/1000 people. UK consumed 29 bpd/1000 people. Does this mean that German employment is about to collapse? That tourism will cease in the UK? On the other hand the Virgin Islands consumed 845 bpd/1000 people, Gibraltar 810 bpd/1000, while Haiti, the poorest country in the Western hemisphere, consumed 1.4 bpd/1000. Should the VI's or Gibraltar be expected to be the wealthiest countries in the world?
Historically, looking back at the oil crisis of '79-80, US oil consumption dropped ~17% from '79 to '83, yet the economy grew strongly '81 to '83 and after.
http://www.nationmaster.com/graph/ene_oil_con_percap-energy-oil-consumpt...
Falstaff, nothing in the economy is linear. However there is no doubt that a 50% decrease in world oil consumption would devastate most economies of the world. Anyway the below chart shows the recession starting in 1980 and lasting through 1983. WSJ, Financial Times Raise Issue of Oil Prices Causing Recession. The chart ends in 2008 so the extent of the 2008 recession is not shown.
And the chart of world oil production shows oil production, then, peaking in 1970 and bottoming out in 1983, the year the recession ended.
World Crude + Condensate production in thousands of barrels per day.
Ron P.
And of course we need to use a little common sense. If recreation travel is cut in half, then many of those employed in the recreation industry will lose their jobs. Not necessarily 50%, it may be less or more. As I said, it is not linear. And as it gets more expensive to manufacture goods using oil and wages do not go up as prices go up, then people will just purchase fewer goods. Well of course they will purchase fewer goods because fewer goods will be manufactured. But those people who manufacture those goods will just be made unemployed.
Ron P.
Ok, I'll bite.
there is no doubt that a 50% decrease in world oil consumption would devastate most economies of the world.
That depends on how long it takes. If it happens in 3 weeks then yes, that would be devastating. If it takes 3 decades, not so much.
the below chart shows the recession starting in 1980 and lasting through 1983.
Yes, there wasn't much US economic growth from 1978-1982. OTOH, there was some, and that happened at the same time that US oil consumption fell 18%.
Similarly, the US consumes less oil now than it did in 1979, but has GDP 2.5x as large, and manufacturing 1.5x as large.
If recreation travel is cut in half, then many of those employed in the recreation industry will lose their jobs.
First, it's not that hard to cut personal fuel consumption by 50% without cutting miles traveled at all. The average US MPG is still about 23 - 46 wouldn't be that hard to do.
2nd, what about "staycations"? People in Florida go to the Florida Disney resort, people in California go to the CA Disney resort. They spend the same money, employ as many people, but travel 10% as far.
as it gets more expensive to manufacture goods using oil and wages do not go up as prices go up, then people will just purchase fewer goods.
That assumes the premise. Actually, rising oil prices don't raise the cost of most manufacturing very much. Most manufacturing energy inputs are electrical, the cost of which is falling in the US.
Again, there is this puzzling assumption that oil can't be replaced, that it is somehow magically necessary for industrial/modern civilization. Oil has been cheap and convenient for the last 100 years, but the industrial revolution started without it, and modern civilization certainly will continue without it.
• 130 years ago, kerosene was needed for illumination, and then electric lighting made it obsolete. The whole oil industry was in trouble for a little while, until someone (Benz) came up the infernal combustion engine-powered horseless carriage. EVs were still better than these noisy, dirty contraptions, which were difficult and dangerous to start. Sadly, someone came up with the first step towards electrifying the ICE vehicle, the electric starter, and that managed to temporarily kill the EV.
Now, of course, oil has become more expensive than it's worth, what with it's various kinds of pollution, and it's enormous security and supply problems.
• 40 years ago oil was 20% of US electrical generation, and now it's less than .8%.
• 40 years ago many homes in the US were heated with heating oil - the number has fallen by 75% since then.
• US vehicles reduced their fuel consumption per mile by 50% from about 1978 to about 1990.
• 50% of oil consumption is for personal transportation - this could be reduced by 60% by moving from the average US vehicle to something Prius-like. It could be reduced by 90% by going to something Volt-like. It could be reduced 100% by going to something Leaf-like. These are all cost effective, scalable, and here right now.
I personally prefer bikes and electric trains. But, hybrids, EREVs and EVs are cost effective, quickly scalable, and usable by almost everyone.
Sensible people won't move to a new home to reduce commuting fuel consumption. That would be far, far more expensive than replacing the car. It makes far more sense to buy an EV and amortize the premium over 10 years at a cost of about $1,000 per year (much less than their fuel savings), versus moving to a much higher cost environment (either higher rent or higher mortgage).
• As Alan Drake has shown, freight transportation can kick the oil-addiction habit relatively easily.
We don't need oil (or FF), and we should kick our addiction to it ASAP.
The only reason we haven't yet is the desperate resistance from the minority of workers and investors who would lose careers and investments if we made oil and other FFs obsolete.
Some might ask, what about our current debt problems?
Debt is a symbol, a marker - what matters is the underlying productive capability of our economy, which will be just fine. Could we screw up the management of our economy, and go into a depression? Sure. But it's not likely.
Don't these transitions take 50 years?
The transition from kerosen to electricity for illumination took roughly 30 years. The US transition away from oil-fired generation took very roughly 20 years. The transition away from home-heating oil was also faster than 50 years (though uneven).
The fast transition from steam to diesel locomotive engines is illustrative. There were a few diesel locomotives in use in the U.S. during World War II but steam dominated in 1945. However, the steam locomotives had been very heavily used during World War II, and they all wore out at approximately the same time the first few years after 1945. When steam locomotives wore out, they were invariably replaced by diesel in the mid 1940s. By 1949, almost all steam locomotives were gone. There were still some steam locos made in the late 40's, and they were still in service in the 50's but dwindling. The RR's also relegated the steamers to branch line and switcher use - replacing the most used lines with diesel first as you would expect. Cn rail retired its last steam engine in 1959.
Other, very slow transitions are not a good guide to the future. For instance, the transition from coal to oil could be very slow, because there was no pressure - it was a trade up, not a replacement of a scarce resource. Many transitions occurred because something new & better came along - but the older system was still available and worked just fine. Oil may become very expensive very fast and that would provide us an incentive to switch over much more quickly.
On the other hand, we can point to many energy transitions that were sideways or down. The early transition from wood to coal in the UK was a big step down: harder to find and transport, dirtier - a pain in every way. Coal's only virtue was it's abundance. The transition from EVs to ICEs took a while - only when ICEs started to electrify did they become competitive. And, of course, we hid the external costs of oil from consumers: freeways (built by "engine" Charley Wilson after he went from President of GM to Secretary of Defense), pollution, overseas wars, etc. I'd argue that ICEs were never better than EVs - they just appeared that way.
On the other hand, EVs are better right now. They have better driving performance (better acceleration, better handling), and lower total lifecycle costs.
Unfortunately, we have more than 50 years worth of things we can burn for electricity. Fortunately, it doesn't look like we will. For instance, coal consumption in the US dropped 9% last year, about half of that due to loss of market share.
The transition from heating with wood to heating with coal took a lot more than fifty years. Electrification of the U.S. from small beginnings in the late nineteenth century to finishing rural electrification during the Great Depression took at least forty years.
Sure. These involved an enormous amount of infrastructure. On the other hand, EV/EREV/HEVs are manufactured on the same assembly lines as ICE vehicles, and roughly 75% drivers in the US have access to an electrical plug where they park.
If we mobilized all our resources as we did in World War II with the single objective of getting off fossil fuels as fast as possible, wouldn't the transition still take at least twenty years, and probably longer than that?
It would be much easier than that. A transition to EVs requires only a change within the automotive industry (for most drivers).
But are we actually seeing any replacements of oil?
Consumption in the US has fallen by more than 15% since it's recent peak in 2007 (while GDP has risen by 3%), and it continues to fall. Production has risen (both C&C and all liquids), and net imports have fallen by 25%.
Didn't past transitions occur in a environment of growth, when making new investments was a good idea, and banks would lend?
The transition from horses to rail occurred mostly during the Long Depression from 1873-1890. The move from horses to tractors and automobiles continued at a very good speed during the depression, as did general electrification. The transition away from oil for electrical generation accelerated during the 1979-1981 recession(s), and CAFE standards rose.
Isn't this expensive?
EVs and their cousins (hybrids, plug-ins, EREVs, etc) already have overall Total Cost of Ownership equal to or lower than ICE vehicles. Making long-haul trucks and coal plants prematurely obsolete is, of course, somewhat expensive, but the US has a big output gap (IOW, we have a lot of people and resources hanging around waiting for something to do), and really, it would cost a lot less than another oil war.
Apropos your efficiency points and Drake, I see where Elon Musk (Pay Pal, Tesla Motors, SpaceX) said the other day in the annual WSJ hosted energy conference, paraphrasing, "eventually all transportation, everything but rockets, will go electric". I think he's right. Every hard transportation problem I've looked at is viable, if the hardest long range cases will take some decades. The advantages are just too big not to win eventually.
Quite a cast of speakers in here: Musk, Craig Venter, Dan Kamen, and in the audience Q&A - Gov. Jerry "Moon Beam" Brown, Yergin, Lovins.
http://online.wsj.com/video/elon-musk-on-changing-the-energy-sector/77D5...
That's good, but I wonder if we can find a transcript - reading is a lot faster...
Nick, please make your posts a little bit shorter. I have other things to do and choose not to reply to a whole chapter of a book. However:
Well I find it hard to believe that our manufacturing has grown by 1.5 times in 1979 dollars, especially since most of our heavy industry has been outsourced overseas. I would need a reference for that. However you must realize that we have a world economy now. And the world consumes about 12 million barrels of crude oil more now than it did in 1979 and if you count all liquids it is a lot more than that. We import a lot of manufactured goods and those imported goods, along with what we manufacture here consume a lot more oil than we consumed on imported goods + manufactured goods in 1979.
Your transitions times is interesting but transitioning up from the EROEI of draft animals to coal powered steam engines, then to diesel and gasoline powered engines is one thing, but transitioning back down will be another matter altogether. And we transitioned up as the population grew. The industrial revolution, then the green revolution enabled the population to explode. And it is still growing at about 70 million people per year.
However transitioning to less efficient forms of transportation will be a different matter entirely. And diesel power powered the green revolution. Running our farming industry with wind or solar will be a different matter altogether. And in the meantime the population just keeps growing.
You transition times are just great as long as you are going up the efficiency ladder. Going down the efficiency ladder will be another matter altogether.
Most of your post was answering questions that someone else asked, not me. So I will not bother with them.
Ron P.
I have other things to do and choose not to reply to a whole chapter of a book.
Think of this not as a debate, where we have to read just enough to find a way to win the argument, and instead think of it as an opportunity to learn something, or teach something.
Take your time and think about what I wrote - you'll find it informative.
most of our heavy industry has been outsourced overseas.
This is a good example of an urban legend that's repeated endlessly on TOD. The US has lost manufacturing employment, due to productivity increases.
The US manufactures 50% more now than it did in 1978. People are misled by the fact that US manufacturing employment has dropped substantially in that period. But, that was caused by sharply rising manufacturing labor productivity, rather than by a decline in absolute levels of manufacturing output. See nice charts at http://www.dailymarkets.com/economy/2010/10/03/increases-in-u-s-worker-p... .
Here's production data at http://www.census.gov/manufacturing/m3/index.html, including http://www.census.gov/manufacturing/m3/historical_data/index.html , especially Historic Timeseries - SIC (1958-2001), "Shipments" .
It would be very hard for US manufacturing to grow faster than labor productivity, which tends to grow 3-5% per year. So, the best we can hope for is flat employment levels. That, of course, would be a relief for US workers in manufacturing.
--------------------------------
transitioning back down will be another matter altogether.... transitioning to less efficient forms of transportation will be a different matter entirely.
Electricity is more efficient than oil, and wind power has a higher E-ROI than oil.
EVs are better than ICE vehicles - faster, nicer, quieter, cheaper.
Really, you need to change your intuition about renewables, EVs, heat pumps, etc: they're improvements over BAU.
Well I find it hard to believe that our manufacturing has grown by 1.5 times in 1979 dollars, especially since most of our heavy industry has been outsourced overseas. I would need a reference for that.
Nick is correct. US mfn output 1975: $1.5 trillion, 2010: $3.2 trillion (2005 dollars). US employment in manufacturing has declined, but output has gone up.
Neither the world nor the US was in a four year long recession in the 80's. See here.
Aphorisms like "no doubt" hooked on to assertions don't make arguments. Cutting consumption and recreation are not the same thing. Again, if the US versus Germany or the UK can survive and thrive on half the per capita oil consumption of the US, why can't the US do likewise, over time?
Of course it will "survive" and "thrive" is a matter of opinion. I think it will be an extremely tough life. Lots of people will lose their homes. It will be worse if one gets caught up in an inevitable resource war where those countries with big militaries attempt to get more oil, like the US with Iraq. Expectations will have to decline tremendously and personal self-sufficiency will have to increase greatly.
We certainly won't need all the university graduates we are producing and the currently employed will hold on to their jobs until they are kicked out.
So we will have the first of the "lost" generations of young people. That will create trouble, especially the unemployed young men. Political systems will get rearranged.
On the way up the energy consumption curve, the economy became highly specialized and global trade increased. On the way down, the economy will generalize, wages will plummet, living standards will decline and global trade will drop dramatically. Protectionism will come back in a big way.
Everyone should read the German Bundeswehr Transformation Centre's report. It lays it all out quite thoroughly.
http://www.energybulletin.net/sites/default/files/Peak%20Oil_Study%20EN.pdf
Because the US population is so spread out. Public transport will be almost impossible (uneconomic) for areas outside the big cities.
No, I don't. I think that efficiency gains, brought on by high prices and the eventual discrediting of the cornucopians (which will probably occur quite rapidly once either a tipping point or some spectacular development is reached), will buy us time to make the transition to sustainable energy systems. Eventually we'll have to operate on 100% renewable energy. Fossil fuels (and other non-renewables like uranium) are only a transition bank.
Go back and compare per capita oil use in Germany or Britain with the US. Most of the difference arises from spectacularly wasteful consumption patterns in the US. When people realise they can't afford it, they'll change them.
It'll happen here in Australia, too. I'm quite looking forward to it.
Ron's comments are spot on, of course.
Efficiency might save us 20% or perhaps even 50%...but oil will keep declining and all the while we will be experiencing a credit crisis, enormous unemployment as the abundant-energy economy disappears and, of course, resource wars.
It's fairly well explained by the Bundeswehr Future Analysis team:
http://www.energybulletin.net/stories/2011-08-30/complete-english-transl...
They point out:
It has been my experience that most people are psychologically unable, for whatever reason, to consider the implications we only partially describe in the paper.
My prob w/ ALL economic collapse projections, is that all of them Ive seen fail to take into account that ALL govs debt/spending projections face drastic change as Poor/unhealthy/old die off from Medicine suppply shocks. Not just pill shortage, but lack of service, equipmnt, ect.
We have *BILLIONS* alive today who wouldnt be W/o these meds/care. Id guess many would be gone in less then 2 weeks just from a loss of *Illict* narcotics, not to mention, SSRI's, Sedatives, Inslin, Narco-pain meds and antibiotics.
Grim, YES. But def relevent! If that loss in debt projection, offsets gov policy options, to calm markets in the panic that changes the entire collapse modle.
IE: Is $2TRLN in QE, to calm markets as millions die, so bad if $4Trln in projected debt dies, and remaing population is of GREAT health and has PLENTY of resources no one was expecting them to have B4 die off?
Just seams many on focus on basic market theory, and dont give due credit (pun) to social/gov/market responce. And 2nd order event implications, to public health and Gov spending expectations.
Outside the realm of an oil site, but if economics is gunna come up as a threat, it seems a lil nieve to ignore a die-off of people Govs would be spending most money on.
P.s. typin on 4.3" mob device w/ pen, sorry 4 errors ect.
I would expect that "Command Economies" would be put in place in many countries to provide continuity and stability before things fall apart.
The recent Executive Order would be very supportive of that kind of transition, if it becomes necessary. In reading that EO, it does look like a classic command economy scenario.
Agreed.
We'll see price controls and other forms of central decision making soon. Certainly this decade and quite possibly before 2015.
From Limits to Growth: The 30 Year Update:

Adapted from ASPO: The Growing Gap:

Cheers,
Jerry
Hmmm,
I have 3 kids - 17, 15, 12. How do I break the news that their mid-life crises may well be, well, a real crises and not imagined? My hope is that the ramp down will be gradual enough for them to bear. My fear is, given the main-stream world we continue to try and grow, their education over the next few years will be a waste of time.
Cheers, Matt
After almost two years here on TOD I can comprehend the implications of an article like this. Unfortunately, this article is readable only by an "energy" literate audience. I would like to see more aticles in business journals and the MSM that boil this information down to something understandable to the average citizen.
In addition to regular reading here on TOD, I've read Matt Simmon's "Twilight in the Desert" and Richard Heinberg's "End of Growth", as well as having private discussions with friends whose families have been in the Texas oil business since before WWII. That probably makes me far more knowledgeable about Peak Oil than the average "Joe Six-Pack".
In order for the public to begin to understand the dilemma we are facing they need to understand some of the basics. Among the many things I had no clue about two years ago, here are a few, in no specific order:
1. Hubbert's Curve
2. EROEI
3. Export Land Model
4. Conventional vs. Non-conventional oil
5. Difference between Oil Shale and Shale Oil
6. What are Natural Gas Liquids
7. Timelines of Peak Discovery and Peak Production
The list could go on forever as I learn more here on TOD. What I would hope to see more of are concise articles that can be read and understood by the average congress critter.
I think the biggest roadblocak to a general appreciation and understanding by the general public is techno-worship. We have all these great new toys like iPhones that can do amazing things. Look at the pace of development there. How could limited energy be such a constraint? We'll just innovate our way out of it -- just compare computers today to 10 years ago.
But this is a misunderstanding between the separate topics of energy versus information technology. IT is cheap and is not limited by energy or the laws of thermodynamics -- it's simply a matter of making on/off decisions on a smaller and smaller scale. But you can't eat your iPhone and it won't power you're car.
no IT is still bound by the laws of physics
Energy - is a big issue for handheld devices battery tech has not kept up but we've been creative with chip design and power saving tec
just like we will with Big Power ( heating , lighting ) but only so far
heat for CPU chips - cant get rid of it fast enough - limits reached
Moore's Law has or is breaking down - exponetial growth ahs its limits in the Quatum level
all in all we are pushing new gains at more cost
and that brings it home to me when on this site we see more and more expensive oil being found
new IT development is getting more expensive
OK those little hand helds each are cheap - but getting there is costing .....
Forbin
yes right, I should have said that IT isn't YET bound by the laws of physics.
No, IT has always been bound by the laws of physics. What hasn't happened yet is IT hitting hard physical limits which lead to diminishing possibilities for continued innovation. Different!
Please re-read forbin's comment above. He hits the nail on the head!
Oh come on, obviously that's what I meant, you're taking the English language too literally.
Hey NH, my apologies!
According to this article, we are within a factor 1000 of the theoretical limit. The article talks about an experimental verification of the principles of the limit. Neat stuff.
It's the new boonies - where the cell signal isn't, the wilderness remains.
Trying to get the average joe to understand these concepts is too complicated. Cost is what is most visible to people, so we need to explain in the simplest way why gas prices have increased so much and why gas prices will on average continue to increase. I would simplify it down to
1. Demand for oil is increasing world wide, especially in developing countries such as China and India.
2. Production from the majority of oil fields world wide is dropping despite the use of enhanced oil recovery technology so we are starting to run out of oil that is cheap to produce.
3. It is the combination of increased demand and a flat supply that is driving oil prices higher.
4. New sources of oil production such as deep sea drilling and shale oil are quite expensive to produce and cannot be a source of $2.50 gasoline. Producing oil from the vast oil shale deposits would require even higher gas prices to cover the cost. Or to put it another way, "Drill, Baby, Drill" may be able to give us increased oil production but it won't give us cheap oil.
5. Point out what impact even higher oil prices will have on the economy, jobs and the cost of goods.
6. Suggest that the only way out of this box is to significantly reduce our dependency on oil.
I would say it's a waste of time trying to explain PO (or compounding growth) to my fellow Joes and Janes. For most of us, there's only two stages of denial... 1. Don't (refuse to) believe it and 2. Plain ignore it.
Only if TPTB come out in the next few years and collectively proclaim, "We are running out of oil" (or such; I understand that we'll never truly "run out"), will public discussion begin.
And that ain't gonna happen.
Cheers, Matt
I think by the time "the powers that be" come out and say, "We are running out of oil" (and that time will come), it will be some blindingly obvious that most of the people in denial now will think it's trivial. At least 60% of people will consider it a trivial truth.
Look at the marijuana laws - ~50% of people in the US think it should be legal, but TPTB are almost entirely against legal marijuana, and several states have made it semi-legal. At what point does it tip? You need more than a majority to change ingrained policy. It has to be startlingly obvious that policy MUST change.
There's a tipping point. If Ghawar fails, for example, that will be a massive blow to the credibility of the cornucopians, since most people who deny Peak Oil have an assumption (i.e. an unconsious idea) that Saudi Arabia is floating on oil. When that assumption is destroyed, very many people will be won over to Peak Oil. The House of Saud will also fall, which will provide many other benefits, beyond the scope of discussion on TOD.
Similarly, the "Drill Baby Drill" lobby will be destroyed simply by putting their candidate in office - something which they probably will, some day, achieve. When the US President says "This is a national emergency. I am giving anyone in the US the right to drill anywhere they want, any time they want, no questions asked" - and the cornucopia still fails to materialise, the credibility of this strategy will be totally destroyed. The Artic National Wildlife Refuge might only be a fond memory, but the dwindling band of cornucopians will be exposed to the wrath of their disappointed followers.
I think a big problem, which is rarely talked about, is that technology or progress is the RELIGION of industrial civilization. The true believers will never be able to take resource depletion seriously because it conflicts with their religious beliefs about human progress. I recommend that all of us of little faith start to prepare as best we can for the coming storm. I guess anyone who wants to fight the good fight as far as educating people, I am all for that. I just hold out little hope of any official response until it is too late. If the Government and big oil told the truth about the oil situation, I think the stock price of the big oil companies would plummet and bring about collapse early. The big oil companies can never tell the truth unless they go private or are nationalized or something. Telling the truth would hurt national security at this point! Everyone who takes in the message and has an idea of what may be coming; you have been given a head start, to do with what you will. The clock is ticking….
Really great summary, thanks for this, probably the best material for a Peak Oil 101.
Thanks Sam!
We were assiduous with references because this paper could not possibly have been written without the work of the countless people who educated us, including you.
This should be submitted to zerohedge... Would you be interested?
I think it would be fine but let me check with the others.
Flakmeister, it's fine by us. Please contact me at my email address in my profile and we'll arrange it. Thanks for helping to get the word out.
I agree. Written with great care and economy.
Phil
On the plateau and downslope, expect that the media will make reference to whatever the current production level is as being the "new" demand. Their logic will be that lower production or no growth in production is not a big concern since supply is in balance with demand, and that is basic but flawed economics. To some, lowering levels of "supply" will by definition always be equal to "demand", no matter the reasons for a dropping supply.
It's the demand destruction downstream effects that point to the weakness in an economic model that doesn't consider the limitations of the inputs as being connected to limitations in the outputs. Many economists and the media talk about "cyclical" trends. On the upslope of the Hubbert curve, many perturbations may have appeared to be cyclical, and there could always be a return to growth as long as there was more energy "in the pipeline" for the coming years to energetically support the desired and current outputs. Since the upslope was roughly a century long, it is easy to see how "cyclical" thinking was reinforced and mostly unchallenged. But just look at the Hubbert curve. Does it look cyclical at all?
Regarding demand destruction, examination of the chart at this website http://en.wikipedia.org/wiki/Supply_and_demand would suggest that moving from D2 to D1 in a demand destruction scenario can result in a price drop, such as was seen after the price of oil plummeted from 147 toward 40. Demand destruction due to higher unemployment could have played a part in that drop.
Things will be much different on the downslope than on the upslope. Please consider that on the upslope of the Hubbert curve even disaster capitalism was viewed by some in a positive way. Broken stuff got fixed and generated GDP (but the disaster capitalism train of thought worked best if it wasn't YOUR stuff getting broken). The negative affects of the disasters were masked by them happening on the upslope of the Hubbert curve where overall positive growth made the system as a whole bigger and better, even in spite of disaster setbacks in some places. But on the downslope of the curve, disaster setbacks may not get fixed at all as there is little surplus if any to take from other needs.
Human unemployment is very serious , but unemployment of our virtual energy slaves is just as serious, if not more so. In a scenario where there are less virtual energy slaves than before, we might be finding that the energy slaves are the ones who's contribution to real GDP is more dominant than human contributions, as the proverbial "heavy lifting" is engine powered for the most part.
http://www.energybulletin.net/stories/2011-05-09/you-and-your-slaves
In a free market, absent any price fixing or rationing, demand always equals supply because the price is the arbitrator. Brent, at this moment, is at $126.01 because that is what the market demands for the supply currently available. When supply drops one of two things must happen. Either the price goes up to a price where less oil is demanded or the economy will decline to a point where less oil is demanded. This could actually cause the price to drop, as it did in late 2008. This in turn causes less oil to be produced because of the high cost to produce the marginal barrel.
I realize what the author, Dean Fantazzini, really meant when he wrote that sentence. However he needed to express that sentiment with different words because what is demanded always depends on what the price is, not what people need to continue business as usual. If only 80 mb/d can be produced then the price will rise to the point where only 80 mb/d is demanded.
Ron P.
We had a conversation about that sentence. There certainly is another, more precise way to state that but for simplicity's sake we opted for that version.
Hubbert (1982) wrote: “There is a different and more fundamental cost that is independent of the monetary price. That is the energy cost of exploration and production. So long as oil is used as a source of energy, when the energy cost of recovering a barrel of oil becomes greater than the energy content of the oil, production will cease no matter what the monetary price may be.”
This is not 100% true. Say we figure a way to use electricity to produce the oil, we may put in more energy from the electric source than we get out, because the oil is required in situations that electricity just won't work. You can't make chemicals and fertilizers from electricity (obviously we can use other hydrocarbons like NatGas - I just used this for illustration). Currently we use electricity to create Hydrogen and other gases and the amount of energy used to create it is quite a bit greater than what we get out. The truth of Hubbert's statement is true up to the point that ALMOST all oil will cost more energy to produce than the cost of what we get out. Since there will be products that will require oil even if the cost of energy is higher to produce, we will be willing to trade the type of energy we can't use directly at a deficit for the type of energy or product we can use or for the energy carrying capacity (like hydrogen).
You're correct, of course. My guess is that Hubbert, if pressed, would have acknowledged what you point out. But he probably went for the simple explanation to make his point.
Excellent article and summary of Peak Oil!!
I appreciate that the article dealt with all aspects of Peak Oil: geologic, monetary, investment, technological, social, political, etc. The article touched on one of the third rails of the Peak Oil discussion which is the possible political responses to Peak Oil:
Friedrichs (2010) also cautions that after peak oil countries have several sociological trajectories available to them, they can follow predatory militarism like Japan before WWII, totalitarian retrenchment like North Korea, or, ideally, socioeconomic adaptation like Cuba after the fall of the Soviet Union. Given the recent century of conflict and the extensive weapon stocks and militaries held by modern nations (especially the United States, which spends on its military almost as much as the remaining countries of the world combined (SIPRI, 2011), there is simply no guarantee that the relatively peaceful period currently experienced by developed nations that is conducive to rapid energy source transitions will continue much longer.
This paragraph says a lot about how countries in different economic and military positions might respond to peak oil. The distribution of a critical scarce resource may not follow the normal capitalistic models for supply and demand.
If mitigation efforts could offset some of the natural decline in production (Fig. 7) is there an inherent vicious feedback that might set up? That is, if alternatives could come on line, it seems that this would reduce the incentive for new exploration and development which would cause a more rapid decline.
I think that alternatives are highly unlikely to ever approach the Btu/$ of naturally extracted petroleum so that will not be an issue.
From the Megaprojects Wiki we see expected additions to production that are way below Fig 34 above. The last update for the Megaprojects may have been late 2010, but it’s hard to imagine that things would have become so much better so quickly. It looks like late 2012 for the next price spike to trigger the next economic contraction. Maybe the Chindia growth slowdowns will push it to 2013.
      2006  2007  2008  2009  2010  2011  2012  2013  2014  2015  2016  2017  2018
Total 3845  2950  4468  4957  4950  3214  2475  2495  2220  2530  1385   462   130
Does anyone have new Megaprojects data?
The ELM makes things lok even more iffy - right now!
Sorry, years got shifted one to the left.
Murray, use the [pre] and [/pre] html tags before and after your data and you will not have that problem. But with chevrons, < and >, instead of brackets of course. Also you can test your post with the "preview" button to see if you got it right. And you can continue changing it and checking it until you get it right. Then, and only then, you can post it with the "save" button. And even then you can still change your post with the "edit" button until someone replies to it. Then the edit button disappears.
2006 2007 2008 2009 2010 2011 2012 2013 2014 2015 2016 2017 2018 Total 3845 2950 4468 4957 4950 3214 2475 2495 2220 2530 1385 462 130The date at the bottom of the page was when the data was last updated:
This page was last modified on 23 January 2012 at 11:03.
The date at the top of the page was when the script was updated, not the data.
Ron P.
thank you muchly. I will try to learn how to post correctly.
I'd like to advise to judge the information on Wikipedia carefully. Their numbers are neither necessarily up to date nor correct. On the one hand, anyone can edit the pages there, and the editorial oversight is done by volunteers, so there are no guarantees of quality. On the other hand, each page is updated only by people interested in the subject, like you and I. If there's little interest, then the page stays outdated. In this particular case, the numbers haven't been touched since at least early 2011. All other modifications are mostly formatting. You can examine the recent changes in the history of the page.
I'm not saying, however, that everything in Wikipedia is false or something like that. There are a lot of great resources there. I just want to point out that everything there should be read critically, especially the information that lacks supporting external references, or is on a page which attracts few editors, or is about a controversial subject such as Peak Oil. The Megaprojects page, unfortunately, has all three issues.
Regards,
PLL2
Thank you for this excellent "primer" on Peak Oil. With some limited editing, it will be a useful document for me to send to friends who have no grounding in geology or economics.
I think one area that loses people, is the concept of EROEI. It just isn't intuitive. The fact is, oil companies don't calculate their costs in terms of oil or energy, they calculate them in fiat currency. For "outsiders", it's more intuitive to think in a "cost to extract" vs "revenue from extraction" mode. The analogue (surely?) is gold mining. When the revenues of a gold mine are less than the costs, it must be shut down even if there is theoretically a lot of gold remaining in the mine area.
I see a tremendous disconnect between how Americans (especially on the "right") view the oil problem, versus how most people in the Rest-of-the-World view it. It seems many Americans believe there are hundreds of billions (even trillions) of barrels available for extraction in the US, while most of the RoW acknowledges that we are, somehow, dealing with a finite resource and that the oil price is acting so as to ration demand.
As good as the article is, it's not going to convince the drill-baby-drill crowd. But then again, will anything ?
"But then again, will anything ?"
No: I'm convinced that only a small portion of people will ever understand the concepts discussed in this paper. Most people will find their favorite scape goat and be content blaming our predicament on that.
That's the biggest roadblock IMHO - convincing the red states that the limitation is literally the amount of resources underground. They much prefer the myth that other people/groups are artificially forcing economic contraction upon them. Govt, evil liberals, etc.
I think the strongest point we can make is about the price of the remaining oil. We're drilling (and spilling) a zillion feet below the Gulf of Mexico because that's the cheapest oil we have left to pump.
All these tar sands & shales & other unconventional sources in the news lately . . . we need to point out that these sources have been known about for decades. We didn't use them in the past because they didn't get economical until $4/gallon gasoline. And they stop being economical again as soon as gasoline falls back any cheaper.
You would think that people involved with oil production in red states would be receptive to the argument that limits exist. They would know.
Also blue states have their own distorted thinking about oil - price spikes are due to speculation, the evil oil companies and wall streeters are behind it, etc.
Problem is of course so many in all the states are victims of bad information of one kind or another. The media/political elite is really doing a bad job explaining what is going on.
So according to Figure 3, shouldn't oil shale (Kerogen) now be profitable?
Do we actually know the price at which oil shale is profitable? I believe it was not profitable now nor does anyone have a good idea when it is profitable. Is that wrong?
Or is this the common confusion between tight oil from shale formations versus oil shale (kerogen).
For historical data see Walter Youngquist in the Hubbert Center Newsletter, GeoDestinies and elsewhere. I particularly like the failed use of nuclear fracturing. . http://hubbert.mines.edu
I noticed that issue as well. Shouldn't "oil shale" really be classified as an example of "X to liquids" like coal-to-liquids or gas-to-liquids? Hydrocarbon shales are a solid fuel, and require at least as much work as CTL... The terms "shale oil" and "oil shale" are confusing, perhaps deliberately so as there are plenty of people trying to sell barrels of non-existant oil.
Personally, I never take these price graphs too seriously, as they are speculative and prone to the same mistakes as any speculation. Oil sands and even biofuels are a reality on the ground, but CTL, GTL, and oil shale are still not being used. Maybe they will be, maybe they won't. Speculative tech can be like fusion - always 10 years away - or like oil sands.
Yes, 'economic production' (a double misnomer if ever there was one) of oil shale (keragen) is always X years away. When oil was $10, shale would be economic at $20, when oil was $30, shale would be economic at $50. Now that oil's $120, shale will be economic at $150 (or whatever, these #'s are for illustration only, don't try this at home, or take this as investment or medical advice...)
The reason is EROEI, and our poor collective understanding of it. When oil was $10, shale would have been 'economic' if all else remained static, and the 'producer' could have gotten $20 for his keragen sourced oil. But of course as the price of oil goes up, so does the price of all the inputs, including the direct energy needed to cook the stuff, and also the labor, steel, tires, etc...
This snake will never be able to 'economically' eat its tail...
All those technologies are being used in a limited amount. IIRC, Mikael mentioned that a CTL plant is being constructed or got the permits to be constructed in the U.S.
IIRC South Africa has CTL plants with combined output of over 150kbd. Maybe someone knows, what are the factors that led to similar plants not being build in other countries, or expanded in South Africa? 150kbd is rather an industrial scale installation, it should be already scalable. But why hasn't this taken off? What's so specific with South Africa?
[edit] My question has been answered by deanfa below. Thank You.
South Africa built its coal-to-liquids plants because it had an oil embargo imposed on it by the oil exporting countries during the apartheid era.
It primarily did it to ensure that its police and military were supplied with adequate amounts of fuel to control the country. It was a military strategy, and economic considerations were not important.
If energy supply to the civilian population is the only consideration, there are cheaper ways to do it. Freight and passenger trains, for instance, work quite well on electricity.
It costs very serious money to electrify freight and passenger trains.
Electrification is capital intensive but results in lower operating costs. Many countries have electrified most of their railroad traffic. North American railroads have not so because oil has been plentiful and diesel fuel has been cheap in NA.
Railroad infrastructure in the US is private, and subject to local property taxes: that shifts the cost/benefit ratio away from capex intensive electrification to opex intensive diesel.
$100 oil is enough to push that ROR on electrification up to an acceptable level, but not high enough that it's a high short-term priority for railroads. They'll invest in it when they're doing other projects that make it convenient.
CTL is implemented in South Africa and some plants have been built recently in China. However, the development of CTL in China is almost close to a stop.
Together with Andre', Mikael and Simon we are now working on a paper dealing with CTL and GTL. We are in the middle of the work, but I can already tell you that
- the huge overnight costs and high O&M costs
- empirical yield much lower than laboratory yield
- uncertainty about reselling prices of FT liquids
- uncertainty about financing possibilities
- uncertainty about the enviromental regulations
- large amounts of water (of decent quality) required (which is not always available)
makes CTL only an extremely marginal option at best. Given this framework, for example, it is not a surprise that China basically stopped its CTL development. A somewhat different situation holds for GTL, instead. If we will manage to publish also this paper we are working on, we will definitely make a post for TOD.
The problem with some of these technologies is the "receding horizon" effect. As oil gets more expensive, the processes that depend on it get more expensive, too, including oil from shale. Thus an assessment of the viability of a technology is time-dependent.
It might be economically feasible now but someone would have to run the numbers again to confirm.
Using 2007 data for energy sources (Figure 2) gives a misleading impression of oil dominance. When oil reached its peak in the mid-2000s, growth switched to coal which is now being used at a similar rate to oil.
In energy transitions you ignore the transition to coal which has been underway for the best part of a decade. Coal use will itself peak, but at the moment, the world response to approaching the bottom of the oil barrel is to burn more coal.
Perhaps...but oil is what I call an "enabling" resource — it enables us to get all the other ones. When viewed from that lens, it's difficult to overstate the importance of oil in our economy.
And we never left the coal age so the transition has been going on for much longer than a decade.
If you regard oil increasing while coal is static as a transition to coal, then yes, the transition to coal has been going on for much longer. Not many people would agree that constituted a transition to coal though.
In the last decade coal has been increasing while oil is static, and its heading to overtake oil any time now. Take a look at Gail's post of March 16th, which is the most recent post on TOD with this data. Coal has gone from being responsible for virtually none of the growth in energy use ten years ago, to being responsible for about 80% of it. That's a transition in progress. Per capita use of coal barely changed during the 20th century, the growth being almost entirely in hydrocarbons. The 21st century is seeing a reversal of that.
I think you will find its coal that is the enabling resource. China can consume more oil because of all the coal its burning, not vice versa.
Coal is not used as a transportation fuel--and that is where the immediate problem is.
Coal can be and is used as a transportation fuel. Much of the Chinese rail system is electrified, and about 80% of the electricity is generated by coal. And, there are also about 120 million electric bicycles in China.
Slightly off topic, but I have become enthralled by this blog of an American couple riding their bicycles around the world. It is a great read, with an easy writing style. Near the bottom of this page they briefly describe the electric bicycles they encounter in China. Also in many of their other pages for China you will see first hand accounts of the coal pollution, from a cyclist's perspective. It's not really too much different than North Americans using natural gas, it's just dirtier and doesn't come through pipes.
http://www.crazyguyonabike.com/doc/page/?o=1&page_id=98072&v=WA
X2M Countries
Please consider Figure 6. Indonesia and Egypt (along with China, Peru, UK, in that order) are key oil countries which have transitioned from exporters to importers ("X2M"). Others will follow in short order, most strategically Mexico.
Perhaps X2M countries could serve as proxies for the post-peak-oil world. Oil and other energy-related prices (electricity, public transport, ...) in volatile X2M countries could provide us guidance in understanding market responses to global peak oil. You may recall that Indonesia went through some very painful withdrawal symptoms in 1998 when the IMF imposed its discipline on the government.
What happens in post-export times to the stability of governments accustomed to buying votes and settling civil unrest with energy subsidies? Indonesia and Egypt are still exporting natural gas, so their ultimate day(s) of reckoning may have been postponed a little, but
Has anyone plotted exports vs. changing energy prices in these X2M countries? Such plots could be instructive.
One day after this post, the Financial Times chimed in:
WIth due respects to Hubbert he s wrong when he says that oil production will cease when the energy used to produce it exceeds the energy that the oil contains. That statement and similar ones made by so many others assumes that energy is completely fungible. As the author observes oil is a pretty unique source of fuel and therefore the energy in oil will attract a much higher price than the energy in another source. Therefore as long as there is a positive cashflow i.e. the income received from selling the oil energy is less than the cost of producing it - it will produced even at a negative EROEI.
Yes, but not nearly in the quantity it is now. More like 1/100th the current amount, as a guess. So my sense is that he is using an absolute to make a point. Of course, he's no longer here to confirm that assumption!
The overall well-to-barrel EROEI must always be greater than 1:1. Nothing can happen below this no matter what economic situations prevail, because the first law of thermodynamics states that energy can be neither created nor destroyed.
But as mentioned, because of oil's versatility and desirability, the EROEI of only the oil part of the system could indeed go negative. BUT.... we have to factor in the EROEI of the natural gas used to extract the oil. For example, if the EROEI of the natural gas is 40:1 and the EROEI of the oil that is being extracted by the gas is 0.5 to 1, then the overall net energy of the whole system is 20:1, and this is driven by the higher price that a "producer" gets from selling a BTU of oil versus the lower cost he pays to purchase a BTU of natural gas.
But if the EROEI of natural gas drops to 2:1, and this is paired with oil at 0.5 to 1, then overall the EROEI of the system is 1:1 and this will never happen in this universe governed by the laws of physics. That oil will stay in the ground and we will only have the natural gas available for use.
CrazyV
I dare you to say that to him directly, face-to-face!
That depends on the energy source:
For oil: 7.29:1
7.29:1 is the theoretical ERoEI at which oil produced becomes an energy sink, as opposed to an energy source. For coal it's probably higher and for NG perhaps somewhat lower; although, we have not done any in-depth analysis to verify this coal/NG evaluation - and probably won't.
The Hill's Group
I am sorry but that begs for an explanation. If it cost 1 dollars worth of energy to produce 7.29 dollars worth of energy that is an 86 percent profit. Even if it is described as pure energy, if it takes 1 megajoule of energy to produce 7.29 megajoules of energy then that is still an 86 percent return on energy invested.
I would think that the return from the oil sands would be way below 86 percent.
Ron P.
86%?
the 7:1 ratio is because of the required need of the energy to offset the depreciation or use of the oil in society
1:1 you get it out the ground
2:1 you can refine it into useful stuff. fuels and build the attendant infrastructure
3:1 you can put it in a truck
4:1-7:1 you can make things that you can put in the truck to move to markets
etc etc etc
the figures is subjective and fuzzy and I make no claim on the authenticity of the numbers but you see the idea
less than 5:1 things become a bit "on the edge"
As EROEI gets lower then a greater proportion of the labour force must be dedicated to extracting it. This will provide job opportunities for an ailing economy, and therefore justification for our political leaders to enable the extraction of all remaining fossil fuels rather than build out renewable infrastructure.
As I say, it will be "everyone piling into the bilge with coffee cups to bail out the sinking ship rather than enjoying the benefits of a healthy seaworthy ship up on deck."
No Mididoctors, I don't think it works that way. You are making the driller also the refiner and even having him deliver it to the service station.
If an oil company can produce oil at $50 a barrel and sell it for $100 a barrel he does not give a damn what it cost to build the refinery or what it cost to refine the oil or truck it anywhere.
Again, if it cost him $50 to produce a barrel of oil and he can sell it for $100 then he has a ROI of 2 to 1. I think he can make a profit at that.
True, a lot of producers also own a lot of refineries. But most of them buy a lot of oil also. And today they are paying $125 a barrel for that oil. If it cost the producer only half that, he is still making a lot of money.
Ron P.
I'd argue that political resistance from elites that gain their wealth from oil and Fossil Fuels (as well as from the employees in those industries) are the primary problem in transitioning away from oil/FF.
That might be a useful thing to include in this kind of discussion.
Agreed, our societies are organized very unfairly. Most peoples' ideas about how their economies and societies operate are highly skewed towards the naive belief that everyone has equal opportunity and our supposedly "free markets" exist to foster efficiency. The reality is that middle class is being sucked dry of its little remaining wealth but the vast majority of us fail to see this. This has always been the case, except historically that wealth was replenished through economic growth. Now that we can't grow anymore, the middle class is dying.
I am amazed at the lack of enthusiasm for EV's out there, and that is not accidental. Usually new products such as this are swept up by the media and everyone and his dog wants one. The typical response is ... "meh". Yet EV's offer so many advantages I can't believe every second car purchase isn't one. I have a Leaf and I love it -- the only disadvantage is the range limitation and this can be worked around. And then you hear people complaining about gas prices!
The reality is being intentionally kept out of the media.
Well, the media is going far beyond a passive lack of promotion: Fox News is doing it's best to kill the Chevy Volt in it's cradle with relentless attacks, filled with misinformation and cues to it's followers that "we" don't drive EVs.
This despite the fact that Fox News pretends to be patriotic, and the Chevy Volt has a dramatic potential to help the US car industry and reduce US dependence on oil imports.
A quibble: I'd frame the class description by saying that the middle class is stagnating while the benefits of all growth go to the 1%.
The truth is that our economy is still growing, but the benefits are being grabbed by the wealthy elite. OTOH, that elite is willing to hurt the economy and forego general growth (by preventing a transition away from FFs) to preserve it's privileges.
Elites resist innovation because they have a vested interest in resisting change — and new technologies that create growth can alter the balance of economic or political assets in a country.
“Technological innovation makes human societies prosperous, but also involves the replacement of the old with the new, and the destruction of the economic privileges and political power of certain people,” Acemoglu and Robinson write. Yet when elites temporarily preserve power by preventing innovation, they ultimately impoverish their own states.
... “Most consequential ‘policy mistakes’ are by design,” Acemoglu says. “These leaders are choosing policies that don’t maximize economic prosperity, because their objective is different: to hold onto power or simply enrich themselves.”
http://web.mit.edu/newsoffice/2012/why-nations-fail-0323.html
You said it best Nick
Thanks!
Now, I'm hoping we can begin to incorporate into our energy discussions this basic idea:
The transition from oil & fossil fuels isn't a technical problem, it's a political problem.
If you want to know who's blocking change, just "follow the money".
Darwinian said:
This explanation is a little much for a post here, but I'll see if I can make it simple and short. The problem lies with the confusion implicit in the definition of ERoEI. When you pump oil from an oil well you do it by investing work - you are not investing energy. Energy is a property of matter, work is the result of a process, and even though they are both measured with the same units (joules, BTU, ft-lbf, etc.) they are not the same thing. The energy that comes from the well head must be converted into work (goods and services) before it can be re-input. This conversion process always incurs losses; these losses are guaranteed to occur by the Second Law.
For the global oil system the energy to work conversion efficiency is 19.6%. (It is interesting to note that the US conversion process until 1971 took place with an efficiency of 22.9%. This we can be very confident of because we know almost exactly when it peaked). That is, it takes 5.1 BTU of energy from the well head to re-input 1 BTU of work back into the well.
One of the several ways we came up with 7.29:1 is this: using availability analysis (sometimes called exergy analysis) we computed the Maximum Theoretical Second Law Thermal Efficiency (MTSLTE) for the hydrocarbon crude oil. Even though MTSLTE depends somewhat on the molecular weight (MW) of the hydrocarbon being tested, using the median MW of 31.6 degree sweet crude under optimal conditions and adjusting for asphaltenes components (which may not be refineable) we get 70% (octane, C8H18, has an MTSLTE of 70.2%).
The Second Law says that the very best we can do is extract 70% of the 140,000 BTU that is in a gallon of oil. That is 98,000 BTU. If we reinvest all of the 98,000 at an efficiency of 19.6%, it produces 19,208 BTU of work. ERoEI = EG/EP: where EG = 140,000 BTU (internal energy per gallon, derived from EIA data) and EP is the work invested at the well head. ERoEI = 140,000/19,208 = 7.29:1.
To compute ERoEI it is necessary to convert the work input into equivalent units of energy. This is the problem that many economic evaluations of ERoEI run into. A $ is a work unit, it represents goods and services. Your $ analysis above did not take into consideration the effects of the Second Law. That's a common enough error. Hubbert's equation being a statement of the First Law (the conservation of energy and mass) didn't either.
The Hill's Group
Great explanation, I never thought of it that way. This would increase the energy cliff from the common figure of 3:1 to something higher. We also have to factor in all the supporting social infrastructure that must go along with extracting the oil, as otherwise all oil would simply go into powering machines to extract more oil and society would have no excess available. So then continuing with the generally accepted energy cliff of 3:1, multiplying 7.29 by 3 gives 22:1 as the real energy cliff
I wish Jimmy Carter was president now. He gave some excellent speeches about fossil fuel depletion, unlike Obama, who remains silent. Carter advocated a return to plentiful coal to replace dwindling oil & gas, and the development of solar power, which we would rely upon in the next century. Coal eventually peaked in energy output in 1998 at 598 million tons of oil equivalence from 1 billion tons of coal. By 2005 we were getting 576 million tons of oil equivalence from 1.1 billion tons of coal. Coal is done, now down to 44% of U.S. electricity, and rolling blackouts are now common throughout the nation. As for solar, 12 years into the next century it remains 0.02 percent of our electricity. The EROEI becomes negative with lead-acid battery storage. What impressed me about Carter was that he was a nuclear submariner, and understood the virtues of fuel ten million times as energy dense, but did everything he could to cancel our breeder programs, which Clinton finally finished for good in `94 with the IFR. We have powered subs on light water thorium breeder reactors, which produce as much uranium 233 as they consume, and the Russians have successfully powered atomic subs on liquid metal cooled fast breeder reactors, either by sodium or lead bismuth. These things can go millions of miles without refueling, on a piece of fuel the size of a backpack. Carter simply understood that the infinite growth paradigm was killing us all. We need to reverse population growth and economic growth for several decades, and only then will we deserve the IFRs. Carter's energy advisor was Admiral Hyman G. Rickover, an ingenious Ashkenazi Jew who has given some absolutely incredible speeches about energy and the breeder, but later became anti-nuclear in the early `80s after a lifetime of dedication to nuclear. He thought that growth was wrecking humanity.
This is a pretty good article. It has much better balance than many such presentations, and I could almost use it myself.
Unfortunately, it still has some things I wouldn't want to present to a friend or colleague. In particular, section 5 needs a total rewrite.
...Hirsch (2008) estimates that the world economy will contract at approximately a one-to-one ratio.
This is...highly unrealistic. It doesn't match up with any kind of sensible analysis.
In his best-case scenario, using a 4% per year decline rate, an idealized crash program to produce liquid fuels does not pause contraction sooner than ten years after the onset of decline.
That was also highly unrealistic. This is from his study that didn't even consider EVs (and related vehicles: HEVs, PHEVs, EREVs). It made the very bad assumption that only liquid fuels were a viable solution to PO.
Heck, he didn't even consider basic things like carpooling.
If the peak of oil production occurs this decade, there is insufficient time to avoid contraction because of how long it takes to transition the vehicle fleet.
Not realistic. In the US, 50% of vehicle miles come from vehicles less than 6-7 years old.
We have plenty of electricity, and plenty of time to transition from fossil fuel sources of electricity to renewable sources (not that we shouldn't transition away from FF much more quickly to reduce CO2 emissions...).
Our current operational problem is liquid fuels, and there are plenty of good substitutes for liquid fuels: electric vehicles (and their variants: hybrids, plug-in hybrids, extended range EVs, etc); freight reducing fuel consumption by 2/3 by moving from trucks to diesel trains, and then electric trains; heat pumps; and for the small percentage of energy that's needed for long-distance transportation, synthetic liquid fuels will work just fine.
We have plenty of electricity?
Yes, especially in the US, to which the Original Post is largely directed.
A lot of the current electrical production is from FF. It will take a huge investment just to transition the current sources of electricity to renewably generated sources let alone add EV demand.
It will take a huge investment just to transition the current sources of electricity to renewably generated sources let alone add EV demand.
Not really. It takes a "huge" investment just to replace and fuel FF generation: renewables aren't really more expensive.
Now, if we choose to replace FF generation prematurely, that could be modestly expensive.
Here we go again...
90% of vehicles are purchased on credit. Credit tightening always accompanies economic contractions so very few EVs will be sold. Very few of any type of vehicle will be sold. Hint: that's why the US car companies went bankrupt — and will again. There will be two things missing for your vehicle fleet transformation: buyers with enough cash on hand (who are willing to part with it) and car companies to make the vehicles. We will watch the current fleet rust and largely not be replaced.
A very common error I see people make, you especially, is taking trends and numbers from now and assuming they will continue during a credit collapse.
It's a very basic error, but you make it repeatedly.
Aangel, how did Nate Hagens describe our debt situation, as debt overshoot I think? If one views the current global economic system as healthy, it would be quite difficult to advance the conversation or even have a meaningful conversation about energy risk. Some of the arguments laid out in Nate’s infamous Cornucopian LLC. Paper would be true if the economy is healthy. We will print as much money as we need and all get new electric cars. Like Nate said
“New credit/dollars require very few natural resources - some paper (forestry product), ink and machinery, most of which is already built”!
Great work on this paper by the way, it may become my default paper when I need to give someone a more nuanced take on our current energy predicament.
There and Back Again : ) http://www.theoildrum.com/node/6343
Thanks, Mark. Our goal was to make a readable, thorough exposition of what we know and what are the risks.
And yes, the thinking of the cornucopians always seems to assume a stable financial system. Of course if they didn't assume that they would understand that their predictions are very, very unlikely to occur.
This book is making the rounds currently in my circle:
http://www.abundancethebook.com/
Completely cornucopian thinking with no accounting for declining energy production or a failing financial system.
Aangel,
Here we go again..
You continue to use a circular argument: "a modest reduction in oil availability will cause a severe economic collapse, therefore it will not be possible for the world economy to make modest changes to adapt to oil shortages."
At least for the US and most developed economies a lot more oil is being consumed than is necessary because it is still so cheap (ie $4-10/gallon).
If we have a real shortage we should expect:
(1) a reduction in non-essential private vehicle/one person/vehicle travel. This may involve car pooling, less frequent shopping trips( but buying more/trip), children walking to local schools and sports events/ activities. This wont be very dramatic unless we have rationing or the price >$20/gallon.
(2) a much higher proportion of new vehicles being PHEV, HEV and higher mpg ICE vehicles.
(3)some conversion from gasoline burning ICE vehicles to CNG(ie whats already happening in many developing economies).
(4) complete conversion of oil heat to NG/ electric heat pumps.
(5)movement from some transport from road to rail
(6) possible rationing to ensure that all essential services, industry and agriculture continues to function while the economy transitions away from oil use.
What we should NOT expect is consumers continuing to buy vehicles that average <25mpg, parents spending several hours/day shuttling children to school and extra-school activities, across country vacations and family visits in low mpg vehicles, >90% of commutes with one person/vehicle or driving a 2 tonne vehicle 1km to pick up a litre of milk. Continued economy air travel. For some this may feel like the end of BAU, for others they are already living this way.
Neil,
nothing circular at all.
First, a modest reduction in oil consumption directly leads to something dramatic happening with the world's debt: since it can't get paid back without economic growth, what do you suppose that will be?
Second, it also directly leads to a large increase in unemployment. The further oil production contracts, the smaller the economy becomes and the worse unemployment becomes. This rather radical alteration in our societies will bring political changes and more than a few more resource wars.
The implications of oil's decline are not nearly as benign as you and Nick and many others seem to believe. It's terribly naive to believe that everything will continue as before with just fewer kids being driven to schools by their parents. In fact, the very foundation of whether we need to educate kids in the way we are now comes into question.
Why send more than a few children to college at such great expense? Whatever for? So that they can be trained for jobs that no longer exist and for which there are 20 to 30 other people already in line? So that they can ogle these fancy cars from car companies that have gone bankrupt?
We've already seen what happens with even just a bit of contraction in 2008/2009.
Stop looking simply at the technology you are so enamored with. Look at what happens to the financial system, laden with debt as it is, food production and other macro systems.
Why don't you just read the Bundeswehr's report??
The Bundeswehr's report isn't original research - it's just a digest of other people's warnings - many from sources like TOD.
We're going around in circles because when it's pointed out that there are technical solutions to PO the reply is based on social/financial factors, and the social/financial argument is based on an implicit lack of technical solutions!
Again,
1) you haven't shown that PO will cause another credit crunch.
2) historical credit crunches haven't stopped capital investment. The 2008 crunch didn't; the 1930's Great Depression didn't; the 1870's Long Depression didn't.
It's a very basic error, but you make it repeatedly.
I'm sorry to see you make the mistake of attacking the person, and not the argument.
Here we go again...
Not really - this Original Post is much improved - it uses the language of risk, and acknowledges things like EVs. It just needs some tightening up on the economic analysis side.
90% of vehicles are purchased on credit.
Well, about 90% of private, non-lease deals involve credit. Of course, that doesn't mean they are dependent on credit. My last two car purchases were partially financed because the rate was subsidized, and I couldn't pass up 3% credit - I could use the money better somewhere else.
about 20% of vehicles are fleet purchases by government, rental car companies and big companies. About another 20% are leased, mostly by smaller businesses.
Credit tightening always accompanies economic contractions so very few EVs will be sold.
That's unrealistic.
1) you haven't shown that PO will cause another credit crunch.
2) historical credit crunches haven't stopped capital investment. The 2008 crunch didn't; the 1930's Great Depression didn't; the 1870's Long Depression didn't.