| New IMF Working Paper Models Impact of Oil Limits on the Economy | The Oil Drum | Norwegian Actual and Forecast Natural Gas Production towards 2020 |
Updating World Deepwater Oil & Gas Discovery
Posted by Luis de Sousa on May 21, 2012 - 11:55am
This a guest post by Jean Laherrère, a long-time guest contributor to TheOilDrum.
|
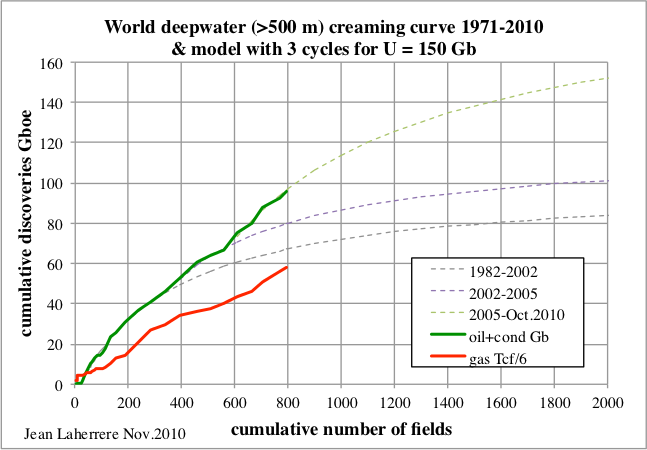
Defining deepwater oil as the offshore resource found in water depths over 500 m, the data available as of October of 2010 was pointing to an ultimate around 150 Gb. This is the result of an extrapolation made last year:
| Figure 1: world deepwater (>500 m) creaming curve 1971-Oct 2010 |
|
The previous ultimate estimate in 2008 was 100 Gb, missing the third cycle in subsalt plays.
| Figure 2: world deepwater (>500 m) creaming curve 1971-2007 |

|
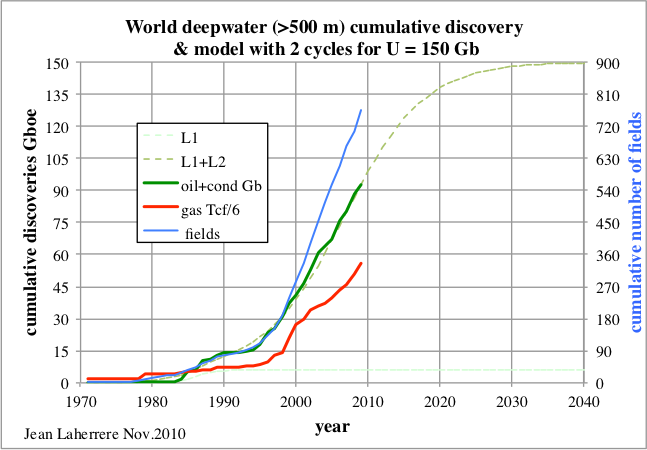
The cumulative discovery versus time with the data up to October of 2010 implied that most discoveries would be made before 2025.
| Figure 3: world deepwater (>500 m) cumulative discovery versus time 1971-2009 |
|
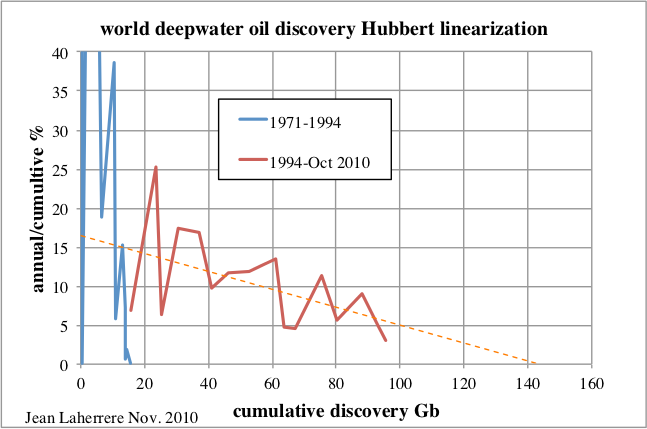
Applying the Hubbert linearisation method to oil discovery confirmed an ulitmate of about 150 Gb.
| Figure 4: world deepwater (>500 m) oil discovery Hubbert linearisation |
|
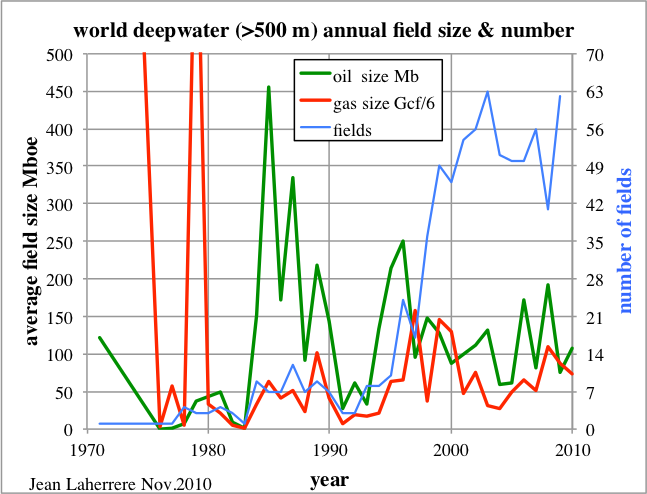
The average oil field size has been around 100 Mb the last 20 years and a little less for gas in Mboe. At the same time there is a sharp change in the number of fields since 1995: it was less than 10 before that date and has been over 50 since!
| Figure 5: world deepwater (>500 m) annual oil & gas size |
|
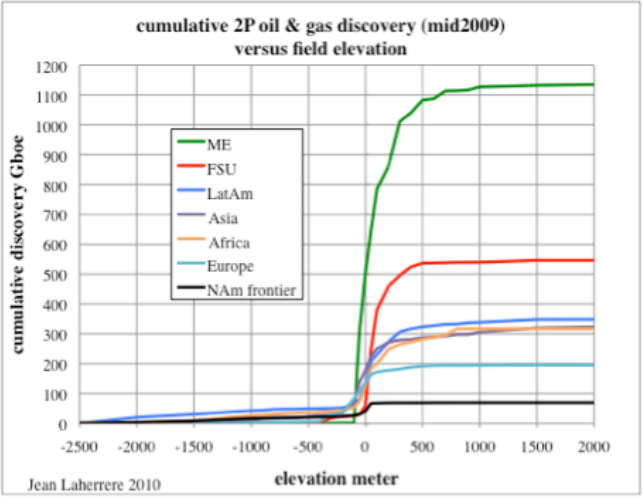
The plot of cumulative discovery versus field elevation shows that the break for water depth is more about 200 m rather than 500 m.
| Figure 6: cumulative 2P discovery versus field elevation per continent (mid 2009) |
|
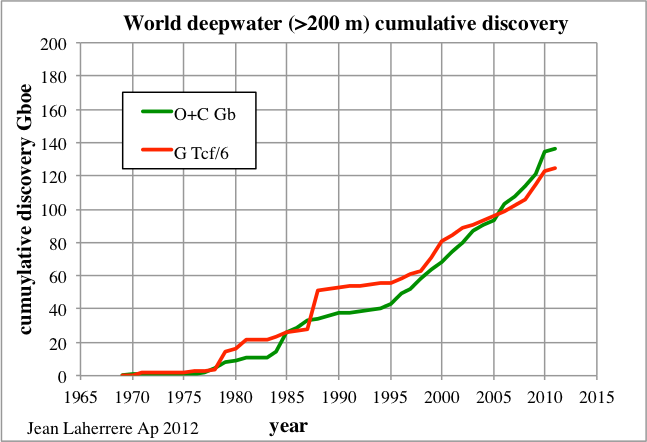
An update of this forecast was made with the data available up to October of 2011, this time with deepwater defined as the resource lying under 200 m of water or more.
The IHS claims that deepwater is for depths over 400 m, but the database indicates that in the terrain deepwater is for over 200 m deep. In the US Gulf of Mexico the deepwater royalty relief act of 1995 refers to depths over 200 m (656 ft), but the MMS (now BOEMRE) reports depths from 1000 ft onwards. There is little consensus on the definition of deepwater, just as for ultra deep.
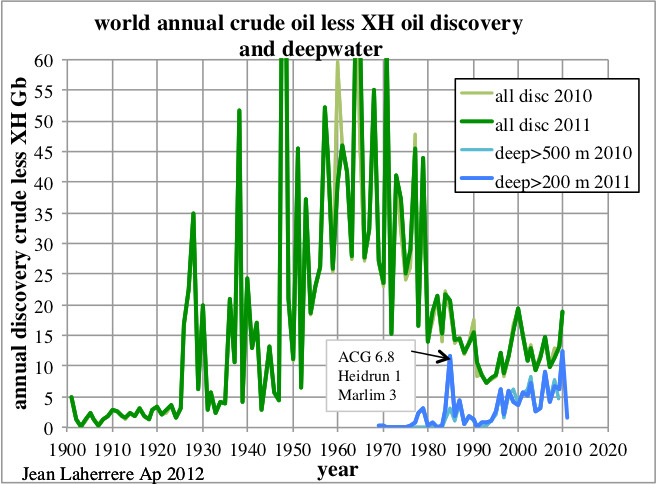
The annual crude less extra heavy oil discovery is shown here since 1900, with both definitions of deepwater (>200 m and >500 m).
| Figure 7: world annual crude less extra-heavy oil discovery and deepwater (>200 & 500 m) |
|
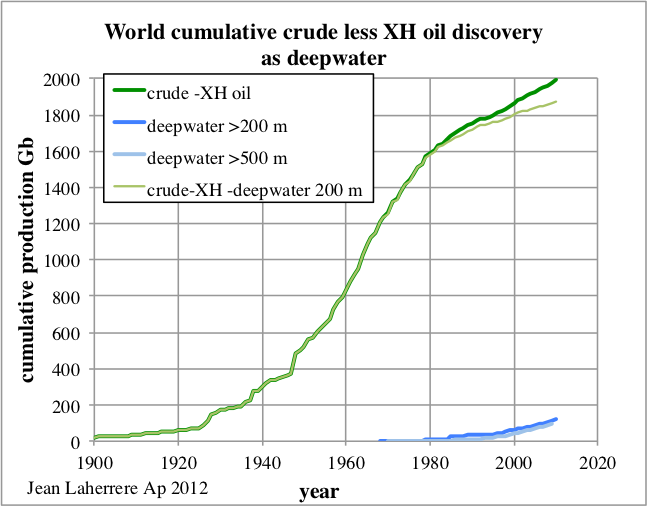
The same data, now plotted as cumulative discovery.
| Figure 8: world cumulative crude less extra-heavy oil discovery and deepwater |
|
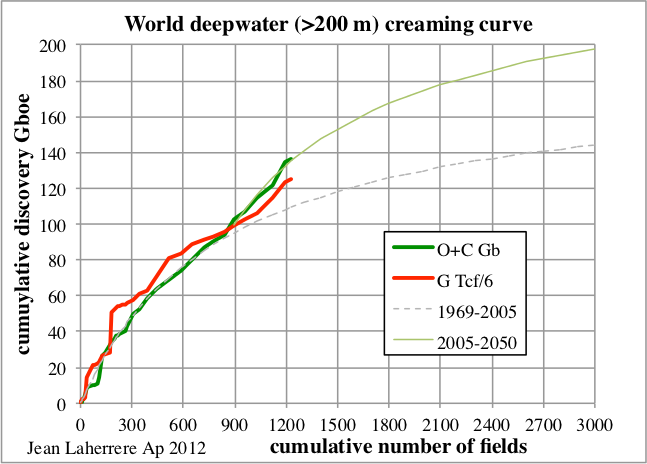
The creaming curve for world deepwater oil, this time defined as over 200 m deep, is here extrapolated with two cycles towards 200 Gb, meaning about 50 Gb for the water column interval 200-500 m. There is enough uncertainty to allow a third cycle, with a possible increase in the ultimate, but another new subsalt play is needed!
| Figure 9: world deepwater (>200 m) creaming curve 1969-Oct 2011 |
|
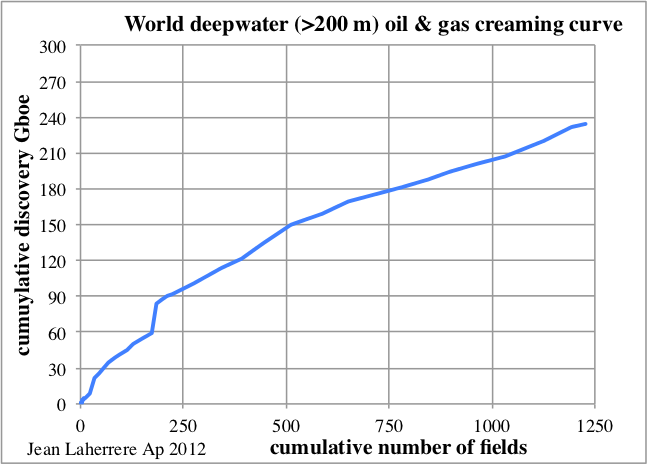
Combining oil and gas yields a simpler creaming curve, except for the last 200 fields.
| Figure 10: world deepwater (>200 m) oil plus gas creaming curve 1969-Oct 2011 |
|
The cumulative discovery versus time plot displays a sharp increase in the last 15 years, cause by the subsalt plays.
| Figure 11: world deepwater (>200 m) cumulative discovery |
|
|
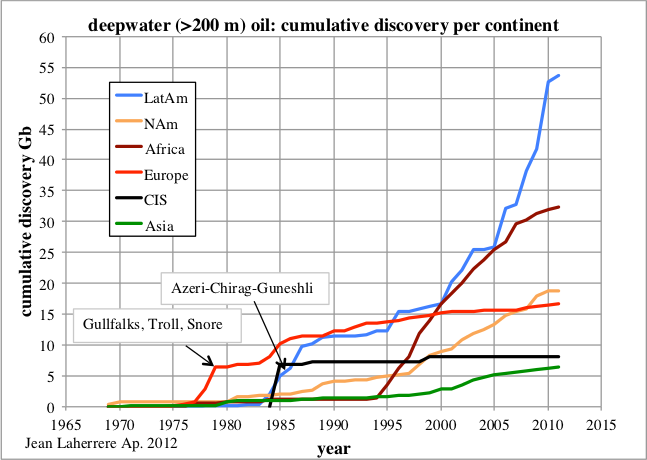
The plot for oil discovery per continent shows that Latin America has the sharpest increase, due to Brasil. In the past there were jumps in the North Sea with Gullfalks, Troll and Snore in 1978, and in the Caspian with Azeri-Chirag-Guneshli in 1985.
| Figure 12: world deepwater (>200 m) cumulative oil discovery per continent |
|
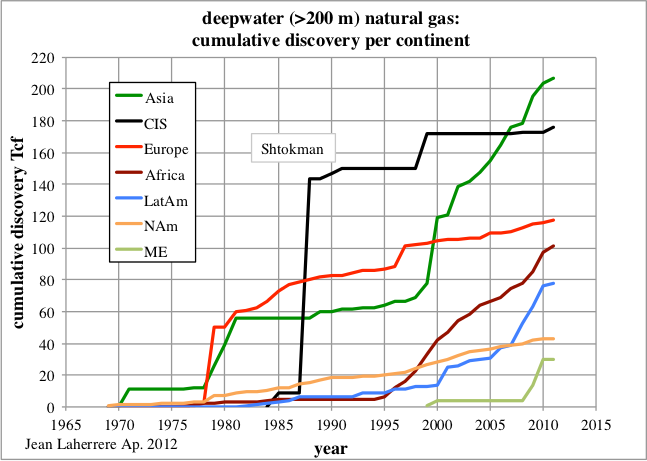
The plot for gas discoveries per continent shows the large jump in 1988 with Shtokman, and the recent increase in Asia since 2000.
| Figure 13: world deepwater (>200 m) cumulative natural gas discovery per continent |
|
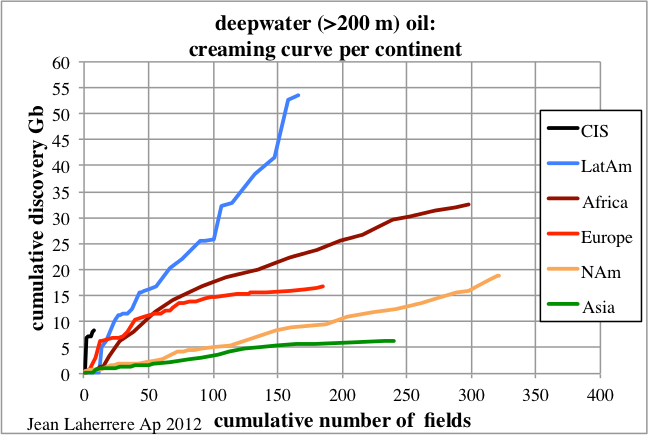
The creaming curve for oil per continent shows that Brasil with the subsalt discoveries has the largest increase and that North America still has some potential, though the average size here is quite less than in Brasil.
| Figure 14: world deepwater (>200 m) oil creaming curve per continent 1969-Oct 2011 |
|
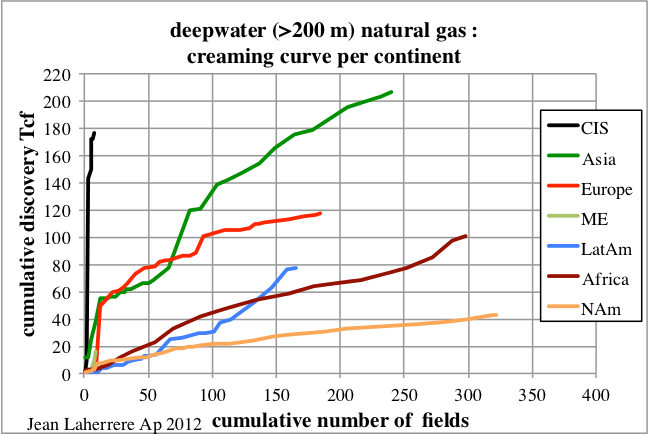
The creaming curve for gas shows that the best result is for the CIS (Former Soviet Union) with the Barentz and Caspian 9 discoveries. In second comes Asia and the least efficient is North America. The Middle East with 20 Tcf, mainly from Israel, is at a good start.
| Figure 15: world deepwater (>200 m) gas creaming curve per continent 1969-Oct 2011 |
|
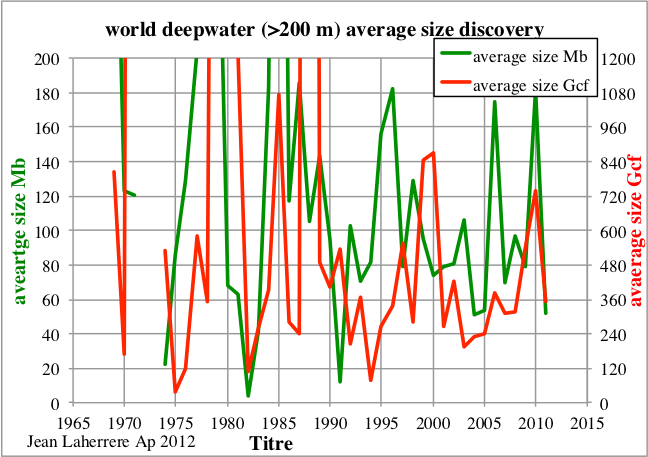
The average field size is about 100 Mb for oil and 400 Gcf for gas.
| Figure 16: world deepwater (>200 m) oil & gas average field size |
|
Conclusion
Subsalt discoveries are now well taken into account in the deepwater oil ultimate and have increased it by around 50 Gb since 2008. It is a significant increase, but very small compared to the uncertainty of past world oil discovery, with the 300 Gb of speculative resources (confirmed by Sadad Al-Huseini) in OPEC reserves and with the 150 Gb correction from ABC1 reserves (used in scout databases) to 2P reserves. For more than ten years I corrected the ABC1 reserves data for the FSU by 30% to reduce them to 2P. This is based on the comparison of ABC1 field data with ultimates obtained from oil decline profiles in some Russian fields. Now Gazprom publishes in their annual report both the ABC1 and 2P reserves, the latter from audits, showing that this 30% correction is correct for oil and gas (ratio 2P/ABC1 = 70 %); nevertheless this figure seems higher for condensate.
| Figure 17: Gazprom reserves ratio 2P/ABC1 2003-2010 from annual reports |

|
Furthermore, I have some doubt on the reliability of some deepwater oil reserves figures. My paper entitled “Deepwater GOM reserves versus production” (part I, part II and part III) shows that the oil estimate of deepwater fields reserves seem optimistic for the Gulf of Mexico, and in particular, Thunder Horse.
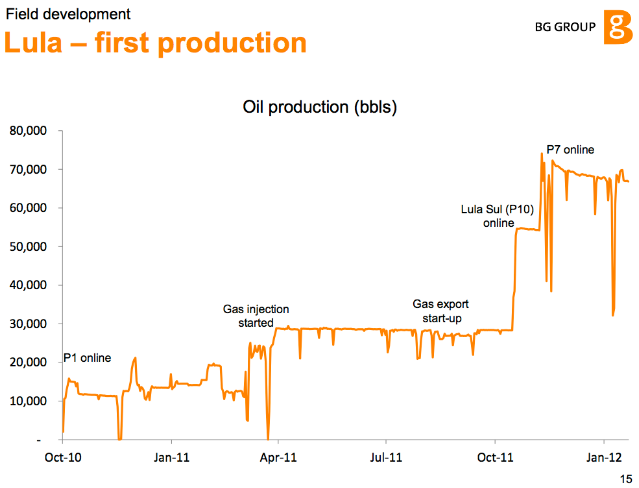
The Brasilian subsalt reservoirs are complex and there is little historical production, with only a pilot project online since October of 2010 in Tupi, now called Lula (with 14 wells already drilled) with 6 Gb of 2P reserves. The BG Group, which holds a 25% stake at Lula, has reported on the first production test with a FPSO, three producing wells and one gas injector. While it was expected to reach maximum production at 100 000 b/d, it actually peaked at 70 000 b/d in December of 2011, and has registered a decline of 5 000 b/d in the following two months.
| Figure 18: Lula first production: Oct 2010-Jan 2012 from BP Group |
|
In its 2012 annual report, the BG Group forecasts gross production capacity in this play to reach 2.3 Mboe/d in 2017, with a total of 13 FPSO in the Lula, Cernambi (formerly Iracema) and Guara fields.
Deepwater oil production will help reduce the decline in world oil production from aging fields. The IEA claims that four Saudi Arabias need to be discovered by 2030 to replace the present decline in production (about 5 %/a). The deepwater ultimate is likely to represent less than half of Saudi Arabia’s oil ultimate. It is not enough!
Contact
- Content: editors at theoildrum dot com
- Tech support: support at theoildrum dot com
License

This work is licensed under a Creative Commons Attribution-Share Alike 3.0 United States License.
[edit] - Great summary! Mucho thanks. FYI there's a physical reason why some use the 200m depth as delineation especially in the Gulf of Mexico. The approximate 600' water depth was the practical limit for a fixed production platform anchored to the sea floor. About 17 years ago I was drilling off one of the deepest GOM fixed platforms....formerly Zapata Oil's East Breaks platform. There was a financial limitation but not just from putting these structures in place. The costs to remove such production platforms once they had depleted was huge. Initially the cost to remove the Zapata platform was $23 million. There was only one lift vessel capable of taking the jacket out of the water and it was in the North Sea. It would have cost $5 million just to move that vessel to the GOM. Fortunately the feds changed the rules: we could cut the top 100' off and dump it into the Gulf leaving the rest of the jacket in place. That was preferred by the environmentalists because the jacket legs had become a thriving coral colony. And it allowed us to buy the remaining marginal reserves since the abandonment cost was reduced from $23 million to $5 million.
Also, in the GOM, the 600' water depth approximated the change from the continental shelf to the slope region. Setting a fixed legged platform on the unstable slope was very risky as a number of operators learned when subsea landslides took out their wells.
Going into greater water depths required the development of deep water drilling and subsea production (on the sea floor) technology. In fact, as this tech was developed operators began using it in the shallower waters in the GOM: cheaper and, equally important, faster infrastructure development. Even old fixed platforms like Zapata's had some usefulness left: often DW pipelines are tied into these platforms to take advantage of existing connections to the shore.
Annoying that Mr. Laherrere presents many of his figures with truncated data, where it goes off the graph on the y-axis (such as Figures 5,6, 8 and 16). I think that this makes it unusable by anyone else. He seems to have all the right connections to get at the underlying data but that doesn't really help other analysts interpret the data.
As a helpful fix to this problem may want to consider a semi-log axis, as this gives good resolution at smaller values while allowing someone to read what the peak values are.
I appreciate this summary by Jean Laherrère, the comment by ROCKMAN, and agree in part with WebHubbleTelescope concerning the vagueness fig.s 5-8. I would like to have seen the original graph representations with the full data as well. Statistical analysis is definitely more involved than this article may have presented, but this summary appears to be news info intended for the general reader. I would think that the real analysis would have a price tag associated with it. After all, there is time in acquiring the knowledge required in being able to present it to an intended audience. To really understand it correctly as stated at the time, or be able to read between the lines (as it were), the reader would be require to have some degree of knowledge about statistics beyond the general reader, otherwise it could be very misleading. There are several such stats available seen herein that are good.
This is the answer to WHT from Jean:
Hi Luis,
Web has a technique that tries to predict the shape of the production curve by using the shape of the discovery curve. What sounds like a complaint is really a request that he wished Jean would share the complete discovery data so he could attempt his technique of predicting production. He is not complaining that Jean has poor data.
Dr. David Gargett also used the shape of the discovery curve from Jean's data to predict production in this quite amazing report from the Australian Government:
http://www.energybulletin.net/stories/2012-01-20/transport-energy-future...
All friends here.
-Jon
Jon
Yes indeed.
Your link is to a very valuable report summary.
I think from a quick scan that we see the predictions playing before our eyes four years later.
I see Colin Campbell and Jean Laherrere are given prominent acknowledgement for their published data.
best
Phil H
I was quick in the trigger and yes the cumulative data does have all the necessary information.
Have to stay on your toes to figure out how to pull in the data.
Web, I advise you to contact Jean directly to ask him about data or other issues you may have. It would also be nice if you use your real name when doing so. E-mail me if you need Jean's contact.
I.m curious. What percentage of TOD readers can define creaming curve without help from google?
" I.m curious. What percentage of TOD readers can define creaming curve without help from google? "
Ha! I liked that too! I was waiting for the plain english version at the end, ...waiting...waiting...like dang! I got the part about the 4 SA's but the meaning of many of the charts eludes me.
The meaning of a creaming curve is obvious by looking at the labels of the axes. If the largest wells are the easiest to discover, then they are discovered first and the curve should become more horizontal as the discoveries near their limit. But, yes, I would have no idea what creaming curve means by itself. Maybe a pie fight using banana cream pies?
I'd guess the analogy would be to let some fresh whole milk 'settle' and periodically measure the thickness of the cream at the top (Not sure this works nowadays with homogenized milk). The thickness change would depend on the settling velocity of fat droplets of a given size vs. the total volume of fat in those droplets.
So.. if 'Number of fat droplets' = 'Number of fields' and 'Rises to the top quickly' = 'Large early discovery', you expect to see the same sort of curve. c.f. 'Creaming Curve'. Both have an asymptote at the total amount of oil/fat in the system.
From: http://www.mhnederlof.nl/creaming.html
The term "creaming" (short for "creaming off") was coined in Shell Intnl. in the seventies when the work of Arps and Roberts (1958) and Drew (1974) became known. The idea is that the exploration process in a basin "creams off" the best prospects first, gradually having to consider more risky prospects. One could imagine that the large anticlines are so conspicuous that they are easier to find than the smaller more subtle closures. After that, fault traps against one fault and eventually more risky traps bounded by several faults would be drilled. In reality the process will be less organized, but in many basins the general trend is obvious.
Rockman,
Would it be more correct to say that the best prospects are "developed" first rather than "discovered" first? Especially in the old days when technology was less developed (and the really big fields were being discovered) I would think that the discovery process was more of a crapshoot and in many cases smaller discoveries were not explored or developed further in order to focus on finding the larger fields (which probably were more profitable.) Note that I am not a geologist, but I wonder how obvious these large anticlines were in the mid 20th century say from 1940-1960. I realize you were not in the industry that long ago, but may have heard some history from older geologists when you were new to the industry (mid 80s?).
DC
DC – I like that…I’ll go with developed too. It’s a process more than an event. Yes I wasn’t around in the old days and tech has changed. But it never was all that easy. Today’s tech would make it a snap to find those big fields. But what was the big tech in those early days? One was the torsion beam balance. Salt domes in the Gulf Coast were a major target in the beginning. The domes that caused surface expressions were easy enough but most didn’t reach that shallow. The TBB was used to detect changes in the gravity field: thick salt differs from thick sediments. But even when you knew a dome was present where do you drill? Oil/NG is often not equally distributed around the dome. And the how deep do you drill? Some domes produce a great deal at 1,500’ and others at 12,000’. And potential target depths don’t usual align vertically.
It’s easy now to look at all the fields along the Texas/LA coast. But imagine it’s 1945 and you don’t see many fields. Now talk someone into spending a big chunk of thier capex on your “idea”. I’ve made this point before and I’m sure many still don’t buy it: it has never been as easy to find oil/NG accumulations as it is now. About 30 years ago I was drilling 12,000’ wells to test 2,000 acre potential traps. Now I’m drilling 16,000’+ wells to test 100 acre potential traps. And due to the need to set intermediate casing to drill this deep that 16,000’ wildcat may cost 3 to 4 times as much as the shallower well. But with 3d seismic (a very expensive tech) you can be successful 50% of the time or better. Even old 2d seismic can make a huge difference. In the mid 80’s I hit 23 out of 25 shallow NG wildcats using 3d seis. The historic success in this trend was less than 20% by some very old and very skilled geologists. But geologists who didn’t use that seismic because they weren’t familiar with interpretation techniques I learned working offshore in the GOM.
Much easier to see the prospects now…yes! THE problem is that there aren’t many conventional prospects left to find in the US. The domestic public oils haven’t gone wacko over the resource plays like the Eagle Ford and Marcellus because they are so profitable. They’re chasing them because there aren’t enough conventional wildcats left to drill. IMHO if there were only just the conventional prospects left to drill probably 2/3’s of the pubcos would disappear. Chesapeake et al couldn’t spend most of their budgets if it weren’t for the shale plays. They went nuts chasing the dry gas shale pays when NG prices were high. When NG prices collapsed they went after the oily shale plays. They’ve known about the oily shale plays for more than 30 years. I drilled and frac’d my first Eagle Ford well over 20 years ago…not much of a well. They had no choice but to go after these other trends...there wasn't enough left of anything else to chase.
Development adds something new to make an existing situation better. Extracting a non-renewable resource is not development, it is about depleting the resource.
I prefer my explanation.. even if it's wrong :-)
fluffy - I like it also. Especially when you carry to where we are today: scrapping the bottom of the glass for the last few drops. LOL.
The percentage that read TheOilDrum.
Excellent discussion and explanation but I remain uncertain about the formal definition?? See
http://mobjectivist.blogspot.com/2008/03/creaming-curves-and-dispersive....
http://www.jargondatabase.com/Category/Occupation-and-Profession/Oil-and...
or google Laherrere creaming curve
RW (not an oil man)
robert - I'm not sure what you define as a formal definition. But this link claims these folks
(http://www.mhnederlof.nl/creaming.html) coined the term. I figure if they were the first to use it then that's the formal definition. Others may have defined it differently later to suit their purposes but this is the earliest use I've discovered.
Lula. How expensive is this oil? 2.3 Mboe/d This would mean a doubling of oil production in Brazil in just 5 years. How much oil/gas/condensate?
This oil does not really "help" us. It allows governments to deny peak oil and continue business as usual (more freeways, airports etc.). We would need that oil later, when people appreciate how precious oil is, for more important uses like in agriculture and food production.
I've clicked on tech support which I'd think should be a link.
It isn't.
How do I get to them?
Or can someone tell me how to expand the column containing the Deepwater Oil data graphs so that the rightmost part of them are not hidden by the rightmost column which at top is a quote? Column is 1/3 screen wide.
A leftmost column title Advanced Search also takes up 1/3 of my screen leaving only 1/3 for articles.
Thanks, gk.
Hmm. I see displaying pdf gets most of my screen.
Still, any answers would be appreciated ... gk.