| Is It Really Possible to Decouple GDP Growth from Energy Growth? | The Oil Drum | The Energy Return on Investment Threshold |
Deepwater GOM: Reserves versus Production - Part 3: Older Fields and Conclusion
Posted by Luis de Sousa on November 23, 2011 - 10:30am
This is the third and final post on this series on the Gulf of Mexico (GOM) by Jean Laherrère, a long-time guest contributor to TheOilDrum. The goal of this series is to compare the evolution of reserves estimates in the GOM with the actual production figures that show the oil decline, thereby investigating the reliability of reserve estimates. In this third installment, Jean looks into older and shallower fields as a term of comparison to synthesize his finds and assesses the impact on his world all liquids forecast. The first installment analysed data on Thunder Horse & Mars-Ursa and the second Atlantis, Mad Dog & Eugene Island.
|
Update: Prompted by the comments, Jean sent an additional graph with cumulative Deepwater discovery and production, to be found at the of this post.
Ram-Powell (VK956)
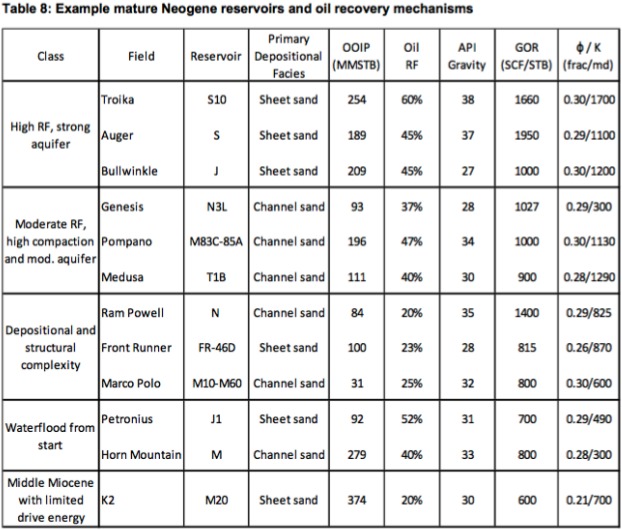
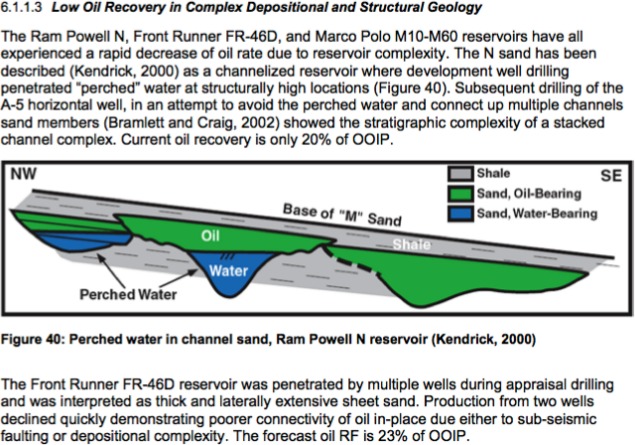
In the 2010 report by J. Lach, referenced in part 2, the Ram-Powell field is presented as a complex structure with a low recovery factor, 20%.
Figure 60: Examples of Neogene reservoirs by Lach. |
|
He described the N sand with the term “perched water”!
Figure 61: Ram-Powell N sand described as “perched water”. |
|
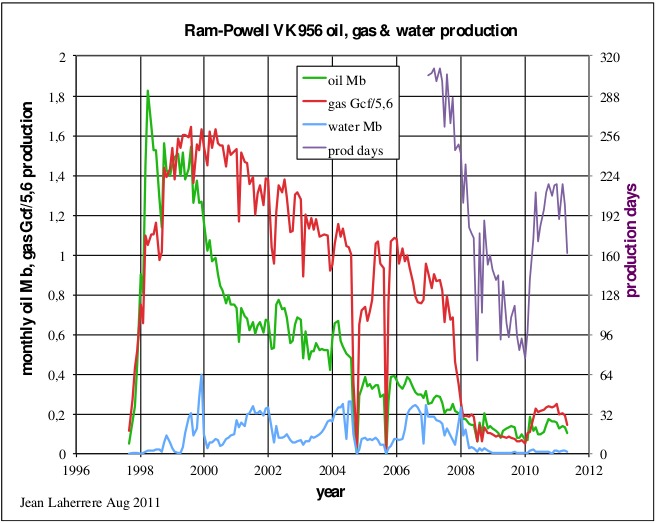
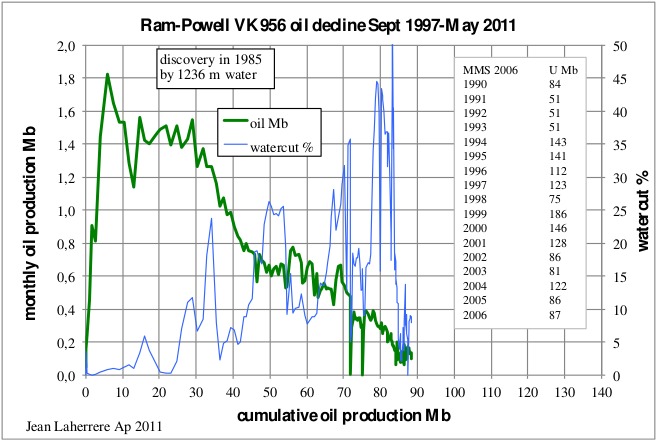
The monthly production displays a peak in 1999 followed by a sharp decline and since 2001, a less steeper and constant decline.
Figure 62: Ram-Powell monthly production. |
|
From the oil decline extrapolation the ultimate is likely to be about 100 Mb. Meanwhile, the estimates by the MMS have varied chaotically between 1990 and 2006, from 51 to 186 Mb, the latest one being 87 Mb (too small); Lach (2010) reports 132 Mb.
Watercut has increased up to over 40% but dropped in recent months.
Figure 63: Ram-Powell oil decline. |
|
Troika GC244
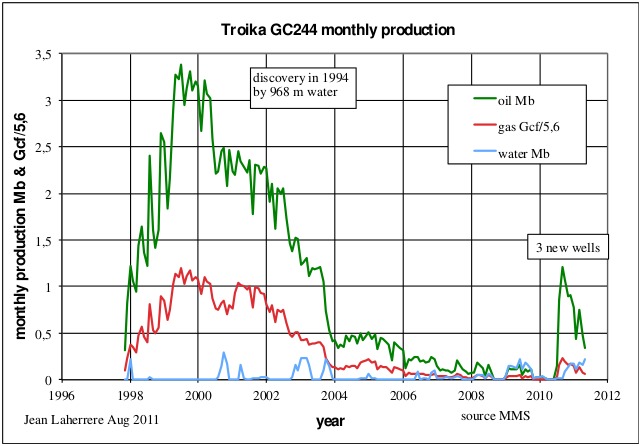
Lach (2010) presents Troika (in figure 58) as a strong aquifer with a high recovery factor (60%), contrary to Ram-Powell. The field's monthly oil production shows several downward steps, after peaking at 3.2 Mb in 1999. The first step down to 2.3 Mb took place in 2001, a second step down to 0.4 Mb happened in 2004, and a third step to 0.2 Mb in 2006. With the addition of 3 new wells in 2010, production rose to a new lower peak.
Figure 64: Troika monthly production. |
|
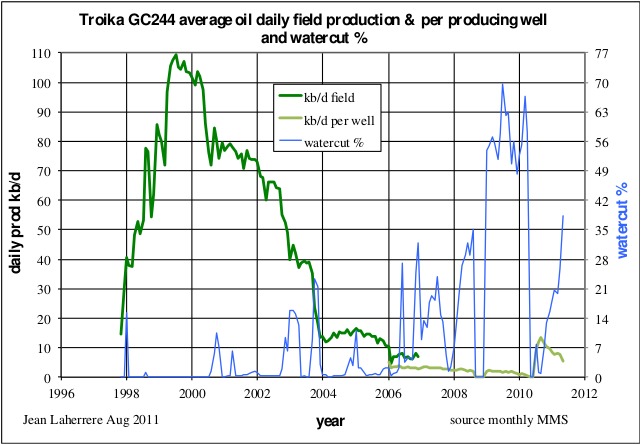
Troika's average daily production peaked in 1999 at over 100,000 b/d; the watercut start rising after that as the field depleted and eventually went over 60%, before old wells were abandoned.
Figure 65: Troika: average daily oil production, average daily production per well and watercut. |
|
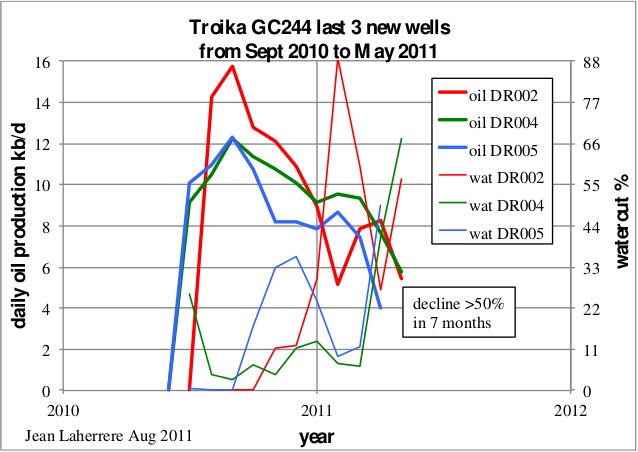
The oil production of the last three wells shows a decline of 50% in 7 months. It is obvious this is the last burst!
Figure 66: Troika, last 3 wells from September of 2010 to May of 2011. |
|
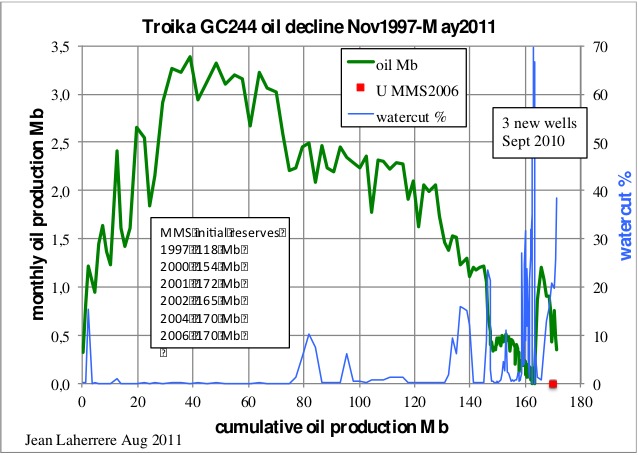
The oil decline at Troika is close to total depletion, with a cumulative production of 170 Mb. The estimate by MMS in 2006 was close to this value, but Lach’s ultimate was 164 Mb (a little short).
Figure 67: Troika oil decline and watercut. |
|
Macaroni GB602
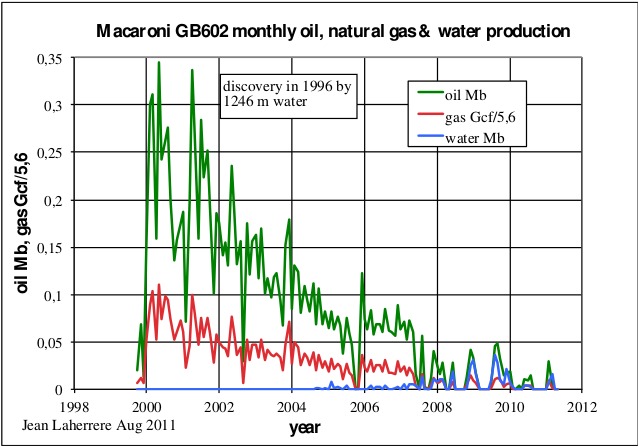
Macaroni was one of the first deepwater fields discovered by Shell, in 1996, under 1246 m of water in Pliocene sands. Oil production peaked quickly and declined sharply; since 2007 production has been sporadic and with high watercut.
Figure 68: Macaroni GB602 monthly production. |
|
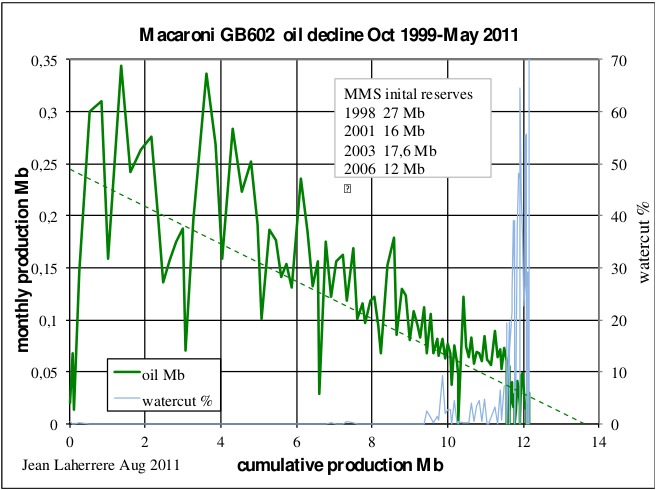
The end is near, with an ultimate of less than 13 Mb, compared to the estimate of 27 Mb in 1998 by the MMS.
Figure 69: Macaroni GB602 oil decline. |
|
Bay Marchand 002 (BM002)
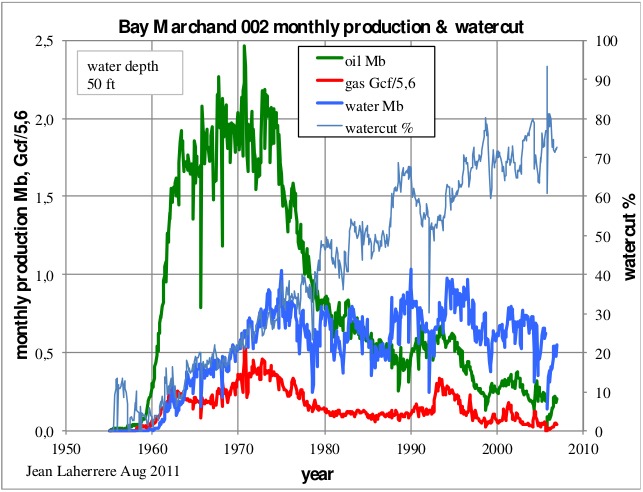
Bay Marchand 002 was found in 1949 in shallow waters; in 1970 the OGJ estimated reserves to be near 800 Mb, but today that outlook is down to 530 Mb. The production plateau was fairly long (10 years) and the decline fairly smooth and long, with a regular watercut increase, now close to 80%.
Figure 70: Bay Marchand 002 monthly production. |
|
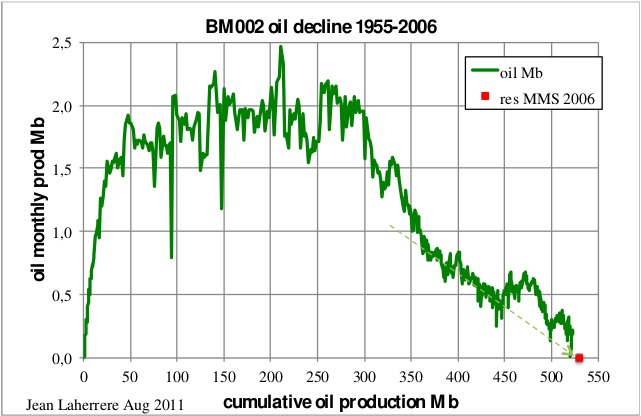
The oil decline since 1980 trends towards 530 Mb, which coincides the 2006 reserves estimate by the MMS.
Figure 71: Bay Marchand 002 oil decline. |
|
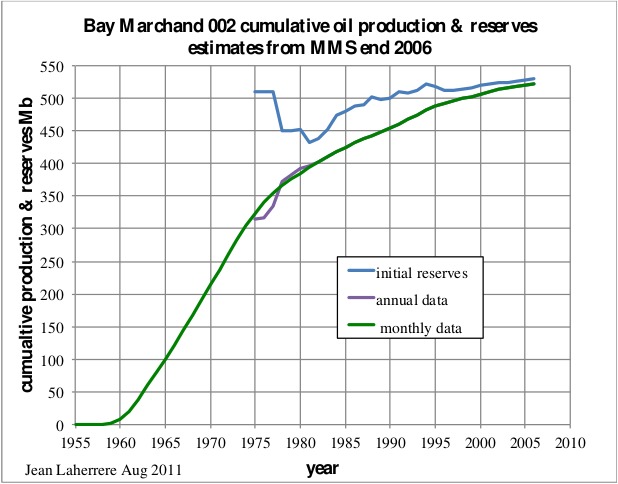
Cumulative oil production is plotted next, from the MMS 2006 annual and monthly data. The initial MMS estimate was 510 Mb in 1975, it then declined to 430 Mb in 1982 and is now at 530 Mb, very close to cumulative production in 2011. The field seems to be close to total depletion.
Figure 72: Bay Marchand 002 cumulative oil production and 2006 reserve estimate by the MMS. |
|
It is obvious that the annual data from 1975 to 1981 is wrong compared to the more harmonious monthly data.
West Delta 030 (WD030)
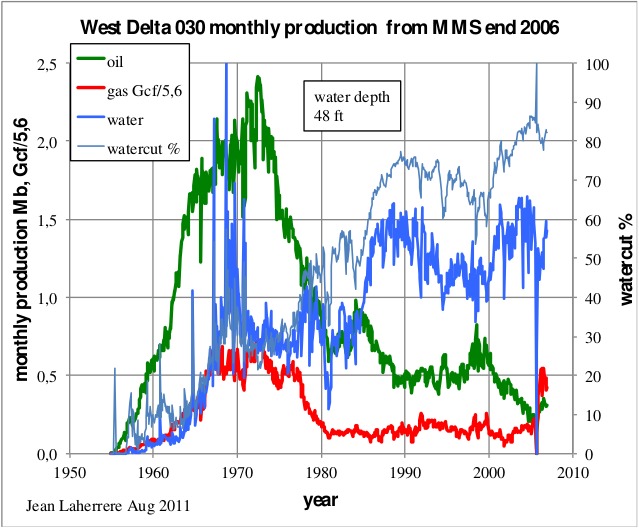
West Delta is a shallow water oil field found in 1949. It is similar to BM002, yielding the same type of decline profile, in spite of two minor increases when new drilling temporarily suspended the overall trend.
Figure 73: West Delta 030 monthly production. |
|
Like BM002, WD030 is close to the end of its life with an ultimate at 570 Mb.
Figure 74: West Delta 030 oil decline. |

|
South Pass 027 (SP027)
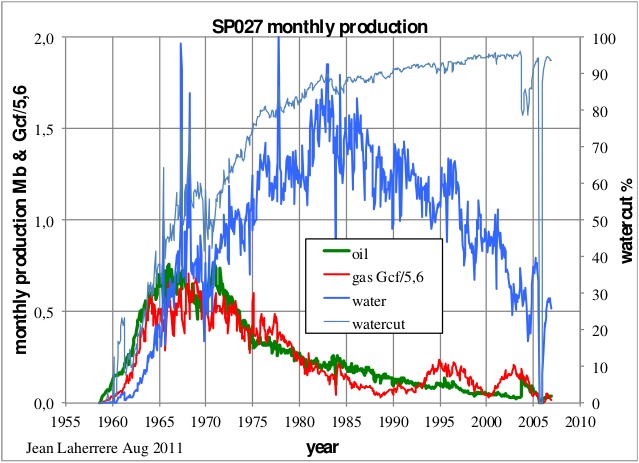
South Pass 027 was found in 1954, also in shallow water (64 ft deep), with reserves around 152 Mb. It yielded a bumpy plateau for less than decade and a half, during which watercut rose rapidly; afterwards a long and smooth decline ensued.
Figure 75: South Pass monthly production and watercut. |
|
The oil decline segment from 1975 to 2006 is in line with the small decline period between 1966 and 1970, within the plateau.
Figure 76: South Pass oil decline. |
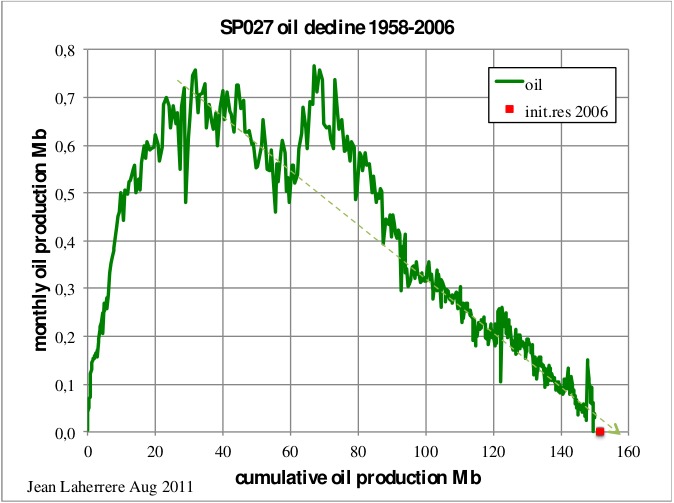
|
Looking at the 2006 data, SP027 seems close to the end, but the last barrels are still economical in 2011 with the platforms in place, after 53 years of production. On the BOEMRE 2011 OGORA report, SP027 covers 35 pages out of 1452 up to May of 2011; the data for this field totals 1031 lines, of which 851 are with zero production. During these 5 months, SP027 involved 2 operators, 7 leases and 198 wells, though only 31 of these were actually producing in May; the figures total 0.017 Mb for oil and 0.47 Mb for water, averaging 21 b/d per well in 817 days of production, with a watercut of 96%.
Auger GB426
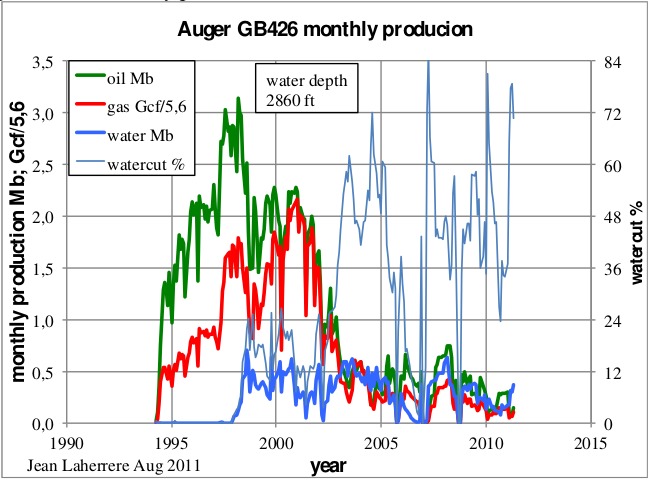
Auger was found in 1987 under 2860 ft of water; oil production peaked in 1997 with several steps taking place both during production rise as during the decline. Operated by Shell, Auger is produced through a Tension Leg Platform (TLP).
Figure 77: Auger GB426 monthly production and watercut. |
|
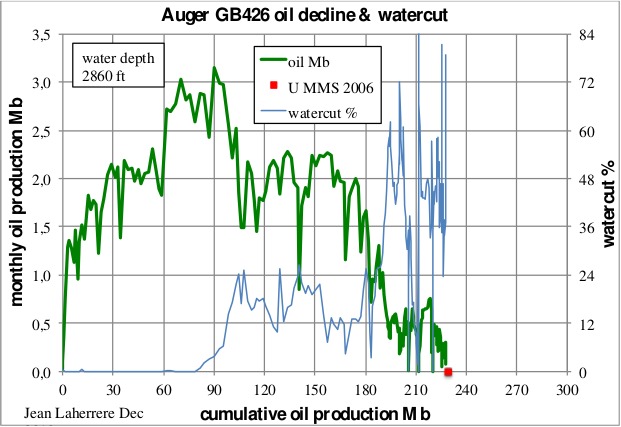
Since 2002 the decline has become rather steep, about 2% per month.
Figure 78: Auger oil decline. |
|
Present cumulative oil production is close to the 2006 reserves estimate by the MMS; with such a low monthly production, does it mean that the field is depleted? Maybe not for the TLP, which collects oil from several fields in the premises, like Llano and soon Cardamon. Shell has proposed last March to drill 3 exploratory wells on the same lease and got the approval by the BOEMRE; it is the first approval after the Macondo blow out.
Synthesis
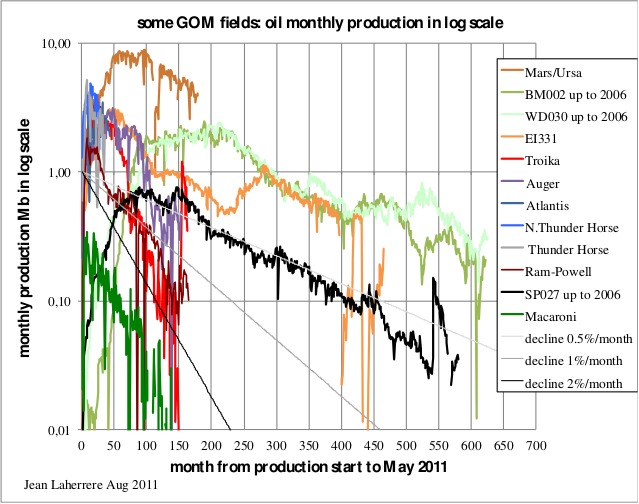
The monthly oil production of the all the fields analysed in this series is plotted from production start in the following graph. In the graph are also included lines showing a monthly decline of 0.5%, 1% and 2% for comparison (corresponding to an annual decline of 6%, 11.5% and 21.5%).
Figure 79: Monthly oil production in log scale for several GOM fields. |
|
Shallow water fields like BM002, WD030 and SP027 present a long plateau of maximum output (around 100 months), starting at least 50 months after production start; for these fields monthly decline is slower, around 0.5%. In contrast, deepwater fields peak earlier and do not describe a plateau, usually going into decline shortly after, with higher monthly decline rates, around 1%.
In 2000 I plotted the monthly oil production of several GOM fields in percentage of their ultimate, meaning that the area below the curve should be the same for each field, being equal to 100 when the field is abandoned. Here I update that graph, where the cumulative addition at the end of the curve is given in the legend.
Figure 80: Percentage of monthly production of selected GOM fields (from production start up to end 2006 or May 2011) divided by its ultimate (Mb). |

|
All these fields have produced more than 96% of their ultimate, except Mars/Ursa (MC807), presently at 61% of its ultimate. The peak of oil production occurs a few years after production start for deepwater fields and at a level below 1% of the ultimate per month; the exception is Auger (GB426). Shallow water fields typically display lower peaks, at about 0.6% (e.g. MP041, GI016) but much later, at least ten years after production start (even 20 years for GI016).
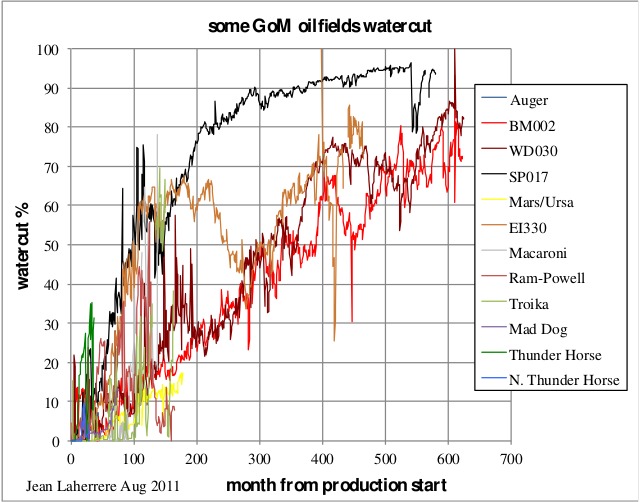
The watercut of the GOM fields is variable depending upon the characteristics of the reservoir, especially the trap. Watercut is not a problem onshore, but from this analysis it is apparent that a watercut threshold dictates the economic viability of an offshore field; this threshold seems also different from deepwater to shallow water fields.
Figure 81: Watercut for selected GOM fields. |
|
Conclusion
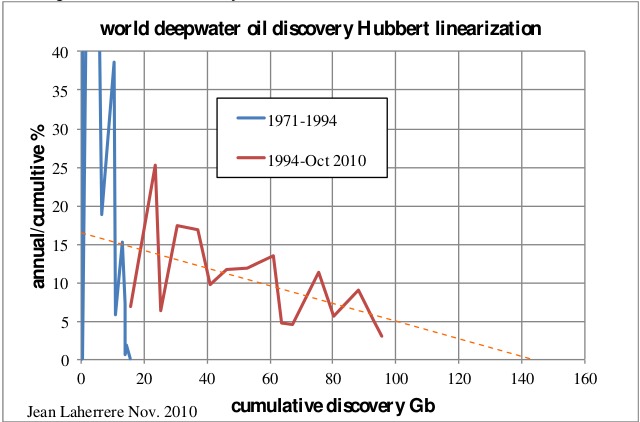
Forecasting future deepwater (over 500 m deep) oil production needs first an estimate of the ultimate, which can be done using the creaming curve of past discoveries, as shown in figure 3 (in part 1 of this series). At this moment this plot trends towards 150 Gb, but it is necessary to check if the reported discoveries are well estimated and the best place to do so is the Gulf of Mexico, where all production data are freely available, though unfortunately not in the easiest way.
Most of shallow water fields are largely depleted and the estimates published by the end of 2006 are reliable when compared to the cumulative production trend. The average decline for these fields is about 0.5% per month or 6% per annum. Deepwater fields display an earlier peak and a sharper decline, about 2% per month or 22% per annum. Because of this sharp decline, Deepwater fields require more wells to be drilled, despite most of the drilling being planned beforehand in these very expensive platforms. The estimated reserves look fair, but the lack of data on future drilling from the operators (in particular BP) prevents a reliable extrapolation from past production. But it seems that past discoveries presented in figure 3 will not change much, and so neither the extrapolation; only a new cycle of discoveries can change this outlook. The Hubbert linearization (poorly reliable) trends towards 150 Gb.
Figure 82: Hubbert linearization for world deepwater oil discovery. |
|
Colin Campbell, using the same definition of deepwater (over 500 m deep), estimated the ultimate at 100 Gb in 2010.
The following graph presents world deepwater cumulative discoveries versus time and the extrapolation with a S curve towards 150 Gb.
Figure 83: world deepwater oil discovery & model two cycles for an ultimate of 150 Gb. |

|
Forecasting the annual world deepwater oil production is difficult, first of all because past production is not easily available (with many different definitions of deepwater) and secondly, because the large subsalt fields of Brazil will likely be difficult to produce (high pressures and lack of aquifer drive) and very expensive. So far Petrobras seems to have handled the development fairly well, though having a quasi-monopoly is not good.
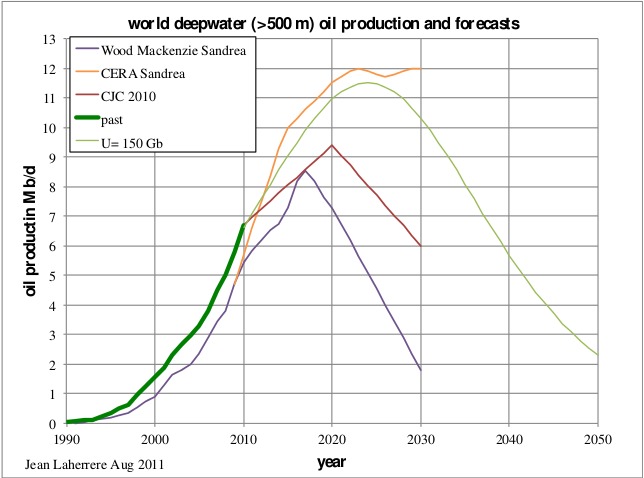
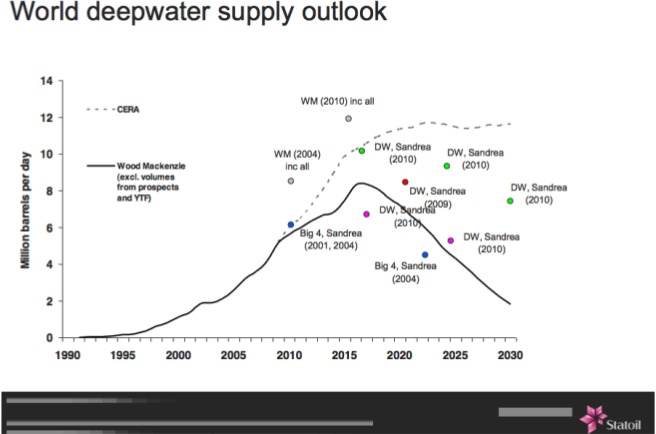
I.Sandrea, Vice-President of Statoil, in a presentation to the IEF in 2010 entitled “Potential Consequences of the Gulf Oil Spill on Future Offshore/Deepwater Oil Developments”, showed the forecasts from Wood Mackenzie (WM) and CERA for Deepwater. Taking into account only present projects, WM forecasts a peak around 2017 at over 8 Mb/d and a steep decline down to 2 Mb/d in 2030. This contrasts with the forecast by CERA, which goes up to a 12 Mb/d plateau from 2020 to 2030.
Figure 84: World deepwater oil supply outlook from I.Sandrea (EIF 2010). |
|
Assuming deepwater production at about 6.7 Mb/d in 2010 and using the ultimate of 150 Gb the model produces a peak at 11.5 Mb/d around 2024, declining to 2 Mb/d by 2050. This forecast with 150 Gb is close to the CERA forecast, higher than WM (limited to present projects) and also higher than Campbell's (U = 100 Gb).
Figure 85: World deepwater oil production and forecast for an ultimate of 150 Gb, compared with the forecasts by CERA and WM. |
|
|
This deepwater forecast is in fact already included in my forecast of crude oil excluding extra-heavy presented in Figure 1, with an ultimate of 2200 Gb. Thus my forecast for future all liquids production remains unchanged after this study.
Figure 86: World all liquids production (matching the definition of oil supply by the EIA). |

|
All liquids production has been describing a bumpy plateau since 2005 around 87 Mb/d, with a variation of 2 Mb/d (which is equal to the accuracy of the data, about the difference between EIA, IEA or OPEC values). This plateau will continue for a few years before a significant decline takes place. Nevertheless, the ongoing economical and financial crisis can disturb this bumpy plateau.
Addendum
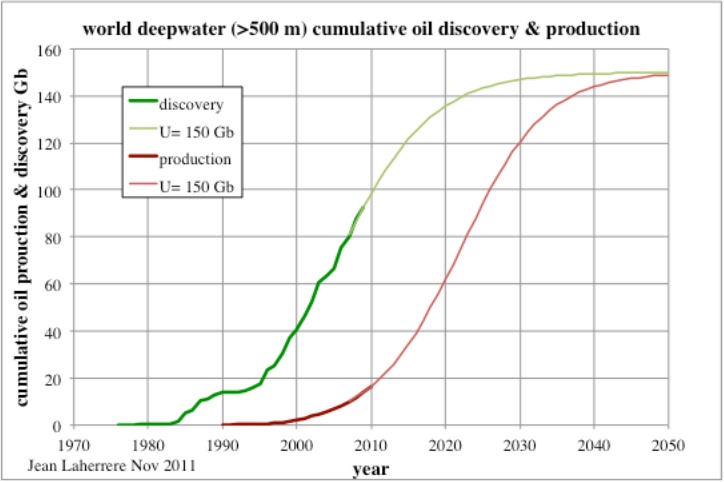
At the request of Paul Nash, Jean sent yet one more graph with the Comulative curves for the World Deepwater. As usual these graphs speak for themselves.
Figure 87: World Deepwater Comulative Discovery and Production. |
|
Deepwater GOM: Reserves versus Production - Part 3: Older Fields and Conclusion
PDF version
31 comments
Deepwater GOM: Reserves versus Production - Part 3: Older Fields and Conclusion
PDF version
31 comments
Contact
- Content: editors at theoildrum dot com
- Tech support: support at theoildrum dot com
License

This work is licensed under a Creative Commons Attribution-Share Alike 3.0 United States License.
"Nevertheless, the ongoing economical and financial crisis can disturb this bumpy plateau."
Or in other words, the ongoing economical and financial crisis is the symptom of the bumpy plateau reaching the end it has to reach anyway.
I believe it would be very helpful, in terms of getting the public to understand depletion and exhaustion, if we (meaning the peak oil community) could personalize the depletion story.
We all know, in an abstract way, that everybody gets old and dies.
But the reality of your own death does not sink into your gut until you have known many people personally who have gotten old and have died, and mostly even then not until you suffer the inevitable decline of health and productivity that comes with age.
If the story is to be gotten across to the public, it needs to be told in a way similar to the way this article tells the story.
The story is everything in communicating with the masses of people.
It needs to be told in terms of the lives of particular fields, with names, histories , birth dates, death date, cause of death, and so forth.anyone who wants to tell the story of oil should listen to a few funeral orations for emotional cues and hot buttons.
The production history needs to be included just as the story of a man or woman's career is included.
Even though I already take peak oil as seriously as the proverbial heart attack, this article excellent affected me in a way other articles have not, simply because it "personalizes" the story of a few depleting fields.
OFM,
I agree completely with you. Seeing is believing and most people don't even know that a single field goes through rise, plateau, peak and decline as it depletes. If it were easy for folks to simply browse through a large number of wells, fields, provinces and nations they would begin to see that 'peaking' is a natural part of the life of oil production.
That's what I've tried to do with the Energy Export databrowser. It would be really interesting to create something similar that worked at the oil field level and let people peruse different fields in the US. Then statements like Gingrich's recent comments about increasing US oil production could easily be showe to be fantasy.
Jon
OFM, Jonathan, yes agree with you, but not obvious that same message works the same or is needed for different persons, especially considering that the news is bad not to say beyond alarming.
Seems to me that key facts such as :
US peak : 1970
North Sea peak : 2000
Mexico peak : 2005
Are also very effective when the basic concept of finite ressource depletion has been given. And for me the historical aspects of the oil story are as much eye opening as the technical ones (also being a technical person at the start, even if in another domain, once you get the basic concept you get it).
By the way Jonathan, I use your site quite a bit for myself and in some forums or online news comments to provide links or "just go look at the basic facts directly", and it could help if it was possible to provide a direct URL for a given country (but I suppose the flash thing can make this a bit tricky to adapt ?).
Yep,
showing the historical fact that other places have peaked would seem to lead people to the obvious conclusion, but people are selfish, so they hold out hope that there are enough places yet to plunder, that they can outlast the problem. (and Daniel Yergin is there to feed their hope)
P.S. Ya, the Databrowser is cool! When you start to think this plateau will last indefinitely, you just need to go there and look at the Chinese consumption curve.
Ironically, it would seem that ultimate selfishness is about being selfless. So, if, as you suggest, there are some who may be selfish, perhaps it is those who are still disconnected from nature and from each other, much like much of the rest of their system, that attempts to influence and govern us, such as with regard to questionable perspectives on selfishness.
"Our mainstream money system is based on competition, selfishness, greed, individual gain, instead of cooperative values, altruism, good will...
The mainstream money system destroys communities. It affects everything in our lives...
In fact, if you think about it, the banks issuing money is anti-democratic..."
~ Francis Ayley, Founder & President, Fourth Corner Exchange (alternative money system)
"Species move from competition to cooperation because they discover the economic value of cooperating. It is cheaper, more efficient..."
~ Elizabet Sahtouris, evolutionary biology
"The nature to which people are able to be social, civilized, sympathetic is quite amazing and it's in contradiction to the nature of the money."
~ From the documentary, 'The Money Fix'
Yvest,
It seems perfectly LOGICAL that the "key facts" approach should work like a charm.
And so far as I can tell, it does, if the audience is both well educated and also capable of independent thinking, these two accomplishments not being one and the same.
It works fine with the TOD audience.
But speaking as a life long observer of human nature and a once upon a time teacher, I can say with complete assurance that the public is neither highly literate nor capable of independent thinking, if indeed the typical individual can be induced to think at all, outside a web of thoughts of IMMEDIATE personal interest, such as the boyfriend, grocery bill, new house , football team, stylish clothes, and his social status.
For example my lawyer , who is a very capable man, and who is heavily involved in a number of real estate investments, knows damned near everything about mortgages, court procedures, bankruptcy law, and so forth.
He has two daughters in an exclusive private university.
He is politically literate in terms of who stands where, and liberal .
But he doesn't have the faintest conception of the real nature of the banking industry, and the financial crisis we are in up to our nose, as he has been too close to the money trees all his educational and professional life to understand the forest where money comes from.
So long as the govt keeps on finding ways to create it out of thin air, he will remain happy.He is not upset with all the bankrupty cases coming thru his office, unless the client happens to be an old friend.
The fact that it is now being , in effect, printed into existence does not bother him.So far as he is concerned, the govt is never going to be broke so long as there are still unused checks in the checkbook.
He has not yet come to realize that the way the govt used to borrow money was to BORROW IT from people or industries such as unions, insurance companies, and other govts flush with cash.Now it borrows money by "selling " half of the notes to itself thru the central bank.
Now if this graduate of a fine university and a reputable law school, and a competent attorney, doesn't get "it" when presented with impersonal facts.....it's not that he CAN'T get it-he just blocks "it" out because thinking about "it" upsets his emotional apple cart.
We used to have a saying- a boil on your neck is more important that all the starving people in China.
A biol on a friend's child's neck is more important to me-I will drop what I am doing to take that child to the doctor, but I am not going to write a check to a Chines charity for ten dollars.
Monkey brains and abstractions don't mix well.Nearly all of us are under the control of our monkey brain, meaning in this case that we blissfully go along with the conventional wisdom.
"So long as the govt keeps on finding ways to create it out of thin air, he will remain happy. ..."
President Nixon, by closing the gold window at the US Treasury, committed the US to fiat money. For this act there have been many unintended consequences. Our money is printed money, all of it. I think it is undeniable that money is a necessary thing in modern society. We have no historical evidence of how things might have worked in a society without money, only speculation by individuals with wild imaginations.
We have much economic theory that supports the idea that the total supply of money in an economy must correspond in some way to the total level of economic activity. So, for a robust, functioning economy, we must have, at each moment, an amount of money appropriate to the current economy. We know where our money comes from: The Fed prints it, or the Fed causes the Treasury to print it, or whatever. We can't do without money, and the amount of gold extant in the world is utterly inadequate to support the level of economic activity of 7 billion people at the current gold price. If the price of gold were to rise to the necessary 'money backed by gold' price, there could be no use of gold metal in computers and other real products that use gold metal for its special electrical properties. So get over it. The only money that there can ever be, in the future, is printed, created money. We can discuss who has authority to print money, but not print money? That is very unreal, really.
Geek,
I agree that the money is brought into being by printing it, or by loaning it into existence through the fractional reserve system of banking.
I agree with you in most respects in reference to your comment.
My point is that when a govt cannot obtain sufficient income through the payment of taxes and the sale of publicly owned assets,it borrows from those who actually have money as the result of accumulating savings or profits in the ordinary course of business and life.
Ordinarily, the money supply is expanded only about as fast as the economy expands, if the govts and central banks do their jobs well.
Hence more money is chasing more goods, in rough balance, so prices will remain roughly stable, at least over the short term-inflation at a low rate is generally deliberately built in, at least in the US.
Once things get thoroughly screwed up, and govts cannot really and truly borrow existing money from real honest to god creditors, there are only a few possible outcomes.
Austerity policies are not generally politically palatable or doable, especially the public is once accustomed to govt largesse-including lots of govt salaries as well as various subsidies to everybody from the local garbage man and pinstriped banker to the guy in the autoworkers union to the old lady living alone on her ss check and food stamps.
So at some point, a govt in trouble runs out of credit, and resorts to printing as a last practical resort to cover any revenue shortfalls.
That EXTRA printed money starts chasing the SAME SUPPLY of goods and services that was available previous to it's being printed, and before long, prices rise to ration the goods among who ever is in possession of money.
The new money mixes with the old, and the value of the aggregate falls until it matches the overall supply of goods and services;new goods and services cannot be printed or loaned into existence, although some people seem to believe this is possible-including many economists and bankers.
Saudi Arabia is also past peak, in my opinion. It would be interesting how the world would react to Saudi Arabia publishing its true oil reserves rather than their current -- and what is in my view bogus -- reserve estimate.
Completely agree OFM.
Several years ago at the Offshore Technology Conference Matt Simmons gave a talk and he successively showed about 6 PowerPoint slides and each one had about 20 production histories on it of known fields around the world, each showing the rise and fall of a field. The effect was chilling. He didn't even have to comment on them - it was evident - fields peak.
It strikes me that Simmons showing that information at the OTC is like thinking you are going to teach grandma how to suck eggs. There is no way the average attendee at the OTC doesn't know that fact inside out. Did he show any of the fields which peaked, declined, and then new technologies revived to yet another peak in production, or did he leave those examples out so he didn't have to explain why not everything works the same way, the geologic conditions which might allow such reversals, and number of fields in the world which might have those same conditions and could duplicate that profile, or was that level of objectivity too much to present to the crowd?
I attended the OTC every year except one from 1990 to 2000 (I worked for Coflexip, now owned by Technip), and I must respectfully disagree about the average attendee at the OTC being technically literate, despite "Technology" being its middle name.
I found it to be a big sales pitch, and even when technical subjects were discussed, they always had an agenda in the way that they were presented. Everyone *did* know this, and accordingly took all info with large doses of salt (there was more than enough to go around considering most deep water formations in the GoM ;-).
OFM, you are spot on.
It is quite the sales event, isn't it? And letting Simmons do a presentation might certainly support your idea of the level of technical quality of that conference, but people in industry who don't know that fields increase production to a point, produce, and then decline (generally speaking) certainly should be in the minority. Dear Lord let us hope not. If the level of expertise has fallen that low, on a topic so critically important, there is more risk in the system than I ever have imagined.
alto - Of course it's a big sales pitch: the primary purpose of the OTC is for the service industry to sell their equipment to the operating companies. There may be a few side shows where exploration projects are shown (and also pitched) as well as field/reservoir studies. But the bottom line it is and always has been a sales convention.
And not to be disrespectful to those vendors out there (and we do call them "vendors") but a great many, especially those under 45 or so, don't know cr*p about oil/NG exploration or the basics behind PO. But why should they? Virtually none of them are charged with finding the next well to be drilled. They sell the hardware....not oil/NG. I know (and enjoy the company of) service hands as old as me (60 yo) who don't understand anything about the exploration business. But they know their equipment like the back of their hand. Look at what's going on in the Eagle Ford in Texas: $billions are being transferred from the operators to the vendors/service companies. As long as the operators keep drilling the service industry couldn't care less what the profit margin is or how much oil will eventually be produced.
What they do pay very close attention to are the economic conditions that allow those operators to keep drilling. If those parameters change significantly and there's a down turn in drilling activity they immediately feel it in the cash flow. Unlike operators that can coast along on their production, the service companies immediately go into a slump as quickly as the rig count drops. I've seen firsthand tens of thousands of hands laid off in just a few months back in '08 when NG prices collapsed. Services companies were laying off hands even before the rig count began to drop significantly. But I don't know of any other industry that has such a visible and publicly know feedback loop: every week the rig count is published. A service company revenue is directly proportion to the number of rigs running.
OFM:
I agree with reservations:
You offer an analogy.
Life cycle of an oil well <-> life cycle of a mortal person.
Its OK, but it is an analogy, and the world of policy, punditry, economics, and BAU is full of false analogies. People, I think, know in their hearts that they are being scammed when the read/hear the rhetoric of analogy because they can't see anything wrong with the line of reasoning but they know that the argument follows a pattern that has been used to scam them in the past. I think analogy has a valid place in discussion of a phenomenon that has, apparently, never happened in the past, but it must be used with care. I can't say what that care involves, but I hope to recognize it if I ever see it.
Somehow, points of correspondence must be identified and points of difference must be recognized and rejected as being not part of what one intends to claim.
At first, that analogy seems like it would get the point across, but if you think about it more, it has a serious failing. Just like people are born all the time, oil wells are drilled all the time. To carry on the analogy, you'd have to have the new people being born being weaker, smaller, and having shorter life spans for the analogy to work, and most people see just the opposite - more people, bigger, stronger, living longer than in the past.
So use that analogy for the average Joe, and they'd just say, well, drill more. We're still drilling, and finding more, and just like more people are born every year and live longer healthier lives, there's no problem with our oil supply.
We here know that the analogy doesn't work for new wells/new people, but if your analogy is for old wells/old people, they'll make the wrong connection and decide you're saying there isn't a problem.
The problem with the analysis, besides that most people's eyes would glaze over after the first few graphs, is that if you mapped those fields, they'd show up as a few blips on a map of the GOM. So people would say, "well, just drill everywhere else!" Someone would point out that Cuba just found oil, so it must be out there, they just need to drill more. Most people just aren't going to get it, no matter what story you tell.
"To carry on the analogy, you'd have to have the new people being born being weaker, smaller, and having shorter life spans for the analogy to work, and most people see just the opposite - more people, bigger, stronger, living longer than in the past."
Without support from fossil fuel, modern medicine, agriculture, and the "green revolution" will likely fail, which will indeed lead to new people being weaker, smaller, and having shorter life spans, and less people by die off, so the analogy works fine. Has there ever been a biological system or species that has grown rapidly with a nutrient or new food supply that has not collapsed to much lower numbers once that nutrient or food supply has been removed?
This is the all or nothing approach to Oil production. Because Oil is a beneficial substance, we should pump and consume it flat out ignoring the fact it is a finite resource. Finite as in "irreplaceable"; as in "once burned, gone forever."
Luis,
Thank you for a huge amount of data gathering, data presentation, evaluation and conclusions, professionally put together in one place. (Your graphs can be a bit complex, but the solution would be ... still more graphs ..)
IMHO most senior professionals, senior bureaucrats and some politicians understand the situation, but the majority of "civilians" do not want to be told about their own mortality and it is political suicide to tell them so.
We will have to wait until, not a Black Swan, but a very large Iceberg event to catch the attention of even First World consumers and electorates.
Look on the bright side, some people actually got off the Titanic.
I just had a thought while skimming the article... The sufficiently zoomed-in peak of a very high-resolution "bell-curve" graph will more or less appear as a plateau. :)
Great post Jean. i find graph 82(!) the most interesting, for how well it shows the decline.
Could you complete that picture by overlaying the cumulative offshore production to date?
Unless there is a supergiant field lurking in the Arctic (or Antarctic), it is clear that offshore oil will not come riding to the rescue - it a "bonus" IMO, and an expensive one at that.
The article clearly supports the idea of deepwater fields having earlier production peaks, with much sharper decline curves. But exactly why this is the case, seems much less clear. I would guess that with very shallow offshore fields the lower cost of drilling additional wells (infill drilling, water injection wells, exploratory perimeter wells) and the greater overall ease of applying production enhancement methods (compared to deepwater) might explain the longer, slower decline curves for such shallow offshore fields (and for most onshore fields).
At the same time, I'm somewhat puzzled by the following statement from the article:
However, with the earlier discussion of BP's Thunderhorse field in the GoM, I was struck by the relatively few wells actually drilled into a reservoir having such great expectations for large oil reserves as Thunderhorse (expectations dramatically displayed by the platform BP selected). Or, the seemingly low number of wells drilled may have just been a case of one well-placed horizontal well taking the place of multiple vertical wells.
If the explanation for deepwater production behavior is not entirely about costs and economics, then are there issues of geology that explain the significant differences now starting to be seen in the production profiles of deepwater oil fields?
J – Let me offer some clarifications. First, there’s always a time lag offshore (DW and shelf) between discovery and peak production. Typically a little longer for DW. Once the production platform/facilities are constructed the development drilling program begins. After these wells are drilled in can easily take 6 months to install the production equipment. Then the wells are turned on. But slowly. Might take 1 to 3 months before they are flowing at max rate. And it’s very common for this rate to be the max for the field. Might hold relatively flat for some years or start showing sign of depletion early on. But the great majority of the hundreds of field histories I’ve studied show that profile. About 30 years ago completion techniques improved production rates. Conversely this increased decline rates/shortened field life.
But only true for the initial wells. It wasn’t uncommon for a second development drilling program to happen late in a shelf field’s life. Improvement in seismic data and drilling technology ID’d new and deeper targets. That can give the appearance of FIELD life longer than actual RESERVOIR life. That continues today. My company is using our proprietary seismic processing to refine about 20 new leads that would be drilled from existing (though nearly depleted) field platforms on the shelf.
Due to the high cost of individual DW wells ($100-200 million) only the minimum number are drilled that optimizes (but not maximizes) recovery. Likewise high offshore operating production costs will cause earlier field abandonment than onshore. When you speak of DW fields having an earlier peak perhaps you’re referring to the collective and not individual fields.
Several factors involved here, including geologic, cost, and play maturity.
Geology:
DW developments to date include more large, highly overpressured, less faulted, high porosity reservoirs.
Costs:
These High-Rate/High Ultimate (per well) projects were targeted in early phases of DW exploration to offset high costs.
As the best stuff is creamed early, the remainder may not be economic at this time (particularly new subsea tie-backs vs. DVA wells). Mars field is getting a second TLP and this will broaden the curve significantly as well as increasing the ultimate recovery.
Phased development is used in new plays to learn about reservoir performance with reduced early investment to mitigate risks - Profit may not be optimized, but risks reduced - good projects will have additional development that will broaden the production function.
Play Maturity -- New DW plays (tighter reservoirs, heavier oil):
The new plays with higher volumes of oil-in-place, but lower rates and recoveries/well are likely to have a longer life.
Where do people get all these stats? It seems to me that the oil companies would closely guard all this information much like Saudi Arabia. I wonder if the only people who know about peak oil are the oil companies and they are not going to say until they----we are in big trouble.
Christophe de Margerie (Total CEO) had a tribune recently in "Liberation" (kind of Guardian version in French press) were he clearly talked about it (even if still optimist in terms of dates, and saying "even if doesn't please some of my colleages) Shell CEO also had a quite direct talk in Finacial Time.
Rocard recently (ex French prime minister) was also very direct about it in a radio interview (also linked to current pres election campaign and discussion around nuclear), frankly peak oil isn't that much the big secret anymore, even if a clear, precise, message from some head of state would probably be required to make it truly main stream, in fact it would also correspond to say "current crisis is peak oil crisis", probably will not happen if I had to bet, does it appear at all in the US campaign ?
Wow, went through the sites of republicans candidates, quite amazing :
Perry : nothing on energy (at least as an issues item)
Bachmann : drill baby drill, we can be independent "The government has conservatively estimated that America’s offshore reserves alone include approximately 86 billion barrels of recoverable oil and 420 trillion cubic feet of natural gas. Many of these resources are off limits due to various moratoria and restrictions, many of which President Obama previously pledged to lift.
Cain : more or less drill baby drill also,"From the oil-rich states of Louisiana and Alaska to the mighty dams along rivers across the states, the options for many forms of energy are real and plenty."
Huntsman : Drill baby drill "America is drowning in energy resources, yet every year we send $300 billion – half our trade deficit – overseas for oil. That money should be going to American energy suppliers to create American jobs."
Romney : nothing on energy
And then there is this page :
http://2012.republican-candidates.org/Energy.php
with some more drill baby drill we can be energy independent like Ron Paul and others
What a bizarro world this is.
Note : if first oil shock was labeled as it should be "US peak" in oil price graphs and the like and not "Arab Embargo"(which impact on the US is more or less a complete myth, and US peak being of course the key event related to the first oil shock), maybe things would be a bit different...
sparky - All the production history of the US is publicly available for free. And for a small annual fee I can access (from my recliner in which I sit at the moment) the monthly production of every well produced in Texas and La (go to DrillingInfo.com for details) for the last 40+ years. And do so with a few mouse clicks. Download it to an Excel and play with it any way I want. You can go the govt web site and do the same for every offshore field for free. I doubt there's any other industry which has more public info on it's operations available as the oil patch.
BTW: rarely have I ever studied production history provided by any company. About 99% of the info I use comes from the regulatory agencies that continuely monitor all oil/NG production.
The government of Saudi Arabia treats oil production data as a state secret, but in modern industrial economies like the US, Canada, and those of Europe companies are required to report all their data to the government. You just have to know where to find it and how to interpret it.
The latter are the big problems people have. They don't know where to find the data, and even if they did, they wouldn't know how to interpret it.
Working as a business analyst in the Canadian oil industry, I used to do retrievals on government data to figure out how much oil the company I worked for produced. You would think that a company would know that, but it's harder to figure out than you might think. I also used to run retrievals on our partners' production data and do credibility checks on it because there was a really good chance that some of them were trying to short us on the money they owed us.
I also used to run comparisons of the government data against our data to find discrepancies, because if they were different, WE had a problem, by definition. The government's only problem was how much money to fine us for not keeping their data accurate.
By "the Government", I think I should point out to non-Canadians that RockyMtnGuy means the Provincial Gov'ts of Alberta (ERCB), BC, Sask, Manitoba, Nova Scotia (CNSOPB) and the New Found Land (CNOSPB), not the Federal Gov't in Ottawa. Oh, and Ontario, how could I forget?
The Fed's, through the NEB (National Energy Board at 7th Ave & 4th Street SW), also have good data.
The ERCB data is very comprehensive but like everybody else, relies on what the operator tells them.