| The Cold Facts About a Hot Commodity: LNG | The Oil Drum | Can an Economy Learn to Live with Increasingly High Oil Prices? |
Thresholds in the Economic Effects of Oil Prices
Posted by Rembrandt on October 6, 2012 - 5:14am
This is a guest post by James Hamilton, Professor of Economics at the University of California, well known for work on the relationship between oil prices and economic growth. The article originally appeared on his blog EconBrowser.
As U.S. retail gasoline prices once again near $4.00 a gallon, does this pose a threat to the economy and President Obama's prospects for re-election? My answer is no.
The graph below plots average U.S. gasoline prices, adjusted for inflation, over the last decade. This is now the fourth time we've been near the $4 threshold. It first happened in June 2008, again in May 2011, and again in April of this year. In fact, on each of those previous 3 occasions the average U.S. retail price of gasoline was higher than it is today.

Figure 1. Monthly real gasoline price, Jan 2002 to Sep 2012. Data source: monthly gasoline price from EIA, with value for September representing the weekly September 17 value. Expressed in units of August 2012 dollars by multiplying by ratio of August CPI (from FRED) to that of the reported month.
The first time something like this happened in 2008, it was quite a jolt to consumers and to the economy. In fact, the U.S. is still in the process of adjusting to that shock 4 years ago. The vehicles that many Americans were driving at the time just don't make sense if you have to pay $60 or more every time you visit the gasoline station. Even so, you don't get rid of the old gas-guzzler right away, but make sure you change when you buy a new one. The average fuel economy of new U.S. cars purchased has been steadily increasing since 2008.
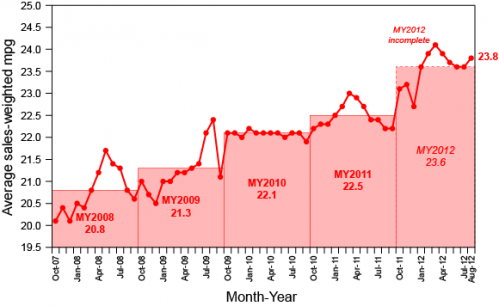
Figure 2. Average sales-weighted fuel economy of purchased new vehicles for October 2007 through August 2012. Source: UMTRI (hat tip: Peak Energy and Early Warning).
Total vehicle miles traveled also takes time to adjust, as people change their home, job locations and other habits.

Figure 3. Moving 12-month total of vehicle miles driven on all U.S. highways through June 2012. Source:Federal Highway Administration.
The initial adjustments associated with that process were quite disruptive to the economy. For example, sales of light trucks and SUVs manufactured in North America plunged in the first half of 2008, and the hit to the auto sector made an important contribution to the first year of the Great Recession. Sales of this category for August of this year were still 20% below the average August value over 2003-2007.
By contrast, sales of lighter cars are now back up near their historical average, allowing the auto sector to be able to make a solid contribution to recent U.S. economic growth.
It's also interesting to look at how the response of consumer sentiment to gasoline prices has changed over time. The blue line in the graph below shows the same real gasoline price series plotted in Figure 1 above, except now drawn on a negative scale (shown on the right-hand axis); that is, the lower the blue line, the higher the price of gasoline. I plot it this way to highlight its relation to consumer sentiment, shown in black and labeled on the left-hand axis. When real gasoline prices first reached $3.50/gallon in 2005, consumer sentiment plunged sharply. When it happened again in 2006, the response was more modest, and on the third time in 2007, it didn't seem to faze consumers. It was only when gasoline prices went on from there to make new highs in 2008 that we saw sentiment plunge again.
Figure 6. Consumer sentiment and negative of real gasoline prices, Jan 2002 to Sep 2012. Black line: Reuters/University of Michigan index of consumer sentiment (left scale). Data source: compiled from contemporary news accounts. Blue line: negative of real retail price of gasoline (right scale), from Figure 1.
By the second time gas threatened $4/gallon in the spring of 2011, the memory of 2008 had receded somewhat, and consumer sentiment fell sharply. It was much more muted when the same thing happened again just one year later. And right at the moment? Consumers seem to be shrugging it off. Nobody is surprised this time, having seen the same thing twice before over the last year and a half. Many of the adjustments people are making today were in fact set in motion 4 years ago.
There is quite a bit of empirical support for the claim that the second or third time oil prices move back near a previous high, the economic disruption is significantly less than the first time; see for example the evidence and literature reviewed in my 2003 Journal of Econometrics paper (ungated version here) and two recent surveys [1], [2].
$4/gallon? Been there, done that.
Contact
- Content: editors at theoildrum dot com
- Tech support: support at theoildrum dot com
License

This work is licensed under a Creative Commons Attribution-Share Alike 3.0 United States License.
Amen.
Basically, if you were going to be pushed out by $4 gas, you've been pushed out. And if you have the ability to adjust, you've adjusted. People have a very strong ability to adapt.
A few years from now will that miles driven peak be the official marker for global peak oil?
Historians will look back and state that something permanently significant happened in 2008.
I don't disagree. 2008 marks the beginning of the end in a sense. But it's not "fall off a cliff" anymore, it's "oh, look, high gas prices again". The so called new normal. At this point, most people don't even register that things have changed all that much or that it will be like this and worse in the future. I think, rather, that the expectation is that we will magically find tons more oil and happy days will be here again, or some sort of thing will bring it back. The pessimists are gathered here, but out on the street I don't see that.
$4 gas is dragging everything down, but things are still substantially like they were 10 years ago if you are employed, at least on the surface. At some price point - maybe $6, $8, $10 - that surface will crack just as it did in 2008 when oil prices spiked. It just seems clear to me that $4 gas is no longer a shock or a huge disruption. Nobody is selling their SUV due to gas prices that hasn't already sold their SUV.
Adam,
I think people are still making adjustments, $4 gas is still working its way through the system. These are the type of changes that come from left field that the free marketers die for, they just take time to work their way through the system. Too little to late? can't say, but the forces are at play.
http://fleetowner.com/fuel/changing-perspectives-pickups
"Amen" is after all is said and done, if $4 gas was the end, then yes.
The disconnect between "we've adjusted- all clear today" and the never ending tightening of the vice that this is...seems lost on most everyone.
Read this -
http://www.energybulletin.net/stories/2012-10-03/high-priced-fuel-syndrome
I see nothing to argue about in Ms Tverberg's article, in fact I think it is the most clearly written piece I have read to date.
What happens when gas hits $8 a gallon? We will adapt and adjust, that is clear, it just may not be in a manner that we all want.
Actually, that's not quite true. The stats are looking at aggregates and therefore mask the reaction of individuals in different situations. The people who are really stuck up a creek are the ones who bought a big SUV in 2006 or 2007, when they could barely afford to purchase it and were relying on increasing their credit card debt to run it. They would have been hoping for an improvement in their finances over the following couple of years in order to start balancing their budget again. What they've got since, however, is the reverse.
They're up the creek because they bought new and therefore would suffer a massive loss from selling, so they hang on and hope for the best. Their confidence plunges every time the price of petrol goes up - and it probably plunges by just as much as it used to.
People who bought SUVs a few years before that, however, are in a better position. They've paid off the car loan and are in a position to sell - so they do. Sure, they get a pittance for their trade-in, but they get to cut their running costs by a lot. When the price of petrol goes up, their confidence levels are hardly affected.
In summary, the price spike of 2008 is still working its way through society. There are still people hurting from high petrol prices, but they haven't yet been able to adjust by either driving less or getting a more fuel-efficient vehicle. Present data aren't sufficient to show how many there are, but they do show there are fewer than four years ago.
When petrol breaks the old record and sets new ones, as it will in due course, the confidence levels on the graph will plunge again and the process of the last four years will recur.
I have a post that is related that I understand will be put up some time tomorrow. (Heading out is busy this week.) My post can be read now at Our Finite World: Can an economy learn to live with increasingly high oil prices?
I am generally not available today to comment.
This is the one I was waiting for, unless I missed it;
http://www.energybulletin.net/stories/2012-10-03/high-priced-fuel-syndrome
Well written!
You will have to read it on Our Finite World. TOD isn't planning on running it.
Gail writes in her article:
"The percentage of automobiles has been dropping, as the number of SUV and trucks has been rising"
Same thing in Australia:
Bizarre. This is the result of a total failure of the media to connect daily events like refinery closures, airlines re-scheduling, shelving of mining projects, poor toll-way performance etc.to peak oil.
I don't know quite what is happening. The mix reflects how long old cars are kept as well as new ones added. It may be that trucks and SUVs hold up better, so stay in the mix longer. Or that businesses (with delivery trucks, etc.) are doing better than employees in a down economy.
People who buy new cars choose cars to enhance their own prestige. If they only plan on keeping them a few years, the big cost of ownership is the depreciation in the sales price of the vehicle. In fact, they may decide to lease for that reason. But the price of gasoline often is not a huge part of the total.
It is the person who buys a used car, who is likely poorer, who is more hurt by gasoline prices. This person is likely driving a less fuel efficient car, if fuel efficiency is improving over time. This person may be less aware of what fuel efficiency of a particular car is, because used cars may not have fuel efficiency prominently marked. I am sure this would be the case for person to person sales. I don't know about what dealerships do.
Look at the data - it's just the aging of the fleet.
The average active lifespan of a vehicle is about 15-16 years, so 2011 data shows the effect of swapping out vehicles from 1994ish for ones from 2010.
In 1994, Americans bought 9.0M cars and 6.1M trucks.
In 2010, Americans bought 5.6M cars and 5.9M trucks.
That alone would account for a couple percent drop in the share of cars; taking into account the 00's, when truck sales substantially exceeded car sales, it's not that surprising to see a larger drop. The trend will continue, too, as it's already baked into the composition of the fleet. It's basically just demographics for vehicles.
I think it may actually be worse than you say. According to recent estimates, the average age of passenger cars on the road is 11.1 years and the average age of light trucks is 10.4 years. I would think that part of that difference is that SUVs weren't sold 20+ years ago.
If the average age of passenger cars on the road is 11. 1 year, their useful life must be more than 15 or 16 year. A first pass guess is 22.2 years, or twice the average. (I know someone who is driving a car of about that age, and trying to figure out whether they have enough money to buy a newer car.)
With high prices of new cars, and people's salaries not going up much, people put off new car purchases, even with the very low interest rates available today.
Section 4.5 of Estimating Texas Motor Vehicle Operating Costs has information drawn from the Texas motor vehicle registrations for years through 2009. Looking at the CDFs, it appears that 90% of vehicles on the road are generally 13 years or younger. The "roadshare" of younger vehicles is higher than their share of registrations because they are preferentially driven. Mean age based on total registrations is skewed high due to many very old vehicles that are rarely driven.
I wasn't sure how the organization figuring average ages calculated them--or for that matter, how the National HIghway Administration calculated the average miles per gallon on a mix of cars on the road.
The report you linked is interesting. I think your general point is right. I noticed, though, that in the report you link that the average age of vehicles in Texas was only 7.5 years--significantly lower than the national average. Texas has also been doing better in recent years in terms of employment gains than some other states, helping it to have more new cars than average. This may bias the results down somewhat in Texas, relative to the national average.
It would be interesting if there was an 'age' based on miles driven and a combination of age with miles driven. Perhaps the cars that are disposed early have high mileages while the old ones have lower. I know there will be exceptions such as the old banger that has gone around the clock n times but I wonder if age combined with mileage has more of a constant.
NAOM
The age and mileage when junked may vary considerably by make and model. I agree that it would be very interesting statistics to have, but the auto salvage business is not highly concentrated or regulated in a way that makes those statistics readily available.
Any cohort of new vehicles starts to decrease due to vehicles totaled in accidents, then major failures of engines, transmissions, etc., followed by a long tail of vehicles retired due to bodywork problems, high general maintenance, wearing out of engines, and lack of buyer interest.
That isn't entirely correct. The big 3 all made SUVs (the Blazer, the Bonco and the Ram Charger) as far back as the 70s. They were even making smaller versions of the original units by 1994. In 1992, Toyota, Issusu and Mazda were in the market too. The big change since then is that the SUVs and the light trucks have become much more drivable thanks to automatic transmissions, soft suspensions and car like interiors, and the advertising has focused more towards soccer Moms than they used to.
The Jeep Grand Wagoneer (1963-1991), International Travelall (1953-1975), and Chevy Suburban (1934-present) were around a long time ago. The Toyota Landcruiser was already popular in the early 1970s. I bought an Isuzu Trooper II in 1984. Yeah, there are more of them now, and the biggest ones are certainly bigger, but SUVs have been with us for a long time,even if we didn't know them by that name.
We see a lot of Suburbans here, some used as taxis. I would class them more as a people mover than straight SUV but maybe that is because of the models they like here. It hurts to see one being used to haul around one man and his ar[redacted] around.
NAOM
The Travelall and earlier models of the Suburban were utility vehicles, handy for hauling more than a couple of people plus a fair amount of equipment; basically, large station wagons. (The early Suburbans were more like panel trucks with windows and seats.) The Grand Wagoneer was the first luxury SUV. I remember seeing them parked in front of larger vacation homes. That may have been the start of the shift to seeing truck-based vehicles as more prestigious than cars.
Look at the data - it's just the aging of the fleet.
Car sales have been generally declining for almost 30 years, meaning the car fleet's average age will be skewed high. Light truck sales have been strongly increasing for the last 30 years (except the last 5, but sales now are still 2x sales 30 years ago), meaning the truck fleet's average age will be skewed low.
Taking all US vehicle sales in the last 20 years and weighting each year by the number of cars/trucks sold in that year gives an expected average fleet age of 11.1 years for cars and 10.2 years for trucks, which is almost exactly what we see.
The difference is completely expected.
The ex retired her Subaru after 22 years and 280,000 miles.
A 1990 station wagon, and it got 32 miles to the gallon. Even the Japanese did nothing to improve fuel economy for 20 years.
My pickup is also 22, going on 23 by the end of the winter.
It will be interesting to see what the reaction is to $5.00+? Of course we pay more than that in Canada. I still have kids in my automotive class lying awake at night dreaming of lifted trucks and bored out blocks; with sugar plum faries on a snap-on calendar. Last year I put together a course entitled Energy Techonology. A TOD friendly course, my class project was a small scale windmill. Not enough interested to run it. Filled up the Yaris before work at $1.38.5 a litre, a 13 cent spike per litre overnight. Ouch.
The first time this happened I scrapped the 3/4 ton GMC and bought the Yaris and an 86 Toyota PU for construction work. Yesterday I shrugged my shoulders, kicked myself for not filling up the day before, and swiped the card in the pump.
Looking forward to retirement and driving once every 2 weeks.
Regards...Paulo
...$5.00+...
Yes! In the US where 80% of our economy is retail this will be an un-mitigateable disaster. Slowly, as business adjust to less revenue, hire fewer or lay off more and no raises. Consumers are stuck with choices such as the newest electronic non-necessity or drive thru McSandwich and heating their house or driving their car.
I watch my kids expound on the latest amazing (electronic) technology.
The big problem - no body want to listen to doom, they want the latest techno toy as empirical evidence of human superiority. When those rose colored glasses come off they will not accept blame right away.
We really need to teach critical thinking!
It would be nice if someone actually did a study of how and who changing energy prices have an effect on. Averages like this certainly don't tell the whole story. I live in the SF bay area, and because of local refinery problems, regular gasoline is selling for over $4.75/gallon, and premium is over $5. Still, thanks to the still strong presence of the High Tech industry, there are a lot of people here making absurdly large salaries. The cars at the filling stations are not just SUVs, they are Luxury SUVs costing $50k to $80k. These people don't seem to bat an eyelid over high gasoline prices. Unless our culture starts changing and the majority of people actually start caring about the climate and resource depletion, rationing by price will have predictable consequences within the economic strata of the society. Will this in time lead to social unrest? I wouldn't bet against it.
Filling up the 39-gallon tank of a Chevrolet Suburban costs $ 400 in Norway. That´s why the US with 5 % of the worlds population uses more than 25 % of the resources.
I called it simulated annealing when I mentioned it a while back, the stress on the economic system preferentially kills off the less valuable activities that can no longer be afforded, such that over time the effect on the economy of those prices fades away. The economy is stronger, more resilient to higher prices.
The flip side of this is that for demand to be matched to supply the price will have to rise to a higher price in future - and will do so. This then places strain elsewhere and the process begins again.
It should also be noted that each stage is harder on society, as more valuable activities get 'killed off' - and that eventually you can expect a semi, or widespread, 'house-of-cards' collapse as something gets killed that was key to the wider system surviving, but wasn't recognised.
Evidence from Europe is that economies can deal with much higher prices without collapse, but that it takes time for the annealing to take place.
Oh, and finally, Europe is better placed because the taxation regime makes the percentage change in oil prices less than the no-tax US will feel. In short, a spike hurts the US more.
Gary – “…kills off the less valuable activities that can no longer be afforded”. Which may be part (a large portion) of the explanation for our persistent unemployment. Consider the choice of fewer lattes or not driving to work which isn’t an option for many. Multiply the abandoned lattes by hundreds of millions of similar “sacrifices” every month and it can translate into many of the lesser skilled folks losing their jobs. Thus given what appears to be the new normal in energy pricing may also represent the new normal in unemployment IMHO.
Undoubtedly.
My worry when I was looking at this area are the activities that get killed off, but which via long chains that take months to years to unravel are tied into key systems.
So maybe the cost of driving to work, even with car sharing, isn't worth it for some poorly remunerated machine tool workers. So they leave, the company closes down, and assets spread to the four winds. However, those tools are needed for the key manufacturing step of drill bits, and eventually someone realises no tools means no new drill bits - and since the capability has disappeared, no way of reconstituting it.
OK, that example is a little far fetched, but it is for reasons like this that governments fund nuclear weapons scientists. They might not need them today, but they CAN'T rebuild the capability later.
Multiply that on a global scale as the stressors are felt via the common mediator of oil prices and you can basically guarantee that at some level, something key breaks. You just don't know what it is to a year or two later. When its too late.
PS Outsourcing all those jobs to china means eventually, no economy in the OECD - tragedy of the commons and short sighted capitalism is the BEST you can hope for. We are heading to the Greece destination.
Michael Gorbachev oversaw the demise of communism.
And my feeling is that President Obama is here to help us all oversee the demise of capitalism, or at least get started in that direction and get it widely recognized (if unsaid).
Pi is wrong on both counts. Russia never had communism and Obama isn't abolishing capitalism.
What they had in Russia wasn't the principle of "from each according to their ability; to each according to their need". Instead, it was an incoherent system where production was not based upon either use or profit, but as a ritual of obedience to the Plan. Use values were only reliably produced in the military sector. The best name for the system they had in Russia was Stalinism.
Obama isn't abolishing capitalism. He is attempting to regulate it slightly more strictly than the Republicans desire, motivated by what he perceives as its long term interests. This includes his disagreement with the Republicans over how rapidly, and in what manner, the deficit should be reduced and the Budget brought back to balance. If you want to see the effects of the sort of cuts to the Budget that the Republicans are proposing, take a look at Greece - and then scale it up to account for the difference in size between the two countries.
Austerity is a self-defeating policy, because it crunches the economy and thus the size of the tax base. Government revenue falls and the Budget position doesn't improve. It's probably too late to save the US economy, but it's way too late for austerity to work.
High oil prices also put governments into huge deficit spending that isn't sustainable, because the unemployment and retirement programs they put together were based on a different time and place--when oil prices were lower and more could be employed (using today's fuel-heavy types of employment).
While it may sort-of look like the economies have adapted, what you see is deceptive. Governments are doing all kinds of deficit spending. They are also trying to keep interest rates down What they are doing is not sustainable. See my post that is up now on TOD.
Copy of a post I made on the original Econbrowser article:
THis was also precisely the time when China / India demand was ramping up due to all of their new production, helping raise oil prices. At the same time, US and European jobs were going to China and India. Is it any wonder we started running into problems?
Hamilton is being just a little disingenuous IMHO. Overall mpg has been rising since the mid-1970s, while his miles-driven chart ignores the obvious correlation with the onset of the current Greater Recession and the millions of people who lost their jobs and cut way back on their driving. The little uptick at the end even reflects the widely claimed slight improvement in the economy. While the reasons Hamilton cites are indeed factors in the overall trend, they are by no means the only ones.
The US (data from 2008) still has a bit of catching up to do (through CAFE) ......
http://www.treehugger.com/cars/number-of-the-day-38-mpg.html
Norway, the no 7 oil exporter has a petrol price of 9,50 $/gal and a maket share of pure electrical cars of 5,2 % as well as a balanced budget. Maybe US has something to learn.
Norway is an oil exporter. This is a big part of the difference. It helps the finances of the country.
Norway also has an abundant supply of cheap hydroelectric energy, that it can use to keep the average cost of energy down. Norway encourages the use of the cheap hydroelectricity, instead of oil, because the oil can be sold at a high price elsewhere. Using cheap hydroelectricity helps keep the country competitive with other countries. Also, workers wages "go farther".
If we look at Norway's total energy consumption per capita, it is about 27% higher than that of the US. For the years 2009-2011, it averages about 9.22 tons of oil equivalent per year, versus 7.26 tons of oil equivalent per year for the US, based on BP data. About 37% of US energy consumption is oil, but only about 25% of Norway's energy consumption is oil.
Eventually, Norway will burn- or sell all of its oil then it will be another version of Somalia or Bosnia in a continent filled with Somalias and Bosnias.
How long? Soon, too soon.
How long before the wisdom arrives ... to do something besides burn and sell?
(crickets ...)
Since the majority of Norway's energy use is renewable electricity, and it already profits from its hydroelectric system's growing role as the "battery" of a diverse renewable energy network spanning several countries, its position vis-a-vis energy (not to mention almost every other particular) is utterly dissimilar from the countries you mention, as well as from most others.
Steve,
It would probably be benifical for Norway as well as for most oil producing countries to save oil in the ground and produce later when prices are higher. However different to most countries Norway saves a fair amount of the profit in an oil fund presently 3000 billion NOK (500 billion US$) equal to one GDP, invested in industry around the world.
If the world has financial problems, it seems like these investments are going to be at risk.
As a practical matter, it is difficult to put aside funds for when oil supply runs low, because if it runs low on a very widespread basis, there are likely to be financial problems in many places. We need oil to make and transport new goods in our economy.
Gail,
Compareing US and most European countries it is important to consider the tax instrument used by the governments on energy and especially fossile energy.
"Norway also has an abundant supply of cheap hydroelectric energy"
Northern Europe has the largest and first open market for electricity in the world, "Nord Pool Spot". Thus Norway has about the same spot prices as the rest of northern Europe. With tax and including the cost for the distribution an average consumer pays about 1.36 NOK/kWh ( 0.22 $/kWh ). As I said earlier the petrol price 9.5 $/gal. One might only guess what the consumption in Norway would have been with the US taxes.
I suppose Norway salaries are helping keep oil demand up.
I am surprised electric costs are that high. I usually think of hydroelectric electricity as cheap (High EROEI) but it was recently pointed out to me that that depends a lot on where the dam is built (and I suppose when it is built).
Brazil uses a lot of hydroelectric, and its electricity costs are said to be very high. But I thought that was because they did not have good locations for dams.
Tax.
"The average price of electricity for households in the second quarter, excluding taxes and grid rent, was 26.1 øre [US$0.046] per kWh....The overall average price of electricity for households, including grid rent and taxes, amounted to 77.4 øre [US$0.136] per kWh in the second quarter."
This comparison has been done on TOD before. Unless there have been enormous changes since 2010, Norway has cheap electricity by international standards; excluding tax, cheaper than the US.
Gail,
My point is that the price the consumer pays for energy is only remotely related to the average production cost or the construction cost of a plant. It used to be before the market was deregulated in 2002. The price now on the spot market Nord Pool is the production cost of the most expensive power plant that needs to be taken in operation, in the summer usually hydro or nuclear and in the winter coal or gas turbines. You may compare with the crude oil price. In addition, the European governments use the tax instrument to reduce consumtion. Sweden for example uses energy tax, nuclear tax, sulfor tax, nitrogen tax, CO2 tax,VAT, cap and trade and green certificates plus a number of subsideries. This should not be neglected when discussing the behaviour of consumers to changes in commodity prices in Europe.
I will provide some data from my most recent electricity bill.
Spot price (production cost)….. 31,03 øre/Kwh...................5,44 UScent/kWh (includes 25% VAT),
this price varies with supply/demand balances, it may be higher and lower (I cited the highest number from last summer).
Grid rent................................... 29,99 øre/kWh ...................5,26 UScent/kWh (includes 25% VAT)
Then there is some fixed monthly charges for both power and grid rent and thus these additions to unit price becomes dependent upon household usage, high usage makes this addition per kWh lower than for a household with low usage.
A typical Norwegian household consumes around 20 000 kWh (electricity) a normal year, which makes the additions from the fixed charges around
…………………………………………………. 19 øre/kWh.....3,33 UScent/kWh (includes 25% VAT).
Industries (big consumers) may have different agreements.
The typical Norwegian household now effectively pays around 14 - 17 UScents/kWh (US$0,14-US$0,17 per kWh).
Rune
Thanks Rune,
I took the figures from my 2011 bill in Trysil (Eidsiva). I see however in Statistics Norway that the total consumers price for electricity in Norway decreased by 26 % in the second quarter of 2012 compared to 2011.
However,the point I wanted to make is that, when discussing the behaviour of private consumers in Europe as to changes in commodity prices, US commentators including Gail tend to neglect the sometimes dominating influence of European taxes.
The fact that Norway is an oil exporter does not explain the price of petrol there. How many other oil exporters have domestic prices of $US9.50/gal? What the US has to learn is that continuing to allow petrol to be almost tax-free is a mug's game.
I'd be keenly interested in an article that evaluates the transition from retail shopping to online shopping.
I personally do ALL my shopping online (besides groceries, and the very rare I need it NOW item). On occasion I will go to a store, and in the store compare prices for the exact same merchandise to Amazon, and 95% of the time (99% actually) Amazon is cheaper, and orders over $25 are free shipping... and there's no sales tax in the state I reside in. That not only saves a lot of money, but it saves literally thousands of vehicle miles driven.
I think that the rise of online shopping is a tremendously strong countervailing force. Perhaps I'm a rare breed since I've been distinctly concerned about Peak Oil for 7 years now, but the reality is that shopping online saves gas, saves tax, and results in the ultimate competitive edge (which means the lowest prices possible). We could also have a discussion about how online purchases lower tax revenues, and the impact there, but thats perhaps for a different website.
Here the local merchants have banded together for an advertising campaign to stress the value of shopping local to the local economy. No doubt online shopping is one of the drivers behind the need for this ad campaign. Local jobs are one of the biggest things at stake but he taxes saved by online shopping can put stress on local governments' functions as their tax takes shrink. Fallout happens with any change in trade activities, some winners some losers.
I agree with most of the analysis reported. However, this is true only for the US and the reasons why recent high oil have are affecting Europe and Asia more than the US were clearly discuss by Gail Tverberg in this post:
Why High Oil Prices Are Now Affecting Europe More Than the US
Instead in Europe, the automotive industry is simply plummeting to levels observed decades ago:
Car sales in Europe drop to 22-year low
Car sales fall in austerity-hit France, Italy, Spain
Germany Infected by European Automotive Plague
and we are now in full recession, just see the Eurocoin index which is one of the best leading indicator for Europe:
How long the US will be able to be (partially) insulated by high oil prices depends from the following factors:
- the capacity to keep shale oil marginal cost below 90$: Rune Likvern show recently that now we are around 80-90 dollars, that is borderline. This is clearly fundamental, because differently from what happened with shale gas where producers switched to shale oil plays to survive, poor economic viability for shale oil means game over (unless they switch to "shale uraniun", "shale whatever", ahahah)
- the capacity to keep SP500 at high levels
- the capacity to have the US bond markets functioning
While the last two points should not be a problem, nevertheless extreme events and panic selling can always take place (algorithmic trading can easily cause a flash crash, as already happened in US markets several times at the stock level and one time at the index level).
I agree with you. Also see my post Can the economy live with increasingly high oil prices?
This article isn't so optimistic on car distances travelled - due to rise of diverse micro businesses away from the transitional urban centers http://www.salutus-solutions.com/transport/economic-news/the-bull-case-f...
As I said on your blog, Mr. Hamilton, there's poor graphs here on the cars and light trucks sales.
The nutgraf of your argument, after all, is that since 2007, the ratio of light truck sales to overall passenger vehicle sales should be falling, due to reaction to gasoline prices.
So, why give us separate graphs for LT sale and overall car sales? Just give us a ratio graph, so we can get past the chaff of how the recession hit overall vehicle sales.