Tech Talk - Global Oil Supply and Iranian Production
Posted by Heading Out on November 18, 2012 - 6:09am
One of the headlines this week from the IEA Report suggests that the United States will be the top global oil producer in five years. Yet back in DeSoto Parish in Louisiana, where the Haynesville Shale discovery in 2008 started the bonanza, revenues are now falling and school board budgets are strapped as the end of the glory days are beginning to appear.
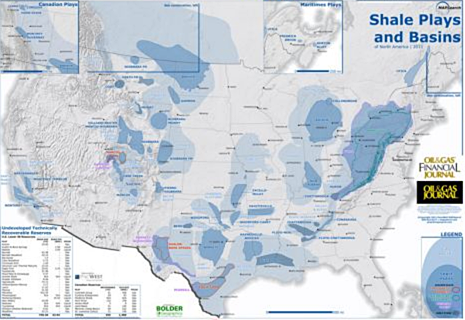
Just this week Aubrey McClendon said that Chesapeake’s prospects for oil in Ohio, where Chesapeake had high hopes for the Utica Shale, are now dim. It is easy to look at one of the large maps showing all the shale deposits in the United States that the Oil and Gas Journal include in their print editions, and to be carried away (as the IEA apparently are) with the vast acreage that is shaded on the map. Unfortunately, as we can see, reality tells another story. The size of the resources have been measured in the past, and with the best plays being given preference, the recognition of decline rates and unprofitable wells have not yet been given the prominence in the popular press that they will ultimately draw.
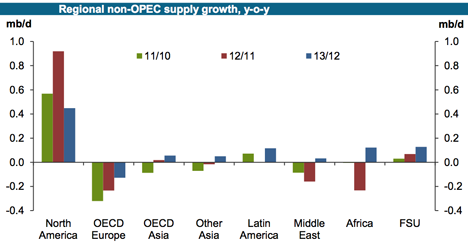
It seems unrealistic to anticipate the levels now being projected for future North American production of oil. Nevertheless, these projections do tend to crowd conflicting stories on the subject out of the spotlight. Further, if the predictions for American production gains, even in the short term, turn out to be optimistic, then the impacts may be even more exaggerated than is currently appreciated. Consider that OPEC now expects that North America will continue to provide the greatest y-o-y increase in supply over other nations, and there are in fact, few other nations that will contribute much more in the next year.
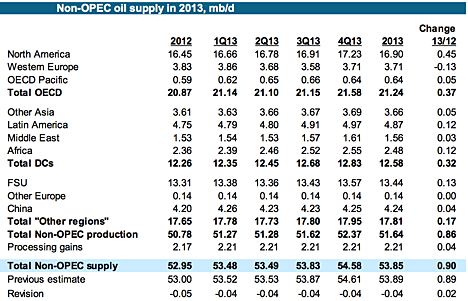
The MOMR notes that UK oil production has fallen below 1 mbd for the first time since 1977, while Norway’s production has fallen to levels not seen since 1990. These numbers are part of an overall revision of non-OPEC production for 2013, which OPEC now sees as coming in, as follows.
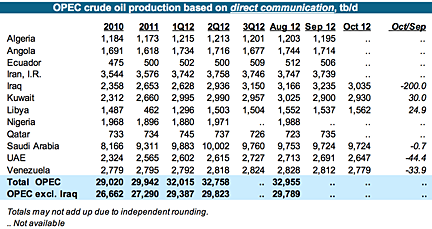
In regard to OPEC production, the MOMR has two tables for their production, with the first showing that based on secondary sources:
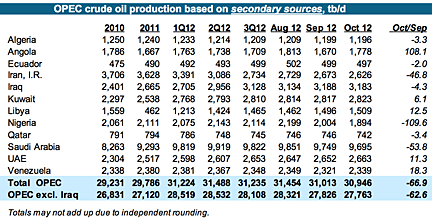
The tables show that Iranian oil production continues to decline by around 47 kbd from September to October. Yet other sources are now reporting that both China and South Korea may have been helping Iran increase oil exports. As a result, production may have increased 70 kbd instead of declining, though the overall volume remains at around 2.7 mbd, of which exports rose from 1 mbd to 1.43 mbd.
When the “as reported directly” table is compared, Iran is shown to be still producing at around 3.7 mbd.
Within Iran, the government has partially reduced the subsidies that it was providing for gasoline, which initially reduced demand by about 50 tb/d, and flattened internal demand. But as we enter the colder months, OPEC is estimating that demand will again start to rise.
Concurrently, Turkmenistan has stopped exporting natural gas to Iran. Normally Iran would increase imports over the winter months to around 1 billion cu.ft/day (bcf/d), although this import is partly for geographic reasons, and Iran has, in the past, exported about 80% of the equivalent volume to Turkey. Iran has apparently suggested that Turkmenistan increase the delivery to 1.4 bcf/d, but since Turkmenistan can now get a good price for its gas from China, there is more of a debate this year over price, without agreement at the moment. Iran also swaps around 35 mcf/d of natural gas with Armenia in return for electric power.
As a way to try and work around the current sanctions, Iran has been changing to a scenario where it can move more of its oil using its own tankers. The country had been storing millions of barrels in part of this fleet, but that volume is being sold so that the vessels can, instead, haul oil. And there is the possibility that the insurance on these vessels has been “fiddled” to get around the burden imposed by sanctions.
Internally the sanctions are having considerable effect.
Although the government maintains that the official inflation rate is 25 percent. . . with some analysts claiming that actual figures are double the government rate. In addition, unemployment has soared, with estimates stating that between 500,000 and 800,000 Iranians have lost their jobs. . . "Business is drying up, industry is collapsing. There's zero investment," said an Iranian businessman in September. . . the government has attempted to shield the lower classes by offering them cash handouts and subsidizing certain imported staple goods, making them relatively affordable for poorer segments of the population. But even these efforts have had a limited effect, as the price of goods such as Barbari bread went from 1,000 rials to 5,000 rials last week.
There are even suggestions that the economy could “essentially explode” by next spring. On the other hand there are ways of getting around sanctions, and these may allow the crisis to continue to simmer for some time.
All this would suggest that exports of Iranian oil will not be easily available for some time, although with a new regime in China their commitment to maintaining current levels of trade is now unclear. China will open two new refineries one for 240 kbd in Quanzhou that is scheduled to start next June, and one for 300 kbd that is to be located in Zhanjiang, with oil for the latter anticipated to come from Kuwait. Nevertheless, it may be that China, which is currently taking about half the Iranian exports might find it possible to accommodate more.
Contact
- Content: editors at theoildrum dot com
- Tech support: support at theoildrum dot com
License

This work is licensed under a Creative Commons Attribution-Share Alike 3.0 United States License.
"...carried away (as the IEA apparently are)..."
There was an article in Rolling Stone that stated that all of the hydrocarbons in the ground that were asserted to be recoverable were already on the books and in play as if they were cash.
http://www.rollingstone.com/politics/news/global-warmings-terrifying-new...
"Yes, this coal and gas and oil is still technically in the soil. But it's already economically aboveground – it's figured into share prices, companies are borrowing money against it, nations are basing their budgets on the presumed returns from their patrimony. It explains why the big fossil-fuel companies have fought so hard to prevent the regulation of carbon dioxide – those reserves are their primary asset, the holding that gives their companies their value."
Saying over and over again that there is this huge reserve available... makes it "real"... real enough to move money around and raise the value of wasteland... real enough to set-up the marks.
K - Shhhh...that's how promoters in the oil patch have been making a good living for over 100 years. I still conteend the most profitable player in the Eagle Ford was Petrohawk that sold their undrilled acreage for $12 billion and walked a way with a big smile on their faces. If you haven't seen me offer the promoters creed: Roll into town with the first wagon load of whores and roll out before the first wagon load of production equipment arrives.
"..it's figured into share prices, companies are borrowing money against it, nations are basing their budgets on the presumed returns from their patrimony"
That explains the opposition to the "use it or lose it" federal lease proposals. If your asset value is based on how much potential under lease, you just want to sit on it and get a good bond rating.
That map from the OIl & Gas Journal is quite deceiving. Several wells have been drilled in Michigan where the map shows dark shaded area for good hydrocarbon potential. As I recall these half dozen wells in MI did not produce any economically recoverable gas or oil. Same in Ohio, but for oil not one producing well, although some have produced measurable amounts of gas, but maybe not economical at todays prices.
mb - True: there hasn't been a shale formation in every basin in the US that hasn't been tested if but to a minor degree. No one on TOD has every heard the name of many of these shale and may never. But all the shale players are looking at every shale again. One of the latest reinventions was the Marine Tuscaloosa Shale north of Nawlins. Have heard that after some initial excite its turn out to be a disappointment. I’ve heard similar rumors about the Utica in Ohio but not much hard data.
The shales will live on IMHO despite some disappointments. The pubcos have no choice due to the lack of conventional prospects. They either chase the shales or liquidate and disappear. Hey have no other option IMHO.
Things that make you go hmmm.
hmmm.
As in the "Drowning in oil" cover from the Economist in 1999?
And the Time cover "Home $weet home" in 2005?
"Real estate gold rush" in Fortune, also in 2005?
To borrow a phrase; "Is it too late to get in?" "The answer to that question, when posed by a major magazine cover, tends to be an emphatic yes."
But Bernanke really needs another bubble. But this one may be deflating too fast to save his legacy.
Look at the O&GJ map of the undeveloped shale basins, covering all of Manitoba, Saskatchewan and Alberta to the edge of the map.
Hmmmmmmmmmmmmmmmmmmmmmmmmmmmmmmmmmmmmmmmmmmm
I have a nice bridge in Brooklyn for sale, only one owner, very well maintained ...
Harry:
I think your geography of Canada is a little off. The shale basin map shown in the article covers a little part of the SW part of Manitoba, a small part of southern Saskatchewan and a little bit of SE Alberta.
There has to be large shale basins in these provinces because they contain conventional oil deposits and the source rock for these deposits are marine shales. No shale basins to act as kitchens for the oil and there will be no conventional deposits. So if you have conventional deposits there has to be a shale basin somewhere. Whether than shale is going to be hydrocarbon productive today is an open question.
I'm based in Calgary when I'm not in the Dark Continent.
I've worked the Liard Basin shale gas play ;)
I'm fairly sure you're correct about the shale sections. Source rock isn't my specialty but I don't recall any petroleum basin that was 't sourced by a shale
The grey colored region is the huge Western Canadian Sedimentary Basin, which is underlaid by shale, the darker blue region extending north from North Dakota and Montana into southern Saskatchewn, southwestern Manitoba, and southeastern Alberta is the Canadian portion of the Bakken formation.
The Bakken does extend into Canada, but doesn't get as much play in the press as the US portion - the Canadian oil sands are much, much bigger than the Bakken. The blue areas in NE BC are similar shaley formations which are starting to be developed now. There are other potentially productive shaley formations in Alberta, but they are only recently starting to be analyzed.
Yes, you've captured it better than I could have put it. If it's too good to be true __________.
My good heavens. You are confusing North American production with USA production. The graphical information posted shows NA production growing by 0.45 BOPD. This is pretty realistic. You seem to thinking that this is solely the result of shale oil. Not true, the oil sand is growing rapidly. Canada is the largest exporter of energy to the USA and is projected to be producing over 6 million BOPD in the next decade or so from the present 3.1 million BOPD. The emerging Canol Shale play in the NWT of Canada is potentially an elephant of world proportions. The supermajors have agreed to committed to spend $620 million in return for being granted the petroleum rights by the Canadian Federal Government.
There also seem to be a focus on the lower 48 shale oil reserves. I don't know how the Alaskan play will work out, but it is the source for the Prudhoe field and if it works out as Great Bear Petroleum is projecting it will make a material difference to the USA production. It will easily fulfilling the IEA project that the USA will ramp up its oil production. Now I am pretty skeptical of the Great Bears hype, but you have not even considered the possibility.
I think the IEA bottom line on NA is that if NA can import less liquid fuels then perhaps it will change the political dynamics of the middle east. Perhaps the USA will not have to keep a fleet in the Persian Gulf and perhaps some other country can worry about the security of oil routes. Then the USA can keep its blood and treasure at home. I think this would be a good thing for Canadians and Americans. Let's hope that at least some of the hype and greed of the oil companies can serve a noble purpose.
In short, NA is NOT the just the lower 48. Things like the Utica are small potatoes. Don't conflate the lower 48 and NA as it leads to considerable confusion.
Now I am pretty skeptical of the Great Bears hype, but you have not even considered the possibility
They certainly toned down after the initial presentation. That one was intended to get attention and it did. I happened into a presentation by Great Bear's CEO in September. The assembled were privy to the first public display of a photo--taken the night before--of a Shublik formation core break--shiny, black and highly fossiliferous. Duncan (the CEO) was happy with what their two exploratory wells had turned up--it met modeled expectations--but full analysis had not yet begun.
All said, a lot of the projected US production numbers I see put Alaska's contribution moving to 2mbd in the next few/several years. Great Bear's 'full development' scenario (which assumes the numbers pan) has them drilling up to 192 wells a year from 24 pads (for a bit of comparison in the neighborhood of 1200 production wells have been drilled in the Prudhoe neighborhood since 1977)...one long skinny road to facilitate this...Great Bear has already grabbed the most promising leases with best access to that one road in and the one pipe out (TAPS).
Right now North Slope production is in steady decline (TAPS delivery averaged ~540kbd this year through October). Even if Great Bear were able to get to the full development phase by 2015 (that requires a whole lot of things to go right) their projected oil production won't climb to 200kbd until about 2020. About what TAPS needs to just tread water. Where is the rest of that 2mbd to come from.
Shell finally sunk some bits below the Beaufort and Chukchi this summer but due to issues with the containment barge they pulled out of all holes before reaching the hydrocarbon depth. And even though this year had the smallest arctic ice pack recorded since satellite recording began in 1979, a persistent 'island'--with an area of a mid sized US state--made up of about 30% ice concentration hung around neighborhood for a long time and shooed Shell off some sites for a while.
What I'm saying is nothing out there indicates AK can ramp up production all that fast in the next few/several years even if all does go well.
I am not as pessimestic about the Oil and Gas Journal map. Clearly the map is marked (for the lower 48) as reflecting resources, not reserves, thus, one needs to discount the values to represent the amount of of potential producable hydrocarbons.
As far as the Antrium shale, this is from Wikipedia:
"The Antrim Shale, is a major source of shale gas, and produces natural gas along a swath across the northern part of the state.[2] Most natural gas production is in Antrim, Crawford, Montmorency, Oscoda and Otsego counties.[3]
Although the Antrim Shale has produced gas since the 1940s, the play was not active until the late 1980s. During the 1990s, the Antrim became the most actively drilled shale gas play in the US, with thousands of wells drilled. To date, the shale has produced more than 2.5 TCF from more than 9 thousand wells. Antrim Shale wells produced almost 140×10^9 cu ft (4.0×10⁹ m3) in 2006.
The shale appears to be most economic at depths of 600-2,200 feet. Original gas content ranges from 40 to 100 standard cubic feet per ton. Wells are developed on units of from 40-acre (160,000 m2) to 160-acre (650,000 m2).[4] Horizontal drilling is not widely used. Antrim Shale wells often have to pump much initial water before gas production becomes significant, a behavior also seen in many coalbed methane wells.
Unlike most other shale gas plays, the natural gas from the Antrim appears to be biogenic gas generated by the action of bacteria on the organic-rich rock.[5] Also unlike most other shale plays, the Antrim Shale is thermally immature in the gas-productive trend.[6]
In 2007, the Antrim gas field produced 136 billion cubic feet of gas, making it the 13th-largest source of natural gas in the United States.[7]"
Thus, the Antrium has already been a sigificant producer for years.
From other Websites, it seems that the Antrium has decreased production in recent years, probably due to the huge decline in natural gas prices. The OGJ map shows 24 billion barrels of oil resources and 750 trillion cubic feet of natural gas in the lower 48. The Bakken is listed as having 3.6 billion barrels of crude oil (the highest is the Monterey in CA at 15.5 billion barrels).
What is shocking on the map is that Canadian RESERVES for crude oil from shale plays is estimated by EIA to be 1380 billion barrels. Thus, while US production could be significant for a few years, the Canadian production of crude oil from shale could be significant for decades, if those values are anywhere near realistic. The US is rich in natural gas shale plays, while Canada is rich in crude oil shale plays.
Retsel - "Thus, the Antrium has already been a significant producer for years." And not the only fractured shale to be a hot play in the US before everyone became familiar with the names Eagle Ford and Marcellus. About 20 years ago the Austin Chalk, being drilled horizontally and frac'd, was the hottest oil play in the country. Some folks think when I rebuke the meme that we've developed some "new technologies" to help us produce the shales that I'm criticizing the plays. IMHO they are great: half the public oils wouldn't be in business today if it weren't for them. We certainly don't need that many unemployed geos wandering the streets...the horror...the horror. The Rockman has limited skills and doesn't need the competition. I'm just to pointing out the driving force was a combination of prices and not enough conventional wells left to drill...not a techno silver bullit.
And they are a great wealth transfer mechanism. Not sure where we are today but a while back the pubcos were transferring over $2 billion/month to the service companies via the shale plays. That represents a lot of blue collar paychecks. Folks misunderstand when they see some of the huge REVENUE numbers for the pubcos and believe those owners are getting fat profits. In reality it's the ultimate trickle down reality. Actually more of a flood down. At lunch just now was told by a ND local that the McD's in her town was offering $20/hr for counter workers and they still can't fill all the time slots. And her truck driving brother-in-law was making #128k/yr. Granted it won't last but booms never do.
And as long as the pubcos have no alternative to growing reserve base they'll keep drilling as long as prices stay up and they have capital available. But for reasons we've discussed in detail, IMHO they are not much of a long term fix for PO. A nice decrease in import purchases and a nice distribution of company revenue to the middle class. But not a long term game changer. OTOH I don't see any other long term game changers that are being chased with any significant effect so far.
"I don't see any other long term game changers that are being chased with any significant effect so far."
I don't think that there is a silver bullet, but a combination of contributors could delay the ultimate decline in liquid fuel suppies for at least a decade, maybe decades, maybe forever.
It seems inevitable that crude oil prices are going to average (at least) $100/bbl from now on. The marginal cost for developing tar sands, fracked oil and the deepest ocean wells is close to that. This will set the floor for crude oil prices.
However, there are multiple reasons why crude oil may not continue its upward trend that we saw starting in 2004.
1. The higher price of crude oil is causing many people to use less (demand destruction). Added to this is that the US, which is the largest major per capita consumer, has put in place fuel economy standardars which will double the mileage from a gallon of fuel comparing vehicles manufactured in the year 2025 with those manufactured in the year 2010. The world will soon need to address climate change in a significant way. This will further increase the apparent price of fossil fuels, thus also reducing demand (particularly in the US).
2. The much relatively lower natural gas price in the US will cause some vehicle owners (over the road trucks, some fleets) to convert over to natural gas. In certain areas of the rest of the world, similar conversions would also make sense.
3. Small amounts if additional conventional crude oil will be developed, such as Iraq, Brazil...
4. Incremental production from tar sands will likely continue to increase, but eventually it will be limited by climate change (this recovery technology will need to be made more efficient to satisfy climate change policy).
5. Fracked oil is a short term proposition for the US (but still valueable for maintaining liquids production on a plateau), but Canadian fracked oil can be a significant contributor. Limits to Canadian fracked oil production may simply be that there is not enough water available in those areas (water resources are already being stretched to the limit by by tar sands production); the other would be policy put in place to address climate change.
6. Cellulosic biofuels will eventually come on line in a significant way (over 10 million barrels per day) - developing and expanding this new industry, however, will take decades to unfold.
The combination of these different potential sources or demand reductions, combined together, could keep us on the plateau, well, forever. In the past I was pretty pessimistic that there was a way forward that would keep us from falling into economic ruin due to peak oil, but I am now a lot more optimistic. I observe that a lot of people on this webpage reinforce a pessimistic view of the future.
US oil production: OK, but what's the net energy of all this extraction, today and projected into the future?
If Desoto was funded by Haynesville gas, the current revenue downturn is likely due to the drop in prices from the gas glut as any depletion.
I don't know the Haynesville well, but I hear those rigs have shifted from gas there to oil prospects in other areas, including the nearby Cotton Valley.
As with every question on production, the discussion should include "at what price?". For sure there is a lot more gas available if prices go to $12. For now, the game is oil, hence slowing in the Marcellus, Haynesville, and others. Utica has ribbons of oil, as does the Eagle Ford. Limestone plays seem to as well.
Personally, I suspect the truth will be in the middle; considerably more reserves than some here would expect, considerable less than the IEA states (and therefore at a much higher price as well).
On the sidebar menu of my website
http://crudeoilpeak.info/latest-graphs
I have a global crude oil graph showing the impact of tight oil.
Excluding US tight oil from Texas and North Dakota, in June 2012 crude was 200 kb/d lower than in June 2005, the Katrina year
Hello Matt,
Some time ago I posted this chart for for what it is worth.
Chart shows the split between crude oil and condensates (green columns) for the years 2002 and as of 2011 based upon data from EIA and National Board of Energy (NEB) in Canada.
So far there was a high in conventional C + C in 2005.
Chart illustrates that growth in world (C + C) has come from more expensive and unconventional sources.
- Rune