| China Energy Outlook: An Inside Look at Chinese Energy Thinking | The Oil Drum | Tech Talk - Global Oil Supply and Iranian Production |
IEA Oil Forecast Unrealistically High; Misses Diminishing Returns
Posted by Gail the Actuary on November 16, 2012 - 3:30pm
The International Energy Agency (IEA) provides unrealistically high oil forecasts in its new 2012 World Energy Outlook (WEO). It claims, among other things, that the United States will become the world’s largest oil producer by around 2020, and North America will become a net oil exporter by around 2030.

Figure 1 shows that this increase comes solely from the expected rise in tight oil production and natural gas liquids. The idea that we will become an exporter in later years occurs despite falling production, because “demand” will drop so much.
The oil price forecasts underlying these and other forecasts in the report are approximately as follows:

One reason the WEO 2012 estimates are unreasonable is because the oil prices shown are unrealistically low relative to the production amounts forecast in the report. This seems to occur because the IEA misses the problem of diminishing returns. As the easy-to-produce oil becomes more depleted, and we need to move to more difficult reservoirs, the cost of extraction increases.
In fact, there is evidence that the “tight” oil referenced in Exhibit 1 is already starting to reach production limits, at current prices. The only way these production limits might be reasonably overcome is with higher oil prices–much higher than the IEA is assuming in any of its forecasts.
Higher oil prices cause a huge problem because of their impact on the world economy. The IEA in fact mentions that current high oil prices are already acting as a brake on the global economy in its first slide for the press. Higher oil prices also mean that investment costs required to reach target production levels will be even higher than forecast by the IEA, adding another impediment to reaching its forecast production levels.
If higher prices put the economies of oil importing nations into recession, then oil prices will drop lower, reducing the incentive to invest in new oil production infrastructure. In fact, we could find ourselves reaching “peak oil” because of an economic dilemma: while there seems to be plenty of oil available, the cost of extracting it may be reaching a point where it is more expensive than consumers can afford. As a result, some oil that we know about, and have been counting as reserves, will have to be left in the ground.
The IMF has recently done modeling that is relevant to this issue in a working paper called “Oil and the World Economy: Some Possible Futures.” This analysis may provide some insight as to what the real situation will be.
The Problem of Diminishing Returns
One issue that the IEA has not properly modeled is the issue of declining resource quality, leading to diminishing returns and a rising “real” (inflation adjusted) cost of production. This situation is often described as reflecting declining Energy Return on Energy Invested (EROEI).
The reason diminishing returns are a problem is because when a producer decides to extract oil, or gas or coal, the producer looks for the cheapest, easiest to extract, resource first. It is only when this resource is mostly depleted that the producer will seek locations where more expensive, harder to extract resource is available. Thus, over time, the inflation adjusted cost of extracting a resource tends to increase.
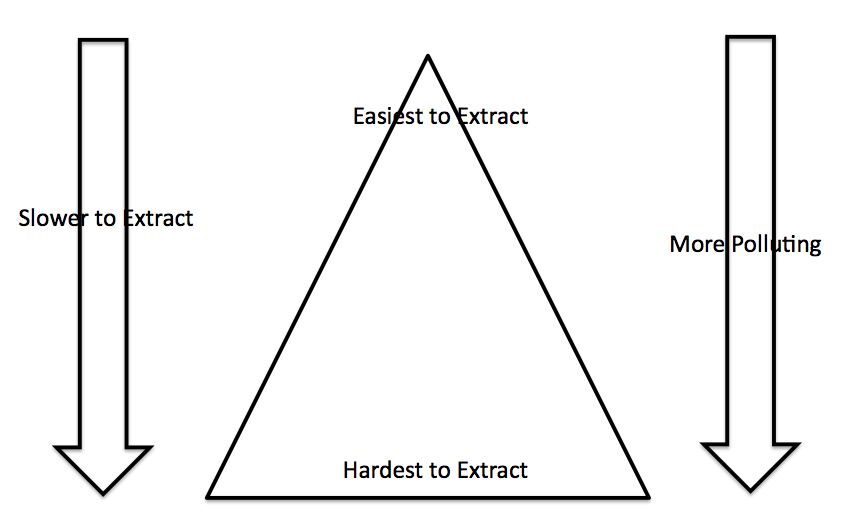
In terms of the triangle shown, producers tend to start at the top, with the “best” of the resource, and work their way toward the bottom. One result of this approach is that the cost per unit of production tends to rise, even as there are technology advances and efficiency gains, because the quality of the resource is declining.
Reserves tend to increase over time with this approach, because as producers work their way down the triangle in the diagram, they always see an increasing quantity of lower quality resources. The new reserves are increasingly expensive to extract, in inflation adjusted terms. There is no flashing light that says, “Above this price, customers won’t be able to afford to purchase this resource any more,” though. As a result, the increasingly low quality reserves get added to reported amounts, even though in some cases, the cost of products made with these reserves (say gasoline or diesel) will send economies into recession.
It should be noted that the issue of diminishing returns exists for almost any kind of resource. It exists for uranium extraction, since there is always more available, just harder to reach, or in lower concentration. Diminishing returns exists for gold, copper, and for nearly any other kind of metal. This means we often need more oil for metal extraction and processing, as we dig deeper or find ore that is mixed with a higher proportion of waste product.
The problem of diminishing returns also seems to hold for renewables. The first biofuel developed was ethanol from corn, since the process of making alcohol from corn has been known for ages. Newer approaches, such as ethanol from biomass and biofuel from algae, tend to be much more expensive. As a result, when we add new biofuel production, it is likely to be more expensive, and thus harder for the customer to afford. If we want it, we will need increasingly high subsidies.
Wind energy is also subject to diminishing returns. Onshore wind was developed first, and it is far less expensive than offshore wind, which was developed later. Early units of wind added to an electric grid do not disturb the electric grid to too great an extent. Later units of wind energy add increasingly large costs: long distance transmission lines, electrical storage, and other balancing–something that is generally overlooked in making early cost analyses.
Diminishing returns seem even to happen for energy efficiency. We have been working on energy efficiency a very long time. We have a tendency to pick the low-hanging fruit first. Later expenditure for efficiency may be less cost-effective.
Why Light Tight Oil Won’t Increase as in Figure 1
Tight oil, also referred to as “shale oil,” is supposed to be the United States’ oil savior, if we believe the IEA. The Bakken and Eagle Ford plays are the best known examples.
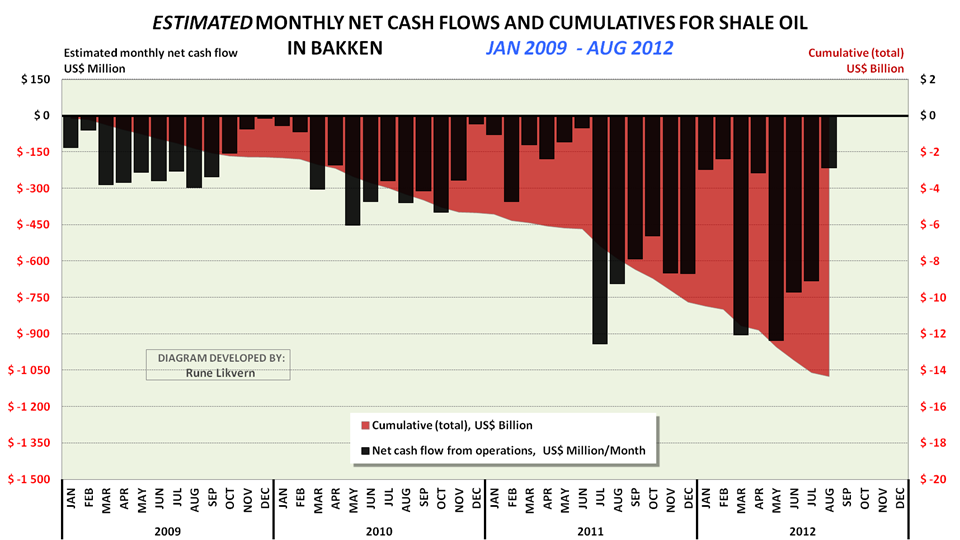
Rune Likvern of The Oil Drum has shown that drilling wells in the Bakken already seems to be reaching diminishing returns. The choicest locations appear to have been drilled first, and the locations being drilled now give poorer yields. He has also shown that the average well in the Bakken now requires a price of $80 to $90 barrel, which is close to the recent selling price. If increased production is desired, the price of oil will need to start increasing (and keep increasing) to provide the incentive needed to drill wells in less-choice location.
There are other issues as well. If there is a need to drill an increasing number of wells just to stay even, or an even larger number, to increase the amount of oil produced, we start to reach limits on many kinds: number of rigs available, number of workers available, miles driven for water to be used for fracking. Perhaps the issue that will limit production first, though, is limits on debt available to producers. Rune Likvern has also shown that cash flows from tight oil extraction tend to run “in the red,” so an increasing amount of debt financing is needed as operations ramp up. At some point, companies hit their credit limit and have to stop adding new wells until cash flow catches up.
Evidence Regarding Rate of Growth of Oil Extraction Costs
Bernstein Research recently published information showing that the marginal cost of oil production was $92 barrel in 2011 for non-OPEC, non Former Soviet Union oil producers at the 90th percentile of production. This cost is increasing at 14% per year (or about 12% a year in inflation adjusted terms). Even at the median marginal cost level, costs appear to be increasing at a compound annual growth rate of 9% (or about 7% in inflation adjusted terms). See also this FTAlphaville post.
If we take the $92 barrel cost in 2011 at the 90th percentile of production and increase it by 7% a year (arguably we should be using 12% per year), the real cost will be $169 barrel in 2020, and $467 a barrel in 2035. These are far in excess of the IEA oil price estimates shown on Figure 2. There is no reason to believe that Bakken and other tight oil production costs would be substantially cheaper.
For Further Study, Based on a Recent IMF Analysis
It is very clear to me that the IEA oil estimates way too high, unless prices are much higher. Of course, prices can’t really be much higher, or the economy will go into recession. As a result, production both for the US and the rest of the world is likely to be much lower than forecast by the IEA.
It would be useful to have a better estimate of exactly where the world is headed. One way this might be done is by adapting the indications of a new IMF working paper called Oil and the World Economy: Some Possible Futures. The working paper considers some unknown time, between now and 2020, when the rate of increase in oil supply is assumed to decrease by 1%. While it is not stated in the report, it appears to me that this is similar to what actually happened about 2005, when the rate of oil production increase dropped from 1.3%” annual increase to 0.1%, a 1.2% decrease. (Figure 4, below).

I have a few observations regarding such an adaption:
(a) The model could be adjusted to consider the fact that a drop in the trend rate of about 1.2% actually took place in 2005, rather than simply assuming that a 1% decrease will happen at some unspecified point in the future. It appears to me that shift in the oil extraction trend line underlies many of the world’s problems in the last several years.
(b) The treatment in the model of diminishing returns should be adjusted. It is my understanding that this is currently handled assuming a 2% annual increase in real costs of production. The model could be adjusted to reflect a more realistic (higher) annual cost in oil production, and indirectly, required selling price.
(c) The authors of the IMF report suggest building a more resource-based model, and I would agree that this would be helpful. There are many interlinkages that the current model cannot adequately capture. A more resource-driven model, especially one that considers balance sheets of world governments, would appear to be better.
My View of What is Happening Now
As noted above, world crude oil production seems to have hit a plateau, starting about 2005. This is working its way through the economy with varying effects over time. The major effect at this point of time seems to be on the finances of governments that import oil, although it started earlier, with different aspects more apparent.
In general, what happens as we reach a situation of diminishing returns, and thus rising real oil prices, seems to be as follows:
As the price of oil rises, the price of food and commuting tend to rise. Both of these are considered essential by most consumers, so consumers cut back in discretionary spending, to have sufficient funds for the essentials. This leads to layoffs in discretionary industries, such as vacation travel and restaurant eating. The rise in laid off workers leads to an increase in debt defaults, and problems for banks. Housing and commercial real estate prices tend to fall, because of reduced demand, further adding to debt default problems.
Governments of oil importers get drawn into this in many ways: (1) Their revenues are reduced, because they receive less tax revenue from people who are laid off from work and from businesses with fewer sales. (2) They are asked to prop up failing banks, and to stimulate the economy. (3) They are also asked to pay workers who have been laid off from work. The net of all of this is that the governments of many oil importers find themselves with huge budget deficits, and declining ability to fix these deficits. This pattern is precisely what we are seeing today in many of Eurozone countries, the United States, Japan.
The statements about rising oil production in the US are just a distraction. Diminishing returns mean that US oil production will never increase very much. Oil costs will remain high, and this will be the real issue disturbing economies around the world.
Abridged version of a post at Our Finite World.
Contact
- Content: editors at theoildrum dot com
- Tech support: support at theoildrum dot com
License

This work is licensed under a Creative Commons Attribution-Share Alike 3.0 United States License.
Hi Gail:
I respectivefully think you made some pretty big mistakes in your reading of the EIA report:
The first is that the report says that North America - not the USA - will become a net exporter of oil by 2030: P1 EIA Executive summary:" The result is a continued fall in US oil imports, to the extent that North America becomes a net oil exporter around 2030." As a Canadian, I am allway amused that Americans assume our oil is your oil. We do love our big brothers and sisters to the south, but you do take us a little bit for granted and that is why the Canadian government would like to develop some friends for our oil in Asia by building a big pipeline to the BC coast.
You may also have confused energy self-sufficiency with oil self sufficiency. The former including coal, biomass, solar,wind, etc. P 2 EIA states "United States, which currently imports around 20% of its total energy needs, becomes all but self-sufficient in net terms." I think this is possible.
If the US were to invest a huge effort into digging up more coal and shipping it to China, then, yes, it may become "self-sufficient in net terms". Energy-wise that is, but not money-wise, since oil is more valuable than coal, on a per-energy-unit basis. Energy quality counts. And we'd still be vulnerable to global oil supply limits and interruptions. Thus "independence" in this sense may not mean much. Still, it is true that the US has huge energy resources. If we'd only cut down our per-capita usage to European levels (half of US levels) we'd be "energy independent" in a good way.
I think you mean IEA, not EIA. The IEA is based in Paris; the EIA is US based.
I will have to admit that with respect to the first sentence or two, I was mostly going by the newspaper hype, and may have read some newspaper hype wrong. I should have gone back to the original report, and tried to dig through and pick out exactly what matched what. If the IEA had some reasonable tables of their results, without trying to dig through the 600 page report, it would make life easier. When I get a chance, I will adjust that sentence, after I am certain I am sure what is right with respect to "all liquids", which is the issue at hand.
My post doesn't really depend on that particular sentence. The arguments are about their assumptions, especially with respect what price extraction can occur at.
I agree. Oileng quibbles about semantics and then basically ignores what the article says to use his supposedly helpful post to agree with the IEA report while skirting your argument entirely Gail.
It is not just semantics - there are some implications that most people in the media have missed.
This statement may be true as presented, but I think the implications should be very disturbing to Americans.
It is basically true because Canada is half of North America and has considerably greater proven oil reserves than the US - at least 8 times as much oil due to its vast oil sands.
Canada can ramp up its oil production substantially - potentially doubling its output - but it will be expensive oil, not cheap oil. Because Americans will not be able to afford to buy that much expensive oil, Canada will have to export the surplus oil to Asia. While highly lucrative for Canada, this is not much help for the US.
I think what they are trying to say is that the US will become self-sufficient in net total energy by burning its own natural gas and exporting the displaced coal production to Europe - to replace diminishing European supplies of natural gas. I don't think that this is the type of energy self-sufficiency that either Americans or Europeans had in mind.
The changing terminology in this report is obscuring the implications of what it is saying, and sending the wrong message to a lot of people, particularly those in the mainstream media and their audience.
You make a lot of good points in your post.
People don't understand what kind of world the IEA has in mind. Somehow, demand is supposed to be reduced greatly as well, especially in the New Scenarios and 450 Scenarios. I covered some of my issues with demand and substitution in a part of the post that is available on the Our Finite World version, but not shown above.
Hi Gail,
great article!
Actually the Figure one you have shows what the IEA believes about USA oil production
10 million barrel a day soon..
I was always amazed by the imagination the IEA people put into their outlook
(claiming that they represent the different governments ..)
but this time the imagination went too much
when one compares with the EIA estimate from Feb. 2012
the difference is beyond "words"
http://www.eia.gov/todayinenergy/detail.cfm?id=4910
not even 7 million barrel a day ..
so how comes that all media and all around the planet just put blindly the headline?
actually here is (unfortunately only in german)
http://www.tagesspiegel.de/wirtschaft/welt-energie-ausblick-energiewende...
but you can click on the graph what the journalist
digged out of the 600 page report (also for gas)
and yes: IEA believes Russia is going down!!!!
and concerning Iran.. 2015 supposed to go up again
(one wonders if the IEA people know already when the liberation war 2 of the
oil will be won?)
regards
Michael
About the IEA, a very important read is below :
http://petrole.blog.lemonde.fr/how-the-global-oil-watchdog-failed-its-mi...
Lionel Badal's investigation about the 1998 IEA report, when they tried to do a "honest", Hubbert and reserves data oriented report, the result being more or less the whole team being fired except Fatih Birol ...
That last "report" and the MSM noise around it is truly amazing.
You can also end up wondering to what extend it is a "communication leaflet" to pump the shale gas & oil investment bubble.
As described for instance in :
http://www.resilience.org/stories/2012-10-25/financial-co-dependency-how...
Yves, in one way Birol has done a good job - he has got some key PO facts into the report yet dressed it up as cornucopian. That way he gets to stay in post and tell the truth (kinda).
But great article Gail! And Lionel Badal's is a good read too.
Jon.
Yes Birol is playing on a thin line, in some more "off line" interviews he has been quite direct I seem to remember.
Bonjour, YvesT, pas trop découragé par les réactions sur l'article du Monde sur NDDL ?
Bonjour, lequel ?, il y en a plein ! :)
Mais sinon c'est clair que ce rapport délirant de l'AIE n'aide pas les choses.
Quel pathétique cette affaire...
Hi,
thanks yes i saw this "lemonde" blog.
actually really amazing that they presume that Russia goes down by 10%
(the russian government does not foresee this till 2030 officially.. but the BP numbers say that
they have static reserves for about 20 years ..)
but no decline for Europe (EU) ..
in my view the decline in Russia plus 5% annual increase might be starting giving full
pain to the EU really by around 2015..
by the way the nuclear power was downgraded also in the IEA report
by about 50 GWe from 630--> 580 GWe
too little compared to real possibilities ...
but anyway
michael
It is frustrating that the IEA does not make clear graphs of what is happening, and scatters numbers throughout the report, so that the analyst needs to look for them, and figure out for him or herself.
The taggespiel graphs in the report you link to are nice ones. They are pretty close to English, so that it is possible for readers to figure out what they are saying. The left graph is oil production; the right graph is natural gas production:
One minor point I should mention (that doesn't impact what you are saying, but may be of interest to numbers buffs) is that my graph, and the graphs the IEA shows with respect to oil production, do not include "refinery expansion". It is not really clear whether a person should include this or not in production numbers, because refinery expansion partly relates to imported oil. In particular, it occurs to the greatest extent when heavy oil is "cracked", and the shorter hydrocarbon strings take up more volume than the longer hydrocarbon strings did before cracking. For example, heavy oil from Mexico and from Canada would seem to contribute significantly to refinery expansion. Adding light shale oil to US mix would seem to add little refinery expansion. Refinery expansion amounted to 1,076,000 barrels to US "Total Liquids" supply in 2011, according to EIA accounting. (BP does not include refinery expansion in the numbers it puts out, with respect to production by country, but it would seem to be included in consumption by country. This is a reason for the difference between the two.)
I am fairly certain that in the total numbers, the IEA does not omit refinery expansion. It may in fact be included in other US production amounts--just not the oil analysis I was working off of.
frustrating..
actually i noticed that this year even the "key plots" are not shown anymore
but, after all they do it on purpose no?
otherwise people perhaps would not buy the message so easily
michael
The message is definitely more confusing this year, without good summary charts. I don't think that they really want people to know what is happening.
The EIA numbers show that crude oil and natural gas liquids (which is what is shown in the first chart in this article from the IEA report) is heading to 10 million barrels per day (likely for next year)
At the end of 2011, 8.1 million bpd from crude oil and natural gas liquids.
Now 9.076 million bpd from crude oil and natural gas liquids.
http://ir.eia.gov/wpsr/overview.pdf
From most recent week
6.709 million bpd crude
2.367 million bpd from natural gas liquids
9.076 million bpd.
http://www.eia.gov/dnav/pet/pet_sum_sndw_dcus_nus_w.htm
End of 2011
5.851 million bpd crude
2.15 million bpd natural gas liquids
8.0 million bpd crude oil and natural gas liquids
http://nextbigfuture.com/2012/11/us-oil-production-near-term-and-long.html
Hi advanced nano..
it seems that you mix oranges and apples or whatever juice you like.
thanks for the numbers anyway..
now as we are enjoying predictions ..
perhaps you observed the latest predictions and hard numbers for nuclear produced KWhe..
just have some numbers for China if you want..
latest saying:
http://www.miningweekly.com/article/china-cautious-but-still-committed-t...
the article itself has a few jokes.. but
Before Fukushima, many in the sector were expecting China to set a 2020 capacity target of around 80-90 gigawatts (GW), up from the current 12.57 GW. The new target has now been scaled back to 58 GW
this means 46 GWe new at most.. 26 under construction today = 26 GWe
so, even if Chinese manage to do wonders (5 year construction time ..)
they need to start construction of 20 reactors in the next three years now..
not a single one this year and last year.. will be difficult to reach the target..
the WNA http://www.world-nuclear.org/info/inf63.html
writes:
``The former head of the NEA said that full-scale construction of nuclear plants would resume in March 2012. "
now we are in November..
``Resumption of approvals for further new plants was suspended until a new nuclear safety plan was accepted and State Council approval given in October 2012 (see also Post-Fukushima review below).
Following the Fukushima accident, concern regarding possible river pollution will mean delays until at lest 2015 to the inland AP1000 plants which were due to start construction in 2011. "
hm.. 2015... do you understand this?
and new mines .. and well
please update your nuclear outlook against mine
(others are very welcome..).
It seems you can't even predict next year numbers anymore..
yes, right Kazakhstan had some by me unexpected great years for uranium
the rest of the planet followed my 2009 data ..
comments please
(ah.. please do not claim that it was all the unpredicted earthquake...
the cracks in old reactors in Belgium are not coming from earthquakes ..)
So I have won 5 out of our 7 bets so far.
http://nextbigfuture.com/2012/04/world-nuclear-generation-in-2011-was.html
Kazatomprom is on track to increase uranium production by 1200 tons in 2012.
Cameco is off 200 tons.
Cameco is still on track to start the production from the Cigar Lake mine in late 2013
and this should have substantial levels starting in 2014.
Ranger in australia is guiding to 3400-3700 tons for 100 to 400 tons more than 2011.
http://www.researchviews.com/energy/power/uranium/NewsReport.aspx?sector...
Olympic Dam has produced over 3000 tons in the first 9 months and is on track to 4100 tons versus 3853 in 2011.
http://www.bhpbilliton.com/home/investors/reports/Documents/2012/121017_...
http://nextbigfuture.com/2012/11/kazakhstan-uranium-production-is-up-8.html
Uranium predictions
      Brian Wang  Dittmar            midpoint    Actual
2010  56000 tons  45,000 tons        50,500 tons 53,663 tonnes
2011  60000 tons  45,000             52,500 tons 55,400 tonnes
2012  64000 tons  45,000             54,500 tons should be an increase to 57000+ tons

2013  68000 tons  45,000             56,500 tons
2014  72000 tons  45,000             58,500 tons
2015  76000 tons  45,000             60,500 tons
2016  80000 tons  45,000             62,500 tons
2017  84000 tons  45,000             64,500 tons
2018  88000 tons  45,000             66,500 tons
General increases from Kazakhstan, another Mongolian mine, Africa developing another mine in a new country (Tanzania)
http://www.reuters.com/article/2012/10/24/tanzania-uraniumone-idUSL5E8LO...
Cigar Lake and the other increases means that my uranium production bets look like winners for me through 2018.
On the generation side.
China will complete plenty of reactors over the next couple of years to offset Japan. Germany is delaying the shutdown of more reactors. Japan will start turning on more reactors. You had made the silly prediction starting in 2014 of the a big drop in generation based on uranium shortages that did not happen.
I will not win the generation bet in 2012 but I think 2013 is possible and 2014 and 2015 are definite and 2016 is likely. I think 2017 and 2018 will be good too.
It will not be as comfortably won but there will be enough new reactors.
012 India, NPCIL Kaiga 4 PHWR 202 generating
2012 Iran, AEOI Bushehr 1 PWR 950 started
2012 Russia, Rosenergoatom Kalinin 4 PWR 950 started and generating
2012 Korea, KHNP Shin Kori 2 PWR 1000 generating
2012 Korea, KHNP Shin Wolsong 1 PWR 1000 generating
2012 Canada, Bruce Pwr Bruce A1 PHWR 769 started
2012 Canada, Bruce Pwr Bruce A2 PHWR 769 started
2012 Canada, NB Power Point Lepreau 1 PHWR 635 started
2012 India, NPCIL Kudankulam 1 PWR 950 starting first week of Dec
2012 China, CNNC Qinshan phase II-4 PWR 650 connnected in 2011 but generating this year
2012 China, CGNPC Hongyanhe 1 PWR 1080 on track for Dec start or very early in 2013
2012 China, CGNPC Ningde 1 PWR 1080 on track for Dec start or very early in 2013
2013 India, NPCIL Kudankulam 2 PWR 950
2013 Korea, KHNP Shin Wolsong 2 PWR 1000
2013 Korea, KHNP Shin-Kori 3 PWR 1350
2013 Russia Leningrad II-1 PWR 1070
2013 Argentina, CNEA Atucha 2 PHWR 692
2013 China, CNNC Sanmen 1 PWR 1250
2013 China, CGNPC Ningde 2 PWR 1080
2013 China, CGNPC Yangjiang 1 PWR 1080
2013 China, CGNPC Taishan 1 PWR 1700
2013 China, CNNC Fangjiashan 1 PWR 1080
2013 China, CNNC Fuqing 1 PWR 1080
2013 China, CGNPC Hongyanhe 2 PWR 1080
2013 India, Bhavini Kalpakkam FBR 470
2014 Finland, TVO Olkilouto 3 PWR 1600
2014 Russia Vilyuchinsk PWR x 2 70
2014 Russia, Rosener Novovoronezh II-1 PWR 1070
2014 Slovakia, SE Mochovce 3 PWR 440
2014 Slovakia, SE Mochovce 4 PWR 440
2014 Taiwan Power Lungmen 1 ABWR 1300
2014 China, CNNC Sanmen 2 PWR 1250
2014 China, CPI Haiyang 1 PWR 1250
2014 China, CGNPC Ningde 3 PWR 1080
2014 China, CGNPC Hongyanhe 3 PWR 1080
2014 China, CGNPC Hongyanhe 4 PWR 1080
2014 China, CGNPC Yangjiang 2 PWR 1080
2014 China, CGNPC Taishan 2 PWR 1700
2014 China, CNNC Fangjiashan 2 PWR 1080
2014 China, CNNC Fuqing 2 PWR 1080
2014 China, CNNC Changjiang 1 PWR 650
2014 Korea, KHNP Shin-Kori 4 PWR 1350
2014 Japan, Chugoku Shimane 3 ABWR 1375
2014 Japan, EPDC/J Power Ohma 1 ABWR 1350
2014 Russia Beloyarsk 4 FNR 750
2015 USA, TVA Watts Bar 2 PWR 1180
2015 Russia, Rosenergoatom Rostov 3 PWR 1070
2015 Taiwan Power Lungmen 2 ABWR 1300
2015 China, CGNPC Yangjiang 3 PWR 1080
2015 China, CPI Haiyang 2 PWR 1250
2015 China, CGNPC Ningde 4 PWR 1080
2015 China, CGNPC Fangchenggang 1 PWR 1080
2015 China, CNNC Changjiang 2 PWR 650
2015 China, CNNC Fuqing 3 PWR 1080
2015 China, China Huaneng Shidaowan HTR 200
2015 India, NPCIL Kakrapar 3 PHWR 640
2016 France, EdF Flamanville 3 PWR 1600
2016 Russia, Rosenergoatom Novovoronezh II-2 PWR 1070
2016 Russia, Rosenergoatom Leningrad II-2 PWR 1200
2016 Ukraine, Energoatom Khmelnitsky 3 PWR 1000
2016 India, NPCIL Kakrapar 4 PHWR 640
2016 India, NPCIL Rajasthan 7 PHWR 640
2016 China, CGNPC Yangjiang 4 PWR 1080
2016 China, CGNPC Hongyanhe 5 PWR 1080
2015 China, CNNC Hongshiding 1 PWR 1080
2016 China, several others PWR
2016 Pakistan, PAEC Chashma 3 PWR 300
2016 USA, Southern Vogtle 3 PWR 1200
2017 Russia, Rosenergoatom Baltic 1 PWR 1200
2017 Russia, Rosenergoatom Rostov 4 PWR 1200
2017 Russia, Rosenergoatom Leningrad II-3 PWR 1200
2017 Ukraine, Energoatom Khmelnitsky 4 PWR 1000
2017 Korea, KHNP Shin-Ulchin 1 PWR 1350
2017 India, NPCIL Rajasthan 8 PHWR 640
2017 Romania, SNN Cernavoda 3 PHWR 655
2017? Japan, JAPC Tsuruga 3 APWR 1538
2017 Pakistan, PAEC Chashma 4 PWR 300
2017 USA, Southern Vogtle 4 PWR 1200
2017 USA, SCEG Summer 2 PWR 1200
2017 China, several
2018 Korea, KHNP Shin-Ulchin 2 PWR 1350
Great list thanks..
so we can see how badly nuclear does these days
you forgot to mention a number for 2012 up to August (IEA)
for the OECD countries ... about 85% of all ..
Jan-Aug 2012 down 11.2% relative to 2011
so you know already
http://www.iea.org/stats/surveys/mes.pdf
actually you might reflect on why Korea is down -1.9% this year even though
out of the newly 2 grid connected reactors both are in Korea and noticed as started end of January..
sounds like a bad start..
France is also down 6.4% .. (overall France up 2%)
according to the official PRIS list.. 2 others were reconnected to the grid in Canada after a long shutdown
http://www.iaea.org/pris/
2 constructions were canceled 2 were closed forever in UK -0.7 GWe
and only 3 new constructions began..
your list (from the WNA?) is double and tripple counting it seems ..
do you need this to feelgood?
also,
talking about
WNA (as an interesting source) has something to say on uranium mining ..
WNA expects 2012 production to be 52,221 tU. UxC predicts about 63,600 tU in 2012.
http://www.world-nuclear.org/info/inf23.html
so lets see .. but 2014 remains the magic year when Russia stops their delivery of 10 k tons equivalent to the USA
so far .. can't help it..
not my fault that nuclear power plants switch off before they are forced to switch off
my main numbers for produced kWhel are too high so far
you are off by large numbers now and for the next years .. face it
the next big future is not nuclear .. it is powerdown!
A lot of big talk from someone is trailing on the overall wagered predictions with 2 wins to my 6 wins. Plus you had to change models for your uranium predictions, because the model you made to make your bets was wrong. It would have been 7 wins to 1 win if not for the tsunami and mistakes at Tepco during the Tsunami. There are still many years for China and other nations to get back to building more nuclear.
In the early 2020s there will be 20% uprates from dual cooled fuel for South Korea's reactors. Other reactors will have dual cooled from from Lightbridge.
On the uranium side there will be more uranium from phosphate. (400-1000 more tons in the next few years and heading up to 7000 tons)
http://www.world-nuclear.org/info/phosphates_inf124.html
If there is any urgent need and prices move up, Kazakhstan is ready to rapidly ramp up to 30,000 tons per year. So any stumbles from projects in Africa or Canada will be offset with more production from Kazakhstan. There will be no reactors shutdown from lack of uranium, when the company can just make a deal and pay Kazakhstan to produce any shortfall.
Point Lepreau was shutdown since 2008 and was recently restarted.
http://en.wikipedia.org/wiki/Point_Lepreau_Nuclear_Generating_Station#Re...
Wolsong1 (a Candu) only took 839 days for retubing
http://www.world-nuclear-news.org/C_Korean_Candu_restarts_after_refurbis...
Japan should have significant restarts in the latter half of 2013 and into 2014.
China is talking down their nuclear targets now, but their target for 2020 was 40 GW prior to 2005 and then they are still exceeding that and will that level by 2015 with the completion of reactors under construction. I expect the targets will start heading back up. They are using the pause to shift to more Gen 3 and more advanced reactors. The Chinese companies are also aggressively selling to other countries. So we will see where if the overall levels of new nuclear build heads after 2020. Cameco is still forecasting 80 new reactors by 2020 (down from 95).
Hi,
interesting the points you do not reply to..
1) Korean produced TWhe down this year despite 2 new units
2) (nuclear) France is also down 6.4% .. (overall France up 2%)
perhaps i should have written overall french electricity was up 2% so far in 2012)
3) do you doubt the PRIS numbers?
in case at some point it even is too much for Fox news
(feel better?)
http://www.thedailyshow.com/watch/wed-november-7-2012/11-7-12-in--60-sec...
4) why don't you show the numbers from the PRIS
about shutdown reactors as well
and yes this might interest you .. some future earth shaking discoveries are required to solve those remaining
tiny problems..
Aging nuke plants add to Europe's economic woes
http://www.huffingtonpost.com/huff-wires/20121117/eu-eastern-europe-nucl...
Of 372 gigawatts of operational nuclear reactors, looking for about 7 Terawatt hours from each gigawatt of those reactors.
The average size of the existing fleet of reactors is 850 MW.
The two that were shutdown totalled about 707 MWe. So less than 1.
Wilfa 2 was operating between 36-75% of the time in the last 4 years. In 2011 it was at 61%
http://www.iaea.org/pris/CountryStatistics/ReactorDetails.aspx?current=241
Oldbury-A1 was at 54.1%-100% the last three years after a 2 year shutdown.
http://www.iaea.org/PRIS/CountryStatistics/ReactorDetails.aspx?current=237
The new reactors that are completing are average about 1080 MWe in size.
About 80 new reactors completing by 2020 and about 60-70 of them could be done by the end of 2018. Expected to add about 80 GWe. 80*7 TWh. 560 TWh.
Thus I am expecting an average boost each year of about 100 TWh of available capacity.
I am also expecting some uprates and those mainly offset the shutdown of small reactors.
The new additions have to offset the losses in Germany and Japan. I am expecting Japan to turn reactors back on over the next 2 years because of economic reasons. There are 50 reactors that should be operating in Japan. But Japan always only had about 60% operating factor even in better years. 44 GWe. But operating like a world average of 33-35GWe. By the end of 2014, the new reactors would offset the loss of Japanese reactors even if they were not turned on. I am expecting more than the two that are running now. So by early 2014, I am expecting the turned on Japan reactors and new reactors to get back to old generating levels which would be needed to win the generating bets.
All of the Japan reactors that could be operating (at old operating factor) and the new reactors by the end of 2014 should be in a +200-300 TWh position. Or about 2800-2900 TWh for a typical year. Better operations could boost it higher. Again each year thereafter should be 100 TWh better.
The Bulgarian reactors that were cancelled were probably not going to get completed until 2022 or later. No impact on our bets which end in 2018.
South Korea had some microcracks to repair and there was some corruption and unapproved parts.
Operational capacity is not 100% but averages about 78-80%. It is why each GWe of nuclear reactor provides about 7 TWh and not 8.76 TWh.
Operational capacity fluctuates for each country.
thanks for the reply
Nice, something as a hypothesis which can be tested!
7 TWh/per year for each GWe.. sounds about (almost) right!
372 (GWe) * 7 TWh = 2604 TWhe for this year right?
real for this year? will be below 2500 TWh right?
so not a perfect hypothesis ..
for next year starting number will be 372 GWe (now ..)
lets see what the real capacity will be at the end of 2013.. smile
for:
``Thus I am expecting an average boost each year of about 100 TWh of available capacity.
I am also expecting some uprates and those mainly offset the shutdown of small reactors."
thus 100 TWh possible each year stands in your hypothesis = 13 new reactors each year now..
this didn't work out since 2009 .. even the total number of new reactors connected to the grid
was just this (+12 GWe only..)
http://www.iaea.org/PRIS/WorldStatistics/OperationalByAge.aspx
but, at least you make some testable statements for the next few years!
regards michael
The generation for the world total is plus or minus 4 to 5% for a standard deviation. So a good year can have +100 to 200 twh and a bad year negative. 2012 is still a bad year. For our bets I am expecting to get beyond the variability for 2015 and 2016. 2014 would happen if Japan politics goes right. But I am onky expecting half contribution there.
great,
i like your new(?) approach
4-5% uncertainty = +- 100-200(?) Twh
so ``normal" central number = 7 TWh/year and GWe installed power (80% average load factor?)
don't know how you can make +5% but never mind..
thus 372 GWe (now) --> 2604 TWhe ?? +-??? for 2013
our bet is: (2011 was 2518 TWh)
2012= 2550 2700 2625
2013= 2525 2750 midpoint .. 2637.5
with OECD alone (Jan-Aug 2012 down 11.2% relative to 2011)
we know already don't we?
regards
Michael
ps... what are your uncertainties for uranium mining good and bad years?
The fluctuation in uranium mine production is a lot less.
The normal fluctuation would be if a mine hits a lower grade section (like what happened for the Australian mine.)
More common are strikes or an operational accident.
Strikes usually in places like Africa.
Operational accident was the damage to the Olympic mine a few years back or the flooding that stalled out the Cigar Lake mine.
I think the variability is only about 2% for uranium mines in a typical year.
Over the longer term is does not vary that much because if a mine underproduces or does not get started then another mine or country will pick up the slack. (ie Kazakhstan).
For operations. There has been an overall decades long trend to improved reactor generation. There has been efforts by the Ukraine and other countries to improve operations. Some places like Japan have rules that prevent better operations which force more frequent fuel reloading and more maintenance.
Over a decade I would expect the generation levels to increase to 7.5 TWh per GWe and then to 8.0 TWh per GWe in the decade after that. The retirement of old and underperforming reactors also edges up the rate.
There is also improving technology that boosts generation. Better uprating technology. Improved fuels which can lengthen the time between refueling.
There is improving technology on the mining side as well. The PhosEnergy system to cheaply get uranium from phosphate mines.
``I think the variability is only about 2% for uranium mines in a typical year.
Over the longer term is does not vary that much because if a mine underproduces or does not get started then another mine or country will pick up the slack. (ie Kazakhstan)."
until there are no new mines and ``new" countries left ..
``The normal fluctuation would be if a mine hits a lower grade section (like what happened for the Australian mine.)"
actually Rossing mine is a good example ..
but overall that is what I presented in my model, glad that you understand and distribute this
hypothesis!
``the end of cheap uranium"
http://arxiv.org/abs/1106.3617
so lets see how large the down fluctuations will be in 2012 and 2013
(2011 was not really a success years in your own definition)
Don't feel you are being singled out, my Canadian friend. I've often heard conservatives in the U.S. let it slip and speak of "our" oil which happens to be in someone else's ground on the other side of the planet. That's the crux of the problem when American energy policy is set by multi-nationals.
When I idly speculate about the distant future, I wonder about an effert to liberate Alberta (perhaps Saskatchewan & Manitoba too with Climate Change) from the tyranny of Ottawa (not a risk with the current PM).
Hopes for a Better Future than That,
Alan
Seems that everyone wants to buy into the tar sands these days so when you come to get "your" oil you may find that the Chinese, Indians, Norwegians and god knows who else have some say on that.
The area colored orange in the first diagram represents the last ditch effort to "mop it all up". Once thats gone, its essentially gone so we shouldnt really be in such a hurry. "Fracking" (recovering "tight oil" by anyother means) is a "mop-up" operation; it's not like we didn't know the hydrocarbons were there, or didn't have "Fracking", just that we weren't in a mop up phase back then, and it was unnecessary to employ such energetically expensive (tertiary) recovery techniques... with such urgency.
Essentially, advanced highly energetic tertiary recovery methods amount to a super straw; that is, the enhanced recovery does not change how much is there, but it does recover crude or "unconventional oil" or "tight oil" that was previously inaccessible using less energetic techniques as well as speed up recovery overall, with a trade off. What that does to the first graph is "fatten up and shorten the tail" (quite exaggerated here); more now less later - or, much more now, much less later. So, not just mopping it up, but sucking up (blasting out) the last "drops" with a whole bushel of super straws.
And the impending (existing) supply constraints of diesel fuel wont help the alt.energy efforts. Diesel fuel derived from crude is an absolute requirement in the construction and maintenance of wind, solar, hydro, you name it and there is no real substitute for it in large quantities, and all these things involve moving heavy objects and pushing lots of dirt.
Current trucks and bulldozers etc do require diesel fuel, and its shortage is a serious problem. But I wouldn't say that diesel "is an absolute requirement", since such vehicles could be rebuilt with gasoline engines, or modified to run on natural gas. At a significant expense of course.
If you are required to use a less suitable fuel for heavy construction equipment than diesel and absolutely must do some heavy constructing of some sort ~:), then you are in desperate straights of some sort....
Not to mention that every time you mention "rebuild" anything, you deduct ten carrots from the cart. ~;)
Not disagreeing with you PDV. Not only is it a mop up operation, it seems to be fizzling out because the current 'high' price doesn't even warrant mopping it up. Diminishing returns, production capacity limitations to building these expensive new wells and financial constraints are all playing roles that are only understood and commented on with insight on this site, by people working directly on the shale plays and others who get it. Nowhere else it seems.
But it does look like a stain that can easily be mopped up in no time on the graph doesn't it? ;)
Diesel fuel derived from crude is an absolute requirement in the construction and maintenance of wind, solar, hydro, you name it and there is no real substitute for it in large quantities,
Electric equipment will do quite nicely. Utilities like the idea of "eating their own cooking". Here's an electric utility boom lift. Here's a consortium of utilities considering a bulk purchase of plug-ins (and a good article). Here's an individual utility buying electric cars. Similarly, utilities are buying hybrid bucket trucks and digger derricks. Here's a large commitment by two major utilities .
Mining, for instance, especially underground, has been electric for some time - here's a source of electrical mining equipment. Caterpillar manufactures 200-ton and above mining trucks with both drives. Caterpillar will produce mining trucks for every application—uphill, downhill, flat or extreme conditions — with electric as well as mechanical drive. Here's an electric earth moving truck. Here's an electric mobile strip mining machine, the largest tracked vehicle in the world at 13,500 tons.
Synthetic fuel will do just fine for the small percentage of liquid fuel that would still be convenient in very remote locations or unusual applications:
Hydrogen from electricity: Wholesale wind power at 6 cents per kWh; 75% efficient electrolysis of hydrogen from water would require 50 kWhs to produce a kilo of hydrogen. That is $3 for hydrogen with 37.5kWh, or an energy equivalent to 1.05 gallons of gasoline.
We could react CO or CO2 with hydrogen to make methanol (the Lurgi process, in which one CO2 and three dihydrogens exothermically become one methanol and one water) at 80% efficiency (Methanol synthesis from syngas is actually highly efficient, in the order of 80-90%. Catalysis of CO2 into CO + 1/2 O2 is probably about as efficient as H20 into H2 + 1/2 O2 since that's the same entropy balance).
If the overall conversion is 60% efficient, you'd have $5 for the methanol equivalent of a gallon of gasoline. Now, that’s just input costs. If the capital cost of the H2O electrolysers is $1 per gallon, you're at $6 per gallon. That doesn't seem bad.
EVs are, of course, much more efficient: electricity to hydrogen(25%loss), hydrogen to methanol(say 25%loss), methanol ICE 75%-80% loss; only about 12% of energy recovered. Compare this with an EV 80-90% of electric energy into useful motion.
Today's electric drive trains cost about $.10/mile, including the amortization of the battery and electricity costs, for the first 30-40 miles per day. On the other hand, these costs rise quickly for the miles beyond that range, due to the battery overhead. If synthesized methanol costs $.20/mile in a PHEV ($6/gallon divided by 40mpg (what is methanol's octane?)), that's pretty cost-effective for the less often used extra range. The more interesting cases are water shipping, long haul trucking and aviation. If $6/gallon is really feasible, those things would go up in cost, but still be feasible (especially water shipping).
Gail, I agree with the main point of the article, great discussion in this post about EROEI and the general lack of consideration for future trends from what is presumably a well funded organization. I do want to challenge you on renewables however.
Unlike established technologies like oil extraction, refining, which have had time to mature, most renewables are nowhere near their potential. It'll be up to the reader to verify, but there are numerous charts, articles, and studies out there, from any number of trade and government organizations, it is fair to say that the cost of most renewables has been decreasing over time for the past few decades (Anecdotally I'm sure you'll agree a solar panel or wind turbine made twenty years ago is not more efficient, desirable, cost effective than one made today). Biofuels are also an interesting argument. Your comments about biofuel from biomass and algae are out of context. You are likely comparing bench/lab/demo scale economics to the mature technology of corn and by relation sugar for feedstock. Biomass and algae are very new technologies and thus should not be compared in the same light. In fact, if you believe industry estimates, many of these technologies if allowed to prosper, will produce greater returns as they develop.
So in response to your assertion that all markets see diminishing returns, that is true in the end of their product lifecycles, but at first they see increasing returns, particularly as technology advances. Next time make room to consider that we could be seeing two curves going in different directions, one down and to the right for fossil fuels, and the other up and to the right for renewables.
I agree that at first you do see increasing returns, as technological improvements make a given technology work better. And even that sometimes there are major breakthroughs. Even for mineral extraction, for a long time there were efficiency gains that overwhelmed reduced ore quality. So people got to thinking that that was the only effect, and a person could count on it, going forward.
My point is that there are a lot of obstacles, and there are reasons why things like cellulosic ethanol haven't been commercially successful to date. According to WIkipedia, the first attempt at commercial cellulosic ethanol was in 1898. If we are still a ways away now, it is not a good sign.
There are obstacles of other types that I did not mention, like "blend walls". It is easy to substitute the first 10% of the fuel than later portions. Than you start reaching problems with non-compatibility, and need to modify vehicles to handle the fuel that does not match vehicle specifications. In a way, this is analogous to the problem we reach in adding more intermittent electricity to the electric grid.
Part of the problem with substitutes such as algae and other biofuels is that we don't have a huge amount of time, now, to bring down costs to where they need to be with many technological advancements (assuming that they really can be done). Also, I am not sure people have set their sights low enough on cost. US infrastructure was build on $20 and $30 barrel oil. A big reason we are having problems now is because the cost of oil is so high now. We really need cheap substitutes for oil--things that would lower our current fuel price--to fix our financial problems.
Miscanthus can grow 20 tons per acre, gasify the biomass then use natural gas to yield 2000 gallons. Right now we grow 30 million acres of corn for ethanol. The same amount of land could make 60 billion gallons of synthetic gasoline. Sundrop, Core and others are working on this.
I like people who focus more on the problem of producing enough food with land available than more fuel as the implications of PO pinch more and more. I'm thinking permaculture, Savory Institute, lots of hedgerows. Not mining the soil with monocultures. Monocultures tend to use so many energy inputs its not funny.
This is a good point. We need land for food, and are likely to need quite a lot more land for food, as fossil fuels decline in supplies.
In addition, biologists are telling us that we are over-utilizing biomass right now. For example, this issue is discussed in the academic article, Approaching a State Shift in the Earth's Biosphere. What they were in particular concerned about was the impact on climate change. Raising the amount of biomass used in fuel production in not a good idea, regardless of some theoretical reduction in CO2 production.
We have 500 million acres of pasture land in the U.S. not being used to grow food. Miscanthus can improve land quality by the root structure returning carbon and nutrients to the soil.
I will not try to convince anyone here, if you want renewable energy for 200 million vehicles using liquid hydrocarbon fuels, this is one way. If you want to wait for millions of wind turbines and a million miles of wireless electric highways for all those EVs out there, then that is your choice.
Sitting around analyzing EIA reports, trying to debate how much oil is REALLY left does not seem constructive. We all know oil is a finite resource, once you refine it, burn it, then push it out the tailpipe it is GONE. It is WAY past time to plan and implement alternatives, I hope we all can see that.
Cal, the plan that I've been implementing for some time now rests on the conviction that none of these schemes to extract gallons of energy from pint bottles will come to anything, and that the religious faith that technology will always come to the rescue with some new twist, and that progress is inevitable and eternal, are mistaken: venerable myths (in the educated sense of the word) whose time is now ending.
So as a result, we all -- those of us who get to live through it -- will now negotiate, perforce, what JMGreer calls The Long Descent of industrial civilisation; or what Jim Kunstler calls The Long Emergency. My hunch is that this new era began decisively around 2005-2008 (though hard, precise boundaries of these processes are always rather artificial, of course).
Whether we like it or not, we'll adjust -- without the option -- to far fewer cars, making far fewer journeys; to intermittent and much less electricity; to austerity and scarcity both widespread and persistent; to the widespread delapidation of suburban sprawl, with actual abandonment of simply no-longer-viable exurbs; to the straightforward collapse, dissolution and disappearance of the US empire of bases; to the rapid and near-complete depopulation of large swathes of the dryland areas of the continental US, as they become simply non-liveable for large populations of humankind without a superabundance of cheap energy and distant, pumped water; and on...
And that will be simply to the end of this century. For a glimpse of what things might be like four centuries on, see JMG's online futurist installment novel 'Star's Reach', at 'The Archdruid Report' website; where, if you trawl through his archive there, you'll also find high-grade, highly realistic and intelligent examples of the sort of realworld, practical, hands-on plans and preparations that are going on right now, down in the grassroots, below the radar of 'our leaders' and their economic and business 'experts' -- all of those poor bemused aveugles trapped in the now-obsolete assumptions of the old era that came to an end in the first half of the decade just past.
Jim Kunstler gets very ratty at the way, even at the Aspen gatherings of supposedly savvy environmentalists, conversation keeps swinging round compulsively to the magical new-tech ways that all the cars can be kept running; when anyone looking with merciless realism at what's happening can see that that's just not going to happen; nor all the other grossly overindulgent excesses of the 'non-negotiable' American Way of Life. Kiss it goodbye folks, just as we here in Europe are being force-fed the same farewell to our only slightly less profligate version...
Practical permacultures tailored to many places, and the sort of intelligent and respectful use of grasslands now being propagated by such nodes as the Savory Institute, mentioned several times in the comments to this post, are the sort of seriously realistic planning for the immediate future that we need now. Eating the biosphere in a vain attempt to keep the current overpopulation of humankind living our current ways of life for a little longer -- especially the way of life of we of the global Pampered Twenty Percent -- is a zombie idea, already dead, and just waiting to fall over finally.
Considering all of the above, this latest exercise in delusionality put out by the compliant paid-hacks of the IEA is about as useful as a one-legged man at an arse-kicking party.
Miscanthus can grow 20 tons per acre, gasify the biomass then use natural gas to yield 2000 gallons. Right now we grow 30 million acres of corn for ethanol. The same amount of land could make 60 billion gallons of synthetic gasoline. Sundrop, Core and others are working on this.
I'd like to see references to that. That is HUGE volume, way more than any other agricultural crop we have, like, as in, double. How do you irrigate it when we run out of groundwater? Fertilize it when we run out of fossil fuels?
There is no way, I repeat NO WAY biofuels could ramp up to provide even a fraction of the energy we currently use, to make up the difference for when fossil fuels end, on a global basis, and especially in the US.
No way, not in a million years. Let's give it up, right now, toss the fantasy aside and move on to pursuing the only hopes we have: wind, solar and nuclear. Do the math, add it all up, and consider that the total Net Primary production of the planet has GONE DOWN, not up! Just because some engineer can come up with some reactor to turn an acre of grass into something you can burn in an ICE doesn't mean it can be scaled up to power the world. And just because some people have found that they can drive their diesel cars on old french fry grease doesn't mean it could power the world.
Wikipedia's page for Miscanthus x Giganteus, which does rather read like an advertisement, says that
3 250 US gal of ethanol per acre is 72 MJ/m2, which is about what the most productive sugar cane fields produce in total biomass. (The world average for sugar cane is in the 30s. Source: V. Smil, "Energy in Nature and Society", Ch. 3)
Although Miscanthus is a C4 plant (like sugar cane), it seems unlikely that it would perform at this high a level. It would have to outperform sugar cane's single field record, across the whole country. And in worse soils and climates.
But even if it only reaches 25% of the hype, CalGuy's 500 million acres would produce over 12 million barrels per day of ethanol (assuming a productive land use ratio of 50%, the rest being unsuitable for crops or machinery, and/or used for storage and service areas and access and transport corridors).
Seems too good to be true -- even at the price of land and waterway degradation, lost water for other uses, biodiversity loss, dust storms, etc., etc.
If we did the sums carefully, though, we'd probably find that the capital required to develop the land and build the ethanol plants would be better spent on vehicle efficiency and vehicle capacity utilisation improvements.
I don't advocate planting 500 million acres nor do I advocate making ethanol. We could use 50 million of the 500 million acres and make synthetic gasoline. This has been done, it is not magic nor wishful thinking.
I won't argue with people that just want to argue. I won't sit around and take bets on when we will run out of oil. I would rather come up with solutions so that we do NOT run out of oil, because we use less of it.
"we'd probably find that the capital required to develop the land and build the (ethanol) plants would be better spent on vehicle efficiency and vehicle capacity utilisation improvements." {it is not ethanol, it is synthetic gasoline I advocate}
If there is a $5000 premium for a hybrid car and we sell 10 million per year in the U.S. that is a $50 billion premium. If we do that for 10 years we pay $500 billion and we only have HALF the 200 million cars replaced with cars that get 30% better mileage.
A million gallon per day fuel plant costs about $1 billion. If we build 100 of those, we make 100 million gallons per day out of the 300 million gallons of gasoline consumed each day.
The fuel plant has a life of more than 40 years, the car has a life of about 10 years. So we will continue to replace cars that cost more and don't reduce oil imports ALL that much. I favor hybrids AND synthetics, we get where we want to go faster at lower societal costs.
Build renewable energy, and it takes very little to run it. Hydroelectric, solar, wind.
A synthetic gasoline plant requires massive resources to run, and lots of money as well.
I do wonder if the proposed grass to gasoline plant would have an EROEI >1. Having seen a number of these schemes, I am pretty sure the overall operating EROEI would not be high enough to be viable.
Alan
BTW, the average Americans car now lasts 18 years - I drive a 31 year old car (early production 1982 Mercedes Benz 240D with manual transmission).
I don't advocate hybrids, because they cost more. Improvements to ordinary IC engines have some way to go yet, at a much lower per-vehicle cost.
The big gains come from increasing utilization, which decreases spending required for road maintenance and expansion compared to the base case: that's likely to have a net negative cost over 10 years even including the investment in research and any new infrastructure.
I think North America will be energy independent by 2040. Consider,
1. Accelerating move to hyrbid and EV transport (and x/over to NG). Cheaper than fossil cars by 2030
2. Massive new NG reserves available for decades (many wells now being capped for future)
3. Cost of PV panels falling to 50-60 cents per watt by 2016 (they were $4/watt in 2008)
4. PV Microinverter technology falling to 50 cents per watt by 2020 (today is around $1/w installed)
5. Slow but certain increases in N.A. oil production (albeit at higher prices)
Germany is already generating 10% of their electricity via PV panels, and one report puts German electricity at 100% renewable by 2050. With rebated U.S. home PV now under $2.00/watt installed and grid-tied, I think we're on a similar trajectory. Electric vehicles are now paying back in 6 years. By 2020, equivalent payback should be around 3 years. And by 2030, assuming oil prices continue to rise, non-EV road transport will be economically silly.
That said, I've studied peak oil for a decade and am still convinced that global oil demand vs. supply will cause increasing economic hardship. North American oil demand will be falling, but the 2/3 world (Africa, China, India, E Euro, Indo, etc.) is coming alive and will demand increasing supplies of increasingly expensive oil. Those regions will feel peak oil's economic effects the hardest. North America will feel the pain indirectly by not being able to sell as much stuff into those regions whose growth rates will be impacted by higher oil costs. Hopefully, by 2030, peak oil's global impact will be partially mitigated by the proliferation of EVs and ultra-cheap PVs.
With respect to peak-energy, I remain convinced that the most important number to watch is "household energy expenditure as a percentage of non-discretionary expenditure." In the last 10 years, that number has effectively doubled. The larger the %, the slower our economy will grow.
As for your 5 points, you omit a high price for crude oil spurring demand destruction and increasing efficiency. That has been the main factor decreasing U.S. consumption of crude oil since 2007.
I think a big factor in reducing crude oil use is the reduction of people in the labor market, because they cannot find jobs. Young people without jobs do not buy cars to drive to jobs (and to drive otherwise). Others who have dropped out of the labor force find that they too have to drastically cut back on driving, to help balance their budget.
When we look around the world at where oil use is rising, it is rising where people have jobs. Economist talk about "demand," but I think they should say, "ability to afford" oil. People with good paying jobs can afford cars and vacations that use oil. The jobs themselves tend to use oil as well, for making and transporting goods. So oil usage goes where the jobs are.
Efficiency may play a role too, but it seems to be a smaller one.
Gail, when are you going to reveal the master actuarial formula that combines f(t) variables of: macro- and micro-economic dynamics, global and regional energy demand, global and regional supply constraints, highly interdependent future trends, environmental penalties, national risks, investment and government incentives, and the impact of all other variables on national and global GDP?
This is why peak energy residual is difficult to predict. We need that formula!
Quite a lof of my posts are on Our Finite World, but not on The Oil Drum. (If nothing else, there seems to be a limit to the proportion of financial stories that TOD wants in its mix--which is OK--every site has to have its own focus.)
One recent Our Finite World post about energy use and employment was this one: The Close Tie Between Energy, Employment, and Recession.
That is a brilliant piece of work. Bravo. Reminds me yet again that no matter how hard we try to identify the variables, there are always more, hiding.
Yes, all it took to reduce the USA's oil consumption by 10% (1.9 million barrels per day) was the ejection of six million people from the work force. [sarc] The next 10% will be harder. That might take 12 million. [/sarc]
Combined net oil exports from Canada, Mexico, Venezuela, Argentina, Colombia, Ecuador and Trinidad & Tobago (oil exporters in the Americas with 100,000 bpd or more of net exports in 2004, BP):
And my comments regarding the IEA report:
The increase in US crude oil production (Crude + Condensate, EIA), from 5.4 mbpd in 2004, which was our production level prior to the 2005 Gulf Coast hurricanes, to 5.7 mbpd in 2011, and to an average production rate in excess of 6.0 mbpd in 2012, is good news, from the point of view of the US economy.
However, it’s critically important to understand that the overall rate of decline in oil production from existing wellbores is going up, as an increasing percentage of US crude oil production comes from shale oil plays, which have a very high decline rate, much higher than the older conventional fields, such as the Prudhoe Bay Field in Alaska. Inevitably this results in the “Red Queen” problem, where US oil producers have to run faster and faster, just to stay in place.
Meanwhile, the primary factor affecting US consumers at the pump is a measurable post-2005 decline in Global Net Exports of oil (GNE*), with developing countries, led by China, so far consuming an increasing share of a declining volume of GNE. This bidding war for net oil exports drove the annual global (Brent) price of oil from $55 in 2005 to $111 in 2011. Note that US consumers are almost fully exposed to the global oil price, since Mid-Continent refiners are paying West Texas Intermediate (WTI) based prices for crude oil, but largely charging Brent based prices for refined product.
As Yogi Berra is reported to have said, “It’s tough to make predictions, especially about the future,” but when we review recent annual net export data, from 2005 to 2011, the trend is extremely worrisome, especially in the context of conventional wisdom that there does not appear to be a problem with a virtually infinite rate of increase in our consumption of a finite fossil fuel resource base.
In 2005, the ratio of GNE to Chindia’s (China + India’s) Net Imports of oil (CNI) was 8.9. In other words, for every barrel of oil that the Chindia region net imported, there were 8.9 barrels of GNE (Global Net Exports of oil). In 2011, this ratio had fallen to only 5.3, and the rate of decline in the ratio accelerated from 2008 to 2011, versus 2005 to 2008. At the 2005 to 2011 rate of decline in the GNE to CNI ratio, the Chindia region alone would theoretically consume 100% of GNE in only 18 years.
While the increase in US crude oil production is very helpful, and important to the US economy, the fact remains that the US, and most other net oil importing OECD countries, are gradually being priced out of the market for exported oil. And it remains to be seen how long the US can maintain year over year increases in US crude oil production, when the bulk of new supply comes from probably the highest decline rate wells we have ever seen in the US.
In any case, for an average US consumer, the price at the pump, for the foreseeable future, would appear to be largely driven by the fact that the developing countries, led by China, have been consuming and probably will continue to consume, an increasing share of a declining volume of Global Net Exports of oil.
One thought as saw that the IEA was planning on big increases in oil production from Iraq and Brazil was, "Why would these countries export the majority of their new production? They have populations of their own that need more oil supply."
I would agree that if they can ramp up production (and that is not all that certain) they may agree to export some. But just as likely, they would want to use it for their own people. If they can, they would like to make higher priced products from it, and sell those, so that they can get additional revenue for the additional value added. (Of course, with enough refineries around the world, this doesn't entirely make sense.
So I expect even if production does ramp up, exports will lag behind a lot. This is also true in Iran.
Wes,
driz mentioned the year 2040. I have not noticed a projection by you that goes so far into the future. I should think that such a projection would be very iffy, given that peak was between five and ten yrs ago and 2040 is wildly far in the future compared to that little span of data. But you have looked at the data far more deeply than I. What say you?
I think the ELM estimate of Global Net Exports is that they decline as a linear function of time, not as a negative exponential. If that really is what happens won't North America be, per force, 'independent' because there won't be any oil to import at any price? And won't this be true well before 2040? Can you think of any complicating effect that might be added to your model to extend the import dependence era out as far as 2039?
Here is a link to my post down the thread regarding my $64 trillion question, which has some additional data:
http://www.theoildrum.com/node/9622#comment-930164
And here is the key part of my above post:
Some additional info. All of the following estimates are based on extrapolating six years of declining ECI values or declining GNE/CNI values (1995 to 2001 for the Six Country Case History and 2005 to 2011 for Saudi and global data):
Estimated Six Country post-1995 CNE:
9.2 Gb
Actual Six Country post-1995 CNE:
7.3 Gb
Estimated Remaining Six Country post-1995 CNE, at the end of 2001:
3.7 Gb
Actual Remaining Six Country post-1995 CNE, at the end of 2001:
1.8 Gb
Note that the actual Remaining Six Country post-1995 CNE, at the end of 2001, was about half of the estimated value.
Estimated post-2005 CNE for:
Saudi Arabia: 45 Gb
GNE: 445 Gb
ANE: 168
Estimated Remaining post-2005 CNE, at the end of 2011, for:
Saudi Arabia: 28 Gb
GNE: 349 Gb
ANE: 87 Gb
geek7,
Exxon and others show projections to 2040. It's just another opinion on the map, a data point of interest, but little more. After a while, you see that everyone's data points carry the weight of their own special interest. And even the best independent energy projections rely on dynamic data, subject to change over time. Look at some of our peak oil energy projections from 2002-2005. We couldn't have anticipated N.A. shale oil, fracked NG, the remarkable drop in PV energy cost, and other dynamics re-shaping our projections.
PV's trajectory is clear -- we will achieve effectively free daylight electricity by 2040. By that time, installed PV will be somewhere in the range of 60 cents /watt, which is the system-life equivalent of 1.3 cents per kwh. Evening electricity costs will be offset by grid-tie credits, making electricity effectively free. This is a game-changer. Germany is already achieving 10% of their electricity via PV, and on some days up to 30%. One report puts Germany on track to achieve 100% renewable national electricity by 2050
http://thinkprogress.org/climate/2012/06/12/497984/solar-provides-10-of-...
This accelerated move to "free" electricity will continue to spark massive dollars of research into electrical storage and more effective EV vehicles. By 2040, I would not be surprised to see pure-EV vehicles that exceed in every respect the performance of fossil or even hybrid vehicles. Exxon thinks the USA in 2040 will be using 15% less oil than today. Based on our trajectory towards free electricity, I think we'll be using less than 15M b/d.
This move to PV will also cause a massive shake up in the nature of "power company." Big, big changes ahead, and perhaps more than any other country, the USA stands to benefit greatly. Energy independence by 2040, if not sooner.
Main problem with renewables that produce electricity (PV, CSP, wind, hydro, etc) is that storage is neither easy nor cheap. Right now in St. Louis the wind is calm, sun went down 2-1/2 hours ago, Mississippi river is near record low for this time of year (dams near St Louis have hydro), so how do we use renewables to keep the lights on here? Although not being the best solution, coal, nuclear and gas are making the kilowatts for us.
I don't beleive that EV's will make serious inroads into our transportation beyond more than 10 or 20% of the auto/light truck fleet as long as liquid fossil based fuel is available. Even if gas or diesel costs $6 per gallon people want the ease of refilling and security of long range, besides needing a low cost vehicle. Perhaps EV's will become a major part of the fleet when people of the middle class simply cannot afford cars and opt for using trains (if available in the future) or just staying home.
"I don't beleive that EV's will make serious inroads into our transportation beyond more than 10 or 20% of the auto/light truck fleet as long as liquid fossil based fuel is available."
But 30 years is a technological eternity. By 2040, 75% of all cars will drive themselves (IEEE Forecast). By then, EV technology will best fossil propulsion in ALL respects - efficiency, range, cost, emission, etc.. The cost of daylight charging will be inexpensive, and a single charge will run hundreds of miles. By 2040, non-hybrid transportation will be a historical relic, though many specialty vehicles will still use pure fossil drives (aircraft, certain trucks, trains, etc.). Hybrid sales will triple by 2015 alone. And the long-term chart slopes up dramatically from there.
Today in USA, 75% of fossil oil is burned in automobiles, trucks, and home heating. By 2040, reduce that demand by at least 50% (probably closer to 75%). North America will be using FAR less oil in 2040 than it does today and I'm convinced (for reasons stated) we will see energy independence by 2040. Most industrializing countries cannot make that same claim and will be impacted by increasingly expensive oil.
"Main problem with renewables that produce electricity (PV, etc) is that storage is neither easy nor cheap"
But we don't need to be 100% renewable to be energy independent, though the more the better. By 2040, the mix of PV, EV, cheap NG, and other emerging tech will have ushered N. America into a new age of energy freedom. It's not N. America's energy future that concerns me. It's the industrializing countries and the price of global oil. Peak oil remains real and will impact global prosperity.
driz wrote:
The cars that are left perhaps. Auto Addicted personal cars are not sustainable by any means in the millions they exist today. What will be essential will be "Grid Electric Vehicles" ie Trains, LightRail, trolleys for public transit. Auto addicted Americans always make the mistake of assuming that the only problem with Auto Addicted transit is how to fuel your 2 ton personal vehicle.
But the problem goes way beyond that to the huge costs of the infrastructure and support issues around Auto Addiction - the 30K deaths per year, hundreds of thousands of injuries, the ambulance squads and traffic cops paid by our tax dollars or contributions, the football field of asphalt for every 5 personal cars, the waste of 12x the land area for personal autos or trucks. There is already transit available which does not require millions of personal drivers - ie trains, lightrail, buses.
The whole "self-driving" personal vehicle is a hi tech solution to a problem which does not need to be solved in the same category as electric can openers, leaf blowers and auto dispensing paper towels. It actually gains nothing at huge expense versus existing solutions. Ie. manual can openers, rakes, manual paper towel dispensers and public transit.
The shutdown of the Green public transit in NYC and New Jersey provides an object lesson in the amazing efficiency of trains in transporting huge numbers of people efficiently, quickly and safely. While the subways to Brooklyn & Queens were shut down before buses were brought in to provide limited replacement people faced 5 1/2 hour drives that used to take 20 minutes on the subway. Even the buses could not handle the huge influx of people as people queued for bus after bus for very long waits. When the NYC bridges were opened for all cars without requiring multiple riders for 1 day it was a total traffic nightmare. Even now NJ Transit (nee New YORK Transit as it actually operates) is crippled without our Hoboken trains. The 50% of trains on my line running are crammed like sardines when they leave NYC with people not only filling every seat but every spot in the aisles and between train cars. But those people could NEVER be handled in any fashion if they drove cars in the hundreds of thousands.
Interesting is that several reporters for WNYC rode their bikes to the station and
beat drivers or buses!
Auto ownership is declining and will decline at an accelerated pace, many young people are not even bothering to get driver's licenses, and auto miles driven are also declining.
I do not know why so much effort has to be wasted on sustaining what Kunstler aptly calls
"Happy Motoring by any means"?
We should be focusing on EV options for shuttle vans, buses and taxis.
Personal cars are NOT a good thing by any energy source.
Yes, all good intentions, but ignores the reality of American geographics. More people are moving to the cities, but masses of people still live suburban and rural, and that's not going to change.
"Auto ownership is declining and will decline at an accelerated pace."
That's good news, but the reality is that we're still buying 13M vehicles each year during bad economic times, and 15M/yr before the economic crash. Auto ownership is declining slightly, but demand deceleration was a result of 2008 crash.
Kunstler is great and I love him, but finger pointing and name calling goes only so far. Personal cars are clearly NOT a benefit to energy conservation. But the political reality of the personal car is woven into the American psyche. If I lived in a city, I would probably use a pub-trans, and hire a ZIP car when I needed to. But I live in a rural location, like millions of others. Public transportation doesn't exist here. Nor would it be practical.
Anyway, you make a bunch of great comments and have great ideas. Keep pushing them forward.
Mr Rockman, Paging Mr Rockman.
Is this true? Have you or your buddies been capping any NG wells recently? Spent your $7,000,000 & decided you don't need the income? Or is that proprietary information?
April 2012 - "So much natural gas is being produced that soon there may be nowhere left to put the country’s swelling surplus. After years of explosive growth, natural gas producers are retrenching... Some of the nation’s biggest natural gas producers, including Chesapeake Energy, ConocoPhillips, and Encana Corp., have announced plans to slow down... There hasn’t been enough demand to use up all the supply being pushed into the market... Analysts say that before long companies could have to start slowing the gas flow from wells or even take the rare and expensive step of capping off some wells."
http://www.bostonglobe.com/business/2012/04/08/natural-gas-glut-means-dr...
It makes rational sense to do so; I've just never heard of it happening - although 20 years ago I saw what appeared to be a capped well south of Fort Simpson. I'm not denying that you have more information than me, I'm just having a hard time correlating the two quotes, which don't appear to have exactly the same meaning. And neither seem to explain the reports of extensive NG flaring.
Sorry, poor choice of phrase. "Capped" as in it is economically unsustainable to drill for $2 gas, and some energy companies are now self-limiting ("capping") their rate of drilling. "Gas companies had pinned some of their hopes for higher prices on the sliding number of new drilling rigs. Active U.S. gas rigs had plunged 49 percent this year, according to Baker Hughes Inc. (BHI) The count was 413, the company said Nov. 9, compared with 809 in a Dec. 30 report. It was the lowest U.S. gas rig count since June 1999." http://fuelfix.com/blog/2012/11/14/natural-gas-prices-doomed-to-stay-low...
I'm sure nobody else cares, but it's probably one of these pads, still about 100 km to hook up to Pointed Mountain Kotaneelee NG pipeline.
60°38'16.84" N 122°57'09.17" W
60°46'48.19" N 122°39'27.15" W
The huge surplus in US natural gas (NG) storage has almost completely vanished, and currently US storage levels are just slightly above the upper limit of the five year average. And NG prices have about doubled from their spring time lows.
But here's the problem. The overall decline rate from existing wellbores is much higher than at the start of the shale gas drilling boom, and I'm sure it's the highest we have ever seen in the US. It remains to be seen whether, once the shale gas drillers have materially slowed their drilling, which they have now done, we will be able to fully offset the underlying decline rate.
"The huge surplus in US natural gas (NG) storage has almost completely vanished, and currently US storage levels are just slightly above the upper limit of the five year average. And NG prices have about doubled from their spring time lows."
NG supply is down and prices are up in part because we've halved the number of active drilling operations since 2011. I read that we're now seeing the lowest number of gas drilling rigs in operation since 1999. They didn't stop drilling because the NG ran dry. They stopped drilling because excessive NG supply killed profit margin. Many drillers have announced cutbacks to their NG volume into 2013, not because of supply constraints, but because of the bottom line. Andarko says they need to be at $5 to commit capital into new NG drilling. We're currently at $4. This industry-wide adjustment will deliver lower NG supply in 2013 compared with 2012. Entirely driven by economics, not supply.
The reality is that we are now awash in newly available NG reserves. Supply and price will bounce around for some years while market forces find dynamic equilibrium, especially as the global markets start opening up to U.S. NG.
I'm virtually certain that the shale gas players have also delivered the highest overall decline rates we have ever seen in US natural gas wells.
It's interesting that the decline in Texas natural gas well production, which has the longest recent history of modern shale gas drilling and completion efforts, started in 2009 (RRC).
bryan - Being privately owned and not owing a penny to the banks we are one of the very few companies that can reduce the production from our NG wells. Of course our biz plan is proprietary which is why I don't mention my companies name nor would you every see a press release from us.
Public companies offer a lot of data. And you might see some say they are considering cutting back production but few actually do. For the majority of companies maximizing profit isn't as important as maintaining cash flow. During my career I've seen many more companies try to increase production during low price periods than decrease. And no one every "caps" a productive. You might reduce the rate or shut it in completely for short periods. But you can't shut most wells in indefinitely...you'll lose the lease. And all leases expire if you don't drill them in the primary term (usually 3 to 5 years). This has been a serious problem for companies that spent hundreds of $millions for leases in the dry gas shale trends. They can't sit back and wait to drill those leases in another 4 or 5 years when NG prices will be higher. They're in the basic "drill it or lose" trap. And current prices prevent them from drilling many of those expensive acreage positions.
Gas reserves for decades? Heck...for hundreds of years. LOL. I have no doubt we'll still be producing oil 100+ years from now. But notice how I didn't say anything about volumes or costs. Any idiot can predict the production of any commodity many years out if they don't specify how much will be produced. Empty words IMHO.
Thanks Rockman, pretty much what I thought you would say.
Of course the one capped well we know that is infinitly productive is at Gull Island. If that lease has expired you should go up there, poke a hole and become wealthier than your wildest dreams.
Bryan
"Any idiot can predict the production of any commodity many years out if they don't specify how much will be produced. Empty words IMHO."
Predicting the future is always "empty words." But.. I don't think it unreasonable to assume 15-20 years of $4-5 NG from current reserve estimates. Take PGC's estimates. Fifteen years assumes 60% of their "probable current reserves", 0% of their "possible reserves", and 0% of their "speculative reserves." That's just 10% of their "potential total gas." Not unreasonable.
Ultimately, a couple decades of cheap NG will improve our economic vigor and air quality, but it's not essential to the end goal of U.S. energy independence. In 15 years, PV will be so cheap that generating electricity using fossils will no longer make sense. Actually, we're practically there today. PV payback has gone from 12 years (2008) to 5 years (today). In another 15 years, we should be at 2-3 year payback. That's less than 5 cent/kwh. And by 2040, 2 cents/kwh -- effectively free electricity. Generating electricity from fossils will be a footnote of history.
Driz – “But.. I don't think it unreasonable to assume 15-20 years of $4-5 NG from current reserve estimates.” Heck…let’s make it even easier…let’s try forecasting just with a 10 year time span. So in 2001 when Henry Hub was selling for $9/mcf would you have predicted the low price of $4.50 ten years later? OK…let’s make it even easier…will just tune our crystal ball to just a few years in the future. So when the price was $2.50/mcf in 2002 would you have predicted $7.50/mcf in Jan 2003? And when the price was $6.50/mcf in 2005 would you have predicted a doubling to $13/mcf just a year later? And when it was $13/mcf in 2008 would you have predicted $3/mcf just a year later? When prices were $5.80/mcf in 2010 would you have predicted $2/mcf in 2012?
Current reserve estimate? I assume you mean proven commercial reserves. The EIA increased their reserve estimate constantly during the time period I ran thru above from 200 tcf to around 300 tcf. That number is not solely a function of how much proved technically recoverable NG is in the ground but obviously depends on the price of NG. So when prices dropped from $13/mcf to $3/mcf the EIA actually showed an increase in proven reserves. Does anyone believe the EIA used $3/mcf in their calculation?
Remember the technically recoverable NG reserves in the shales have been known for decades. I personally did that math 25 years ago when I toyed with the Eagle Ford Shale, 10 years ago with the New Albany Shale in KY and just 4 years ago with the Haynesville Shale in E Texas. The EIA can say whatever they like…they don’t pay for wells to be drilled. But when I was with Devon and NG prices dropped from $13/mcf in 2008 to $3.5/mcf less than a year later their proven NG reserves plunged to a small fraction of its previous level. As result Devon paid a $40 million cancellation penalty to drop 14 of the 18 rigs they had running in the Haynesville Shale. And they weren’t alone. Last I saw the NG drilling rig count has dropped around 70% from the recent peak. Folks still have difficulty understanding the simple concept of the dependence on price for the level of hydrocarbon extraction. Equally they have trouble seeing the time lag factor. When the price drops the existing wells don’t disappear. Some companies, like mine, might reduce rates some but the vast majority can’t afford to do so.
So in 2002 when the price was $2.50/mcf who would have predicted cheap NG for the next 10 years? How about just 5 years? How about just 1 year? Given the price increase 300% in one year in 2003 it would not have taken long to prove such prediction foolish. But everyone has a right to their opinion. I’m sure I won’t be kicking in 15 -20 years so I won’t know how good your prediction will be. So let’s try a short term: what do you predict the average price for the years 2013 and 2014? Even better…how about March 2013?
@ROCKMAN "So in 2001 when Henry Hub was selling for $9/mcf would you have predicted the low price of $4.50 ten years later?"
In 2002-2005, our PO energy projections looked very different than today's reality. We could not anticipate fracked NG, shale oil, the accelerated drop in PV price, etc.. I'm not interested in predicting spot prices. I'm interested in overall trends, and how those trends impact our energy future. I think it's clear that we are looking forward to cheaper NG for the next 10-20 years -- cheaper than we had anticipated in 2005. You're welcome to push back on that assumption, but it's an assumption based on many consistent data points. Bottom line: in the push to U.S. energy independence, NG at $5 or $10 isn't going to make that much difference (with coal is a backstop).
I do think that the next 30 years will bring massive and, to date, largely unanticipated changes to our electricity infrastructure. And these changes will change some core assumptions of our net energy equations - very favorably. I think the USA is in for a strong energy future. On the other hand, countries that are now industrializing and ramping up oil demand are probably in for some hard times.
Price brought that new supply to market and, ultimately, failure to compete on price will bring down these fossil fuels. Hopefully, it will happen soon enough to deal with climate change.
Robert,
If PV continues on its 30 year trend line, by 2050 U.S. coal and natural gas electric production will have dropped by >50%, with most electricity being generated by clean, renewable power sources. And not just in USA. Dirt-cheap PV will become practical globally, displacing a large percentage of dirty generators. I also think that this rapid move to PV will spur new developments in storage, leading to practical EV "world cars" by 2040, displacing oil as our #1 passenger car fuel. The N. American energy future looks far brighter than it did 10 years ago, which is great news for the environment.
Driz,
You are supposing multiple visits by the "Just in Time Technology Fairy". I go not have such faith.
I expect more declines in inverters and "balance of system" than in silicon going forward. And chemistries other than silicon do not currently appear to be likely "low cost leaders".
Solar PV costs held steady for several years as demand > supply. Then that reversed and solar PV prices plummeted.
I can see a modest trend down in price from 2012 for solar PV, but not the massive drop seen recently.
Alan
Alan, I agree that PV prices have historically not fallen in a straight line. But when I extend the PV eff/cost curve back 30 years, I show a doubling roughly every 7 years. Given that we're pouring more money and resources into PV now than any other time in history, I don't see the 7-year slope changing dramatically. I do agree that the last 2-3 years have overshot the slope, and we're likely due for a correction.
I agree on inversion - I see micro-inversion dropping to 15-20 cents. And as panel efficiency increases, we'll need fewer of them to achieve the same power target, significantly lowering installation and rail costs, as well. If we can continue on the 7 year PV slope, we will be at 0.01/kwh by 2040. Heck, even the most conservative estimates are showing 60 cent panels by 2020.
"chemistries other than silicon do not currently appear to be likely low cost leaders"
There is excellent science being done on "alternative chemistries" worldwide, at a pace never seen in PV history. I think we have a reasonably good chance of staying on the 7-year slope for another 30 years, at least until we hit something close to 50% eff. And if we stay at 32%, our 2040 installed cost becomes 0.02-0.03/kwh -- still far below grid parity and the certain displacement of most gas-coal-nuke electricity generation by 2050.
As for EV-ICV parity by 2040, I'll take that bet! Four years ago I would -not- have taken that bet.
As of 2011 PV generated 3.8 per cent of end use electric power in Germany (Fraunhofer ISE, Fakten zur PV, 14.11.2012)
May 2012: Solar Provides 10 Percent Of Germany’s Electricity
http://thinkprogress.org/climate/2012/06/12/497984/solar-provides-10-of-...
It may vary from month-to-month, but the number is real. What's more, on the 25th and 26th of May, Germany was able to meet one third of its peak demand with solar alone.
German data:
2012 around 5% of the electricity will be produced by PV, while all renewables provide around 24% of the electicity, the most important contribution (~8%) comes from wind.
Power: With 30 GW installed PV we can expect next year days with more than 20 GW PV betwen 1 and 4 p.m.; 2011 the highest power from renwables were >32 GW a day in September (16 GW PV, 16 GW wind + unknown amount biomass), this meant >45% of the power came from reneables. I really hope we see more of these days in 2013 to test net stability.
People seem to confuse generation capacity and amount of electricity produced. Electricity panels aren't producing electricity a very large percentage of the time (since it is night, or cloudy, or during winter, with very short days).
I am not sure how one tells how much solar electricity is used locally (for example in Germany as opposed to the rest of Europe). Presumably, more of it would be used locally than wind, since there is demand for electricity during the daytime when the sun is shining. Demand is less clear for wind, since it often blows at night, when it may not be needed.
If you are interested in daily demand curves for Germany then you can check:
http://www.ise.fraunhofer.de/de/downloads/pdf-files/aktuelles/stromprodu...
Here the intersting pictures start at page 67.
Most of the PV is used locally, that is the reason that net stability increased in Germany during summer. In future the critical situation will very likely occur in winter when windpower changes very fast.
From a purly economic POV the electricity from on-shore wind is with modern turbines at good sites already competitive, as NG prices have increased dramatically the last years, with 5-6 cent /kWh wind beats already non combined cycle NG power plants, here press releases of the lignite producers comparing electricity production prices for NG and lignite in 2012:
http://www.braunkohle.de/pages/infos.php?page=42
Oktober 2012-release, page three.
Yes, there's some confusion between installed capacity and actual production. I think Fraunhofers figures are correct, 3.8 per cent from end use electric power.
It should also be noted that Fraunhofer is in favor of renewables, those 3.8 per cent are not from a fossil lobby group. The document I was referring to is here. (In German)
driz, it would be great to see a scenario with both of these occuring.
I think it's inevitable. Today you can buy a PV panel for 80 cents per watt on the retail market (artificially depressed, but not far from steady-state reality). As global demand increases dramatically (which it is), and new substrate technologies emerge, cost will come down further. We will easily see PV at 50 cents/watt by 2020 if not 2016. By 2040, we will be well under 20 cents a watt with a single 39x66" panel delivering well over 1kw of power. We will reach "grid parity" sometime around 2025. That's effectively free electricity. Today's home PV install payback is currently 5 years. In 2040, payback will be less than 1 year. Free electricity. Likely candidates for emerging PV technology include nano-scale carbons, multijunection concentrators, and quantum dot cells among many others -- massive PV research happening all over the world.
Installed microinverters and cabling are around $1.00/watt today. But there is tremendous momentum here towards vastly improved scaling. Texas Instruments and others are working on high-level integration of all inversion electronics, putting nearly everything required on one IC. The remaining inverter parts (capacitors, etc.) are being completely redesigned and scaled. As demand continues to accelerate, the price of microinversion will fall dramatically. The Enphase M215 was over $200 18 months ago. Today you can buy it for $130, and probably under $100 by 2014. New players are coming on the market all the time - Power One, India, China, Korea, etc.. Competition is good! Microinversion at 50cents/watt by 2020, and likely under 20cents/watt by 2040.
Even PV mounting rail systems are dropping dramatically. Frankly, the only fixed PV costs moving forward are for permit and installers. And with PV installs becoming faster and more elegant, even those costs are falling.
driz, thanks for the information.
At what cost per kWh are you calculating a payback of 5 years? I currently pay 11 cents per kWh which is near the national average.
@Kindhearted,
I'm basing my numbers on N. California costs (PG&E), which are higher than your 11 cents per kwh. Perhaps a better way to look at this is net cost. Today's microinverted PV systems are designed for a 25 year life (central inverters are cheaper, but designed with 10 year warranty, in general). Simply calculate your net electrical cost over 25 years. This is the model used by major new PV financing players like Solar City. They can install your system for FREE, maintain it for 25 years, and guarantee you modestly lower electricity bills. But they are pocketing a nice premium for 25 years.
Today, contractor-installed PV should run around $3.00/watt. If you contract it yourself, that should drop to $2.20-2.50/watt. After govt incentives, net cost of installed PV is around $1.50-$1.80/watt. Now factor in your power company credits for grid-tie buy-back. In California you can sell back to a zero utility bill. Your goal is to optimize PV system capacity that gives just enough power to generate a zero utility bill, without excess generation (wasted system dollars).
To answer your question, with PV at $1.70/watt installed and optimized for zero utility bill, your net cost of electricity is roughly 4 cents/kwh, or slightly less. As you note, PV "payback" depends on one's utility rates, which each person needs to assess. At 11 cents/kwh, payback is roughly 7 years, and then "free energy" for 18 years thereafter. My utility rates are higher, so my payback is around 5 years.
In the bigger picture, by 2040 I think we'll see installed PV at 60 cents/watt, which means electricity will cost little more than 1 cent per kwh -- effectively free energy.
"a single 39x66" panel delivering well over 1kw of power."
No. Hard physics intervenes, along with diminishing returns where each additional percent of efficiency costs more.
20 cents a watt might well be achievable though. There is still a lot of excess hand work in the construction process. For silicon technology, 40% of the starting material ends as sawdust. If they can get continuous casting and crystallization to work that would be a big drop in costs right there both from the materials savings and from no more wire-saws.
Whoever does not go broke by the end of 2014 should be ready for the next leg up in the industry, and that will occur when natural gas prices rise again.
@PVguy,
I base my 2040 PV forecast on emerging technologies. You are correct, conventional single-layer PV (monocrystal, polycrystal, thin film, etc.) has a theoretical limit of around 600W for a 39x66 panel space. But emerging technologies like quantum dot and multi-layer could double or even triple those efficiencies, making a 1kw 39x66 panel not just plausible, but probable.
In any case, as PV scales, I do think 20 cents/watt by 2040 is a reasonable assumption.
39"x66" = 1.53 square meters
600 Wp (assuming 1 sun, AM 1.5, STC 1000 w/m^2) means 39 % efficiency.
The Shockley-Queisser limit for 1 junction 1-sun cells is about 33%.
http://en.wikipedia.org/wiki/Shockley%E2%80%93Queisser_limit
Best commercial cells are 24%, but modules only go to about 20% (pseudo-square cells, edges, etc.)
http://us.sunpowercorp.com/homes/products-services/solar-panels/e20/
So we're talking 1.53 m^2 x 200 Wp/m^2 = 306 Wp (at STC, summer temps will reduce this of course.)
A 1kW 1.53 m^2 panel would have to have 65.2% module efficiency.
A three junction 1-sun cell S-Q limit is 49%, infinite junctions at 1-sun is 68%.
Multijunction is here and now, pushing 42% at 1000 suns, 30% at 1-sun, (IIRC),
just too expensive for anything but space (and maybe concentrators, but 1-sun silicon and power towers are what most folks are actually doing.)
Yeh, I've read the technical articles by Prof's Green, Luque, et.al.
Great stuff: hot carriers, intermediate bands, ... wonderful science.
But what, the most efficient quantum dot cell is 7%, and it's not clear how much of that is a positive contribution from the QDs. (the QDs giveth AND taketh away...).
But, can this stuff ever be made:
(1) cheaper than crystalline silicon
(2) as efficient as x-si
I'll believe it when I see it.
It doesn't look to promising to me.
n.b. thin film was supposed to kill wafer silicon, and how'd that turn out?
http://www.greentechmedia.com/articles/read/Slide-Show-Is-Thin-Film-Sola...
@sunnv
Good information and data. Thanks. So theoretical max for 39x66 poly panel is somewhere closer to 500w not 600w.
I do think that multi-layering and concentrating technologies, along with quantum and nano-scale breakthroughs, will take us beyond the SQ limits. My research shows a doubling of PV efficiency/cost ratio roughly every 7 years for at least the last 30 years. One 7-year period showed slower gains, and one 7-year period gave more than a doubling, but the 30-year average has been roughly 7-year doublings. Do you concur?
I personally think we're at the leading edge of a dramatic new era of solar cell technologies, NOT at the dead end. Based on the sheer magnitude of global research committed to PV (and growing), I have a reasonable confidence that the "7 year doubling" trend will continue if not accelerate. Kurzweil's "Singularity" is an excellent resource for understanding and predicting technology trends.
If we remain on-trend, we will achieve installed PV electricity of roughly one cent per kwh by 2040. This will render coal-gas-nuke generation plants largely obsolete, and put N. America on-track to generate 100% renewable electricity by 2070 (Germany should reach 100% renewable electricity by 2050).
Heck, with PV panels at 80 cents / watt today (down from $4/watt just 4 years ago) we have effectively reached "grid parity." Any further improvements in PV eff/cost (along with sizable drops in u-inverter technology) is icing on the cake!
I do think that multi-layering and concentrating technologies, along with quantum and nano-scale breakthroughs, will take us beyond the SQ limits.
Yeah, just like economists say that we can produce an infinite increase in our oil production because higher prices will always increase supply. Physical limits/theoretical limits be damned! This is a limit that nobody in the PV industry is saying will be exceeded, as they understand the limits. They're looking for ways to more closely approach those limits.
Kurzweil's "Singularity" is an excellent resource for understanding and predicting technology trends.
The ultimate cornucopian fantasy!
Kurzweil's Singularity as a cornucopian fantasy? Virtually all of his graphs show historical trends, how they grew, and why they stopped. A fine resource for showing how and why historical technology trends grow, peak, and give way to new paradigms. As for his future forecasts and predictions, I have no comment.
Look at all the Kurzweil graphs. When you have historically high investment pushing the limits of a technology (as today's PV research), chances are typically pretty good that the technology will improve, get cheaper, get more efficient, etc.. But I don't agree with comparing PV lab research to economic theories of oil supply -- that's somewhat like comparing Moore's Law to Common Law.
"SQ is a limit that nobody in the PV industry is saying will be exceeded, as they understand the limits."
Wrong. In fact, much of the PV research into multi-layering, concentrating, quantum dots, singlet fission, tandem cells, and nano-scale is looking FAR beyond the SQ limits. By definition of concentration and layering, we are effectively building multiple solar cells into one substrate. SQ deals only with non-concentrated (single sun), single junction physics.
Bermel at MIT is talking "easy 37% efficiency." Beard at NREL is talking 44%. Most agree that current research should ultimately bring us to 50%. A good place to start is the SCC website, under the heading "Strategies To Exceed The SQ Limit" - some really good science here.
http://solarcellcentral.com/limits_page.html
1. Cornucopian Fantasy, yes. While the past trends may well be accurate, using them to extrapolate past known limits is Cornucopian Fantasy.
2. I did not say that 33.7% efficiency will never be exceeded. I said the theoretical limits won't be exceeded. Remember this from my comment? This was in response to your statement that by 2040 cells will be many times more efficient. To me, ~2 times isn't "many".
In all cases the research is to get closer to the theoretical limits, for whatever type of cell, not to exceed them. That also comes with greatly increased costs and complexity, as sunnv says.
"While the past trends may well be accurate, using them to extrapolate past known limits is Cornucopian Fantasy."
Disagree. When industry, academia, and government is throwing historically large piles of cash and man-hours at a problem (meaning the economic and social incentives are significant), and there are numerous road maps showing a way towards far higher PV efficiencies and lower mtl-mfg costs, and many labs have already proven 1.3x - 1.4x over the SQ Limit... I see little reason to think that PV's 30 year eff/cost slope will suddenly just stop dead. I could be wrong, but I think it reasonable to assume that the eff/cost curve will continue moving in the same direction -- which means commodity PV approaching 60% eff by 2040, at a rough cost of 20 cents/watt.
You are right - 60% isn't "many times". What I should have said is today's eff/cost ratio will be many times higher in 2040. But here's the really good news -- even if commodity PV stopped dead by 2040 at 50 cents/watt and 25% eff, our electricity price would be under 0.03/kwh, far below grid-parity. We have assured ourselves today that, by 2050, coal-gas-nuke plants will be producing half the electricity they produce today -- from 85% of capacity to less than 40%. And by 2070, coal-gas-nuke electricity will become a minor player on the grid, a sad footnote in human history.
Thanks for the conversation!
And by 2070, coal-gas-nuke electricity will become a minor player on the grid, a sad footnote in human history.
Well as we say in the neighborhood "depends on the weather." Coal has been awful persistant. If going get tough (and climate patterns can certainly push that along) industrial economies may well lean on coal more than less--which of course won't help the climate pattern issue at all.
Agreed that 2070 is a long way off but right now
Global demand for coal is expected to grow to 8.9 billion tons by 2016 from 7.9 billion tons this year, with the bulk of new demand — about 700 million tons — coming from China, according to a Peabody Energy study. China is expected to add 240 gigawatts, the equivalent of adding about 160 new coal-fired plants to the 620 operating now, within four years. During that period, India will add an additional 70 gigawatts through more than 46 plants
and there is oh so much coal close to the ever less frozen Arctic Ocean.
Luke H, with a growing awareness of PV's increasing energy efficiency, I'm becoming more positive about Western civilization's energy future. Let's take a very conservative 2040 estimate: PV at 25-30% efficiency and 40-50 cents per watt. I doubt anyone here would call this "cornucopian".
Even at this ultra-conservative forecast, 2040 electricity will cost $0.026/kwh. Coal-nuke-gas cannot begin to compete with PV at this price. In the last two years, PV has achieved grid-parity without subsidies. Most forecasts say PV panels will now remain below $1/watt, and break $0.60/watt by 2020. I think 45% eff with $0.30/watt by 2040 is more realistic, putting electricity around $0.018/kwh -- effectively free. And I would not be surprised in the least to see 55-60% eff with 0.20/watt panels by 2040, putting electricity at 0.01/kwh.
No matter what numbers you forecast, the result is ultra-cheap PV electricity. The next ten years are going to be really interesting. By 2020, I think we'll be seeing a wholesale global move (including China) away from fossil-nuke electricity generation, and the wholesale move to local and regional PV. It's a purely economic decision, and PV's economic superiority will become increasingly clear each successive year.
Frankly, many people still aren't aware that PV panel costs have dropped by 80% in just 3.5 years, and that the installed cost of PV continues to trend down at an accelerated rate. We live in exciting times!
Lots of promise no doubt, but we are used to 24/7 power on demand. Certainly much more has to happen than just PV price dropping to let us keep on keeping on in that fashion. Could be why this idea

so grabs our imagination
--though as many here have said a much less centralized power generation matrix is likely much easier to attain especially if we have "a few problems 'cause of the weather."
Germany is showing us the way into 100% renewable 24/7 electricity. PV isn't enough. We need hydro, wind, thermal, biomass, tidal, etc.. Germany should be there by 2050. We will likely take 20 years longer. Your image reminds me of Richard Smalley's energy lectures in the 1990's (Nobel Prize for his pioneering nanotechnology work). He was among the first to really take peak oil seriously and show direct links between energy density and population growth. He kept pointing to the sun for our answer, and proposed a similar "massive concentrator" in space. I think he would be elated to see where PV eff/cost has come today, and where it will likely continue to go. His legacy at Rice, the Smalley Institute for Nanoscale Science, is among the world's best.
By the way, here's a new technology that uses compressed air to store energy for off-peak delivery to the grid. The chief scientist started her PhD work at Princeton at 17 years old :-) This is really good technology. http://lightsailenergy.com/
Thanks for the link. Interesting tech--I'll be waiting to see real world performance numbers. Some small 'island' grids starting to embrace wind around coastal Alaska.
By the way when I said "a few problems 'cause of the weather" upthread the subject of this recent NRC report (300MB PDF conclusions and recommendations section) is what I had in mind.
My Kyocera KD-135 cost me $2.19 / (rated watt) earlier this year. Add $15 for an MC-4 extender cable, a few dollars for EMT to mount it, a few dollars for transportation, no cost for miscellaneous parts from my collection and no cost for my labor, the price is $2.34 / (rated watt) to add it to my PV system.
Cherry picking the price of some laminate or poorly made Chinese PV panel without including the balance-of-system costs, is not really helpful. For example, if I had purchased a Kyocera KD-315 at $1.20 / (rated watt), I would have to purchase an MPPT controller for ~$500 to connect its 49.2 Voc output to my 12 V battery array making the cost above $2.79 / (rated watt). The balance-of-system costs are not trivial.
Rather than characterize PV installs as "a few dollars here, a few dollars there", let's use cost/watt for every function.
Cheap Chinese panels are under 0.80 cents/watt. Panels from large multi-nationals with solid 25 yr warranty, around 0.90 to $1.10/watt. I paid 0.95/w delivered from a $3B German company (U.S. mfg) with a superior warranty.
Central inverter: roughly 60 cents/watt (or)
U.S. Micro-inverter with cabling, software, 25 yr warranty: roughly 80-90 cents/watt
Mounting System: roughly 30 cents/watt (good systems are available for 20 cents)
Roofer and Electrician labor, cables, boxes, commissioning, permit, misc: say 40 cents/watt
Add 15% for a general contractor
Installed PV: $2.30-$3.00 / watt
Subtract Federal Credit: $1.60-$2.10 / watt
Subtract Local Credits (in Calif around 10%): $1.45-$1.90
Factor-in grid-tie credits.
Today's net 25-year cost of PV electricity in California: roughly 0.046/kwh
If you contract it yourself, rate drops to $0.04/kwh (0.061/kwh without factoring govt incentives).
Contrary to certain opinion, we have, today, achieved grid-parity without government incentives.
I'm an EE and can assure you that micro-inverter technology is going to get far cheaper. I'm projecting 0.15-0.20/watt by 2040, and perhaps much sooner.
Lots of opinion here on the future of PV panels. I think 2040 will bring 60% eff @ 0.20/watt. But let's assume half that in 2040: 30% eff at $0.40/watt. I think most of us here could live with that projection. That gives us nearly 500W in a 39x66 panel, effectively halving the price of installations (mounts and labor). Let's run the numbers!
2040 Installed PV
Panels: 0.40/watt
Micro-inversion: 0.20/watt
Mounting System: 0.10/watt
Labor and misc: say 20 cents/watt
Add 15% for general contractor
Installed PV: $1.05 / watt
Net 25-year cost of PV electricity: roughly 0.026/kwh
Electricity @ 2.6 freeking cents per kwh
Western civilization's energy future looks very bright.
Our task is to find a way to wean the 2/3 world off fossils over the next 20-40 years. I think PV is the foundation of that task.
In figure 1 the approximate area of the red curve represents about 30 billion barrels of tight oil produced from 2008 to 2035 with a peak production of about 4 Mb/d. For wells with a production profile like the Bakken about 8,000 wells / year would have to be drilled for several consecutive years in the U.S. to get production up to 4 Mb/d. The Baker Hughes Rotary Rig Count for US Oil and Gas shows there are currently ~1800 rigs drilling outside of the Gulf of Mexico. Presumably this is close to the total number of onshore drilling rigs. The graph shows a peak of about 2000 rigs in 2008. If the average rig drills and fracks 6 successful wells / year, then 1,333 rigs (or 74% of onshore rigs) are needed to drill 8,000 wells/year for tight oil. With 1,400 rigs already drilling for oil, that rate can not be achieved without more drilling rigs or sacrificing drilling for natural gas and other types of oil.
The number of rigs drilling for oil has leveled off during the second half of 2012 which does not bode well for a continued increase in U.S. crude oil production.
Thanks for going through and doing that exercise. I think the rigs that are used are generally horizontal rigs, and the majority of drilling rigs are vertical (from memory-that is the way it used to be). Lack of sufficient horizontal drilling rigs makes the possibility even less likely.
Some thoughts:
(1) Looking at Figure (1), the max peaks at about 11 mbod. If the US currently consumes roughly 18.5 mbod, there would have to be a large decrease in demand for the US to become an oil exporter.
(2) In Figure (1) again, it peaks at 11 mbod around 2020, but then starts a decline. It's great to be able to have the tight oil to exploit, but the tail-off after 2020 is worrisome.
(3) Gail brings out the point that the IEA is not factoring in prices into their model. Why is it that they don't factor in valid variables like prices? I have read people speculate that the IEA is influenced by the govt or whoever - not sure how much of that is true. But it seems that the people at the IEA live and breathe the oil market, so they should be more responsible to provide as accurate a forecast as possible.
(1) There are some things left out of my graph, because I was following what IEA did. As I mentioned in a comment above, "Refinery expansion" is left out. This amounted to 1,076,000 barrels a day in 2011, according to the EIA.
Biofuels are also left out. Production amounted 971,000 barrels a day in 2011, and consumption amounted to 898,800 barrels a day. (The US is an exporter of biofuels. We are up at the blend wall in what we are producing.) The IEA is counting on big growth in biofuels production. One place, it talked about adding 1.0 million gallons a day in production. Consumption, in another chart, was shown at 1.7 million barrels a day. So apparently the US is going to become an even a bigger biofuels exporter.
I probably should go back and double check these amounts. It is possible I am comparing numbers from one scenario with another, for example.
(2) Agreed. But there are limits, even to the IEA's imagination.
(3) The IEA is a small branch of OECD. It seems very much to be influence by politics. I wrote a post about what I could figure out in 2010. Objectivity of the IEA. There was also mention in Drumbeat a few days ago of an analysis by Lionel Badal relating to the firing of everyone (except Fatih Biron) at the IEA involved in putting together the 1998 IEA forecast which was based on peak oil consideration. If I remember correctly, there was no 1999 report; the 2000 report was much more optimistic, based on a (then new) USGS analysis of how much resource might be available. The US provides the largest source of funds, and had the largest number of votes in the IEA, back when I looked at it in 2010.
Can anyone help with this? I was listening to a program on NPR called "to the point" and basically they said today on this program that we are awash with natural gas and over 100 years left of the stuff....there was no dissenting argument. Also stated was that we have met peak demand and it is coming down due to efficiencies----we can grow world economies without growing oil and gas demands! This is a nationally syndicated show and reaches a large audience we need to target these shows with someone who can give a counter point otherwise our time on these pages is pointless!!!!!!
Economies can grow without using a lot more fossil fuel. GDP is a measure of goods and services, if you are not making tons of steel as a product, you don't need lots of energy. If you are making computer chips, you use less energy.
During the G.W. Bush era they tried to make the connection that you needed to use more energy to grow an economy. That might have been true in the 1950s U.S. but not necessarily in the 21st century. It depends on the level of development in your society.
yes but when you give bubba redneck an extra 20,000 is he going to save it and reinvest it? No i think he is going to consume more plastic petroleum based goods....your example is way to simple and is missing the obvious point. GDP is a lot deeper than you think. I live in an area where wealthy consume more than 20 U.S families.....building houses that are only lived in for 2 weeks out of the year...growth is growth my friend....
Show me an example of an economy growing (significantly, over several years) without increasing energy and material throughputs. And be sure to include indirect energy use, e.g., factories in China using coal-based power to manufacture stuff bought by Americans.
In the case of oil (but also true of carbon emissions) I wrote an essay on Denmark & France (and the USA) and their oil consumption over a decade. Their next decade should be even better IMHO.
http://oilfreetransport.blogspot.com/2012/06/national-policies-oil-consu...
Germany should also be included - I understand that they are growing while reducing energy consumption -1.8%/year.
Best Hopes,
Alan
"Economies can grow without using a lot more fossil fuel."..
...Ignores that our fossil fuel economy depends on much more than fossil fuels to keep growing, or even persist at current levels; resources that are following roughly the same curves as crude oil. Diminishing returns and diminishing economic utility beget diminishing credit and investment, diminishing surplus. It's a surplus of many things that permits growth, and maintaining a surplus via efficiency and conservation is essentially robbing Peter to pay Paul. We, collectively, are entering this end game with no real clue as to what's next, yet continue to burn the seed corn of the future, desperate to preserve the unsustainable. Coming to terms with this reality will be messy and painful indeed, especially as societies continue to turn surpluses into deficits, attempting to stay afloat in a sea of decline.
It's time to ascertain what's essential and what's not; focus passionately on the former, strongly discourage the latter. I don't see that happening... Backsliding we are, at an increasing rate.
If the U.S. used oil more like Europe, we would be closer to oil independence. So let's say we started using oil more efficiently, we make homes and buildings more energy efficient. That way we would have an expanding economy while not using more energy.
"So let's say we started using oil more efficiently, we make homes and buildings more energy efficient."
That's pretty much what President Carter said 40 years ago, and we've made some remarkable gains on that front. So where have those gains gone? Why have massive injections of faux capital been repeatedly required to keep growing at an anemic rate (if legitimate growth it is)? Why has economic growth lagged behind debt levels? Why, in an age of increasing efficiency and remarkable technology, do our problems continue to devolve into predicaments?
For me, the answers are deeply systemic and involve hard limits well beyond crude oil and energy...
...or it could be that we are prone to use any surplus, real or magical, to increase our numbers and consumption. We've been stealing from the future for generations. Welcome to the future.
I am convinced that the view that we don't need fossil fuels for GDP growth is basically wrong. Two issues:
(1) In recent years, the US and other countries have indeed added GDP without adding much energy use, by adding more and more services, such as financial services and medical services. If there is a shortage of oil and other types of energy, we will have go back to a mix which is much more goods, and fewer (unnecessary) services. This means we will lose a disproportionately large amount of GDP, as the economy shrinks.
(2) We have also shifted production of goods overseas. This means that a lot of goods that used to be made in the US and Europe are now made in China and India. The net effect has been that the US and Europe have lost jobs to China and India, and world CO2 emission have gone up more than they would have otherwise. Shifting manufacture of goods overseas has made ratios of energy to GDP look good, but the real cost has been very high.
We need fossil fuels to grow an economy. I believe the best use for fossil fuels is to develop sustainable energy sources.
Do we need to increase fossil fuel use 3% per year to get 3% GDP growth each year? What is the function? In some developing countries that may be the case. In other more developed countries that many not be the case.
To say we will not do anything about fossil fuel CO2 because India and China will not is a COP out. Reducing fossil fuel usage is its own reward in many ways. Unless you are making billions of dollars off of the fossil fuel industry, you can take a more open minded view of the situation.
NPR seems to be as deluded as anyone else.
If anyone has contact there, it would be helpful. I know I was on one NPR show, and have talked with the NPR reporter since then. If others have contacts there, or ideas on who would be good to talk to, it would be good to hear your ideas. Write to me at GailTverberg at comcast dot net.
I wonder if folks are properly considering the impact of the oil sands. I worked in the Canadian oil patch as an engineer for 30 years and my friends are involved in the oil sands on the engineering side at pretty senior levels.
It is my experience that the technology is rapidly evolving and the EROEI is dropping for both the mining and in-situ operations. They are doing things like co-generation and SAGD. Further Total has even been discussing the use of small scale nuclear to generate steam. According to Canadian Association of Petroleum Producers Canada, is forecast to be producing 6.2 million BOPD by 2030. The oil sands - unlike shale oil - has no decline rate.
The reserves are potentially much larger than what is quoted by the ERCB (our regulatory agency)they only include economic reserves. The proved economic reserves are presently 170 billion barrels. The cost of oil sand production is going down and will continue to go down. There have been a lot of teething pains as we learned how to make things work. As that happens the economic reserves are likely to increase dramatically as proved original oil in place (OOIP) reserves are 1.7 trillion barrels. (yes that is trillion). Only 10% or 170 billion are considered economically recoverable. Unlike conventional and unconventional reservoirs the recovery factors for oil sands is very high. (mining operations recover over 90% and SAGD over 50% of the OOIP)
The bottom line is that if oil sand costs continue to drop,as they have done historically, the oil sands recoverable reserves will increase dramatically. At 20% economically recoverable the world will have an additional 170 billion barrels. This may not require increased oil prices as Gail has argued in her section "Diminishing Returns".
That gives us 5.5 more years of BAU. So I guess I can now buy a truck big enough to tow the boat I don't own up the mountain I don't live on.
I see the reserves,and the forecasts, and I think the bitumen sands will be employing people long into the future. I just can't imagine the costs will go down in the long run. Let alone the whole issue of maintaining Ft McMurray in the middle of nowhere. Is that ever thrown into the EROEI calculation? Although perhaps the cold will be less of an issue as we fry the atmosphere.
Prediction is very difficult, especially about the future.
Indeed. Your argument, oileng, feels kind of like Pax Americana is going to do an about face right now and treat itself like an isolated island in the middle of a vast uncharted ocean. Hmm. Interesting compartmentalization of concerns.
There are also interesting reports out recently on the toxicological effects of mining the oilsands on lakes much further away than originally assumed. Don't have the link handy.
http://www.desmogblog.com/2012/11/14/tar-sands-are-toxic-federal-scienti...
can't find the original paper on line yet
170 billion barrels of bitumen gives a lot more than 5.5 years of BAU, it gives about 170 years of following the conventional oil production curve down. Assuming Canada steps up its oil production to 6 million b/d as predicted by CAPP, it would be about 75 years of decline.
All oil sands will do is put a "fat tail" on the global oil production decline curve. 75 years from now, oil sands may be the only oil you're going to have.
I don't get your math Rocky. 170 years?! If conventional were to decline by 1 mbpd each year, then even 6 mbpd of tar sands oil output will only extend the plateau 6 years. A constant 6 mbpd afterwards will do nothing to slow the decline. And the OC intention was to point out that even if the ultimate production from the tar sands will be the rather optimistic 170 gb, that's only 5.5 years of total current global consumption, and thus cannot extend the oil age by much. Yes it will make the tail slightly fatter.
Sorry, I wasn't really clear about what I was saying. If, for instance, oil sands production grows by 100,000 b/d every year (which is about the maximum allowed by labor force constraints), and conventional oil production declines by 1 million b/d per year, then total global oil production will only decline by 900,000 b/d every year. This is what I mean by a "fat tail" on the production decline curve, because at the end of it, most of the production will be oil sands, even if it is only 6 mb/d.
Canada is already to that point. Most of Canada's oil production now comes from the oil sands - on the flip side, the conventional oil reserves are nearly exhausted. But, everybody who read the industry and government reports knew that would happen so it's no surprise.
That's what I meant by "following the conventional oil decline curve down". This isn't particularly optimistic if you are an American or European. Sorry if I gave the impression I was some kind of cornucopean.
It is more optimistic than the Doomster scenarios, though, because it does give people more time to adapt, if they are smart enough to take advantage of it. Are people smarter than yeast? We'll see.
I was wondering if anyone would catch that - in a big bucket it would add 5.5 years; but at today's extraction rate it will take 77 years to get it out. Indeed, it will probably be the last useful supply of oil, at any price. Perhaps there will be a little for the combines, or fire trucks.
Oileng. You cannot say that oil sands have no decline rate, because the extraction of said 'oil' (if it may be called that) relies on the use of fossil fuels that do have a decline rate and whose cost per unit is increasing with every slurp.
Thus the production costs are directly tied to the cost of transport oil in particular and fossil fuels generally.
It is very likely the production of your horrible muck will cease not because there's none to be had, but because you cannot afford to buy the energy to get it out of the ground.
And I don't know why its called 'oil', as it makes no useful contribution to transport fuel supply, and it requires products from nicer oil to dilute it to make it flow south to be refined.
You could tell us, please, in measuring production from your sand pits do you discount diluents and fuel used in its production, or do you claim every drop that goes south and ignore production fuel?
Oil sands projects have no decline rate. They just produce at a constant rate until all the oil in the lease is extracted, then they are shut down and the production rate falls to zero. This takes many decades, though.
The oil sands as a whole will have a decline curve, but it will peak sometime late in this century or sometime in the 22nd century, depending on economics and technology.
It's called "oil" because it does make a major contribution to transport fuel. Many Americans would be astounded at how much of the gasoline and diesel fuel that they put in their tanks originated in the Canadian oil sands. Many of the Midwestern refineries would have shut down by now if it were not for Canadian bitumen because their domestic oil supply is largely exhausted. Canada is now exporting more oil to the US than it consumes itself, and most of this oil is from the oil sands.
If you were to look at the pipeline maps, you would see that many of the Canadian oil export pipelines have light products pipelines running parallel to them but running the opposite direction. What the refineries are doing is stripping the diluent off the dilbit going to the US and pipelining it right back to Canada.
Don't look for Canada to run out of NG to fuel the oil sands plants. Recent studies indicate Canada may have as much or more shale gas than the US, and there is very little domestic market for it in Canada.
So far (from 2004 to 2011), rising net oil exports from Canada have served to slow the overall decline in net exports from the Americas*, from 6.1 mbpd in 2004 to 5.1 mbpd in 2011.
In any case, as you know EUR estimates will vary over time, but the fact remains that an increase in a production rate means an increase in the rate of depletion of remaining resources.
*Top seven major net exporters in the Americas in 2004, see chart up the thread
Pretty sure you meant to say 'rising'. And while I don't know what the truth is, your points about a learning curve have some validity, but so do the counterpts. raised by bryantheresa, klooless and nigwil. Let me add this:
We built industrial society on an EROEI in the neighborhood of 100:1 - that was 1930's oil. We maintained it on an EROEI of 25:1 or so - 1970's oil. That we are now beginning to rely on resources with an EROEI in the single digits is a sign of trouble. EROEI of oil sands is in the neighborhood of 7:1, from what I've seen. So even fairly significant improvement of say 1/3 still leaves it under 10:1. That's not going to fuel a global industrial economy going forward.
Here's another way of looking at it. EROEI of 100:1 is like getting 10,000% interest from the bank. You can do a lot with that kind of return. Spend like crazy - build interstates and high rises and suburbia and Disneyworld and a JIT delivery system to service it all. 7:1 is 700% interest. Still sounds really good, but it's a far cry from 10,000%, and we're going to have a hard time maintaining this crazy infrastructure and lifestyle on it.
An EROEI of 7:1 or 10:1 (which actually is about the right range for oil sands) is not nearly as good as the historical 25:1 to 100:1, but it's the best game left in town. Bakken oil is in about the same range as oil sands EROEI despite what some people seem to think.
It's much better than the EROEI of about 1:1 for fuel ethanol or 0.6:1 for coal-to-liquid or gas-to-liquid which some people have promoted as the solution to the oil production decline. For those, you are getting into total loss territory.
It's true that it will not support the extravegant lifestyle that people have gotten used to, but people will just have to get used to that.
CTL would be better than 0.6:1 because you also have to factor in the net energy from extracting coal. If coal can be extracted at 50:1, then with a 50% efficiency of coal to liquids then the overall net energy return from mine to gas pump is 25:1.
With oil sands, if NG is extracted at 50:1 (I really don't know what it is, this is just an estimate) then this doesn't enter into the formula the same way as above since it is only 1/5th of the total energy in to oil sands processing. The other 4/5 comes from oil sands so the whole operation is still only about 5:1 or 7:1 or whatever.
"It is my experience that the technology is rapidly evolving and the EROEI is dropping for both the mining and in-situ operations."
When you say the EROEI is dropping do you mean getting worse? The energy return on energy investment is going down. It sounds like you meant to say it is getting better from the rest of your comment.
One more thing....they will continue to improve oil sands operations and get more efficient but one main reason production cost have come down is natural gas prices, especially for the SAGD operators. What will production costs be with natural gas at $7.
I do think it is important to point out that you had a similarily very negative view on Bakken oil production and tight oil in general a few years ago. Reality turned out another way.
If there's one thing the Peak Oil community probably learned, at least most of us, is that making foolhardy predictions don't turn out so well. Neither for the cornucopians nor for the doomsters.
"making foolhardy predictions don't turn out so well. Neither for the cornucopians nor for the doomsters."
Well said, and a lesson I am learning. At this point, I don't see oil supply causing Armageddon (10 years ago I wasn't so sure). Worst case, I see oil supply constraints slowing global economic growth, which could be serious, but not end-of-world catastrophic. In some ways, it could even be healthier (ecosystem, etc.).
I think phrasing it the way you do: "could be serious, but not end-of-world catastrophic" also leaves a lot of uncovered territory in between.
Certainly. But if you've followed the peak oil conversation for as long as I have, you begin to see that "reality" is somewhere between the survivalist doomsayers and the cornucopian economists. For North America, I think our energy future looks FAR better than we could see five years ago. As for the industrializing world, I think oil constraints will slow their potential growth. But I also think that many of the same forces that are driving N American economic security will benefit the 2/3 world. I think we have problems ahead, but I am a LOT more optimistic than I was 5 or 10 years ago.
Now we get into spurious debates about "how long have you been following PO".
FAR better?
Read what ROCKMAN just posted about the implications of North American net energy. This is going to do more than slow growth. You seem to be ignoring the post entirely and therefore not using it in your posts.
Oh yeah, "don't wrestle with ____"
The dramatic (and generally unexpected) drop in PV prices (and more to come), coupled with the dramatic (and 10 years ago unexpected) increase in long-term NG reserves, coupled with a clear path towards further growth of N. American oil supply (for at least another 5-7 years, and likely much longer), coupled with a steady drop in long-term N. American oil demand. Yeah, things are looking FAR better than they did 10 years ago when I started studying peak energy.
Are we home free? No. We will never return to the days of effectively free energy. Expensive energy will continue to slow us down. But I think my biggest worry about N. America is no longer the economic costs of energy, but the negative impact of cheap NG on renewables development. Hopefully, the rest-of-world will continue to drive clean energy development, even if we lose ground.
Again, I believe the most important metric to watch is "median household energy cost as percentage of non-discretionary household spending." For decades, the number remained relatively constant. In the last ten years, it has effectively doubled. If my calcs are close, that number is probably reaching a peak of around 14-15% and will start to level off, and eventually (2020?) start to fall.
You've been registered here 18 weeks, I've been here under this alias for 8 days. So we got that out of the way. Congratulations.
I will also cede this: I am for very fast adoption of solar and wind, bearing in mind land needs to be kept free for agriculture also. It can also compensate for the incredible demand destruction already going on by providing jobs.
Whether renewable efficiency will develop fast enough or in great enough magnitude and whether any meaningful renewable infrastructure adding significantly to total energy will be able to be built as oil prices continue to rise is an open question.
I'm making a lot of assumptions and caveats but so are you. Do you really expect natural gas in the US to be so cheap for so much longer? It may give you some kind of false idea that that might mean lots more cheap energy. The infrastructure for it needs to be built but what happens to the price once that's finally in place? What would happen if there were a bunch of huge LNG tankers floating around doing nothing? And terminals everywhere for them? I think that's the way things are going very fast. The price in the US is an anomaly and is going to 'correct' or go to some other 'equilibrium' very quickly.
I'd classify myself as less optimitistic than you and argue that we are hitting a point of no return economically where we will not have the infrastructure and agriculture in place to make some kind of magical continuous movement down the PO curve. Who's more realistic? I'll take votes.
"You've been registered here 18 weeks"
I became aware of PO theory in 2002, attended my first ASPO conference in 2004, have written for the Energy Bulletin and others, Lifeboat Foundation board member, etc.
PO study is an avocation -- engineering pays the bills. One thing I've learned is that predicting the future is a black art (as in, black swans). You have good reasons to be "less optimistic."
That said, given the structural changes I've seen since the original data sets we were using 2002-2006 (view the 2002 forecasts for domestic NG, PV, oil, EV, etc..), I'm far more optimistic about N. American energy security moving forward. True, much of my optimism hinges on N.A. NG remaining plentiful for at least 15 years. Based on the data I'm seeing, I believe the NG is there. I could be wrong.
If N.American oil demand continued to rise into 2040, I would be less sanguine. But N.American oil demand has effectively "peaked" and will fall 2020-2050. Some forecasters say N.A. oil demand will fall to 85% of today's use, others are closer to 70%. Based on an intimate understanding of electronics, manufacturing, economies of scale, process optimization and stimulation, Kryder's rule, Koomey's law, and other proven metrics, I see PV and EV-hybrid technologies ramping up faster than most predictions. By 2040, I see installed PV at $1.50/watt and EV-hybrids outselling IC vehicles ==> which drives 2040 U.S. oil demand under 15M b/d.
Thanks for elaborating. I could be wrong too, I hope so, but I don't think so. I look at things differently having looked at the world from another education, having read other books and traveled to see different parts of the world and drawing a slightly different likely trajectory going out than you do. But that's why we're here, to shake up the perspectives. So far IMHO you've been taking isolated facts and trying to twist them in the most positive way anyone could. Yes you are part of the debate, and it will be interesting to see, with all your expertise, what you can convince me or anyone else reading your posts of as the debate goes forward. But generally, I don't appeal to my credentials to make an argument as you do, I just wade in and let everyone know what's on my mind, asking questions as I go etc. It's fun so far and I hope it is for you too. We're 2 TOD noobs here aren't we?
Your projections for US oil demand or supply (what does it matter, let's just call it consumption) of (just under? what are you saying here, again anything could be under) 15 M b/d in 2040 seem wildly optimistic to me.
"15 M b/d in 2040 seem wildly optimistic"
Today, we're at 19M b/d. The most conservative forecast is EIA which predicts flat U.S. liquid oil demand through 2035. For reasons already stated, I think that's unlikely. Exxon predicts N. American oil demand to drop about 15% FROM 2015 to 2040, putting us at 16M b/d by 2040. Some like Paul Chefurka and Gail the Act put a peak-constrained spin at far lower than 15M b/d. I put a positive spin on our coming energy independence, leading to weaker oil demand - under 15M b/d by 2040.
This doesn't mean N. America will pay less for oil than the rest of world. We won't. Liquid oil is a "relatively" free-market. Prices will be set by the highest bidders, and worldwide oil demand will continue to increase. The good news is that higher U.S. oil prices will be offset by falling overall energy prices driven by increasingly affordable PV-EV and NG under $4. I'm still waiting for a comprehensive formula that correlates GDP with energy cost. This would tell us just how much energy costs (supply constraint) are impacting our economic growth (versus debt, inflation, or other constraints).
We're going to do a lot of living until 2040, that's for sure. What baffles me a bit though is that you are talking about 2040 as if there is much that we can predict about the world 28 years out.
What will the world population be by then?
"Falling overall energy prices" You'll have to explain that one to me. Energy prices rise and fall every day.
I'm an advocate of higher taxes on oil and gas by volume or weight for conservation purposes.
"Falling overall energy prices" You'll have to explain that one to me."
I think NG will remain under $5 (in today's dollars) for at least 15 years. That's cheap energy compared to where it was headed before the fracking revolution.
PV energy is simply an extrapolation of Moore's Law coupled with the economic reality of massive ongoing research. By 2040, PV panels will be under 20 cents a watt, and many times more efficient per surface area. That means, in 2040, the cost to install a PV system on your house will pay itself back in less than 12 months. After the first year, you will have 24 years of free electricity. Germany is already generating 10% of their national electricity with PV, and one report puts German electricity at 100% renewable by 2050.
http://thinkprogress.org/climate/2012/06/12/497984/solar-provides-10-of-...
EV-hybrid cars will begin to outsell IC cars sometime in the mid-2030's. Those EV's will be better in every respect than an IC vehicle. We will power them with effectively free PV-generated energy.
Because of these rapid PV-EV efficiency increases, U.S. oil demand will fall faster than most had predicted. Our NET personal and national energy costs will start falling as PV's reach grid parity (2025-ish) and continue falling into the future. That's what I mean by "falling overall energy prices".
driz,
Given that LNG is selling in Northeast Asia for triple that price, and NE Asia doesn't have much in the way of NG resources itself, there's a huge arbitrage opportunity. I doubt that a gap that size can be sustained for 15 years. Either the price will fall there or it will rise in N. America.
On oil consumption: you might be right. But it might be that the price of oil is just low enough to prevent massive switching away.
Also, demographics and politics. Currently the US population is growing at about 0.9% per year and slowing. It appears that both main political parties now see relaxing immigration laws as a vote winner, so the rate of growth may rise back to the 20th century average of 1.3% - 1.4%. As immigrants tend to be car-using adults, this means that efficiency/substitution gains would have to be about 50% faster than otherwise to hit that 15 Mb/d target. Still achievable, but perhaps harder.
gregvp,
Good points. N.A. NG is sheltered at present, but as LNG ports ramp up, our prices go up, and given that fossil-extraction companies effectively make U.S. law, I see no govt intervention to prevent profit-maximizing outflow.
Interesting demographic on immigration. Something to watch.
On the other hand, N.A. has far more domestic fossils coming on line than PO research anticipated ten years ago. Couple this with the very recent and entirely unexpected fall of PV prices, and I think U.S. energy independence is probable by 2040.
With current PV trajectories, electricity will be under 2 cents/kwh by 2040. This is will drive massive investment into EV and reduce fossil energy plant activity by >50%. I'm betting that, by 2040, EV's will surpass fossil-drive vehicles in every respect, including cost and range. Exxon forecasts 2040 N.A. oil demand at 16M b/d. Based on recent PV revelations, I think we'll be using far less.
driz, I hate to burst your solar bubble, but...
1) Germany does not produce 10% solar power. Read your link properly, that was for a sunny month of May. May is just beside June, where we have the highest solar irradiation on the northern hemisphere. Averaged over the year, with all those long dark dreary winter months, Germany got 3.8% PV electricity 2011 as already mentioned by another comment.
2) by 2040 PV panels will definitely not be "many times more efficient per surface area". Already today, you can buy 20% efficient panels. There is a physical limit to silicon solar cells (http://en.wikipedia.org/wiki/Shockley%E2%80%93Queisser_limit) which is around 34%. There is certainly some room for improvement, but never "many times".
I'm not saying PV isn't worth pursuing, but the numbers still have to add up!
"by 2040 PV panels will definitely not be "many times more efficient per surface area"."
You may be right, but much of today's PV research into multi-layering, concentrating, quantum dots, singlet fission, tandem cells, and nano-scale is looking FAR beyond the SQ limits. By definition of concentration and layering, we are effectively building multiple solar cells into one substrate. SQ deals only with non-concentrated (single sun), single junction physics.
Bermel at MIT is talking "easy 37% efficiency" with ultra-cheap technology. Beard at NREL is talking 44%. Most agree that current research should ultimately bring us to 50%. Beyond that? A good place to start is the SCC website, under the heading "Strategies To Exceed The SQ Limit" - some really good science here.
http://solarcellcentral.com/limits_page.html
Thanks for the head's up on the Germany link. They now produce 20% of their electricity from renewable sources, not 10% from PV. By 2050, they are targeting 100% renewable electricity.
"Averaged over the year, with all those long dark dreary winter months, Germany got 3.8% PV electricity 2011"
Which already jumped to 5.1% for the first half of 2012. Germany is continuously adding massive amounts of PV, so the figure for the whole of 2012 should be even higher.
I don't really understand the obsession about cell efficiency. A nuclear power station is only 25% efficient too but a solar panel does not have to be actively cooled to sustain systems integrity. The most important parameter is cost per kWh and -from a resource/environment standpoint- amount/sort of materials used per Wp. Higher efficiency can improve both but not necessarily and, more importantly, there are many alternative ways to achieve better kWh per $ and environmental impact reductions.
By 2040, PV panels will be under 20 cents a watt, and many times more efficient per surface area
Absolutely, positively, not! From Fierz's link below:
86% isn't your "many times more efficient" than 33.7%. And this is the theoretical maximum for an infinite number of layers. No such cell will ever exist.
PV cornucopians need to get an understanding of basic limits as defined by quantum physics in the same way as biofuel cornucopians need to get an understanding of the limits set by plant biology and agriculture.
Perhaps technically you are right about cells in their current incarnation but it doesn't mean a differently configured solar cell might not somehow break that barrier and still obey the laws of quantum physics. Apparently there may be other ways to skin Schrödinger's kitty...
http://inhabitat.com/sharps-concentrator-solar-cell-sets-43-5-conversion...
Well, it's not breaking the 86% barrier, and it's a 3 junction cell, not a single junction. That doesn't disagree with that statement.
As noted in my quote:
You are correct, triple junction are expensive, using gallium, indium and other materials. They take a lot to process and the mirrors and lenses cost as well.
Standard silicon single junction cells are about where they will be at 15-20%. There are CIGS thin film which could cost less but are 10-15% and use scarce indium, so making billions of watts is problematic.
I was referring to the 33.7% theoretical maximum you mentioned, not the 86% barrier but you are right the point is moot because there are still ways to make PV more efficient.
"By 2040, PV panels will be under 20 cents a watt, and many times more efficient per surface area... Absolutely, positively, not!"
Why are you so sure of yourself? I do think we can achieve a whole-number multiple of today's efficiencies, but I could be wrong. What I should have said was that the eff/cost ratio will be many times higher than today's eff/cost ratio. Even the most conservative forecast puts a commodity 39x66 panel at 60 cents/watt with 350W eff by 2020. By 2040, I think 20 cents/watt is clearly within reason, and tracks PV's 30 year eff/cost curve.
But let's assume that PV research hits a dead end. By 2040 we're no more than 400W @ 50 cents. With expected inverter advances, this still puts us under 0.03/kwh, many times under grid-parity. Whatever happens to PV moving forward, by 2050 we will have displaced coal-gas-nuke from 85% of U.S. electrical generation to something around 40%, and nearing zero by 2070 (20 years after Germany did it).
I addressed the IEA report up the thread. Regarding global supplies:
The following charts show the gaps between where we would have been at the 2002 to 2005 rates of increase in production and net exports versus actual data for 2006 to 2011. Note that because of the nature of "Net Export Math,” on the production/net export upslope, net exports tend to increase faster than production. On the downslope, this reverses, and we have seen measurable declines in Global and Available Net Exports (GNE & ANE), versus generally flat to slowly increasing measures of oil and liquids production.
Of course, we have three key measures of oil production: (1) Crude oil, i.e, Crude + Condensate (C+C); (2) Total Petroleum Liquids (BP data base) and (3) Total liquids (everything, including low net energy biofuels). The average rate of change in the three measures of oil production from 2002 to 2005 was about +3.1%/year. Then we had the 2005 inflection point. The average rate of change in the three measures of oil production from 2005 to 2011 was +0.3%/year, which is one-tenth of what we saw from 2002 to 2005.
A key question is the size of the post-2005 "Net Export Fuel Tank." Our estimates of the size of the fuel tank can vary over time, but depletion is a one way street, and by definition, the volume of remaining post-2005 Cumulative Net Exports (CNE) is declining, year by year. My point is that we are only maintaining something resembling Business As Usual because of enormous post-2005 Global & Available CNE depletion rates.
The observed rate of change in the annual volume of GNE from 2002 to 2005 was +5.3%/year; from 2005 to 2011, it was -0.7%/year. However, I estimate, based on the 2005 to 2011 data, that the rate of change in post-2005 Global CNE (Cumulative Net Exports) was about -4.1%/year. In other words, I estimate that the supply of post-2005 cumulative global net exports is declining at about six times the rate that the volume of GNE is falling.
The observed rate of change in the annual volume of ANE from 2002 to 2005 was +4.4%/year; from 2005 to 2011, it was -2.2%/year. However, I estimate, based on the 2005 to 2011 data, that the rate of change in post-2005 Available CNE (Cumulative Net Exports) was about -11%/year. In other words, I estimate that the supply of available cumulative net exports is declining at about five times the rate that the volume of ANE is falling.
For post-2005 Global and Available CNE estimates, I extrapolated the 2005 to 2011 data. When I applied this methodology, extrapolating the 1995 to 2001 data, to the Six Country (Indonesia, et al) Model, it produced an estimate of Six Country post-1995 CNE that was too optimistic. The actual post-1995 depletion rate, from 1995 to 2001 was 50% higher than what the six year estimate indicated.
Updated “Gap” Charts:
EIA Total Liquids, 14 mbpd Gap:
(2002-2005 rate of change: +3.1%/year; 2005-2011 rate of change: +0.5%year)
http://i1095.photobucket.com/albums/i475/westexas/EIA_total-liquids_02-1...
BP Total Petroleum Liquids., 13 mbpd Gap:
(2002-2005 rate of change: +3.0%/year; 2005-2011 rate of change: +0.4%year)
http://i1095.photobucket.com/albums/i475/westexas/BP-world-production_02...
EIA Crude + Condensate, 14.5 mbpd Gap:
(2002-2005 rate of change: +3.1%/year; 2005-2011 rate of change: +0.07%year)
http://i1095.photobucket.com/albums/i475/westexas/EIA-CC_02-11_gap-1.jpg
Global Net Exports, 18 mbpd Gap:
(2002-2005 rate of change: +5.3%/year; 2005-2011 rate of change: -0.7%year)
http://i1095.photobucket.com/albums/i475/westexas/GNE_02-11_Gap-1.jpg
Available Net Exports (GNE Less Chindia’s Net Imports), 17 mbpd Gap:
(2002-2005 rate of change: +4.4%/year; 2005-2011 rate of change: -2.2%year)
http://i1095.photobucket.com/albums/i475/westexas/ANE_02-11_gap-1.jpg
I find the traditional charts showing global production (like the first one in Gail's post) don't capture what's going on very well.
With declining EROI and increasing price we need a picture that talks more about affordability than production.
So I've taken the data from the two charts in Gail's post and multiplied USA's daily production by the prevailing price of oil to see how much use of energy has and will cost. Ive used the Current Policies price scenario - which most commentators say is very conservative. But it will give you the idea.
This shows the daily bill USA has to pay just for the oil it produces and uses itself. Currently almost a trillion dollars a day! (Ten million bbl x $100) Interestingly USA is about the same place it was C1980 in terms of the bill, and 2008 was significantly less but the economy still fell over and it's been struggling since.
The chart shows clearly that we will have to find a lot more money to pay for oil in the future. I suspect the lowering of cost towards the 2030s is an artefact of poor guestimation of the oil price rather than a real effect; but of course by then Saudi Arabia and Russia will be consuming all the oil they produce and it will all be pretty irrelevant anyway wont it.
I'll run the same figures for Global data soon.
Interesting, but you should weight the components by price to get a better handle. NGL trade roughly at 2/3 the price of crude IIRC, likewise ethanol...
...as they should, given that they have about 2/3rds the energy content of crude.
That was implicit....
Moreover, the NGL-crude ratio has changed significantly over the range of the data shown...
nigwil, I think that should be almost a billion dollars a day, not a trillion.
Given that these numbers are for US production, and that income=expense, it means that somebody(s) is making a billion/day while somebody else is paying it.
Left pocket/right pocket from a national point of view.
Rgds
WeekendPeak
Yup, but still a lot! Sorry. N
nigwil - Did you mean production or consumption? Thanks for the effort either way.
Hi Rockman!
I just used the first chart in Gail's post above which is USA production. Obviously since USA consumes what - 18 million bbl per day - the actual expenditure/income of oil is proportionally higher but I just wanted to see what sense it made to see how much it all cost vs simple production and cost data shown on separate charts.
I don't have the IEA's global production data for their future scenarios through to 2040 (mean, not prepared to pay for the full report!) so can't do the global figure. I suspect the dip in the 90s would not be so deep, while the rise in cost will not be as steep due to overall flat global oil supply/consumption into the 2030s. Thats assuming their price scenario is close to real.
I think what we will see is price levelling out with flat production for a while as the world consumes all the cheapest oil sources, then when the price seeks to fall on falling demand we will find that there is no cheap oil left at all below the top price we are paying.
At that point producers will not be able to afford to produce because we cannot afford to pay them what it costs them, and there will not be any $40 oil around to supply anybody so ability to pay (aka demand) will come face to face with supply and the market will implode. That will be an interesting day.
First let me agree with the general consensus that we have reached the peak of cheap oil. However,we are in the early stages of the expensive stuff. Perhaps a Hubble curve should be applied to unconventional resources? Secondly, let me agree that unconventional comes with large financial and environmental costs. Our society is going to have to make a decision about whether those costs are worth the benefits of maintaining our lifestyle. I think that the emerging world has already voted yes on that count. NA and Europe is no longer in the driver's seat and hence I think these matters are effectively out of our hands. How it will all turn out I have no idea.
With regard to unconventional resources, while we group them into one bucket there is many forms of unconventional. I have mentioned oil sands and yes they have some big problems. They are not pretty places, but they contibute hugely to the liquid fuels supply of the North America and are increasing their contribution. In addition to diluting the oil with condensate (Dilbit), upgraders are being built which turn the 9 API oil sands into 38 API light sweet crude. Again this ain't cheap oil, but one can not ignore 1.7 trillion barrels of oil in place when the potential recovery factors are 50 to 70%. Lower costs and or higher prices will unlock vast recoverable reserves.
The other huge unconventional resource is shale oil. This only came on the scene in 2008 so everyone is adjusting to the new reality and no definitive statement about its future can be made. While things like the Bakken and Eagle Ford have receive all the attention, there are other emerging shale oil plays which are much bigger. The oil industry is realizing that if they look for the source of the huge conventional fields such as Prudhoe Bay they can find very large tight oil deposits. I would refer you to the recent development on Alaska's north slope and the Canol deposit near Norman Wells. These are in early stages of development, so I don't know how they are going to turn out; however, Great Bear and MGM Energy are basically forecasting that they can fill up the spare capacity in the Alaska pipeline and the Norman Wells pipeline over the next 10 years. This may be the hype of junior oil companies, but in the case of MGM Energy, Shell is their partner. I have reviewed some of the technical data and it looks pretty good. We are talking about a lot of oil even by Saudi standards. Not cheap oil but a lot of oil. As has been pointed out in other articles, the issue is not really the size of the reserves, but deliverability and cost.
In short, I think it is premature to forecast what is going to happen to unconventional resources. Oil Sand have flat production curves while oil shales have very steep ones. As a result, the oil industry sees them as diffent asset classes in their project portfolio. Add in Gas To Liquids(GTL) technology that Shell uses in Quatar and who knows what the future holds for liquid fuels, except that energy is getting more expensive. Over the long run, Gail's arguments about diminishing returns are correct. However, we all live in the short run and the early stages of a technological revolution such as occuring in unconventioal is marked by a dramatic lowering of costs and improving EROEI.
Well, that's all fine and dandy! However I have this sinking feeling in the bottom of my stomach that the bill for the ever increasing externalized costs of climate change, ecological overshoot, habitat destruction, species extinction, etc, etc... will come due, at what may, to most of us, be a very inopportune time. And she has been sending us past due notifications for a while now.
Mother Nature's bill collectors don't give a rat's a$$, if you happened to be sitting on the john with your pants down around your ankles or who you have waiting on the other line, they'll just yank that line right out of the wall with you still attached and fling you into the thorn bushes.
Buy yeah, that technological revolution sure can have some dramatic results... I just can't help wondering if our living in the short run is just going to keep getting shorter and shorter because of it.
Hi FMagyar:
Yes, your are probably right that the environmental bill is coming due. However, mother nature may not be fair in how it distributes the bill. While this is politically incorrect,some countries are going to benefit from climate change and many others are going to be hurt badly. That is not fair I know. As I sit in my home in Canada suffering through -40C, I often wonder what is the downside of having the climate change to something more like Washington State.
Climate change is going to happen because nobody want to turn off their air conditioners or stop going for holidays to Mexico. The issue is no longer how to stop climate change, but how are we going to adapt to it.
I would suggest keeping things in perspective, my family lived through the great depression and were imprisoned by the Japanese in China. Most NA have lived a pretty privledged life and thought they could avoid any form of suffering. Well we can't and NA is just starting to realize this truth. The rest of the world has always know it. You can't dodge the suffering bullet no matter how hard we try. The idea that we are somehow in control of the future is an illusion.
A post-2005 decline in Global Net Exports of oil (GNE), with the Chindia region consuming an increasing share of a declining volume of GNE, resulted in a doubling in annual global crude oil prices, from 2005 to 2011. This has provided plenty of incentive for oil companies to maximize their exploration and production efforts, but will their efforts make an incremental difference or a material difference, especially in the context of declining Available Net Exports? And in that regard, my key question:
My $64 Trillion Question
The following sketch (which illustrates my lack of Powerpoint skills) shows some normalized ECI and GNE/CNI values for the Six County Case History (Indonesia, UK, Egypt, Vietnam, Argentina, Malaysia) and for GNE, ANE and for Saudi net exports:
http://i1095.photobucket.com/albums/i475/westexas/NormalizedECIetal.jpeg
The index year (Index Year = 100%) for the Six Country Case History is 1995, and for GNE, ANE and Saudi net exports the index year is 2005.
In any case, here is what I have framed as the $64 trillion question.
Here are some simple percentage changes, from 1995 to 2001, for the Six Country Case History:
Production: -6%
Consumption: +12.5%
Net Exports: -29%
ECI Ratio: -15%
Post-1995 CNE: -75%
Note that after six years of declining ECI values, the cumulative depletion in the post-1995 supply of net exported oil was more than 12 times greater than the observed decline in production. (And again, the estimated CNE depletion rate after six years of declining ECI values was too optimistic.)
Here are some simple percentage changes, from 2005 to 2011, for ANE (Available Net Exports), and one estimate:
GNE: -4%
CNI: +63%
ANE: -12.4%
GNE/CNI Ratio: -41%
Estimated post-2005 Available CNE: -48%
Note that after six years of declining GNE/CNI values, the estimated cumulative depletion in the post-2005 supply of Global Net Exports that will be available to importers other than China & India is more than 10 times greater than the observed decline in Global Net Exports.
Some definitions:
GNE = Global Net Exports (Top 33 net exporters in 2005, BP + Minor EIA data)
ANE = Available Net Exports (GNE less Chindia's Net Imports)
CNI = Chindia's Net Imports
ECI = Export Capacity Index, ratio of total petroleum liquids production to liquids consumption
GNE/ CNI = Ratio of GNE to CNI
CNE = Cumulative Net Exports
NECI = Normalized ECI
N GNE/CNI = Normalized GNE/CNI
Westexas; Exactly! Thanks.
The huge gorilla in the room is the effect arising from ChIndia and other sensible countries locking in a huge proportion of GNE for their own personal use, and thus leaving 'the rest' sharing their diminishing slice of a diminishing pie.
The joy of being an oil exporter will also be enhanced briefly as energy-dependent industries move to establish in the few oil exporting countries that are safe to set up shop in. This will give that industry a longer run of energy security by operating within an oil exporting nation, but it will further hasten that countries decline in exports.
But for 'the rest' of the world whose oil supply is provided more or less totally by multinationals this decline in the available oil represented by you GNE-Chindia curves is very worrying.
It will be very interesting to see how Big Oil chooses to distribute the bit of GNE they can get their hands on to their customers once demand from 'the rest' really does exceed the supply. Our curiosity will be satisfied soon enough, methinks.
Gail, thanks for your piece on this topic.
After having read through some of the IEA WEO 2012 a couple of things occurred to me.
IEA acknowledges in their Current Policies and New Policies Scenarios that oil prices now have established at a structural higher level and are expected to see some growth from there.
During the last 3 decades (or so) economic growth was super charged by growth in debt and this added to aggregate demand (also for oil and other energy) and thus gave price support also to oil prices and as supply constraints were encountered (as from 2004) more debt was used that also compensated for the growth in the oil price. At some point the unhealthy mixture of growing costs for debt services and costs for energy would have an impact on real economic growth.
These things can go on, until they cannot.
Some of the countries with high public debt to GDP ratios now acknowledges it will take them decades (with austerity measures) to reach debt to GDP ratios they have agreed upon (within EU this has been 60% public debt of GDP). Households will be/are also into debt deleveraging.
Debt deleveraging will also impact economies (public and household) energy consumption and abilities to pay for higher priced energy. I find it interesting that such an evident connection is not presented by IEA.
Key word is affordability.
The marginal barrel now comes in the range of $70-$90/bbl which makes oil extraction capital intensive and leaves poor/meager returns for most companies involved in these activities. For some companies it becomes more important to maintain cash flow than look at profits. Without “healthy” profits companies will become financially weaker and have weakened ability to enter into new investments.
New developments rely on access to credit/debt to be realized and all companies have a limit to how much debt they can take on. These companies are in the business to make a profit and if the profit is not there (or uncertain) they will not make the investment. Without the profits oil companies go out of business which may not help the supply side.
IEA apparently assumes the investments will be there without looking at the companies long term abilities to undertake projects with meager returns and/or what effects higher debts will have on their capabilities and further that the capital will also be there. These things may not be a given.
- Rune
Hi Rune:
I wonder if you are not making the mistake of overgeneralizing when you draw conclusions from statistic that the marginal barrel costs $70 to $90? This may be true on average, but there is a distribution of marginal costs. Some new oil is much cheaper and a some is more expensive. You really have to do an analysis on a case by case basis rather than on averages.
While there is a financial train wreck in shale gas, the profitability of some unconventional oil deposits is pretty good. Take a look at the income statements and debt levels of companies like Suncor, Imperial Oil, Cenovus,and MEG for example. They are focused on unconventional oil and are making resonable returns on invested capital with conservative balance sheets.
You may also be overgeneralizing at a country level. All the countries of NA and Europe are not the same. My country - Canada - is in pretty good financial shape. Although a small player it does show that a country can recover from very high debt levels relatively quickly. You may recall that the Canada currency was called the northern Peso just a decade ago because of its unsustainable debt levels. We overcame than and did not suffer a banking crisis in 2008. The USA has high debt levels but it is not Greece because the USA has relatively low taxation rates. If they taxed at the rate of Norway, they would be running a surplus. The USA has a political problem more than a fiscal one.
Welcome oileng, (I see you have been registered for 6 weeks or so)
Let me phrase it in a different way:
How many developments would have been sanctioned with an oil price of say $70/bbl?
(I have looked at data from the North Sea, oil sands and shale oil!)
And how much would that add to flow?
Yes, I am aware that all companies are not created equal.
And true not all countries are created equal, Canada and Norway is doing well being exporters of high priced natural resources. But both Canada and Norway has a housing bubble waiting in the wings to bust.
What made Canada recover? Increased resource demand and resource prices?
To believe that an economic slowdown in several economies may be insulated is quite new to me.
If USA increased taxes (to reduce budget deficits) that would certainly impact consumer spending and also demand for oil and energy.
And what has growth in (public and private) debt levels done to demand (also oil)?
- Rune
Hi Rune:
I am not sure about your F+D costs of $90/bbl. Here are some costs from the Income Statements of companies involved in Shale Oil and Oil Sands. I derived them by dividing their DDA by their production. They are all still operating companies except Brigham who was bought by Statoil.
Crescent Point - $35, Brigham - $22, Petrobakken $29, Cenovus $11.
The first 3 are shale oil companies and the last is an in-situ oil sands company.
I would agree that Shale reserves are problematic with a large variance in estimates. I personally think that shale gas reserves are dramatically overestimated. However, the uncertainty applies not only to the energy companies estimates but also to analysts such as yourself and myself. Shale oil is even a more recent development than shale gas. Hence drawing any conclusion about how shale oil is going to turn out is very premature. I would say we are falling into the logical fallacy refered to as "Hasty Conclusions" when making any definitive conclusions about this very recently developed resource. The first major shale production began in 2008. I think I have mentioned Alaska and the Canol. These resources are much higher quality than the Bakken.
You cannot place Oil Sands in the same bucket as oil shales as the reserve estimates are not subject to the same level of uncertainty. Both in-situ and mineable reserves estimates are pretty good. The size of the technically recoverable reserves is also pretty solid at 1.7 trillion. I would also say that the recoverable reserves are pretty good at 850 to 900 billion barrels. What is not clear is what the economic reserves are. They are presently 170 billion. However, if Cenovus's F+D costs Of $11/bbl are reflective of the industry, then the economic reserves could be much larger. Imperial (Cdn arm of Exxon Mobil)is planning to expand to about 500,000 bopd.
Respectfully OilEng
Hello OilEng
I am referring to total (break even) costs not only F&D.
Total costs includes costs for acreage acquisition, development costs (for shale oil wells these are related to how productive the well is, so there is a wide spread, so my objective was to find an average from using data from several hundred (of the better) wells).
I have not concluded about a continuation of the trend documented for shale oil wells (Bakken), but in a year or so we will know a lot more. But so far I have not seen a trend change relative to what I documented from looking at the most recent data.
Then there are operational expenses, like for processing, transport, administration, insurance (to name a few) and these may vary according to location and among companies.
Then add costs for taxes and royalties.
Then there are financial costs and fees. Many companies use debt to finance their activities/projects.
Companies have a requirement on return on investment that may vary, but usually may be found in the range of 7 - 15%.
Then there are discount effects as the projects normally run over several years.
I never placed the oil sands in the same bucket as shale oil. What makes oil sands challenging is the high front end capital investment which results in a break even price of $35-40/bbl (higher if an upgrader is built). Reserves estimates for oil sands were never an issue for me. Then add OPEX, transport, taxes, royalties etc.. The total brings the break even into the area of $70-$80/bbl.
Those who got in early in the oil sands most likely got the best areas and built their facilities when costs were lower.
In the North Sea the break even cost is of course dependent on the reserves, water depth, location etc. but typical for several of the most recent developments are a break even in the range of $50-$60/bbl, Johan Sverdrup (1.8 Gb of reserves) is estimated in the range of $20-$30/Bbl.
(I have been an employee (for decades) of several international companies and worked with field/area developments)
However anecdotal evidence is that the cost inflation in the oil sands (Alberta) has motivated companies to move into shale oil as this represents less capital up front investments.
If you could get the economics to work (in shale oil or oil sands) with the numbers you referred to, you should get started and I will wish you all the luck.
Best
Rune
"Households will be/are also into debt deleveraging."
I think this groundswell of deleveraging will necessarily increase, and is what the financial PTB/oligarchy fears most; a base that is either unable or unwilling to keep the debt bubbles inflated. Personally, any surplus my family sees will be devoted to deleveraging and building local resilience, and won't be invested in the larger economy as it was in the past; local protectionism. This also involves reducing our tax liabilities. We're taking steps to no longer be feeding at the debt trough.
Apologies to those who rely on discretionary, optional, and investment/debt capital for their livelihoods. Suggest you make other arrangements.
Speaking in general and broad terms;
Banks increased their base for interest incomes by increasing loans (house mortgages, other consumer credit). This increased the income for banks from growth in interest payments and made it possible for the banks to make more loans.
In many ways and IMVHO we are at or approaching a crossroad here:
Households (and others) are approaching/have reached their limit for how much debt they can take on (that is abilities to service) so growth in consumer debt has slowed (or even declined if defaults are included). Banks have (thanks to income from a growing flow of interest payments) increased their base for issuing more debt, but now it seems like the base for new borrowers is drying up.
As I see it there is only one thing that could make it possible for banks to increase (their volume) loans; Wage earners need to increase their take home pay (get a pay increase), but looking at data the opposite appears now to happen (slight decline in wages), making it harder for households both to service their debts and/or absorb increased prices for food and energy.
Staying low on debt or reducing it to manageable levels is IMHO a sensible thing to do.
- Rune
Rune,
You make a lot of good points.
Affordability is what "demand" is all about in my way of thinking. More debt also helps ramp up demand, but consumer debt too can face limits.
Gail: Regardless of some minor corrections posted by others you have posted a Great report with some really big hitter items/points that folks need to consider. Yes North America includes mighty oil reserves of Canada, etc etc. But your points about how this expensive 'high hanging' fruit (oil) will impact economics/recessions/etc are spot on. And as posted by others, our natural gas is going to allow NA/US to meet our energy needs, but your points regarding how crude will fit into the picture/economy are well taken and are important. Your graph with the leveling effect of crude starting in 2005 should send a huge message to folks. Again, great post and points you have made. Regards.
THanks!
Wow, what a surprise! The Oil Drum printing an article attacking the IEA's projected US oil production rise. /sarcasm
Oh, so now that the US is seeing oil production increases well beyond what most people on this site would have guessed just 3 or 4 years ago, now that it's actually happening it's suddenly dismissed as "a distraction." *rolls eyes*
And BTW, the IEA isn't the only one predicting big rises in US production. Since it seems to already be forgotten, even Matt Simmons' own firm is on board.
It's really funny The Oil Drum spends so much time criticizing others for their predictions of increased production, but their own past predictions are conveniently forgotten about.
Since the editors of TOD don't want to be reminded of the predictions contained in their own past articles, perhaps someone else needs to do the dirty work.
LINK
LINK
Not to mention the (in)famous forecasts by ace for world production from a few years ago. Maybe y'all should actually re-read those old threads and, like, learn something!
You guys have a lot of nerve criticizing other peoples' predictions when your own forecasts have hardly been anything to brag about.
There. For the entertainment value I've updated one of those fancy-schmancy mathematical models someone devised a few years ago which is now looking like a complete joke. *inserts laughing smilie*
Wow! Quite a rebound, considering the quadrupling of crude prices. /sarc
I don't suppose it matters that the charts were derived primarily from EIA data, since you take such delight in pointing the finger a TOD.
OK Abundance, now it's your turn to stick your neck out and tell us what the US and world C+C production will be in 2017. Telling us what production has been in hindsight doesn't count.
US c&c production in 2017 will be somewhere between 7 million bpd and 10 million bpd. This chart seems to show a reasonable range of projections.
As for world production, it will be somewhere above where it is now. How much above, I don't know.
US production at 10 million bpd by 2017. That works out to an increase of 1 million bpd per year in each of the next four years. Do you really believe this is possible?
Note that I said 10 million bpd was merely the upper end of the range. In all probability, the actual number will be less than that. But it will almost certainly be above 7 million bpd, especially since, as of last week, we reached 6.7 million bpd and are almost certain to reach 7 million sometime next year.
-- Last week US domestic C&C production was at 6.709 million bpd. That represented a rise of 815K bpd in one year.
-- The corresponding week last year US domestic production was at 5.894 million bpd. That represented a rise of 297K bpd in one year.
-- The corresponding week of 2010, US domestic production was at 5.597 million bpd. That represented a rise of 280K bpd over the corresponding week of 2009.
So for the past 3 years, we've seen an average rise of 464K bpd. If that average holds over the next 5 years, November 2017 should see just over 9 million barrels/day. Note that this assumes the increase of the past year moderates over the next 5 years (464K < 815K).
I am a little lost...
who is saying what now?
IEA says one thing
EIA half a year ago something completely opposite?
http://www.eia.gov/todayinenergy/detail.cfm?id=4910
just to remind you about the numbers
EIA projects that U.S. domestic crude oil production will increase from 5.5 million barrels per day in 2010 to 6.7 million barrels per day in 2020. Even with a projected decline after 2020, U.S. crude oil production projections remain above 6 million barrels per day through 2035.
5.5 million barrels of oil in 2010.. officially and not mixing apples and oranges as
next big or small futures like to do..
this matches nicely the Figure 29 our abundance whatever person has and
what about new glasses when one looks at plots?
yes natural liquid gas is added now
and next we add coca cola
and .. blood
what about declaring Iraq and Iran and Saudi Arabia a new member state of the USA?
than i understand that numbers look fine...
As of last week, the US is *already* producing 6.7 million bpd of crude & condensate only. The EIA's forecast is already out of date.
Condensate is a natural gas byproduct and will tend to follow the natural gas production curve. The EIA was probably forecasting crude oil only, and crude oil production is not on the same steep upward curve as natural gas, hence the difference..
The NG producers are not making any money on NG and are producing as much liquids-rich gas (high in condensate) as they can to maintain cash flow, as distinct from profits. We will see how things settle out in the long term when economic realities hit the NG producers.
Abundance, you stated that the chart from Smith Bits, Simmons International seems to show a reasonable range of projections. However, when Frugal points out the rate of increase, you say
In less than an hour the upper range production value went from "reasonable" to unreasonable. As a result, you seem to be agreeing with Gail that the IEA oil production forecast is unrealistically high, with respect to US oil production. Is this accurate?
First of all, the IEA projection includes biofuels and NGL's, if I'm not mistaken, while the chart from Smith Bits, Simmons International shows crude & condensate only. When I was replying with the chart I was not really referring to the IEA projection, I was talking about crude & condensate only. So technically, if we're talking about crude & condensate only, then 10 million bpd in 2017 is probably a high forecast. But if we include all-liquids, as the IEA tends to do, then yes, it's realistic.
The Baker Hughes Rig Count shows the number of rigs drilling for oil in the U.S. leveled off last summer. What makes you think a big part of that increase was not transitory caused by the increase in rigs drilling for oil over the last few years? The increase in U.S. C+C production might level off or increase more slowly.
So your projection is based on extrapolating a short term trend on a graph without any consideration of physical factors. Notice that if you had done that to the increase in U.S. production circa 1978 you would have grossly overestimated by 1982. You are also projecting a rate of increase (4 Mb/d increase over 8 years) that exceeds any historically observed in the U.S.
My qualitative projection was/is that U.S. C+C production would respond to increasing price by staying between 5 Mb/d and 6 Mb/d for about 20 years instead of continuing to decrease below 5 Mb/d. I think there will be a little price response and you think there will be a big one. Time will tell.
Say what you will, but abundance has a point.
I generally share his view that by 2017 world oil production is going to be above where we are today, but I don't think that it will be by a massive amount and I think the real oil prices(inflation-chained) will be higher by that year.
So Peak Cheap Oil has already happened and it will get intensified.
That being said, if the rise in oil prices is steady but slow, economies can and will adapt. It won't allow high growth but it will at least make life functionable, rather than imminent doom and glowing fire.
Of course, nobody can be certain, which is the entire point of his pointed reply. We don't know. But the Peak Oil community should be more humble going forward, without losing the essential insight: that the easy days are over.
I personally think that by the end of this decade, unless there is rapid new development of new unconventional oil plays, we will face pretty stark choices. But it won't be abrupt.
In reference to my "$64 trillion question" up the thread, some numbers (which appear to be impossibly pessimistic) follow, but then we have the Six Country Case History . . .
In order to estimate CNE (Cumulative Net Exports) from an exporting country whose production has shown an inflection point, i.e., either a production decline or the start of an "Undulating Plateau," I extrapolate the multiyear rate of decline in the ECI ratio (ratio of total petroleum liquids production to liquids consumpiton) to estimate when the ratio would = 1.0 (when production = consumption).
Given the tendency for net export declines to show an "Shark fin" pattern, I multiply the annual net exports, at the inflection point, times the number of estimated years to zero net exports, times 0.5 (to get the area under a triangle), less annual net exports at peak. That was my "Cowboy Integration" method for the following four estimates:
All of the following estimates are based on extrapolating six years of declining ECI values or declining GNE/CNI values (1995 to 2001 for the Six Country Case History and 2005 to 2011 for Saudi and global data):
Estimated Six Country post-1995 CNE:
9.2 Gb
Actual Six Country post-1995 CNE:
7.3 Gb
Estimated Remaining Six Country post-1995 CNE, at the end of 2001:
3.7 Gb
Actual Remaining Six Country post-1995 CNE, at the end of 2001:
1.8 Gb
Note that the actual Remaining Six Country post-1995 CNE number, at the end of 2001, was about half of the estimated value.
Estimated post-2005 CNE for:
Saudi Arabia: 45 Gb
GNE: 445 Gb
ANE: 168
Estimated Remaining post-2005 CNE, at the end of 2011, for:
Saudi Arabia: 28 Gb
GNE: 349 Gb
ANE: 87 Gb
Annual net exports in 2011 for:
Saudi Arabia: 3 Gb/year
GNE: 16 Gb/year
ANE: 12.8 Gb/year
Estimated Remaining post-2005 CNE, at the end of 2011, divided by 2011 annual net exports per year, for:
Saudi Arabia: 9 years
GNE: 22 years
ANE: 7 years
This is of course analogous to an estimated R/P ratio, and of course, even if approximately correct, countries don't produce or export at a flat rate for a number of years and then go to zero, but it's a useful metric.
Six Counties: Indonesia, UK, Egypt, Vietnam, Argentina, Malaysia
GNE = Top 33 net exporters in 2005, BP + Minor EIA data
ANE = GNE less Chindia's Net Imports (CNI)
Charts posted by a member of TOD, JonFreise, in the comments section, Stuart Staniford in an article showing various curve fits using Hubbert models and created by Ace are not the predictions of the Oil Drum. The Oil Drum posts many predictive charts covering the full range from pessimism to optimism. Ace's chart is and never was more than a lower bound case due to his assumption that war in Iraq would constantly suppress their production and his use of Wiki Megaprojects, a short term and noncomprehensive predictor, as a discovery model.
My comment on a Washington Post editorial
http://www.washingtonpost.com/opinions/a-us-energy-renaissance/2012/11/1...
TOO MUCH OPTIMISM
The IEA projections relie on 133% of growth# to come fraced "tight" oil (Bakken, Eagleford) as their production climbs and climbs. Given that fraced tight oil wells decline by half in 18 to 24 months, and rapidly decline after that to perhaps a sustained 8% to 15% - the IEA projection is not quite believable. The number of wells required grows dramatically.
When one adds in that the "sweetest spots" have apparently already been drilled in the Bakken (the first 12 months of production from summer 2011 wells are significantly lower than the first 12 months of summer 2010 wells) and the IEA projection IS unbelievable.
# The IEA projects continued decline in US conventional oil production. So tight oil must first offset this decline before increasing US oil production.
The IEA projected almost as much consumption decline (45% of imports) as production increases (55% of the gap). Let us hope that estimate is too low.
More discussion at
http://www.theoildrum.com/node/9622#more
Hi Alan:
I think it is very premature for the IEA or anyone else to draw any conclusions about Oil Shale. The first major production from oil shales begin in 2008. I have read Rune's article on the Bakken - The Red Queen - and it is very good. However, it is based upon the limited amount of production data available.
So the IEA and eveyone else should hold off making "Hasty Conclusions" about oil shales either on the pessimistic or optimistic side.
While the Bakken and Eagle Ford have ramped production up dramatically and hence are the stars of the oil shale show. There are much better and much bigger shale resources in North America. The emerging Alaska North Slope play and the Canol could put the Bakken and Eagle in the shadow. I do say could because I am not sure how they are going to turn out. If you are interested Google "Great Bear Petroleum" and "MGM Energy". The key point is that the oil companies are now looking at the giant conventional reservoir and tracking down the source of that oil. Those oil shale may hold reserves an order of magnitude bigger than the conventional giants such as Prudhoe Bay or Norman Wells (Canol).
The big question is whether those reserves can produce at economic rates. I don't know the answer to that question and neither does anyone else. The technology is rapidy developing and the cost are coming down. For example, in NE British Columbia, Shell is capable of drilling 30 wells off a single drilling pad.
I also think the popular press is confusing huge reserves with the ability to produce large amounts of oil. Shale oil is high cost and low productivity oil. If the production forecast are correct - and do say IF - a lot of the oil comes out later in the life of the well when the shale wells are stripper wells. I am not convinced that the stripper wells (low production) well are economic, but at this point I don't know.
Shale Oil is a game changer, but how is it going to change the game? My speculative hypothesis is that it cannot arrest the decline in conventional reserves without much higher oil prices and and I am not sure if the economy can afford higher energy prices.
As I have mentioned in other posts, don't confuse oil shales with oil sands. Different unconventional resources have different economics. Oil sands are profitable and becoming more so with improving energy efficiencies.
OilEng,
North Dakota Industrial Commission (NDIC) Lists Bakken production as far back as 1953!
The ramp up in adding wells took off in 2006 and then accelerated.
When a company decides to drill a well this is based upon informed expectations, they will not know if the well is economic before some time after it has been in production. Certainly as companies gain experiences they become better in planning wells, but even then they may run into surprises.
My decline profile was derived from documentation from ND Government’s pro forma well. They ought to be in a good position to know how an average well will perform; after all they are in it for the taxes.
Based on my study of the wells (in Bakken North Dakota) it turns out the decline form year 1 to year 2 on average is 50%.
Normally a well in Bakken is put on a pump after 6 – 12 months, and the well will be in operation as long it has a positive cash flow.
There could be other shale plays offering better opportunities, like the giant Bazhenov in Russia which now is in an experimental phase.
- Rune
Hi Rume:
Sorry, if you felt that I was in any way putting your study down. I think you did a fantastic job of the Bakken.
Yes, Bakken production has been going since 1953, but you cannot compare vertical production to multistage fracking. You are quibling a bit as to whether horizontal production began in 2006 or 2008 as I stated in an earlier post. Even taking wells drilled in 2006 (for which there are not many), 6 years of production is a short time when shale oil wells are projected to be producing for many decades.
Your confidence in ND Government is sensible, but the type curves are conjecture beyond a few years as no one has produced a shale oil well for 20 years. As a result, the range of uncertainty is great. To be making optimistic or pessimistic projections is simply premature.
All oil production is on a treadmill. Your study on the Bakken pointed out the speed of the treadmill may be too fast to grow production any further. I most certainly agree that the shale oil treadmill is going a lot faster than the conventional one. Whether it is going too fast to continue to grow production remains to be seen. I found your arguement convincing, but I do think you have to recognize the limitations of your data set and ability to predict the future.
I gather that you are not familar with the Canol or the Alaska play from your comments. This is not a critism, but it does show how quickly things are changing and how difficult is to keep up even for an expert like yourself. Even if the Bakken and Eagle Ford do plateau and decline, other oil shale plays may ramp up and provide many millions of BOPD. I did say MAY as I am skeptical of the claims of the likes of Great Bear Petroleum which has told the Alaska Government that they can fill up the Alaska pipeline as Prudhoe declines. Seems a bit of stretch, but who knows at this early stage of the game. Socrates was called the wisest man in Greece because he knew the limits of his knowledge.
Again, please take my comments as being respectful.
OilEng
OilEng,
I do not consider your comment as disrespect (If I had, I would not have replied.)
I am aware of the Great Bear presentation, and I have this wait and see attitude.
I am a "hard data" type, show me the hard data upon which I can form an opinion.
Just so that we are not talking above each other heads; the wells I used in the Bakken study had all been started January 2010 and later, just to get the effects from new well designs.
I did not make any predictions about future developments in average well productivity (I simply showed results from hard data).
I have seen maps (proprietary information!) that shows most wells are now in what is referred to as "sweet spots" and the areas outside of these are leaner. But still I think the companies are learning more as time passes.
Presently there are newer wells doing great, average and under performing.
There is another effect at work given little attention and that is the use of debt and companies have different abilities to take upon debts. This is part of what is referred to as "Economic Risk Management", a properly run company will try to avoid to get caught with too much debt for the case of decline in oil prices. Increases in oil prices leaves room for expansion; more drilling.
Best
Rune
Hi Rune:
I am learning a lot from our discussion. Thank you.
I have been conducting a reserve review of the Canol Shale. There is not enough information about the Alaska play to do anything meaningful. The Canol is a bit unusual in that the play is entirely owned by the majors who are very well capitalized - Shell, Imperial (Exxon's Canadian Sub),Connoco and Husky who made commitments to the Canadian Federal Govt to spend $620 million in return for the petroleum rights. MGM is the only small fish and they got in by accident. I think as Shale Oil technology matures the large companies with deep pocket will come to dominate. An example is the Bakken takeover of Brigham by Statoil. Shale oil requires oil sands level balance sheets.
The following are my reserve estimate for the oil window. I only show you them to demonstrate the very high range of uncertainty, rather than to indicate that any particular value is correct because there is just not enough data. The main issue is not the OOIP (original oil in place) but the recovery factor which of course is a function of the economic flow rates. The Canol is tectonically fractured so the majors have stated that they are going to get some wells which will flow without fracturing.
The following estimates are only for the oil window. The wet gas and dry gas windows are probably as large in BOE terms, but everyone is excited by the oil of course.
P90 2.1 billion barrels (90 percent chance of getting greater than 2.1 billion)
P50 13.9
P10 33.4
A huge range of possibilities and then there is the possibility of not getting commerical flow rates which I would assess at about 30%.
Since you like technical stuff, I have a technical presentation given in Calgary this July. It is focused on the Canol, but also compares the technical aspect of various shale plays in North America. I don't know how to do attachments, so if you like perhaps I can send it to you somehow???
cheers
OilEng,
Thank you!
The idea with TOD is to learn and discuss, I have learned lots of stuff from TOD.
You can find my e mail address by clicking on my name in the comments box.
ONE THING
If you wish to send me anything I will of course appreciate it, but DO NOT forward anything containing proprietary information!
The oil may be there, question is if it is commercial viable; that is will it flow such it makes the economics work.
Even being a well capitalized company (major) is not a guarantee that they get it right, but as many of them are vertically integrated (also owning and operating refineries) they may make an overall profit in the value chain, even if they have (small) losses in parts of it.
Best
Rune
I don't know much about the Bazhenov, but it may very well be another example of a very high-cost source of oil, if it is in Siberia, and fracking is a challenge. If we have $200+ barrel oil price, it may be helpful, but probably not $80 or even $100 oil.
Another reason why price makes all the difference.
"without much higher oil prices and and I am not sure if the economy can afford higher energy prices."
This is a KEY point. Look at oil prices quadrupling from 2000 to 2008 and then the crash of 2008. Cause and effect can get tangled and confused, but the crash may have been much more than sub prime lending.
The fast that the world can not seem to get out of the crash 4+ years later may have something to do with high oil prices. Classic economics says that oil prices should be lower with lower demand. There is that bit about supply that gums it up however.
Thank you Gail.
You have stimulated a great conversation. I agreed with your conclusions in regard to conventional oil that the costs are only going to increase because of the principal of diminishing returns. I have disagreed with you about unconventional oil as the technology is not mature. When technology is new the costs tend to drop. I have also made the point, that shale oil is too new to make any predictions.
However, oil sands are different. For NA oil production, the dominate source of new crude is going to be the non-conventional bitumen deposits of Canada with 1.7 trillion barrels of OOIP of which 50 to 90% is technically recoverable.
Economically recoverable reserves are dependendent upon the supply costs which Rune feels are in the range of $90 per barrel. At this price folks such as Jeff Rubins argue that our economies will not grow enough to get us out of our debt trap. It is this last point that I would like to give some hard numbers to.
The Canadian Energy Research Institute in March 2012 published a report outlining the supply costs of non-conventional bitumen resources. These supply costs include a 10% REAL rate of return, royalties, energy inputs, abandoment costs, etc. The cost for SAGD in which oil is produced from wells using Steam Assisted Gravity Drainage is $64/bbl WTI equivalent WTI equivalent means they have adjusted for the poor quality of the bitument crude. The supply costs of surface mined oil sands is about $80/bbl. If they upgrade the 9 API to 38 API rather than sell it to a refinery as is, it costs another $10/bbl. It should be pointed out that while the surface mining operations get all the negative attention, the stuff produced out of wells - SAGD - comprises 80% of Canada's oil sands reserves.
http://www.ceri.ca/images/stories/2012-03-22_CERI_Study_128.pdf
Further, the SAGD and other in-situ operations are a relatively new technology and the costs are dropping and the oil recovery rates are increasing. I know this first hand as two of my engineering buddies are in senior positions in two of the largest SAGD projects.
As a result, there is a very large source of $64/bbl oil available in NA and the costs of producing that oil are dropping. The operating costs are dropping at they reduce their Steam Oil Ratios (SOR) and they are learning how to control capital costs on these very large projects. I believe that the most recent project to come on stream was Kearl - Exxon/Imperial - which came in on budget. They are planning to expand to about 500,000 bopd now that phase 1 is completed.
There is a question of how much is available to be invested, now. I know we are reading stories like Mining Canada's Oil Sands: Suddenly, Not a Sure Thing
While some technologies may be better, others are becoming higher priced.