Oil Watch - Rest of World Oil Production (IEA)
Posted by Euan Mearns on December 7, 2012 - 12:56pm
Executive Summary
This is the final installment of the tour of global crude + condensate + natural gas liquids (C+C+NGL) production data as published by the International Energy Agency (IEA) and deals with the rest of the world. OPEC and OECD production was described in earlier posts.
After many decades of growth, Chinese oil production appears to have stalled in 2012 at just over 4 million bpd. It remains to be seen if this is a temporary glitch or whether this heralds peak and decline in Chinese oil production.
Russia + Former Soviet Union (FSU) production has been on a plateau for 3 years at just below 14 million bpd. Russian production continues to grow slowly offset by declines in other FSU states.
Oil production in Oman peaked at 960,000 bpd in 2001 and declined steadily to around 700,000 bpd in 2008. An aggressive program of enhanced oil recovery (EOR) has turned things around and production has risen by over 200,000 bpd in the last 4 years and Omani production is challenging the 2001 highs. There are profound lessons to be learned here about the potential impact of EOR on heavy oil fields and future global production.
Columbia has also seen a reversal of fortune with new field developments reversing declines and new production highs just under 1 million bpd have been set in recent months.

Figure 1 Oil production has been largely flat in South and East Asia over the decade, rising slowly from 2002 to 2011 and since then in gentle decline. Production in China and India has been rising offset by declining production in Indonesia and Malaysia. All data published in this interim report are taken from the monthly IEA Oil Market Reports.
From May 2007 to August 2010, Rembrandt Koppelaar published an e-report called Oil Watch Monthly that summarised global and national oil production and consumption data from the International Energy Agency (IEA) of the OECD and Energy Information Agency (EIA) of the USA. This is the fourth in a series of new Oil Watch reports, co-authored with Rembrandt and details crude oil production data for the Rest of The World as reported by the International Energy Agency. Earlier editions:
Oil Watch - World Total Liquids Production
Oil Watch - OPEC Crude Oil Production (IEA)
Oil Watch - OECD Oil Production (IEA)
South and East Asia
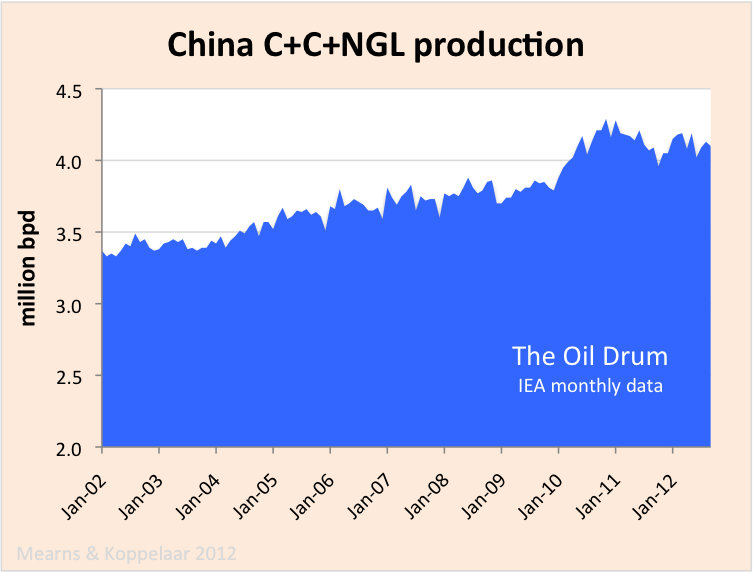
Figure 2 Oil production in China rose gradually from January 2011 to a near term peak of 4.29 million bpd in November 2010. Since then production growth has stalled giving rise to a bumpy plateau / slow decline. Static production in China could be one reason that the oil price has remained strong in recent years. Note chart not zero scaled.
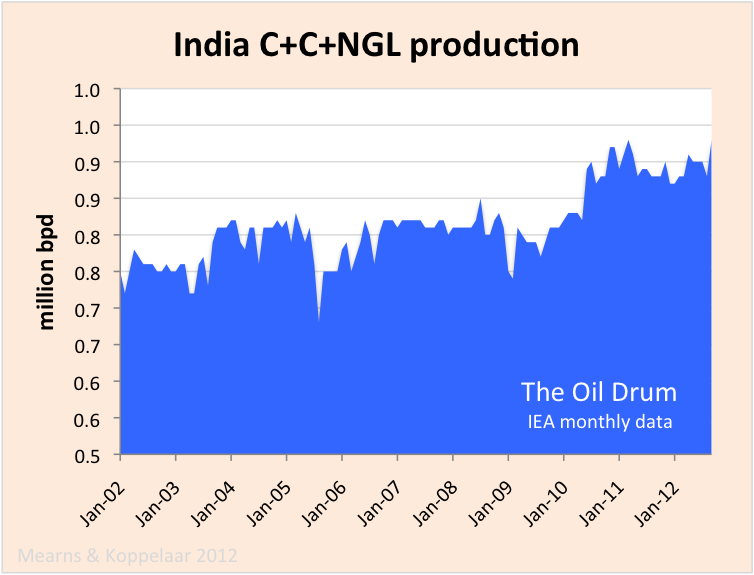
Figure 3 Oil production in India has grown from around 800,000 bpd in 2002 to around 950,000 bpd in 2012. Note chart not zero scaled.
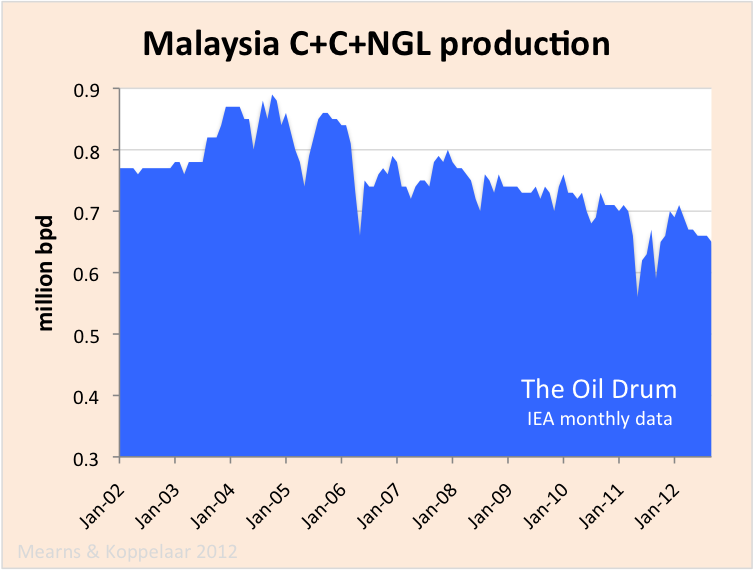
Figure 4 Oil production in Malaysia peaked at 890,000 bpd in October 2004 and since then has been in steady decline. Note chart not zero scaled.
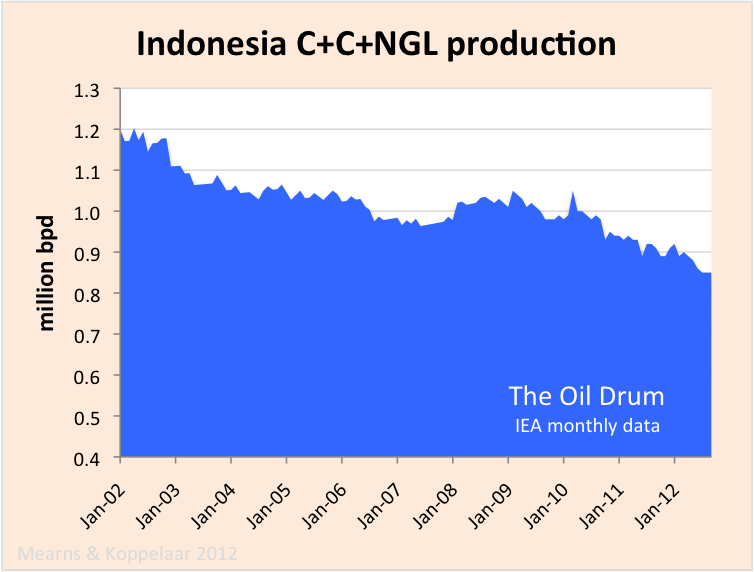
Figure 5 According to BP, Indonesian oil production peaked at 1.67 million bpd in 1977 with a second peak of 1.67 million bpd in 1991. Since then production has been in steady decline. Note chart not zero scaled.
Russia and Former Soviet Union

Figure 6 Combined Russian and FSU production has been on a plateau of between 13 to 14 million bpd for 3 years. Russian production is still rising slowly offset by declining production elsewhere in the FSU.
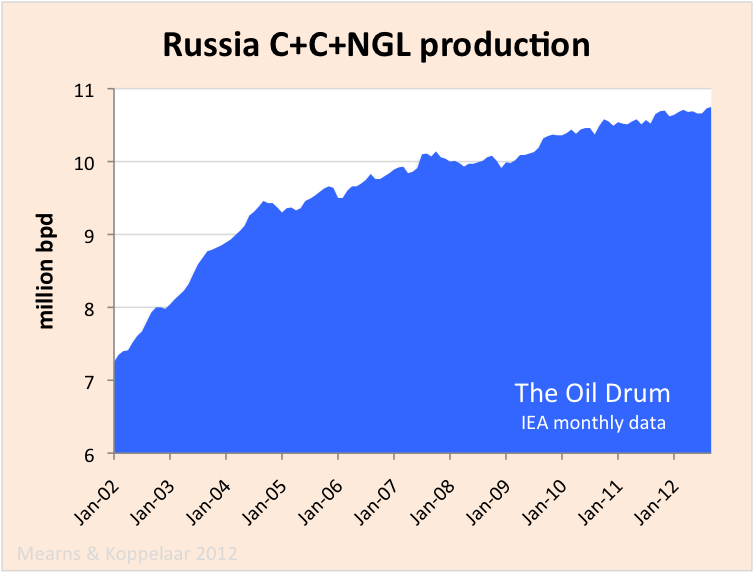
Figure 7 Russian production rose sharply from 7 to 10 million bpd from January 2002 to January 2008. Since then the rate of growth has slowed dramatically but the direction is still quite definitely up. A near term peak of 10.75 million bpd was hit in September 2012 but this still falls short of production >11 million bpd of the late 80s. As pointed out in this recent post, the Russians are having to pull out all the stops to maintain production at these levels. The slowing of growth in Russian production may be a factor in persistent high oil prices. Note chart not zero scaled.
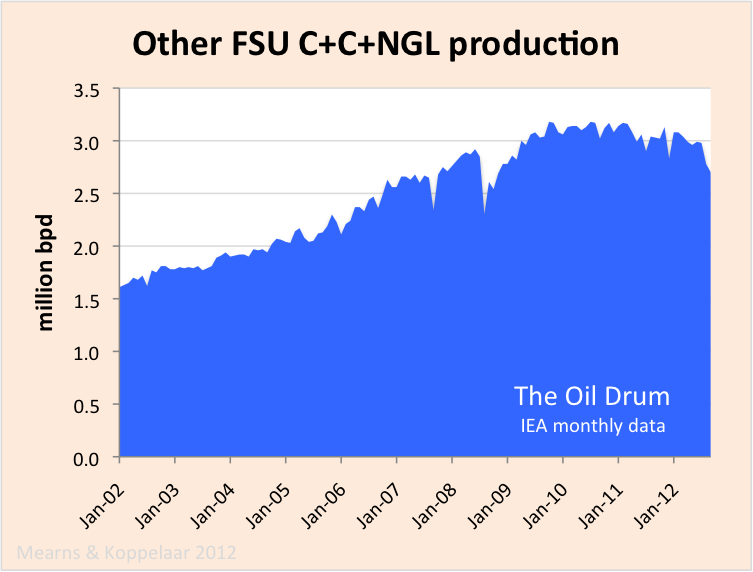
Figure 8 The countries of the FSU comprise Kazakhstan, Azerbaijan and Turkmenistan. These countries are reported separately by the EIA and so when we get around to plotting that data a clearer picture of the FSU will emerge. FSU production rose sharply from 2002 to October 2009 at which point production growth stalled at 3.18 million bpd. Since then production is showing signs of entering a decline phase which is another factor pressuring oil supplies. Note chart not zero scaled.
Middle East Excluding OPEC Countries
Production from the Middle East OPEC countries is described here. In the non-OPEC countries production has declined from around 2 million bpd in January 2002 to 1.5 million bpd in September 2012. Growing production in Oman bears witness to a major success story involving enhanced oil recovery (EOR). Production in Yemen and Syria is in decline and affected by civil unrest in recent years.
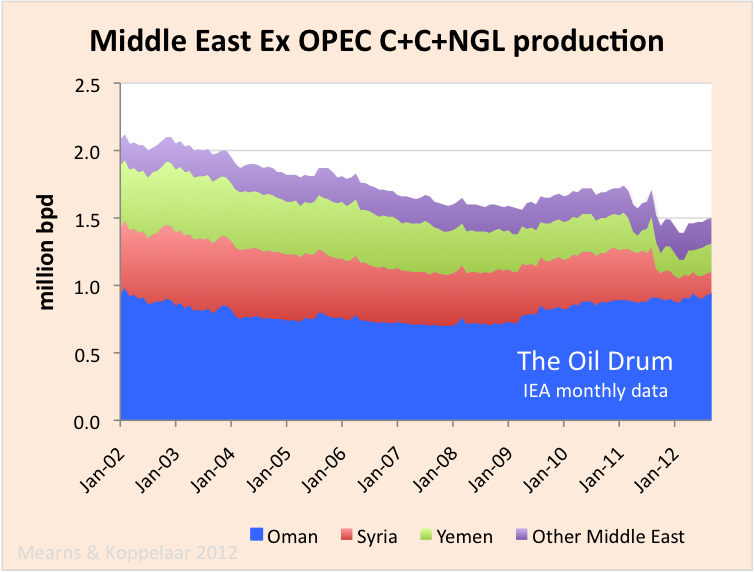
Figure 9
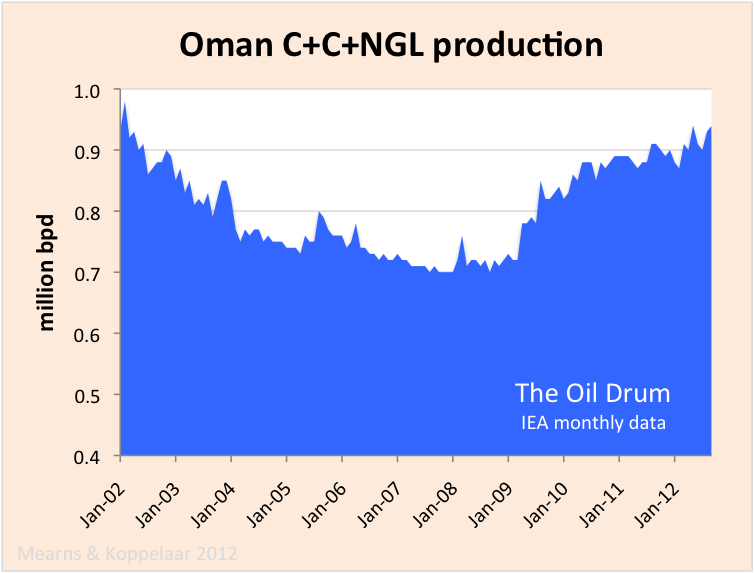
Figure 10 According to BP, oil production in Oman peaked at 960,000 bpd in 2001 and following that it entered a period of steady decline hitting 700,000 bpd in September 2008. Since then, there has been a somewhat miraculous turnaround with production growing steadily to reach 940,000 bpd in September 2012. This has been brought about by the application of a range of EOR techniques to Oman's aging fields.
Oman has a unique arrangement for its oil production. Petroleum Development Oman (PDO) is owned 60% by the Oman government, 34% by Shell and 4% by Total. In effect Shell runs oil exploration and development in Oman with near monopoly status. Omani's therefore call upon the technical expertise and capital of one of the world's leading oil companies and this arrangement seems to be enabling the systematic application of EOR to relevant fields. It will be interesting to watch how far EOR is able to drive Omani production up.
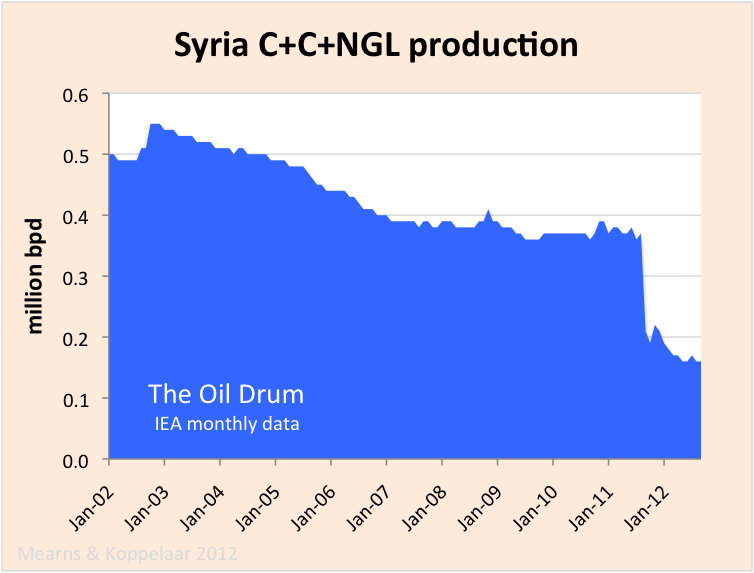
Figure 11 Syrian production has been in steady decline since January 2002 and then went off a cliff with the outbreak of civil war. If Libya is an example to go by, then Syria will struggle to regain pre conflict production levels.
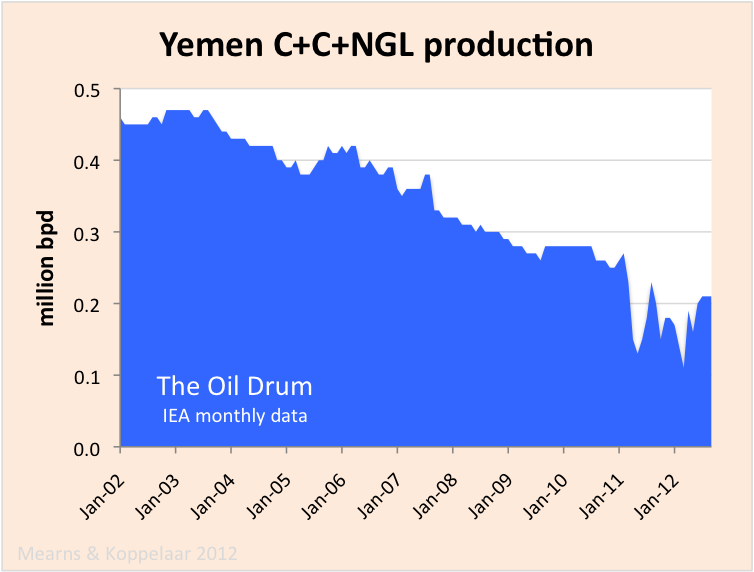
Figure 12 Yemen is Oman's neighbor on the Arabian peninsula. Production has been in steady decline over the decade punctuated by some civil unrest in recent years.
Africa Excluding OPEC Countries

Figure 13 Outside of OPEC, African oil production has been essentially flat for much of the decade at around 2.5 million bpd. A recent drop in production in February 2012 likely reflects the impact of the Arab Spring on N african producers like Sudan.
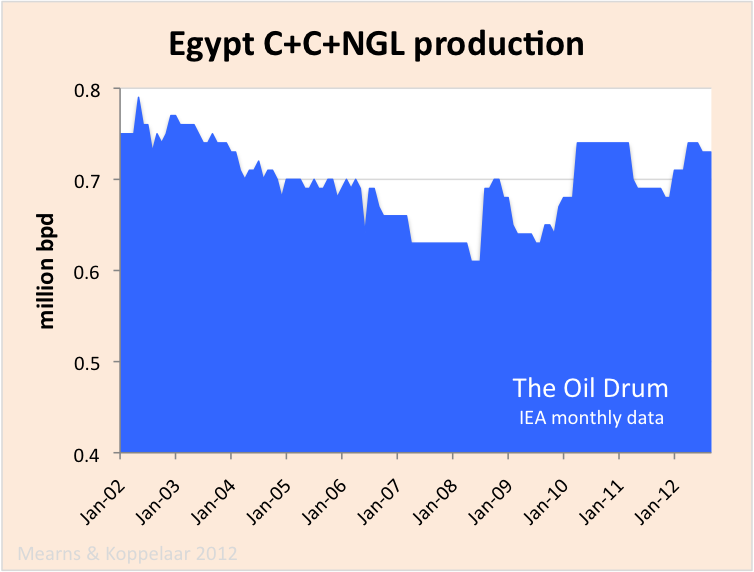
Figure 14 According to BP, Egyptian oil production peaked at 941,000 bpd in 1993. From 2002 to 2009 decline continued but production has since recovered to over 700,000 bpd, presumably as new fields have been brought on stream. Note chart not zero scaled.
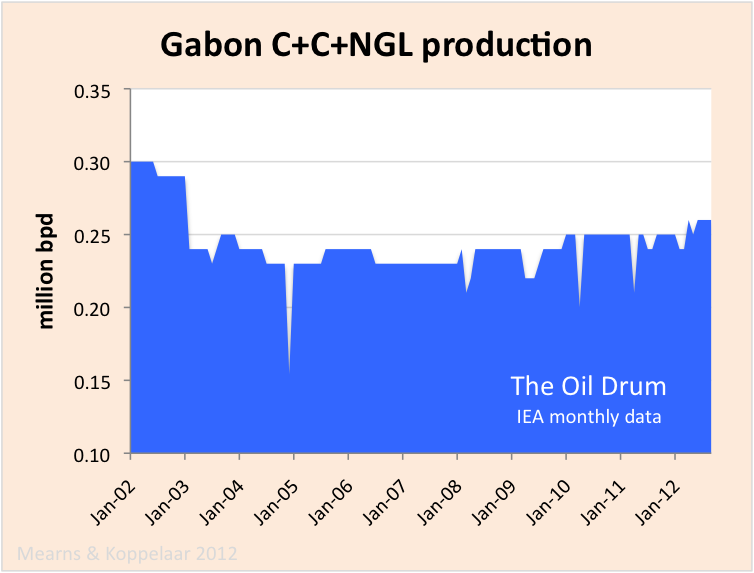
Figure 15 Gabon is a small producer with essentially flat production of about 250,000 bpd over the decade. Note chart not zero scaled.
South America Excluding OPEC Countries
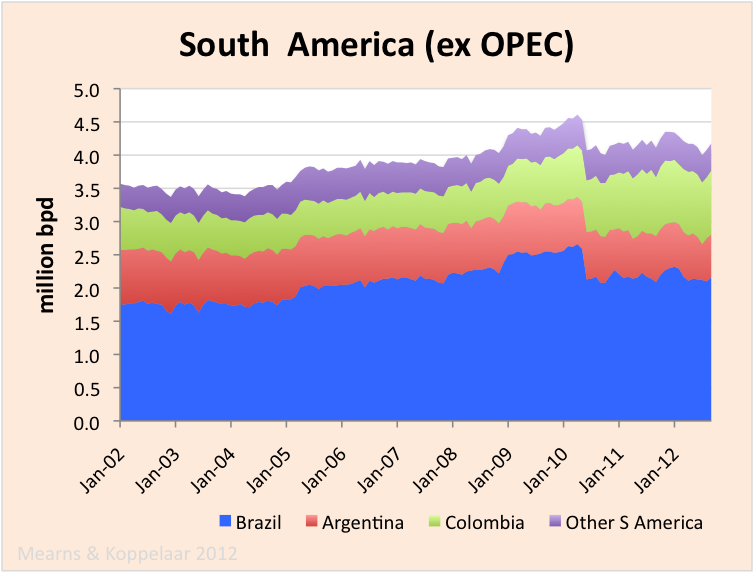
Figure 16 Outside of OPEC, South American production is dominated by Brazil. Brazilian and South American production grew steadily from 2002 to 2010 but then Brazilian production went of a small cliff - according to IEA data. We are not aware of any event in Brazil that could account for this and taking a quick look at EIA data (Figure 18) this precipitous drop is absent. It seems there is a problem with the IEA data for Brazil. A further comparison of IEA with EIA data will be conducted in a future post.
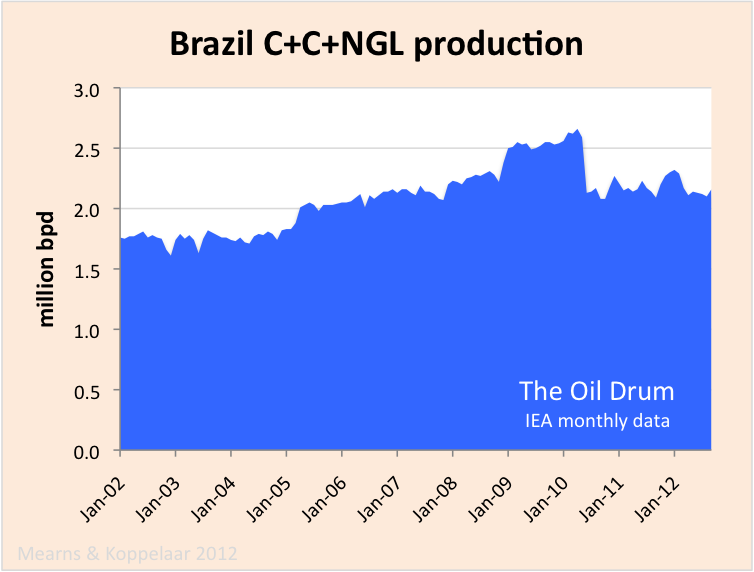
Figure 17 There seems to be a problem with IEA data for Brazil. The precipitous drop in production in 2010 is not present in the EIA data (Figure 18).

Figure 18 EIA data for Brazil shows a steady rise in production from 2002 to 2011 with signs that production growth may be staling in 2012.

Figure 19 Argentinian production has declined slowly over the decade from 820,000 bpd in January 2002 to 650,000 bpd in September 2012.
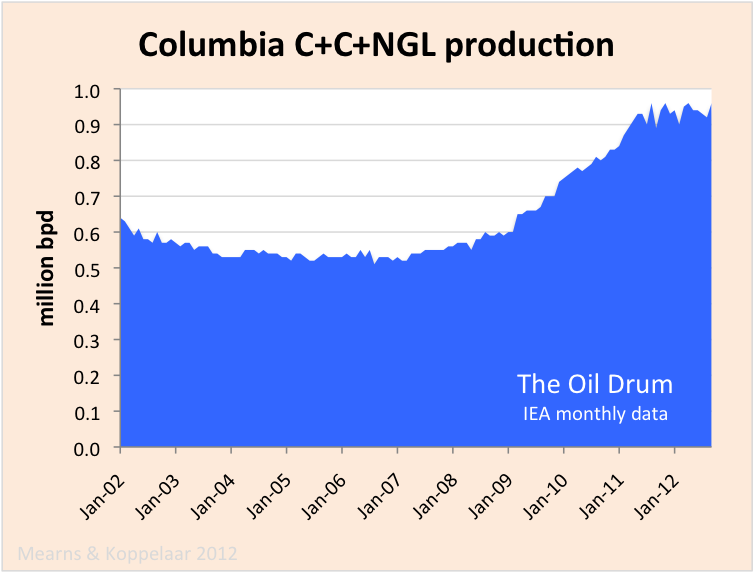
Figure 20 According to BP, Columbian production peaked at 838,000 bpd in 1999 and this was followed by a period of decline. In 2007, Columbian production began to climb once again as new fields were discovered and developed and new peaks of 960,000 bpd have been reached in recent months.
Contact
- Content: editors at theoildrum dot com
- Tech support: support at theoildrum dot com
License

This work is licensed under a Creative Commons Attribution-Share Alike 3.0 United States License.
Graphically portrays without a doubt "this is it"...the Plateau/Decline... despite all the recent articles to the contrary.
Thanks you....Paulo
Anyone have a link to the U.S and Canadian graphs?
Oil Watch - OECD Oil Production (IEA) December 5, 2012
USA C+C Production from the EIA from January 2000 to June 2012
Sorry, I have not plotted the data from the most recent EIA data yet except for world C+C production.
Edit: Canada, Mexico and USA C+C Production from EIA data, Jan. 2000 to Aug. 2012
re Oman:
That would be the normal place to inject polymer fluid. I don't think the author is saying what he/she means ?
I will see what is available on Marmul as to the nature of the reservoir and fluids.
I am not sure but I think the author means a production well as opposed to an injection well at the periphery of the field where water or steam is normally injected. After all, there are only two types of wells, production and injection, so the author has to be talking about one as opposed to the other.
Ron P.
Evaluation of a Pilot Polymer Flood in the Marmul Field, Oman
The stock tank oil initially in place (STOIIP) is estimated at 390 x 10 m of which 60% is contained in the Al Khlata formation, a complex sequence of very heterogeneous glacial deposits. The oil in this high permeability formation (1 -20D) has a viscosity of 80 mPa. s. The Al Khlata is currently producing around 5000 m/d of oil from some 90 wells at an average watercut of 50%.
There is a natural flank waterdrive which in some areas is quite strong. It was recognised that in view of the unfavourable water-oil mobility ratio (M=45), there is considerable scope for EOR by polymer flooding and steam-flooding. It was decided to pilot test both processes.)
A small pilot was recommended as a first stage in the testing of polymer flooding.) Its results would serve as guidelines for a possible larger scale pilot.
http://www.onepetro.org/mslib/servlet/onepetropreview?id=00018092
Tough row to hoe, they have there.
Non-OPEC Non-OECD Crude + Condensate peaked November 2010 at 27,908,000 barrels per day and produced 26,895,000 bp/d in August 2012, the last month the EIA has data for. That is a decline from the peak of 1,013,000 bp/d. The chart below is not zero based.
Non-OPEC Non-OECD C+C production in kb/d. The last data point is Augusr 2012. The data is from the EIA.
Ron P.
Considering how Malaysia will become an importer of oil by 2019, most of "far eastern countries" will be importers. India, Indonesia, China, Malaysia, Australia et. The only ones left exporting might be Vietnam, if they can ramp up production.
In the world at large, I think Brazil, Libya, Iran, Iraq and Kazakhstan are the countries with the biggest potential to grow a lot in oil production. Libya alone has huge reserves and can probably double production to close to 3 Mbpd. Iran has huge reserves also, but a lot of that is low quality oil and they need foreign help. Iraq is probably gonna increase up to 7 Mbpd when big oil companies get all the biggest fields up to peak.
according to this malaysia is already an importer
http://mazamascience.com/OilExport/
Actually it was 2017, I had it from this article: http://www.star-motoring.com/News/2012/IEA-predicts-Malaysia-to-become-n...
But different sources have different numbers.
This sources says 2010 production was 716 000 bpd http://www.indexmundi.com/g/g.aspx?c=my&v=88 while consumption was at 556 000 bpd http://www.indexmundi.com/g/g.aspx?c=my&v=91
Iraq will struggle to reach 4 mb/d.
Iraq's Rise To No. 2 Oil Producer In OPEC Is Bad News For World
Libya peaked in 1970 at 3,318,000 barrels of C+C per day and have been in decline ever since. They are fully back on line now after the revolution but are still 250,000 barrels per day below their recent 2008 peak. No one in OPEC has huge reserves except for Venezuela's Orinoco bitumen. Those huge reserves were all added with a pencil back in the 80s when OPEC was talking about setting their quota based on proven reserves.
Kazakhstan C+C production has declined 136,000 barrels per day since they peaked back in December of 2010. Kazakh is schedule to come on line next year with 150,000 barrels per day, rising only to 350,000 barrels per day in the next few years. Kazakh delay clouds non-Opec growth. (Requires registration but available via google without registration.) But with the rest of Kazakhstan in decline, Kazakh will keep them even... for awhile anyway.
Brazil... well no one is bullish on Brazil anymore. They are having all kinds of problems. The sub-salt will not come anywhere close to pumping what was originally expected.
Brazil's Pre-Salt Oil Potential: The Hype and the Reality
Bottom line, none of the world's "Great Expectations" oil producers will ever fulfill their promise.
Ron P.
http://www.quotationspage.com/quote/28750.html
In this war, objectivity is the first casualty, imo of course.
UPDATE: Brazil's Petrobras Starts Output at Baleia Azul Presalt Field
http://www.euroinvestor.com/news/2012/09/11/update-brazilampaposs-petrob...
Megaoilprojects also lists:
2013
Guara S
Roncador 3 and 4
Papa Terra
2014
Marlim Sur
Lara
Guara N
Cernambi
2015
Cacholote -2
Baleir
Franca
All operated by Petrobras.
PFC Energy has a different opinion: Petrobras Output Drops on Chevron Field
They will need all those new projects, and then some, just to make up for those massive declines.
5.7 million barrels per day in 2020? That is a real laugher. The decline rate in those deep water pre-salt fields will be a shocker.
Ron P.
Brazil is also a fast-growing economy, so any growth will go to domestic use, not exports. By the way, what is you view on Venezuela's future? I think they are in decline with current production (from conventional fields) but the Orinoco Belt is slated to come online next year. Might that show an increase? You sound like a pessimist but surely 500+ bn barrels must make up for any conventional decline, even though its mostly heavy oil.
PetroSlurp - I agree. They don't say much officially but from the bits and pieces they don't seem to expect Brazil becoming much of an exporter if any at all. Of course sourcing their own oil consumption would benefit the global consumer market to some degree.
With respect to Vz it doesn't matter so much if they have 50 or 500 billion bbls of reserves in the ground. The key metric of PO remains bbls of oil per day and not bbls in the ground. How the Vz resources effect PO in the future will be a function of how quickly they'll be coverted to produced bbls. Beyond the obvious political hurdle there are the economics involved. Overcome both of those requirements then that 500 billion bbl estimate becomes significant. Maybe it will in the coming de ades and, maybe not.
Concerning Venezuela, I agree with Rockman. The shallowest of Venezuela's bitumen is about 3,000 feet deep. That is not very deep for a well but is way too deep to surface mine. It must be recovered by heating it with steam or by some other method, or injecting lighter chemicals to reduce the viscosity. This makes it quite expensive to recover and also limits the volume to a great extent.
And Wikipedia says: Production, transportation, and refining of heavy crude oil present special challenges compared to light crude oil. Generally, a diluent is added at regular distances in a pipeline carrying heavy crude to facilitate its flow. That makes it quite expensive to transport. The diluent (naphtha?) must be separated at the refinery and piped back for reuse.
It may help Venezuela's economy somewhat but will do nothing to solve the world's liquid problems.
Ron P.
Brazil's 'indicated' decline averaged about 11 % from 2003 through 2011. Indicated decline is 'all in' including any drilling not reflected in the megaprojects list and decline in any legacy fields.
Capacity additions are from Megaprojects list. Production data is EIA crude oil production.
Brazil Crude + Condensate in kb/d. The last data point is August 2012. The data is from the EIA.
Ron P.
Adding a dash of objectivity to Salemeh's analysis:
Massive decline or no, crude oil production is up by 40 % 2003 through 2011, the period covered by megaprojects.
The oil megaprojects shows 100 kbpd for 2012, some of which - detailed above - were not started until october. Megaprojects also shows 530 kbpd for 2013.
My guess is that Salemeh will be proven 'fos' as he was relative to Saudi Arabia before the cut in Iranian output. Salemeh wasn't alone in that boat.
Salemeh....Salemeh....Baloney.
What do the analysts here think of this chart?
http://4.bp.blogspot.com/_-uualVqzFPk/S7e_YfHdX2I/AAAAAAAAAIw/zhnzHf5Wql...
I recall seeing rather similar charts posted on TOD prior to 2010, in which the black vertical line signifying starting the descent from the plateau was labeled '2010'. I also recall one or more posters driving their prediction stake in the ground and just about guaranteeing that the 'edge of the cliff' would occur by ~December 2009, and most assuredly by late Spring of 2010.
Make no mistake on my position: oil is finite, and EROEI is a huge consideration, but I wonder if there are enough rabbits left in the hat to keep the all liquids 'bumpy plateau' going into the early 2020s?
Of course, I agree that in the big scheme of things for humanity, 2022 might as well be 2012 or 2010 or 2005...or 2030...but I am now skeptical about predictions of significant liquid fuel flow step-downs in the next few years.
Methinks that substitution to NG and gradual increases in wind and solar, combined with gradual increases in efficiency and forgoing of energy use due to increasing costs and decreasing incomes will accommodate a gradual decline in liquid fuel availability.
forgoing of energy use due to increasing costs and decreasing incomes will accommodate
Lots of room for interpretation there...
?-) or :-(
...all depending on where you sit on the income scale.
The chart was posted by Kurt Cobb on his blog Resource Insights. He is a peak oiler but does not post here. The chart is not a prediction by Cobb, it was posted as a comment on the rosy prediction by the EIA. The black line rising higher every year is their prediction.
Posters have come and gone since then. And there are, or have been, hundreds of posters on TOD. Many thought the peak was very near and have said so. Many others have stated that the peak was years away. Opinions on TOD vary, and that is exactly what one would expect from such a large and diverse group of posters.
Obviously you meant for your post to show that the posters on TOD are a bunch of chicken littles who think the sky is falling, or is just about to fall.
If you wish to knock the prognostications of any one or more posters you should feel free to do so. But the proper way to do that would be to name him/her and post the link to the missed prediction. Otherwise you it will appear that you are only attempting to sling mud on the entire list, many who are very conservative and cautious with their predictions.
Ron P.
The peak for some fields, such as North Sea production, persists for about 10% of the width of the curve. If that applies to world crude oil production, which will probably last between 200 and 300 years, then the plateau around the peak could last for 20 to 30 years. If world production arrived at the plateau in 2005, then it might not drop below the plateau until 2025 to 2035. If the average production around the peak is 74 Mb/d, then consider the amount of crude oil that will be extracted during the period around the peak:
20 years on plateau: 541 billion barrels
30 years on plateau: 811 billion barrels
I think the total world crude oil & natural gas condensate extracted to date is ~1.2 trillion barrels. It is possible that enhanced oil recovery will cause the world production to peak after more than half of the URR is extracted. Thus consider the URR necessary to keep the world production on a plateau for 30 years.
In 2005 enter plateau, 1 trillion barrels extracted
In 2020 hit peak, 1.41 trillion barrels extracted
In 2035 fall off plateau, 1.81 trillion barrels extracted
If the peak occurs at 50% URR, then the URR is 2.82 trillion barrels.
If the peak occurs at 60% URR, then the URR is 2.35 trillion barrels.
First make a plausible estimate of the URR (Ultimately Recovered Resource) and then check if the rate of production and timing of the peak are plausible. Considering OPEC reserves are exaggerated and the older estimates did not include syncrude from tar sands, a world URR of 2.3 trillion barrels is plausible, but 2.8 trillion barrels seems a stretch. Thus EIA projections that show world C+C production shooting upward for the next 30 years assume a higher URR than seems plausible.
When considering liquid fuels, who knows because the world production of natural gas has not yet peaked and the potential for biofuels has not been exhausted. Liquid fuels already double counts some energy and includes fictional refinery gain. With propaganda being pervasive, it might include the water cut some day.
An interesting Depletion Vs. Production slide, courtesy of a helpful Oil Drummer, for the Six Country* Case History. Their combined production ranged from 6.9 to 7.0 mbpd from 1995 to 1999 inclusive. The absolute peak was 1998. The slide shows normalized production (1992 = 100%) versus post-1992 Cumulative Net Exports (CNE), with post-1992 CNE = 100% at the end of 1992.
So, even as their 1998 production increased by 21% over their 1992 production rate, in only six years they had shipped about half of post-1992 CNE:
*Indonesia, UK, Egypt, Vietnam, Argentina, Malaysia
Ulan - As Ron implies there has been a wide range of predictors on TOD. Sorta like hedge fund managers: every year a few of them look really smart because the trends they picked the year before paid out big time. And statistically those that picked good one year seldom pick good the following year. The guy that picks the winning lottery number isn't any smarter than the millions who didn't pick the winner.
So here's one more OPINION...mine. I've never anticipated anything close to a "cliff" in oil production. Reservoir dynamics on a global scale just don't work that way. As oil prices increased there would be additional production simply because known yet previous non-commercial assets would be developed. Such as the oil shales. The oil shales as well as the technology to develop them were known long ago. The price increase got those plays hot. I drilled and frac'd my first Eagle Ford Shale well over 25 years ago. Not a very economic result. But had oil been selling for $90/bbl I would have been drilling as many EFS wells as I could find. Likewise if oil prices drop significantly those new assets will again go dormant. But even if oil prices stay high those now commercial plays will last only X years for the simple reason that they are being heavily drilled and there are a finite number of locations to be drilled. One of my constant complaints about various predictions of rig counts, proved reserves, future flow rates, etc.: if a price prediction isn't attached to those other predictions then they are worthless IMHO. IOW a prediction of X billions bbls of future proven reserves from Trend A means nothing if the price assumptions required to develop those reserves aren't stated. What wells get drilled and how much they produce has always been dependent upon price more than any other factor.
And the last biggie: when was/will be PO? I don't care in the least what that date was or will be. What I tend to focus on is the POD: Peak Oil Dynamic. That's the interplay of oil production rates, demand changes, price changes as a result of those first two considerations, ELM and all the myriad above ground factors. It's the POD that impacts ever hydrocarbon consumer on the planet. The PO date is just a mildly interesting academic metric IMHO. For instance, let's assume PO happened a few years ago. Right now the world economies are struggling to deal with higher oil prices. The same would be just as true if the magic PO date is still a few years off. Recessions will reduce oil demand below current production capabilities even if they are less than the PO rate. In that situation does it matter if we are producing less oil than ever before if there isn't a demand for what can be produced? And by demand I don't mean how much economies want to purchase but how much they can afford to purchase. Likewise if we haven't reached global PO yet (IOW oil rate is continuing to increase) and demand is pushing prices higher is the fact that we're producing more oil globally then we ever had before change the reality of the situation?