| Tech Talk - Iranian Potential and the Caspian Disputes | The Oil Drum | #9 - Shale Oil: The Latest Insights |
#10 - New Energy Report from Harvard Makes Unsupportable Assumptions
Posted by Heading Out on December 24, 2012 - 6:30am
The Oil Drum staff wishes a Merry Christmas to all in our readership community. We are on a brief hiatus in this period, and will be back with our regular publications early in the new year. In the meantime we present the top 10 of best read Oil Drum posts in 2012. The first in this series is an analysis by Heading Out discussing the report by Leonardo Maugeri on future oil production, originally published in July 2012.
The Tech Talks of the last few months have followed a path of looking in a relatively realistic manner at crude oil production with emphasis on that coming from the United States and Russia, as well as Saudi Arabia, the current focus of my weekly pieces. An earlier piece looked at a Citigroup report of considerable optimism, and the post explained why, in reality, it is impractical to anticipate much increase in US production this decade. Since then, after reviewing the production from Russia, several posts have shown why the current lead in Russian daily crude oil production is likely to be soon over and then decline, as the oil companies are not bringing new fields on line as fast as the old ones are running out. Saudi Arabia, as the current posts are in the process of explaining, is unlikely to increase production much beyond 10 mbd, since Ghawar, the major field on which its current production level is built, is reaching the end of its major contribution, though it will continue to produce at a lower rate into the future. The bottom line, at least to date, is that there is no evidence from the top three producers that their production will be even close, in total, to current levels by the end of the decade.
So, (h/t Leanan) there now comes an Energy Study from Harvard which boldly states that this is rubbish - that by 2020, global production will be at 110.6 mbd and these concerns that most of us have at The Oil Drum (inter alia) are chimeras of the imagination.

It is therefore pertinent to begin with examining where the study (which was prepared with BP assistance) anticipates that the growth in supply will come from.
That too is shown as a plot:

It is instructive, in reading this plot, to first recognize that it is a plot of anticipated production capacity rather than projected actual production. The reason for this can perhaps be illustrated by an example. Within the current production capacity that Saudi Arabia claims adds up to 12 mbds, is the 900 kbd that will come from Manifa as it is further developed and comes on line within the next few years. However, at that time. the increase in production will, to some degree, offset the declines in existing wells and producing fields that will become more severe as more existing horizontal wells water out. Manifa is not currently in significant production, and is unlikely to be at such a level for at least another 18 months, with production being tied to the construction of the two new refineries being built to handle the oil. It is not, therefore, a currently instantaneously available source of oil. At a relatively normal 5% per year decline in production from existing fields, Saudi Arabia will have to bring on line (and sustain) at least 500 kbd per year of new production. While it is likely that it can do this for a year or two more, betting that it will be able to do this plus raise production 2 mbd or more in 2020 is on the far side of optimistic. Just because a reserve exists does not mean that it can be brought on line without the physical facilities in place to produce it.
It is interesting, however, to note the report’s view on field declines in production:
Throughout recent history, there is empirical evidence of depletion overestimation. From 2000 on, for example, crude oil depletion rates gauged by most forecasters have ranged between 6 and 10 percent: yet even the lower end of this range would involve the almost complete loss of the world’s “old” production in 10 years (2000 crude production capacity = about 70 mbd). By converse, crude oil production capacity in 2010 was more than 80 mbd. To make up for that figure, a new production of 80 mbd or so would have come on-stream over that decade. This is clearly untrue: in 2010, 70 percent of crude oil production came from oilfields that have been producing oil for decades. As shown in Section 4, my analysis indicates that only four of the current big oil suppliers (big oil supplier = more than 1 mbd of production capacity) will face a net reduction of their production capacity by 2020: they are Norway, the United Kingdom, Mexico, and Iran. Apart from these countries, I did not find evidence of a global depletion rate of crude production higher than 2-3 percent when correctly adjusted for reserve growth.
Sigh! I explained last time that with the change in well orientation from vertical to horizontal, that there was a change in the apparent decline rates. When the wells run horizontally at the top of the reservoir, they are no longer reduced in productive length each year as vertical wells are, because the driving water flood slowly fills the reservoir below the oil as it is displaced. This does not mean that because the apparent decline rate from the well has fallen that it will ultimately produce more oil.
The amount of oil in the region tapped by the well is finite, and when it is gone it is gone, whether from a vertical well that shows gradual decline with time, or from the horizontal well that holds the production level until the water hits the well and it stops. I am not sure that the author of the report understands this.
The point concerning support logistics is critical in a number of instances. The political difficulties in increasing production from the oil sands in Alberta, through constraints on pipeline construction either South or West, are at least as likely to restrict future growth of that deposit as any technical challenge.
The four countries that the report sees contributing most to future oil supplies are (in the ranked order) Iraq. the United States, Canada, and Brazil. For Iraq, he sees production possibly coming from the following fields within the next eight years.

I understand that one ought to show some optimism at some point over Iraq, but it has yet to reach the levels of production that it achieved before the Iran/Iraq War, and that was over some time ago. The EIA has shown that it is possible to get a total of over 13 mbd of production, but it requires investment and time, and some degree of political stability in the country. That is still somewhat lacking. Prior to that war, Iraq was producing at 3.5 mbd, the production curve since then has not been encouraging:
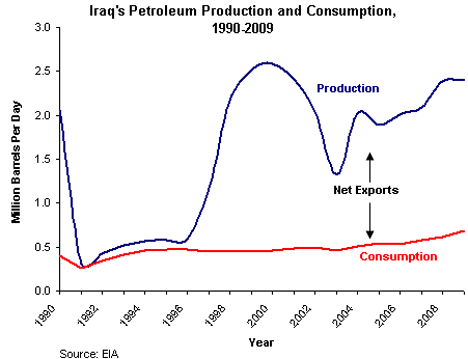
Recognizing that the country has problems, the report still expects that there will be a growth in production of some 5.125 mbd by the end of the decade. This appears to be a guess as to being some 50% of the 10.425 mbd that the country could potentially achieve.
As for US production, this is tied to increasing production from all the oil shales in the country, which will see spurts in growth similar to that seen in the Bakken and Eagle Ford.
I estimate that additional unrestricted production from shale/tight oil might reach 6.6 mbd by 2020, or an additional adjusted production of 4.1 mbd after considering risk factors (by comparison, U.S. shale/tight oil production was about 800,000 bd in December 2011). To these figures, I added an unrestricted additional production of 1 mbd from sources other than shale oil that I reduced by 40 percent considering risks, thus obtaining a 0.6 mbd in terms of additional adjusted production by 2020. In particular, I am more confident than others on the prospects of a faster-than-expected recovery of offshore drilling in the Gulf of Mexico after the Deepwater Horizon disaster in 2010.
As I noted in my review of the Citicorp report this optimism flies in the face of the views of the DMR in North Dakota – who ought to know, since they have the data. The report further seems a little confused on how horizontal wells work in these reservoirs. As Aramco has noted, one cannot keep drilling longer and longer holes and expect the well production to double with that increase in length. Because of the need to maintain differential pressures between the reservoir and the well, there are optimal lengths for any given formation. And as I have also noted, the report flies in the face of the data on field production from the deeper wells of the Gulf of Mexico.
It seems pertinent to close with the report’s list of assumptions on which the gain in oil production from the Bakken is based:
*A price of oil (WTI) equal to or greater than $ 70 per barrel through 2020
*A constant 200 drilling rigs per week;
*An estimated ultimate recovery rate of 10 percent per individual producing well (which in most cases has already been exceeded) and for the overall formation;
*An OOP calculated on the basis of less than half the mean figure of Price’s 1999 assessment (413 billion barrels of OOP, 100 billion of proven reserves, including Three Forks).
Consequently, I expect 300 billion barrels of OOP and 45 billion of proven oil reserves, including Three Forks;
*A combined average depletion rate for each producing well of 15 percent over the first five years, followed by a 7 percent depletion rate;
*A level of porosity and permeability of the Bakken/Three Forks formation derived from those experienced so far by oil companies engaged in the area.
Based on these assumptions, my simulation yields an additional unrestricted oil production from the Bakken and Three Forks plays of around 2.5 mbd by 2020, leading to a total unrestricted production of more than 3 mbd by 2020.
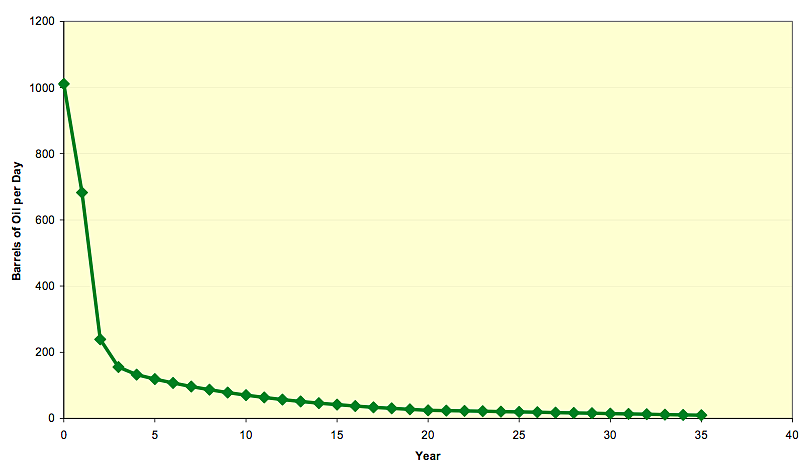
Enough, already! There are too many unrealistic assumptions to make this worth spending more time on. To illustrate but one of the critical points - this is the graph that I have shown in earlier posts of the decline rate of a typical well in the Bakken. You can clearly see that the decline rate is much steeper than 15% in the first five years.
Oh, on a related note, the Alaskan pipeline was running at an average of 571,462 bd in May.
Contact
- Content: editors at theoildrum dot com
- Tech support: support at theoildrum dot com
License

This work is licensed under a Creative Commons Attribution-Share Alike 3.0 United States License.
Thank you very much for this! A couple of questions re shale/tight potential in the best regions of Iraq: Did Cheney's infamous Energy Task Force "oil potential" map address Iraqi non-conventional plays? Is enough known to establish whether the main limit is likely to be scarce injection fluid, high/variable clay content, unfavorable natural fracture orientation, or very patchy distribution of good plays?
There are so many wrong assumptions in the PDF file that they are too numerous to mention. But one really big blooper was Maugeri's assumption that "decline rate" was the same thing as "depletion rate". From his paper:
No, that is not a definition of depletion rate. That is a definition of decline rate, another thing entirely. Decline rate is the year over year decline in oil extracted from the ground. If the extraction rate increases then you have no decline at all but an increase in production. Decline rate is an above ground phenomenon.
The depletion rate is the rate reserves are depleted by extraction. Depletion is a below ground phenomenon. While the decline rate can be decreased by infill drilling it would have the opposite effect on the depletion rate. If you increase production from a given field, you decrease decline rate while increasing the depletion rate.
And it is truly absurd that Maugeri thinks that the decline rate can be offset by reserve growth.
Ron P.
Production versus (net exports) depletion:
Normalized production rate (1992 rate = 100%) for the Six Country Case History, versus remaining post-1992 CNE (Cumulative Net Exports) by year:
At the end of 1999, combined Six Country production (BP, total petroleum liquids) was up by about one-fifth relative to their 1992 production rate, but their combined post-1992 CNE had fallen by 60%.
Production rate of change, 1992 to 1999: +2.7%/year
Post-1992 CNE depletion rate of change, 1992 to 1999: -15%/year
Six countries: Indonesia, UK, Egypt, Vietnam, Argentina, Malaysia
I'm trying to understand your basis for that claim. Are you denying that infill drilling can result in both reserve growth and production increase ?
You could explain that one too.
Okay, let me try to explain [edit].
The decline rate is the amount year over year production decreases. Year over year production can actually increase so in that case you would have no decline rate at all, or a negative decline if you choose to call that.
Reserve growth is nothing more than a re-calculation of recoverable reserves. Initial total recoverable reserves are, at first, rather difficult and are, more often than not, underestimated. But as a field ages the company can get a far better estimate of what ultimate recoverable reserves really will be.
Oil reserves
The decline rate is an after the fact measurement. It is what it is and the fact reserves were originally underestimated does not affect the measured-after the fact decline rate one iota. And of course the decline rate is an above ground phenomenon because it is a measurement of the decline rate, year over year, of oil already produced. Oil, after it is produced, is always above ground.
Reserves really never grow. Only the estimate of recoverable reserves ever grow, or shrinks.
Infill drilling can affect the decline rate but it cannot change the amount of oil in the ground. It cannot cause actual oil reserves to grow. Infill drilling actually increases the depletion rate.
P.S. I know companies do not really produce oil, they only extract it from the ground. But the "produced" is already in such widespread use that I am almost forced to use it.
Ron P.
I have never seen an oil or gas reservoir where infill drilling didn't result in increased recovery of oil in place, i.e. reserves. I don't use the term reserves to describe oil in place, but I see that you do. That is another widespread misnomer, in my opinion.
Infill drilling can't change oil in place, but most certainly can increase recovery - thus reserves. Yes, infill drilling has an accelleration component - and an increased recovery component.
Some make the mistake of thinking of an oil reservoir as a tank. If that were the case, each field would only need one well.
The idea that an oil reservoir is like a tank found its way into peak oil lore - remember the saying around here "Its not the size of the tank, its the size of the tap" ?
Again, infill drilling is just drilling. When reserves are originally estimated, they are estimated as recoverable reserves, not reserves without infill drilling being considered. Also they are not reserves without EOR being considered. Whatever EOR is used, or no matter how many wells are drilled in the patch, does not increase reserves. Reserves are estimated, very conservatively, very early, usually after the first test well is drilled. They are then adjusted, up or down, as the field ages.
One thing for sure, infill drilling cannot decrease the depletion rate. A very absurd point because infill drilling increases the depletion rate.
There may be people who think a reservoir is a tank but I doubt anyone of them posts here. Everyone on the list knows an oil reservoir is made up of porous rock, sandstone or limestone in all but a tiny minority of cases. Some "tight oil" reservoirs being the exceptions. Tight oil is still in the original source rock because it is not porous enough to allow it to escape.
Ron P.
I don't know where you got the idea that reserves are fixed at the outset. Oil in place is typically estimated at the end of deliniation drilling. Oil in place typically doesn't, but can, change throughout the life of the field because of additional drilling.
Subsequent to the initial development of a field or reservoir, performance(typcally in the form of decline curve analysis or other empirical methods)and more formally by reservoir numerical simulation modeling is used to evaluate performance and forecast future production rates and reserves. Here's a shocker: sometimes estimated oil in place is adjusted to obtain a history match modeling to performance.
Performance evaluation is used thoughout the life of a field to optimize recovery and maximize economic return. If an operator sees an opportunity to increase reserves and accelerate recovery by infill drilling, they may do so anytime.
Reserves at year end are beginning reserves minus production plus or minus revisions and are based on performance, no matter what the initial reserve estimates were.
Infill drilling typically increases depletion, but the operator can use infill drilling to facilitate eor, thereby decreasing depletion.
Reservoirs are made up of anisotropic porous rock and thus the potential to increase recovery by infill drilling.
I think you are referring to this statement by me: " Reserves are estimated, very conservatively, very early, usually after the first test well is drilled. They are then adjusted, up or down, as the field ages.
Okay I assume you know the difference between the definition of "fixed" and "estimated" so I really don't understand what your quibble is.
Though I never said any such thing, reserves are fixed at the outset. That is just common sense. Reserves were fixed millions of years ago. Estimates of OOIP are continually being adjusted however, but those estimates are never fixed. How on earth can an estimate be fixed. If it were fixed, then it would not be an estimate.
OOIP is never adjusted. How on earth do you think they can adjust the amount of oil originally in the ground? Estimates of OOIP is all that can possibly be adjusted.
I will not be replying to any more of your posts. That would obviously be an exercise in futility.
Bye now and have Merry Christmas and a great life thereafter.
Ron P.
You have a Merry Christmas and a great life thereafter, too.
Oh, on a related note, the Alaskan pipeline was running at an average of 571,462 bd in May.
Let me channel a past TOD post warning of the pipeline being at Minimum Operating Level (MOL)
http://www.alaskajournal.com/Alaska-Journal-of-Commerce/September-2010/M...
And from 20 years ago:
http://www.gao.gov/products/RCED-93-69
Oil is not a renewable energy and the depletion rate is not being represented as an accurate number according to the graphs. We must control our consumptions for the generations to come and find alternate sources to get away from oil such as hydrogen.