| Oil Watch: Europe and North America - Total Oil Products Demand | The Oil Drum | #10 - New Energy Report from Harvard Makes Unsupportable Assumptions |
Tech Talk - Iranian Potential and the Caspian Disputes
Posted by Heading Out on December 23, 2012 - 5:40am
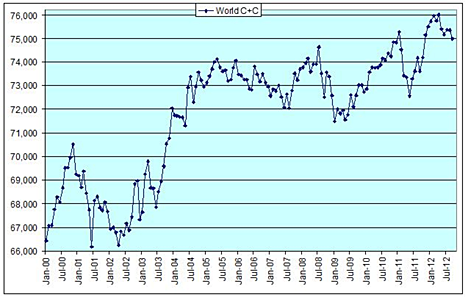
As we come to the end of the year, Leanan continues to point to the many stories that now fill the media reporting on the perception that the time to worry about peak oil is over. However, as Darwinian perceptively points out, the global supply of oil (crude and condensate) is not going up with the celerity that most commentators are envisaging.
The global balance between available supply and demand is in a balance, where the amount of oil remaining available to meet a surge in market demand is quite small. OPEC (and largely Saudi Arabia), by adjusting their production, ensures that the balance is maintained and prices remain at a level with which they are comfortable.
In the December 19th TWIP, the EIA has explained, without endorsing the statement that the US might surpass Saudi Arabia in global fuel production, why that is a less important statistic than folk are generally making it out to be.
The EIA note, in their review, that this balance is predicated on a sustained production from the Middle East. Yet, for several years now, reliance on maintaining current supplies, and guaranteeing adequate supplies in the future has assumed a steadily growing production from Iraq. The EIA notes that it is in the combined production from Iran, Iraq and Saudi Arabia that contains the additional oil needed for significantly greater production. (Venezuela is also mentioned, though there are more obstacles to overcome before their oil production can increase).
There is, unfortunately, a down-side to the glee which many commentators have greeted the news of potential US production gains. With the assumption that North America (and for this Mexico and Canada are included) can reach the higher targets projected, there is less concern with ensuring that alternate supplies remain available, as world demand continues to rise. This failure to ensure “insurance” may well cause some significant changes in the global market in the non-too-distant future, should the existing projections prove overly optimistic. (And Leanan referenced Kurt Cobb’s more realistic assessment, on Friday).
China, for example, is aware of the Iraqi potential to increase production and is moving to take over Exxon’s stake in the West Qurna oilfield, as part of their ongoing program to increase the reserves available to China in coming years. This comes as relations between the US and Iraq seem to be cooling, as Iraq becomes more friendly with Iran. Iranian exports are continuing to increase, despite the sanctions, although there are some problems arising with repatriating the payments to Tehran. The EIA note that Iran has some 137 billion barrels of proved reserves, some 9.3% of global reserves, and over 12% of total OPEC reserves. However, as with many countries, its internal consumption is keeping pace with or growing faster than overall production.
In a recent post on Iraqi oil, Euan included a map showing the main distribution of fields in Iran.
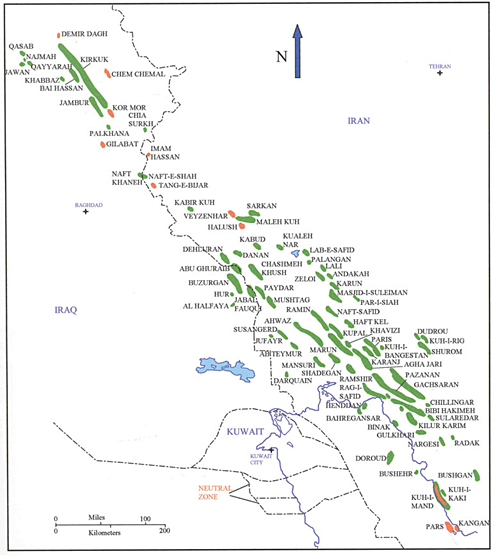
Nevertheless, Iran has significant potential reserves outside of this strip, as well as further discoveries within it. As the EIA notes:
There were a number of new discoveries in Iran over the past couple of years. In May 2011, NIOC announced a discovery of a deposit of light oil (35° API gravity) in the Khayyam field, offshore in the Hormuzgan province. The field had been discovered in 2010 but was originally classified as a gas field. According to the NIOC, the volume of in-place oil at this field is 758 million barrels, of which around 170 million barrels are recoverable. Also in May 2011, Iran announced the discovery of new onshore oil fields in its south and west with an estimated half a billion barrels of reserves. In late 2010, Iran claimed the discovery of new crude finds near gas reservoirs in the Persian Gulf, holding total in-place reserves of more than 40 billion barrels of oil, however recoverable reserves could be less than 10 billion barrels.
And just this year, a significant discovery was announced in Iranian waters in the Caspian. The field promises a 10 billion barrel resource, which could add around 7% to the Iranian reserves. But there is a dispute over the location of the field, with Azerbaijan claiming that the region belongs to them.
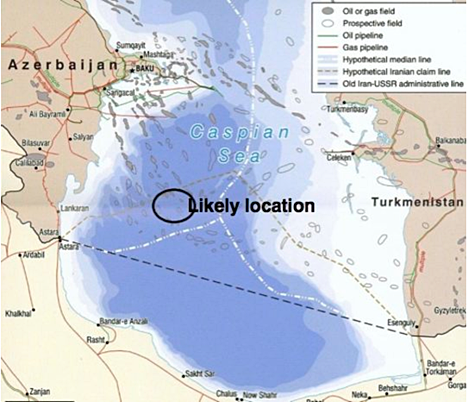
Exploration in the southern end of the Caspian has been somewhat sporadic, given the territorial disputes as to who owns which part of the seabed, and this discovery is not likely to ease those tensions. Azerbaijan and Turkmenistan are both concerned over their individual territories, and are now in dispute over the Kyapaz (Serdar) field. And as the size of the field becomes more evident the dispute is continuing to raise tensions in the area.
And so, as we come to the end of 2012, disputes seem to be the order of the day in this part of the Middle East. Not forgetting the conflict in Syria, the disputes in Iraq over who gets to control what part of their oil future continues to evolve. Increasingly in the north, the Turkish government is dealing with the regional government in Kurdish Iraq instead of the Government in Baghdad. These actions do not fill one with confidence that any of the predictions for future production are likely to come through in the time frame projected. Which will, unfortunately, tighten supplies in the non-too distant future.
Oh, and just in case you thought that Gazprom had changed its spots, it turns out that with the current cold spell in Kyrgyzstan, Gazprom has found the opportunity to take over the state gas company Kyrgyzgaz. The company has so many problems that the price will be nominal, given the amount of debt that comes with it. But it also gives Gazprom access to some of the Kyrgyz gas fields.
Contact
- Content: editors at theoildrum dot com
- Tech support: support at theoildrum dot com
License

This work is licensed under a Creative Commons Attribution-Share Alike 3.0 United States License.
Regarding the new discovery dicovery by Iran in the Caspian Sea, looks like the area is closest to Azerbaijan, thus they would have the most legitimate claim. And how will the Putin government of Russia view this dispute between a former soviet state and Iran?
Also, the claimed 137 billion barrels of proven reserves is likely to be two times actual reserves, as is true with many OPEC reserve figures.
Do you have actual knowledge of Iran's proven oil reserves ?
Tony, such a curt and silly question was not called for. And, in case you missed it he said likely, he said: 137 billion barrels of proven reserves is likely to be two times actual reserves,... I would go even further and say that Iran claimed reserves of 137 billion barrels is likely at least three times actual reserves.
No one knows exactly what OPEC reserves are because it is a closely guarded secret. But OPEC reserves were dramatically increased, with a pencil, in the 80s. And Iran and Iraqi reserves have since been increased, with the same pencil, in the last two years. All this while they were pumping flat out most of the time but they have never deducted production numbers from their reserves.
There have been may articles published on the subject and there are many very good reasons for doubting those ridiculously high OPEC reserves claimed by most OPEC members:
Opec believed to overstate oil reserves by 70%
Why does OPEC lie about its oil reserves?
How many real oil barrels do you see here?
OPEC wants you to believe there are 3.
But only 1 is real, they made up the other 2.
Ron P.
This link from Wikipedia (1980-2009) clearly shows the jumps in declared OPEC reserves that happened the 1980's: OPEC Declared Reserves
According to Wikipedia, the declared reserves are even higher today, for example:
A cursory look at these numbers show the huge increases that have taken place over the last 3 decades or so. Even without knowing the exact real numbers, you can tell by the magnitude of the reserve jumps that they're highly exaggerated.
Many on here have trouble grasping the immense size of Mid East oil fields.
Have you considered the possibility that pre nationalization reserves were understated ?
Saudi's reserves were clearly understated pre-nationalization. Clearly, because (according to Nanson Saleri)two of their largest fields produced the pre-nationalization reserves years ago.
According to Nanson Saleri Saudi has 900 billion barrels of reserves. Now Saleri would never exaggerate would he?
New York Times Article
Ron P.
Saleri is no idiot. I'm not sure the same can be said about the reporter who confused resources with reserves.
Hey, use a little common logic with your analysis will you. Look at the chart, every circle is larger than the previous one and each one is clearly labeled, starting with what they say is proven reserves. Then they step up to the next, "proven, possible and probable reserves". Then the next and finally the big one.
Obviously Saleri said that Saudi has 608 billion barrels of proven, possible, probable and contingent reserves then it only makes sense that he would say "ultimate" reserves would be somewhat greater.
Boy you sure can come up with some good ones. But I guess we need comic relief from time to time.
Ron P.
The SPE doesn't have a catagory of contingent reserves , only contingent resources.
http://spe.org/industry/docs/OGR_Mapping.pdf
'Suggestion of ultimate reserves', no catagory for that either - except for the catagory of gibberish.
Well, why didn`t they say that they where rectifying understated reserves when they increased their stated reserves??
Many everywhere have trouble grasping the immense demand placed upon these fields for decades. The extreme investment that has gone into maintaining production in these fields in recent years bears witness to the fact they are mostly mature fields - tired fields.
Mid-east counties have never seen the need to drill wells on 40 acre spacing. Consecequently, the fields don't run as fast and don't get tired as quickly.
Some of Saudi's reservoirs haven't even started production. Saudi Aramco stated in 2004 that 1/2 of their reserves were undeveloped.
http://csis.org/files/attachments/040224_baqiandsaleri.pdf
An example of an undeveloped deeper reservoir was the Arab 'D', at Berri.
http://www.theoildrum.com/node/9130
Berri peaked about 1976 or so - somewhere near 750,000 barrels/day I think. Development of Arab D will yield about 35,000 barrels/day for about 10 years, which will help Berri maintain its current production of about 300,000 barrels a day for a while longer.
Arab D flow rate will be a few % of Berri's peak flow. The field is tired.
The CSIS (a Washington think tank) link "Fifty-Year Crude Oil Supply Scenarios:Saudi Aramco’s Perspective" was interesting - thanks for the link - lots of primary colors, easy to read, but it is not a primary source. Some of the graphics are unclear and misleading to me ie when graphing field depletion I don't think it is graphing depletion of proven reserves. If it is not, then it is being intentionally misleading. On the whole an unconvincing presentation - it leaves out every negative factor affecting future production, it is more an Aramco advertisment I think than anything.
Advertisment or not, the Saudi's capacity(slide 35), for now has proven accurate.
Not a primary source for what you are looking for, but look at slide 6) - which states Saudi Aramco's number 1 objective is to Maximum Hydrocarbon Recovery. That may sound trivial, but it is not.
Typically the number 1 objective of a public or privately held company is to maximize pv. In other words produce the oil as fast as possible. That is no doubt the model for deep water production and why I said that Saudi's fields haven't run as fast or gotten as tired as the typical world oil reservoir.
You can complain all you want about the lack of transparancy, that won't change anything. You don't really know how tired or fresh Saudi Aramco's fields are or how much is left to be developed.
Are you looking at Saudi's oil fields, seeing that some are 70 years old and assuming they must be tired ?
Look at Ghawar, put into production in 1951, 60 years ago, and not completely developed until 2006.
And finally, Saleri's statement of future capacity looks a lot closer to reality than presented in 'Twilight'.
I agree. However it is difficult to argue that Saudi's easiest oil has not already been produced.
My position that Berri is tired is based on easily available public information, not upon lack of transparency. Though we may differ in words used, I don't believe you are arguing that it is not, as that would be a difficult position to take. The field will produce for ten more years at perhaps 1/3 peak flow, no argument there, but I think Saudi's estimates of URR are optimistic - we will see. Clearly they are doing a good job - let us hope the country remains politically stable for at least a couple more decades. But even if they are blessed with stability, both financial and economic, the geology has the last word.
Of course, what really counts is the volume of net oil exports, and more importantly, the CNE (Cumulative Net Exports) depletion rate.
Following is a link to, and excerpt from, a post showing two key graphs:
http://www.theoildrum.com/node/9713#comment-935946
The following chart shows the rates of change (in dark green) for production and net exports in the three years leading up to key inflection points (or Index Years) in production for: the Export Land Model (ELM), the Six Country Case History*, Saudi Arabia, Top 33 net exporters in 2005 and ANE. The ELM inflection point was defined as 2000. The Six Country inflection point was 1995. The Saudi, GNE and ANE inflection point was 2005.
The rates of change in production and net exports for the six years after the inflection points are also shown, in orange. And also shown are the post-Index year estimated CNE (Cumulative Net Exports) depletion rates. The estimated six year post-1995 CNE depletion rate for the Six Country Case History was 16%/year. The actual value turned out to be 23%/year.
For the ANE column, on the right hand side, production is defined as GNE.
*Six Countries: Indonesia, UK, Egypt, Vietnam, Argentina, Malaysia
Note that for the ELM and first three actual case histories, going from left to right, the rate of increase in net exports on the upslope exceeded the rate of increase in production. After production stagnated, or began to fall, the rate of decline in net exports exceeded the rate of decline in production (or virtually flat production rates).
Regarding ANE, on the far right hand side, note that because the rate of increase in Chindia's net imports (CNI) exceeded the rate of increase in GNE, on the upslope, from 2002 to 2005, the rate of increase in ANE was less than the rate of increase in GNE. Therefore, we saw a steady decline in the GNE/CNI ratio from 2002 to 2011:
What kind of quality is the majority of oil in Iran, Iraq and the Caspian Sea? High API (above 34) but also high sulfur?
And about Iran, can they ever reach 6 Mbpd ever again, especially if the sanctions are removed (as in a case of regime change)?
Most of what Iran and Iraq produces is light sweet. Much lighter than most of what Saudi produces.
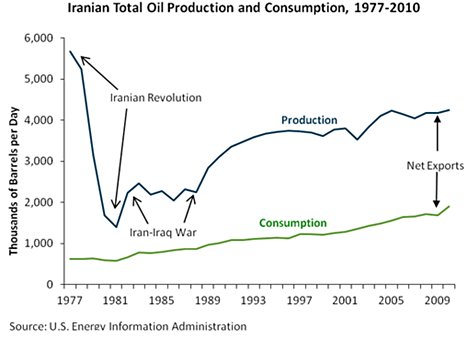
What can Iran ultimately produce? They produced 6,022,000 million barrels per day of C+C in 1974 according to the EIA. Never since have they produced 6 million bp/d. I doubt seriously that they will ever produce even 4 mb/d of crude again. They have a lot of non-associated gas and therefore a lot of condensate so they might get back to 4 mb/d of crude + condensate.
Ron P.
Back in 1979 before the Sha of Iran was ousted (he voluntarily "exiled" himself, then came to US for medical treatment), Iran used extensive steam injection to get production up to 6 mmbpd. As I understand, after the revolution those in charge of the oil industry did not want to restart steam injection because they did not need to produce so much oil. Perhaps steam injection could raise their production somewhat, but it would use lots of natural gas. And I doubt that just adding steam to the fields would get them anywhere near that 6 mmbpd production mark, a doubling from 3 mmbpd now.