| The Need for Crowdsourcing Energy Data | The Oil Drum | Tech Talk - Iranian Potential and the Caspian Disputes |
Oil Watch: Europe and North America - Total Oil Products Demand
Posted by Euan Mearns on December 20, 2012 - 4:24am
Continuing on from six posts that looked at global oil production trends, we now turn our attention to oil consumption / demand, which in our opinion, is every bit as fascinating and important to understanding the global energy system. In this post we focus on Europe and North America using JODI data (Joint Organisations Data Initiative) which is based upon figures reported by national governments which we therefore assume to be reliable. The JODI data base is not complete. Reporting began in January 2002. Most OECD countries have a complete set of reports but a number of countries like China only began to report in January 04 and many developing countries have a patchy reporting record. Russia and the former states of the Soviet Union do not report oil consumption figures at all.

Figure 1 This group of 11 countries classified as "Europe Core" combined show near uniform demand for oil products for the past decade. We consider this to be a somewhat remarkable trend since oil prices rose from $31/bbl in 2002 to >$100/bbl in 2008 (annual averages). Following 2008 the world has witnessed the biggest financial crisis since 1929. And yet demand for oil in this group of countries has been hardly affected by these momentous events. Note that this group includes Switzerland and Norway, neither of which are members of the Euro or the EU. These 11 countries typically have strong manufacturing / exporting economies. It seems likely that none will have significant oil fired power generation. All have modern motor vehicle fleets that already deliver fuel economy much higher than in N America. All but Norway are dependent upon imported oil.
Oil Watch posts are joint with Rembrandt Koppelaar.
Understanding oil demand data
Oil demand is influenced by a large number of factors such as population size, level of economic development and economic activity, social outlook, living arrangements, climate, energy efficiency and energy mix. The trends of oil demand change with time discussed in this and future posts may be explained in terms of 4 main factors:
Energy efficiency - improvements in energy efficiency with time may result in a reduction in demand for oil.
Demand destruction - high oil prices, and other economic woes, that lead to slow down in economic activity and higher levels of unemployment, may result in reduced demand for oil.
Substitution - high oil prices may lead to different energy sources substituting for oil, the most common one is to switch from oil to coal or gas fired electricity generation. This may result in reduced demand for oil. Government policies aimed at reducing CO2 emissions may also encourage substitution of low carbon energy sources for fossil fuels.
Seasonal affects - cold winters may create demand for more energy, including oil, and hot summers may create seasonal demand for air conditioning.
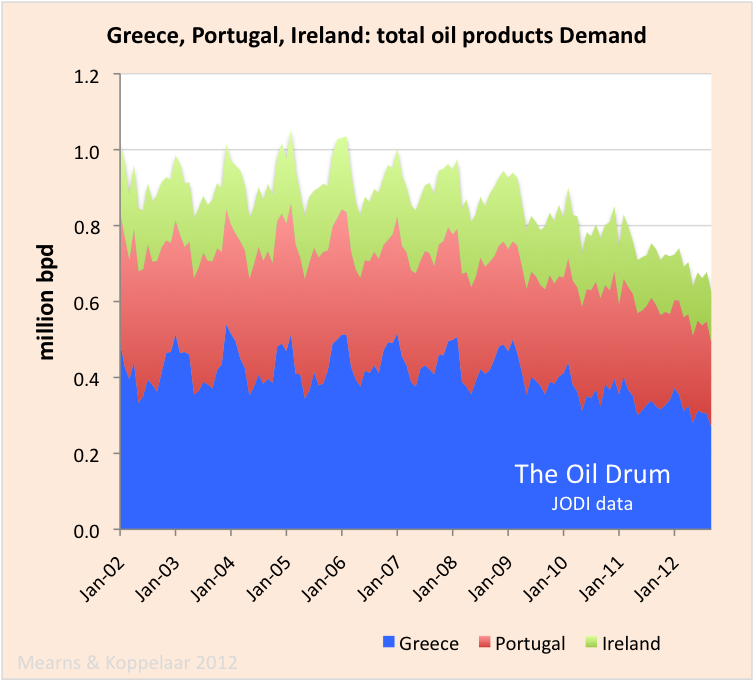
Figure 2 Oil demand in Greece, Portugal and Ireland shows marked seasonal cycles with the peaks centered on January, i.e. the northern hemisphere winter. This suggests temporary use of oil fired power generation to help meet higher winter demand for electricity. Oil demand in this group was rising until 2006 when a marked demand decline set in, two years ahead of the financial crash, suggesting that high and rising oil prices were the initial trigger for this trend. With time, the seasonal cycles have become less marked suggesting that oil fired electricity generation is being phased out. Further investigation is required to fully understand this. The collapse in economic activity in these countries will account for some of the reduced demand whilst substitution in electricity generation may also account for some of the reduced demand.

Figure 3 The UK, Spain and Italy are the big brothers of Ireland, Portugal and Greece on the geographic periphery of Europe. Together, the UK, Spain and Italy show a similar trend to their smaller neighbors. Oil demand was stable at 5 million bpd from January 2002 until 2006 when a demand decline set in that continues to the present day. These large countries lack the annual cycles seen in their smaller neighbors. The fall in demand in these large countries is about 20% compared with approximately 28% in Greece, Portugal and Ireland.

Figure 4 Taking a closer look at the UK, Spain (Figure 5) and Italy (Figure 6) separately we see that the fall in UK demand for oil is less marked than in Spain and Italy. The UK oil demand pattern is transitional between the core (Figure 1) and the periphery. In each of these countries the fall in demand for oil products is likely due to substitution, energy efficiency gains and demand destruction from high oil price, recession and unemployment. Given the economic woes of these three countries it seems likely that demand destruction will be the main force driving demand for oil down.

Figure 5 Oil products demand in Spain was rising until 2005 but has been in steep decline since 2008 and shows no sign of stabilising.
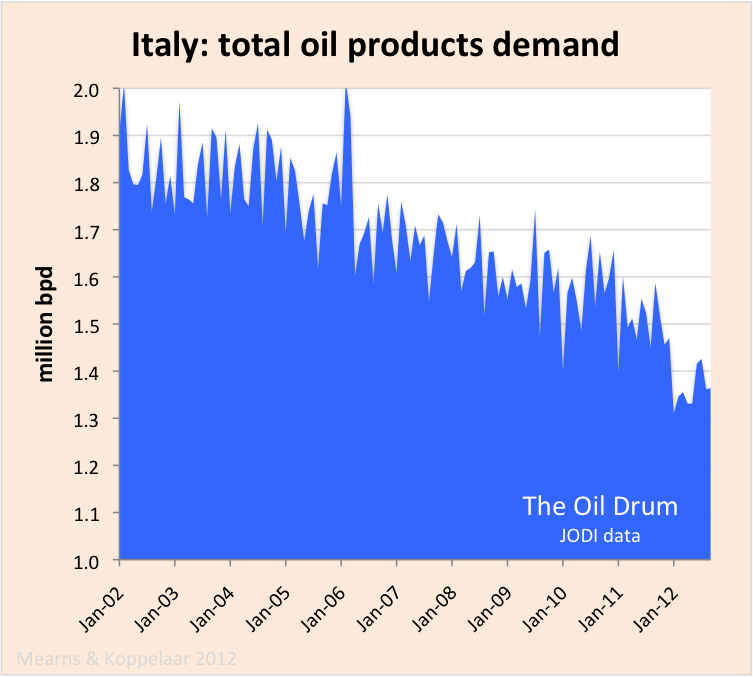
Figure 6 Oil products demand in Italy has been in steep decline since 2006 and shows no sign of stabilising.
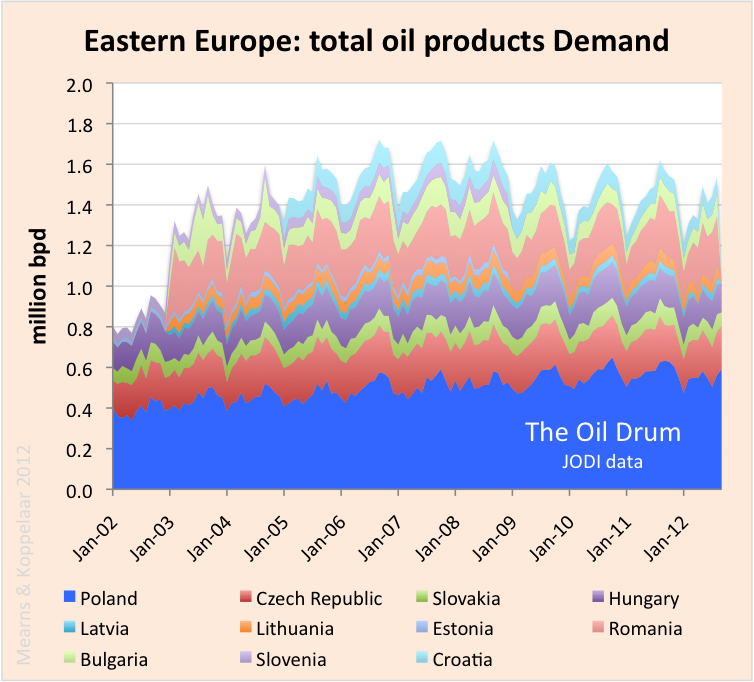
Figure 7 The remainder of Europe comprises the East European countries, formerly part of the Soviet block. Some, like Poland, Czech Republic, Hungary and Slovenia are now members of the EU. Note that the JODI reports are incomplete for some of these countries. Oil demand was rising until 2007 when it stabilised and since 2008 it has been falling slowly. The decline in demand for oil in East Europe is much less marked than in the western and southern periphery. These countries have marked seasonal cyclicity with peaks centered on the N hemisphere summer. There are two possible explanations. Either these countries are using oil fired electricity to power air conditioning. Or summer demand reflects an influx of tourists.

Figure 8 To summarise the oil demand situation for Europe all 28 countries are stacked in this chart. The picture is one of gradually rising demand at the beginning of the 10 year period, plateauing in the years 05 to 08 followed by gentle decline. Oil demand has dropped about 2 mmbpd or 12% on the whole but this masks regional trends where demand has been robust in the core areas and has fallen in the periphery countries.

Figure 9 Crossing the Atlantic, this chart shows the equivalent picture for the three countries of the N American continent. The overall picture is not too dissimilar to Europe, but like Europe this summary chart masks significant regional variations.
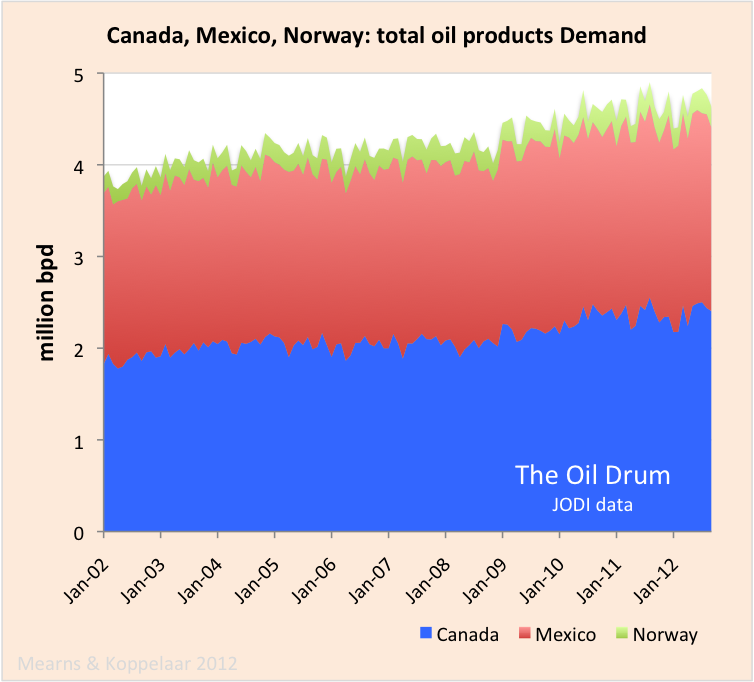
Figure 10 Canada and Mexico are both oil exporting countries and show a trend of increasing oil consumption with time. On balance, high oil prices benefit these economies. For good measure, Norway has been added to this chart completing the trio of OECD oil exporters.
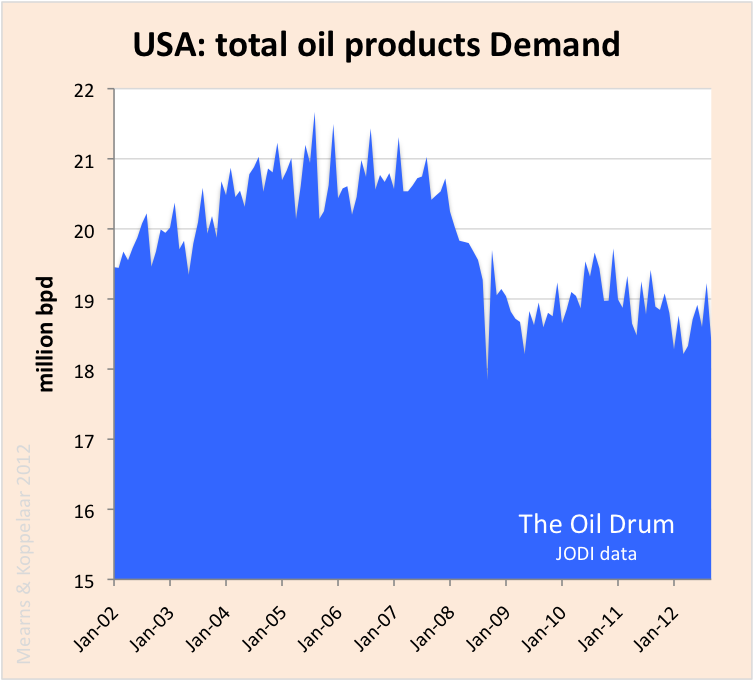
Figure 11 Finally, the USA dominates N American oil consumption. It had rising consumption at the start of the 10 year period with consumption peaking in the years 05 to 08 followed by a sharp fall of about 2 million bpd. Oil consumption seems to have stabilised at around 19 million bpd. Note that this chart is not zero scaled. The percentage drop is around 10% which is slightly less than for the Europe 28 group. Unemployment remains stubbornly high in the USA at around 7.7% and that will account for some of the fall in oil demand. The energy efficiency of the motor vehicle fleet is improving however and it seems possible with the current abundance of gas and coal that there is a degree of energy substitution. Compared with Europe, the USA has enjoyed relatively strong economic growth in recent years and it is noteworthy that this growth has been delivered alongside a drop in demand for oil. Low fuel taxes combined with a highly inefficient motor vehicle fleet means that the US is more highly geared than Europe to respond to high oil prices. The impact of high prices is more marked in the USA and there is much more room for energy efficiency gains.
Earlier reports
Oil Watch Monthly
Oil Watch - World Total Liquids Production
Oil Watch - OPEC Crude Oil Production (IEA)
Oil Watch - OECD Oil Production (IEA)
Oil Watch - Rest of World Oil Production (IEA)
Oil Watch - Global Liquid Fuel Production Trends (EIA data)
Oil Watch: North America Liquid Fuel Production
Contact
- Content: editors at theoildrum dot com
- Tech support: support at theoildrum dot com
License

This work is licensed under a Creative Commons Attribution-Share Alike 3.0 United States License.
Euan - Very clear and concise picture...thanks. "...the USA has enjoyed relatively strong economic growth...and it is noteworthy that this growth has been delivered alongside a drop in demand for oil." I imagine the key part of that statement is "relatively strong". Which returns to the debate of what the US growth figures truly represent...or don't represent. The unemployment, though better than many EU countries, doesn't seem to match the optimism that our economy is doing well. Looking at the winners and losers the demand metric may serve as a modifier or even substitute for changes in GDP. Folks argue about the computation and meaning of GDP variations. But changes in demand (or lack thereof) appears to be a very good representation of not only how an economy interacts with energy but also how it will be handle the worse aspects of PO.
"Low fuel taxes combined with a highly inefficient motor vehicle fleet means that the US is more highly geared than Europe to respond to high oil prices." Is that the silver lining or the dark cloud? LOL. It certainly allows the US economy more flexibility to offset prices increases. But at what cost: higher tax burden (assuming the pols would ever have the nerve to do it) at a time when increased energy costs are pulling more money from the public . And then add a huge increase in spending requirements by the public to replace inefficient vehicles and doing home improvements. That may look viable on paper but in practice a difficult trigger to pull very quickly IMHO.
Agree this is main point. Secondary point is: these are among the most progressive countries on renewable energy roll-out yet oil product demand is flat over last 10 years. Which suggests liquid fuels and electricity generation provide much different functions for society - and there are no real substitutes for the gooey stuff. Which is another of the inconvenient truths - serious effort towards environmental issues can't be solved via substitution, but only via consumption (less).
Euan are you going to post the Potugal, Ireland, Greece chart? I thought that was fascinating - a) lower oil use due to lower affordability and b) lower seasonality, presumably (and at least to some extent) due to less oil burning and more wood burning)
Ya mean this one?
http://www.theoildrum.com/files/GPI_oil_demand_JODI.png
That's posted here as Figure 2.
ya that one. I have seen headlines on 100% increase in wood stove sales in Greece and am trying to get standing forest volumes but I dont think Greek data on such is as good as US.
Any thoughts on that graph ? (#2)
[from here] I find that a bit confusing as 20 times 30,200ha is 604,200ha. Possibly the 18.3% should read 'lost' instead of 'gained'
Area wise it is about as big as NY state, but with about 1/2 the population density--Greece, Virginia and Hawaii are nearly equivalent in that category.
I did find this WP article
Sales of wood for heating have soared 40 percent from last year, according to Alexis Tsekouras, a Kastoria wood seller. Because of limits imposed by the forestry service on the amount of timber that can be harvested, wood is imported from Bulgaria, he said
JODI publish a LOT of data on oil products demand (unfortunately the data base has been off line since yesterday) that allows an in depth picture to be built:
We see that there is highly cyclic demand for diesel in Greece peaks centred on the winter months and that this demand is in decline - so this accounts for a fair amount of the trend seen in the GPI composite chart. We also see fuel oil and kerosene cycles with peaks centred on the summer - fuel for ships and jets? Fuel oil in decline, kerosene stable.
I'm guessing the diesel is used in diesel powered generators on the islands? The mountainous islands are forested at higher altitude and so its possible there is a shift to timber. Its also possible that high energy costs / unemployment means folks are simply using less electricity - wearing a sweater on those cold winter evenings.
From memory Crete has 4 x 200MW oil fired turbines at Heraklion.
Crete and Rhodes are the 2 largest Greek islands not connected to the mainland power grid.
Fuel oil peaks in summer because of tourism/ air conditioning load.
The fall in diesel demand is almost certainly the result of the economic problems-- less transport, less shipping etc.
In these statistics never ignore the potential for fuel tax evasion and/ or smuggling. If there is a way around the rules, the Greeks will have found it.
Mainland power is mostly coal (lignite), a bit of hydro (seasonal- -that will have a big impace on diesel demand), and there is some gas now (privately owned industrial).
Despite favourable conditions, Greek investment in renewables has been constrained-- the solar boom came just about when Greece began its economic crisis. If the EU really wanted to help Greece, then a programme of installing solar panels on Greek islands would reduce Greek imports and make it more succeessful an economy in the long run.
However always in Greece there is the problem of corruption and ineffectiveness, which means the siphoning off of resources from any project-- you can see the EU taxpayer not wanting to pay for that.
Which suggests liquid fuels and electricity generation provide much different functions for society - and there are no real substitutes for the gooey stuff.
I'd say that's entirely untrue. Instead, liquid fuel consumption in Europe is dominated by freight trucking, which simply has a much longer timeframe for improvements from efficiency and substitution.
Freight needs to move from diesel trucks to electric rail and local EREV trucks - that will take a while, especially in Europe where diesel is relatively subsidized, and national rail systems need to be standardized.
'Europe where diesel is relatively subsidized'.
? Do European governments give rail freight operators discounts on fuel taxes?
Diesel is highly taxed everywhere in Europe as a motor vehicle fuel-- just less highly taxed than gasoline.
The lower level of taxation is a relative subsidy.
My standard estimate is that about 0.1% of the people in the world have some understanding of what I call "Net Export Math." I am beginning to think that this estimate is too high. We are all aware of Dr. Bartlett's famous comment about humans and their failure to understand the exponential function, but the problem with Net Export Math is that one has to explain multiple exponential functions.
But I think that the larger problem is psychological, even for Peak Oilers. The implications are so troubling, that most of us, even in the Peak Oil crowd, who are aware of Net Export Math are somewhere between disbelief and denial.
In any case, following are two charts that I think clearly illustrate our predicament.
Jeffrey J. Brown
Net Export Math Explained in Two Charts
The ECI ratio, which is simply the ratio of total petroleum liquids production to liquids consumption, gives us a measure of how much net export capacity a given oil exporting country has.
The rate of change in the ECI ratio, given a multiyear decline in the ratio (and absent exogenous effects on production such as political unrest, e.g., Russia in the early 1990’s, and clearly voluntary reductions in production, e.g., Saudi Arabia in the early 1980’s), appears to provide us with a reasonable estimate of when a given oil exporting country might approach zero net exports. Furthermore, some simple math allows us to estimate remaining Cumulative Net Exports (CNE).
The GNE/CNI ratio, which is the ratio of Global Net Exports of oil (GNE*) to Chindia’s Net Imports (CNI) is very similar to the ECI ratio.
The following chart shows normalized ECI values for the Six Country Case History (with 1995, the Index Year, = 100%) and normalized ECI values for GNE and for Saudi net exports (with 2005, the Index Year, = 100%). Also shown are normalized GNE/CNI values (with 2005, the Index Year, Year One on the charts = 100%).
The index years, 1995 for the Six Country Case History, and 2005 for Saudi and global data, were inflection points, when production and net exports virtually stopped increasing, or peaked.
The next chart shows estimated Post-Index Year Remaining CNE (Cumulative Net Exports), by year, for the Six Country Case History, For Global Net Exports, For Saudi Arabia and for Available Net Exports. The estimates are based on extrapolating the six year rates of decline in the ECI and GNE/ECI ratios following the Index Years, i.e., the production/net export inflection points.
At the end of 2001, estimated remaining post-1995 CNE for the Six Country Case History were down to 39%, or about 3.5 Gb (billion barrels). The actual value at the end of 2001 was 25%.
At the end of 2011, estimated remaining post-2005 CNE for Saudi Arabia were down to 62%, or about 28 Gb.
At the end of 2011, estimated remaining post-2005 Global CNE for were down to 78%, or about 349 Gb.
At the end of 2011, estimated remaining post-2005 Available CNE for were down to 52%, or about 87 Gb. In other words, based on extrapolating the 2005 to 2011 rate of decline in the GNE/CNI ratio, at the end of 2011 the estimated total post-2005 cumulative volume of Global Net Exports of oil that will be available to about 153 net oil importing countries was down by about half.
*GNE = Net exports from top 33 net exporters in 2005, BP + minor EIA data, total petroleum liquids
wt - "...that most of us, even in the Peak Oil crowd, who are aware of Net Export Math are somewhere between disbelief and denial." I suspect that's the case with many of our potential problems like GHG etc. Consider the simple implication of you ELM: is the KSA going to deny its citizens of the energy they require so they can maintain export levels? Or more to the point will the citizens allow that to happen or is there another Libya style revolt coming? Even more to the point could Americans accept just the possibility of such a disruption in oil production?
Same issue with export distribution: on paper you can point to a time when 100% of all oil exports will be flowing to China/India. Most would find that projection completely unbelievable. And it does seem unlikely. But the important issue is the implication regarding competition for the remaining reserves. China may become so aggressive in what they will pay for energy it could pull the US into a price war that could be very damaging to the economy even if we win many of the battles. Through our history as an oil importer we've become accustomed to outbidding others for all the oil we needed. Accepting the possibility of losing that ability in the future could be impossible for most. Back to the definition of demand: what you can afford to buy...not what you need to buy.
is the KSA going to deny its citizens of the energy they require so they can maintain export levels?
KSA uses oil to generate electricity. In a country with great sunlight, that's absurd. Solar power would be much, much cheaper and free up oil for export.
In fact, KSA and other Gulf countries are indeed moving to solar power fairly strongly, though perhaps not quite as quickly as would make the most sense.
Yes it's hard not to conclude that the KSA could be the 'KSA of solar'.
Australia is the other place with an obvious opportunity for solar but the coal lobby will have to be overcome as well as a whole lot of old thinking about the grid.
The marvelous development is that in places like Australia, southern California and Hawaii (which uses oil to generater power), with great insolation and high power prices, solar is now actually cheaper than utility rates, even without subsidies.
IOW, in many places we've reached grid parity.
So, both industrial/commercial and residential rooftops are starting to fill up with PV panels, and utilities are starting to worry...
And, alas, solar does not work at night-- the problem with it in Africa. So it's not an 'off grid' solution, and since peak electricity demand occurs at or after sundown in many places (eg the UK) you still need despatchable fossil fuel generated electricity capacity equal to peak demand.
If the storage problem could be cracked then it starts to look more feasible.
I do know roughly the UK stats.
Dinorwic in Wales has a capacity of 9 GWhr. The UK peak demand is more or less 60GW (I think Dinorwic's maximum output is about 1GW). So a useful amount of power (say 1.5% of peak for 9 hours) and the other 3 big pumped storage stations add, I think, another 1.5GW or so-- say 3-4% of peak demand.
But it's the scale of the problem if, for example, the UK has an anticyclonic low during a cold snap (which is precisely what happened in January 2010) lasting 5-10 days. Your wind power just stops.
At least in the Australian and Californian context it is predictably sunny (except Jan-March presumably for CA, and summer months for Australia?). Hawaii has the rainy season.
Whether flywheels, fuel cells, mine pumped storage, compressed air storage-- any or all of these offer a solution, I don't know.
solar does not work at night-- the problem with it in Africa. So it's not an 'off grid' solutionZ
Batteries are much cheaper than kerosene, which is so widely used in Africa.
peak electricity demand occurs at or after sundown in many places (eg the UK)
People come home from work and turn up the thermostat, and put on the kettle. The oppportunities for improvement are varied and enormous. 1st, the UK is famous for drafty houses and electric heating - a terrible combo. Insulation, air-heat-pumps, time-of-day pricing for electricity...
you still need despatchable fossil fuel generated electricity capacity equal to peak demand.
Not at all. Far better solutions include Demand Side Management, wind power, storage, in that order. DSM involves moving demand around using price signals - it works very, very well and is far cheaper than more peak generation capacity.
Don't forget that when renewables have ramped up so will EVs, which will provide massive possibilities for DSM as well as sending power back to the grid.
If the storage problem could be cracked
It already has, though it really isn't the first thing to look at. Again, DSM is by far the best, followed by wind power. Long-distance transmission is important. Don't forget that none of your power sources will disappear - at the worst of times there will still be a little light and wind, there will be power imports, there will be biomass and wavepower, etc, etc.
Storage will be needed eventually, of course. Good tech already exists, as you list. Don't forget "wind-gas" - that's the solution for the kind of seasonal problem you're talking about, though due to the variety of partial solutions available, you will neeed far less than 100% replacement of generation.
Unlikely it is economic in short run for Saudi Arabia or Gulf States to go solar.
The reason being they have cheap, shut in, natural gas. So the opportunity cost of using that is so low that solar with its higher capital expense does not make sense.
The crunch point comes when they run out of spare cheap gas.
You would think that would be the case, but as far as I know it isn't.
KSA electrical generation is almost entirely from oil. Natural gas is indeed cheap in KSA -they hope to develop local industry by keeping natural gas cheap, and due to that already have shortages due to excess demand and insufficient supply. A classic example of bad economic planning: shortages due to price controls and bad investment (like wheat in the desert).
I am the 99.9%. If I may be the person in class who asks the stupid question/comment everyone else is thinking, it seems to me that your Net Export Math elegantly accounts for variables in order to find out how much exportable oil there is for those of us who own cars, and that the trend is heading inexorably towards draft animals. I admit I am baffled by NEM, but my BS meter pegs anytime Peak Oil debunkers crow about the tight oil boom. I'm in the market for a good pack mule myself as we speak.
Please remember to clean up after your mule and dispose of it's waste in an ecologically-friendly manner.
On the maure:
Dispose of it! Heck no. I'll be wanting it for its NPK content.
Just got done reading Gene Logsdon's Holy shit: Managing manure to save mankind (2010) Chelsea Green Publishing.
On the 0.1% notion:
True for great many topics in industrial society with high specialization. Plus we're introducing many new, maybe novel, terms. That can't help comprehension.
Just did a search of TOD (if I did it right and that's a big IF. LOL):
"Cumulative Net Exports" first mentioned 11/29/10
GNE 3/20/11
CNI 5/25/12
ECI 6/13/12
Need to teach this stuff in high school if not earlier. Might need an app to make graphs quickly available, auto updated, visually accessible. Like what "skeptical Science" produced for AGW.
I understand, still I might be among the 99.9% "denialists". I feel like I am at a birthday party. I am aware of the major hangover I will face tomorrow while cleaning up and doing dishes, but that does not depress me. At this very moment I enjoy the party mankind gives on fossil fuels. I know the DJ has only a couple of songs on the playlist, but why should I reduce the party mood now?
The day PO kicks in a society goes into terminal decline. And that takes a couple of years to happen. Regional differences are more important than the exact timing of GNE/CNI going through zero. (Chindia might crash earlier than the West, by the way!). So I am a part of those 0.1%, but as to date I refuse to behave like that. :-)
This is the penultimate example of the tragedy of the commons isn't it? However we explain our behaviour, I realise the end could be quite near and doing what I feel compelled to do and that's what we all do everyday anyway. The events may surprise some of us more than others but we won't let on if we can help it. Most of us are great conformists.
Yes, I agree. I believe we are so far beyond carrying capacity + the majority is completely unaware + the majority of those who are aware are not willing to change + the required level of change is dropping like >90% of comfort/lifestyle/... So I believe the situation is so severe that it just makes too little sense to try. I have a rather low profile lifestyle, but I am not willing to downsize much further; to retreat to a cabin in the woods or whichever lifestyle is in line with living in harmony with nature. At least I lack any offspring.
So with apologies to Dr. Albert, "The greatest shortcoming of the human race is our inability to understand Chaos theory!" To be clear, my small mind, certainly doesn't!
Though I have a hunch that even J6PK will finally understand what chaos is like when he sees it!
My apologies for being completely OT but I just loved the working title of this paper:
http://www.unomaha.edu/math/docs/heidel_pubs/18.pdf
LOL! What's there not to understand? paging West Hubble Telescope >;-)
Edit: I had to add this and now I run for the hills!
http://www.systemdynamics.org/conferences/2007/proceed/papers/ROSSE241.pdf
I note that back in 1939 Joseph Schumpeter was probably looking at discontinuities on a rising stair step model of industrial progress based on access to cheap fossil fuels. However we seem to be looking at the down side and a descending staircase of industrial regression.
May I suggest that embracing the oft maligned alternatives such as solar energy and wind despite their shortcomings such as intermittentcy might not be such a terrible idea after all... just saying!
Fred Out!
Chaos Theory is not the problem here, it's the explanation of Chaos Theory that is impenetrable. Academic mathematicians have a tendency to hide their ideas under piles of notation. Most of the battle is understanding the notation; the ideas are very simple.
I suggest Chaos: Making a New Science by James Gleik as a reference
TKS for the suggestion Sponia, I read that book many years ago and I do get the gist of it. >:-)
Perhaps you could consider producing a Net Export Lite theory for those of us who just want the executive summary.
My take:
Oil importers can only import from the Global Net Exports (GNE), the pool of oil placed on the world markets by the exporting countries.
1. This pool will shrink faster than they expect because natural declines in production will be exacerbated by the exporting countries' increasing need of oil for themselves, which they will take from export volumes.
2. India and China will purchase an increasing share of the GNE, so if you are neither India nor China your oil pool is shrinking even faster.
In this simplified scheme there are only two numbers: Global Net Exports (GNE) and Global Net Exports Minus India and China (GNEMIC)
Save the CNI and the GNE/CNI ratio and the ECI ratio for specialized discussion, maybe on a separate web page. Also Cumulative Net Exports and the Six Country Case History. They might add 10% to the theory, but they add 90% to the difficulty of understanding it
Of course, I have already defined Available Net Exports (ANE) as GNE less Chindia's Net Imports (CNI).
Regarding the ratios, my point is that they provide valuable information about future net exports, that is not at all obvious when one looks at production numbers:
WT
I think you are right - 99% don't understand it and it is critically important
Maybe you should make a YouTube video: "ELM - what it is and what it means to you" as the working title. Lay it out as simply and slowly as possible. Use lots of animations
Then we on TOD can promote it and who knows, maybe it will go viral
Simple is the key
When I get the slides finished, I'm going to put together a Powerpoint presentation for a proposed ASPO-USA webinar.
Do some of those graphs change shape if you plot per capita? I wonder if some of what you are seeing as long term trends is due to population change and not consumption patterns or efficiency changes.
Wouldn't those peaks be due to fuel oil consumption?
Yes, much of the population in Ireland live off the gas grid so are dependent on either oil or turf (peat) for heating, with the recent hikes in oil prices, many are seeking alternatives to oil. In many cases this means going back to turf, but many houses are being improved with better insulation and more efficient boiler.
But the biggest cause in the reduction in oil usage is the collapse of the construction sector since 2007, currently, planning applications are > 90% down on their peak values, construction is a heavy oil consumer wrt to concrete and all the heavy construction equipment.
Road building has also, all but stopped, but, the recent motorways have made road transport much more fuel efficient as there is no longer hours of stop start traffic everywhere.
On better roads I wonder whether they really save gasoline? At least in the long run.
In that people drive faster. For most drivers, the time cost of driving is still greater than the fuel saving of driving at an efficient speed. So road speeds creep up. The only provable thing that lowers road speeds (besides enforced restrictions like speed camers) is either more traffic, or (much) higher fuel prices. The fuel price effect tends to fade over time (in economic terms, the substitution effect away from burning fuel is overcome by the income effect that as your income rises, you consume more of everything). Also people in work have a time cost.
Also with better roads people drive longer distances, commute further-- the North American experience (the 401 Highway in Toronto is 22 lanes wide at one point, and is jammed with traffic most of the day-- the average Toronto commute is now over 1 hour).
What has probably hit with Ireland is simply the recession. Unemployed people don't drive much: they don't have work to go to, they've got no money to spend. Less economic activity means less construction and less goods shifted.
On peat it's a pity, from a carbon and other points of view, peat is an environmental horror. Deforestation in Greece is going to have the same sorts of impact.
I suspect the Irish are hunkering down and turning down the thermostat. Granted Ireland has lots of skilled 'for cash' odd job builders right now, but what you can do with insulation and airtightness is fairly limited once the house is built (as I have found to my cost with a Victorian home).
Well, what the heck - tell us about your home situation: what's the numbers for annual consumption and cost? What kind of walls, roof, windows and heat source do you have?
What would you estimate for the R values of your walls, roof and windows?
What kind of solutions have you considered - insulation, windows, heat source? Have you looked at new windows and air heat pumps?
From personal experience a steady 50 mile journey at 70mph used about 30% less fuel than one where you often have up to 30 minutes of ceawling traffic at 10mph on one or two "pinch points" with a poor quality road that requires frequent speed changes plus the occasional overtaking past slow vehicles.
The principal cause of the recession in Ireland was the housing bubble (overconstruction of unneeded houses in the wrong places) bursting turning what could have been a mild recession into a complete collapse (for the construction industry).
I noticed that several of the graphs emphasize the change in demand by changing the minimum of the y-axis. For example, Figure 11 starts at 15 mmbpd. Many skeptical readers would consider that method to be misleading. IMO, a far more defensible way to show the change in demand is to show the percentage change from the origin date. Ie, set the Jan-02 point as 0% change, and plot the delta since then in percent.
Agreed. Please zero-base all graphs. Thanks.
I would disagree: zerobased charts (either absolute or %) are very uninformative - you can't see what's going on.
The real problem is standardization to allow good comparisons. A standard y-axis minimum would assist with comparison between charts. Perhaps 75% of maximum?
Interesting post and great graphs!
That US chart needs to go out a little further to make any definitive conclusions about demand but at this point in time, I am of the opinion that demand has not stabilized. With median incomes still stagnating, tremendous losses of home values/more difficult credit, high food prices, etc... I believe US oil demand will continue to decline if other countries (China!) can continue to outbid Americans for the increasingly constrained supply.
U.S. Gasoline Demand Sinks 3.7% Last Week, MasterCard Says
One last note, people in Indianapolis do not ride the bus by choice. The service is awful and awfully sparse.
IndyGo Ridership
Interesting numbers Andy, time to lobby for improved services and systems?
The web is a fantastic resource for pooling effort. I am involved in a blog in my town (Auckland NZ pop 1.5m) that just keeps going from strength to strength in terms of readership and influence. And this is in a city with US levels of auto-dependency and decades of US style underinvestment in Transit.
We were told that no one cares about Transit and its only for the poor. But each little improvement in delivery is met with increased ridership and we are now at the point that it is no longer just the dispossessed using it. Demographic shifts and environmental concerns are important but nothing beats just improving the frequency and quality of the service.
We try to keep the arguments at the technical level, although urban transit is a political not a technical problem, because by defeating the auto/highway complex's lazy assumptions one by one is the best way to influence the political debate. Also we keep the site ad free. It is entirely run by amateurs. TOD is a great role model, I have learnt so much here. Keep us in the loop on the news from Indy. Oh and can recommend this book for a close study of one of the forces at work in US, and global, cities;
http://transportblog.co.nz/2012/12/19/the-great-inversion/
Thanks for this very interesting overview. You splitted up the EU28 into all its different countries, while you left the USA as a whole. As European I see, and aknowledge, the differences between our countries and their economies. But I might suppose the USA is not a homogenous block either. I suppose JODI does not collect data from different USA-states? Is there any source of information about that?
V – Good point. Depending on the metric I’m sure there are extremes between that states that match and even exceeding those between some EU countries. I’m in Houston, Texas and just yesterday there was a summary of our economy. We don’t sound like we’re part of the national economy. Home foreclosures and poor real estate market? Housing prices have risen 10% for a couple of years. Home sales rate: currently there’s only a 4 month inventory of homes on the market. In many other states inventory is measured in years. In the last several years about 75% of all new jobs created in the US have been in Texas. A lot of those jobs may be towards the lower end of the pay scale. But what better: having a lot of folks making a lower wage or none at all?
It would be interesting to see how demand (what can be afforded and not just desired) of gasoline varies (per capita) among the states. Of course there are regional differences: a lot more driving in Texas than NY I suspect. But maybe other metrics could tell the story. And that the situation today. What develops when the worse of PO kicks in: what states will be able to outbid the citizens of other states for energy? Will the govt allow such imbalances?
I expect that the UK will continue to show a decline in fuel demand for 2012. The figures for the first six months of the year showed a significant decline in petrol and diesel sales:
http://www.thisismoney.co.uk/money/cars/article-2211819/Proof-recession-...
This is supported elsewhere by reports of lower road traffic and increased rail/bus traffic; if not in the rural areas, certainly residents of the big metropolitan areas continue to take advantage of the extensive networks - look at this map to see where the network can take you - and this is only the tube and rail network of London. The buses are not shown on this map, but also use the same travel card system (Oyster).
http://www.tfl.gov.uk/assets/downloads/tickets/oyster-rail-services-map.pdf
It would be interesting to see if demand dropped quicker in cities/countries/states with better mass transit. My guess would be "No" because I think it is more of being forced to change habits than it is of choice.
according to thisismoney / DECC
The JODI data don't really support the thisismoney statement. Petrol sales have been in long term decline while diesel sales are in long term ascent. The near term spike in diesel and slump in "other" may be a reporting issue that I suspect may be revised out of data in future.
Large regional imbalances in access to energy (and government resources) already exist and are accepted - as are imbalances in energy prices.
To think of some examples -
1. Energy prices - compare gasoline in Texas with gasoline in California.
2. gov resources - compare the speed of infrastructure repair after Sandy in New York with that in New Orleans after Katrina. Some regions are simply more important to government than others, irrespective of population density.
3. Citizens of one state outbidding citizens of other states - a combination of average income and internal energy infrastructure (eg the ability to deliver energy cheaply via pipeline etc)- compare the minimal natural gas infrastructure of Maine with virtually anywhere else. A low Maine average income and lack of natural gas equals no opportunity for CNG vehicles, less options for home heating, less disposable income, less competitive manufacturing. It is up to the people of Maine I think to do something if possible to remedy the situation -
It seems to me that regional differences in energy price and supply are more likely to increase rather than decrease as time passes, as each state follows its individual path. To prevent this from occurring, we would need a strong,effective central government that coordinates national energy infrastructure investments pursuant to an Energy Policy to benefit the people. To get an Energy Policy to benefit the people, we need effective leadership in Washington that puts the people before...this is getting too unlikely, I'll stop here.
S – Well put. But: “To get an Energy Policy to benefit the people…”. A policy? Like making CA to give up their gasoline formulation rules and build refineries. Or force Texas refiners to make CA blends and ship it to the west coast at a loss? Or make La. NG consumers pay a surcharge to equal the cost of shipping NG to New England? Make mid-west refiners to pay the same price for Canadian tar sand oil that Gulf Coast refiners pay for Light La. Sweet? Make the states with the lowest motor fuel tax charge the same as the state with the highest tax? Make NW hydro-sourced electricity customers pay a surcharge to make them pay as much as folks who are more dependent on oil-fired plants? Or force La. to charge the same amount of oil severance tax (currently 12.5% off the top and has earned the state many tens of $billions) as PA which charges nothing and has never gotten a penny from the oil industry as a result? And a fair bit of oil/NG produced in Texas and La. belongs to the states (and thus its citizens). Should they be forced to ship that share out of the state? Should NY be forced to allow frac’ng because it’s allowed in Texas and ND?
A disastor relief: set a per capita limit on fed $’s so the folks in NY and FL get no more fed assistance than folks in S. Dakota? Or here’s a good one: don’t allow folks to pay more per sq ft for housing in NYC as they pay in Houston? Then they would have more to pay for the energy. And while we’re at it folks in Texas pay no state income tax…think folks in Mass. would go for that deal? That would give those folks more money to keep their homes warm in the winter.
Balance is fine for those that gain in the process. Not so much those who have to pay more. Or is the balance achieved by making everyone pay as little for everything as anyone else is paying? The concept may have some general merit but how does one effect those changes? More important: how is it forced upon the population?
Your right. I looked for US State specific oil consumption data but couldn't find any (I have State specific oil production data). One may safely assume that oil demand in the oil producing / exporting states like Texas and N Dakota will be strong and growing. And that there will be States with weak economies where oil consumption will be falling (I'm not sure where these may be).
This seems like a good point to remind everyone that oil can (and should) be replaced.
People who are pessimistic about dealing with Peak Oil wonder: which processes happen to use oil today, because of historical accident, and which truly have to do so? What part of manufacturing, transportation etc, is specifically reliant only on oil?
So many things run on oil - can we possible replace oil in all of these applications?
The answer is yes, primarily through electrification of surface transportation and building heating. Aviation and long-haul trucking can be replaced with electric rail and water shipping, and aviation will transition to substitutes.
This will proceed through several phases. The first is greater efficiency. The second phase is hybrid liquid fuel-electric operation, where the Internal Combustion Engine (ICE) is dominant - examples include the Prius and, at a lower price point about $20K, the Honda Insight. The 3rd phase is hybrid liquid fuel-electric operation, where electric operation is dominant. Good examples here are diesel locomotives, hybrid locomotives, and the Chevy Volt. The Volt will reduce fuel consumption by close to 90% over the average ICE light vehicle. This phase will last a very long time, with batteries and all-electric range getting larger, and fuel consumption falling.
The last phase is, of course, all electric vehicles, which are are slowly expanding, and being implemented widely (Here's the Tesla, here's the Nissan Leaf). Electric bicycles have been around for a long time, but they're getting better. China is pursuing plug-ins and EV's aggressively. Here's an OEM Ford Ranger EV Pickup, and a EREV light truck (F-150).
Here are electric UPS trucks. Here is a hybrid bus. Here is an electric bus. An electric dump truck. Electric trucks have much less maintenance.
Kenworth Truck Company, a division of PACCAR, already offers a T270 Class 6 hybrid-electric truck. Kenworth has introduced a new Kenworth T370 Class 7 diesel-electric hybrid tractor for local haul applications, including beverage, general freight, and grocery distribution. Daimler Trucks and Walmart developed a Class 8 tractor-trailer which reduces fuel consumption about 6%.
Volvo is moving toward hybrid heavy vehicles, including garbage trucks and buses. Here is the heaviest-duty EV so far. Here's a recent order for hybrid trucks, and here's expanding production of an eight ton electric delivery truck, with many customers. Here are electric local delivery vehicles, and short range heavy trucks. Here are electric UPS trucks, and EREV UPS trucks. Here's a good general article and discussion of heavy-duty electric vehicles.
Diesel will be around for decades for essential uses, and in a transitional period commercial consumption will out-bid personal transportation consumers for fuel.
Mining is a common concern. Much mining, especially underground, has been electric for some time - here's a source of electrical mining equipment. Caterpillar manufactures 200-ton and above mining trucks with both drives. Caterpillar will produce mining trucks for every application—uphill, downhill, flat or extreme conditions — with electric as well as mechanical drive. Here's an electric earth moving truck. Here's an electric mobile strip mining machine, the largest tracked vehicle in the world at 13,500 tons.
Water shipping and aviation can also eliminate oil: see my separate post on that topic.
Here's a terminal tractor that reduces fuel consumption by 60%.
Farm tractors can be electric, or hybrid . Here's a light electric tractor . Farm tractors are a fleet application, so they're not subject to the same limitations as cars and other light road vehicles(i.e., the need for small, light batteries and a charging network). Providing swap-in batteries is much easier and more practical: batteries can be trucked to the field in swappable packs, and swapping would be automated, a la Better Place. Zinc-air fuel cells can just be refueled. Many sources of power are within the weight parameters to power modern farm tractors, including lithium-ion, Zebra batteries, ZAFC's and the lead-acid developed by Firefly Energy (before their demise), and others.
It's very likely that an electric combine would be an Extended Range EV: it would have a small onboard generator, like the Chevy Volt. Such a design would be more more efficient than a traditional diesel only combine, and would allow extended operation in a weather emergency.
Most farmers are small and suffering, but most farm acreage is being managed by large organizations, and is much more profitable. Those organizations will just raise their food prices, and out-bid personal transportation (commuters and leisure travel) for fuel, so they'll do just fine. As farm commodities are only a small %of the final price of food, it won't make much difference to food prices. The distribution system, too, will outbid personal transportation for fuel. Given that overall liquid fuel supplies are likely to only decline 20% in the next 20 years, that gives plenty of time for a transition.
Even hydrogen fuel cells could be used, though they're not likely to be cost-competitive soon with the alternatives. PV roofs certainly could be used to extend battery life, though the cost effectiveness of that will depend on how much of the year the tractor is in the field. Electric drive trains are likely to be much more cost-effective than liquid fuels, but locally produced bio-fuels would certainly work. Also, fuels synthesized from renewable electricity, seawater and atmospheric CO2 would certainly work, though it would be rather more expensive than any of the above.
Any and all of these is several orders of magnitude cheaper and more powerful than animal-pulled equipment. One sees occasionally the idea that we'll go back to horses or mules - this is entirely unrealistic.
The easiest transitional solution may be running diesel farm tractors on vegetable oil, with minor modifications. Ultimately, farmers are net energy exporters (whether it's food, oil or ethanol), and will actually do better in an environment of energy scarcity.
Iron smelting currently uses a lot of coal, which isn't oil, but is a fossil fuel which we'd like to eliminate. Iron used to be made with charcoal, and iron oxide can be reduced with hydrogen from any source - about 30% of all smelting is done with electric arc furnaces (http://www.worldcoal.org/resources/coal-statistics/coal-steel-statistics/ ). Most of the steel used in the USA is reclaimed from scrap (and when industries mature, essentially all of their steel can be recycled); all it takes is an electric furnace to re-melt it, and the electricity can come from anything.
The US Navy plans to go reduce it's 50,000 vehicle fleet's oil consumption by 50% by 2015. They plan by 2020 to produce at least half of its shore-based energy requirements on its bases from alternative sources ( solar, wind, ocean, or geothermal sources - they're already doing this at China Lake, where on-base systems generate 20 times the load of the base), and it's overall fossil fuel consumption by 50% by 2020 with EVs and biofuel.
Some question the stability of the electrical grid, in an environment of expensive fuel. Utilities like the idea of "eating their own cooking". Here's an electric utility boom lift. Here's a consortium of utilities considering a bulk purchase of plug-ins (and a good article). Here's an individual utility buying electric cars. Similarly, utilities are buying hybrid bucket trucks and digger derricks. Here's a large commitment by two major utilities .
Here's a good quote from the Governor of Michigan: "For automakers, replacing the internal-combustion engine with an electric powertrain is both revolutionary and daunting. In a world where economic Darwinism threatens slow adapters with extinction, U.S. automakers know that they can either lead this historic transformation or become history themselves. Even today, as they engage in a struggle to survive, the Big Three are leading the way: General Motors, Ford and Chrysler are scheduled to introduce electrified vehicles next year."
France is planning for a market share for EV's of 7% by 2015, rising to 27% in 2025.
http://www.greencarcongress.com/2009/10/france-20091002.html#more
------------------------------
What if our current system is less like a train running out of power, where it will just slow down and stop, and more like a jetliner running out of power, energy which it crucially needs to have a safe landing? Do we really have the resources to build out an alternate energy infrastructure?
Well, at least in the US, there's so much energy used for things with very marginal value that we have a very big cushion. We have an enormous surplus of energy (used for single-commuter SUVs, for example) , so we have quite a lot of flexibility.
EVs don't require significantly more energy than ICEs to manufacture. Wind turbines have a very high E-ROI.
Even if PO reduces the energy we have available, we currently have such a large surplus that we have plenty of leeway to reduce consumption in some places to free up the oil needed for such an investment.
Isn't this a tricky transition, with fragile balances between politics, communications, labor, logistics, public-calm, etc?
It's true - a transition away from oil will put stress on a lot of institutions. On the other hand, this isn't any bigger than similar transitions, like going from coal to oil, or from mules to tractors. And, isn't it good to know that there technical solutions?
Where will the needed electricity come from?
From wind, mostly. Wind has a very high E-ROI, and is plentiful. Solar, nuclear, geothermal, etc will also be important. Coal is extremely abundant, but we have to hope that we don't use it.
Aren't we going to have to live within the limits of our environment?
Sure. Fortunately, energy isn't one of those limits. I'd say that climate change and species extinctions are much larger problems.
What about the invested-in infra-structure for our oil-based life style and what it will take to tear down the old infra structure and replace it with an entirely different one? Won't we have to tear down the suburbs, and similiar infrastructure?
Yes, we'll have to toss out some ICE trucks and cars before the end of their natural lifetime. On the other hand, we do that all of the time: the average US car/SUV/pickup gets 50% of it's lifetime mileage by the time it's 7 years old. They could last 25+ years, if we wanted them to, but we throw them away. The premature retirement of commercial trucks will hurt investors in some trucking companies, but that's a sunk cost.
The real question is, can we afford to build new infrastructure, and the answer is clearly yes: new rail tracks and rolling stock aren't that expensive, and EVs are no more expensive than ICEs.
We won't have to toss out housing - Kunstler is just wrong, completely wrong. A Nissan Leaf will allow a 50 mile commute, or 100 miles with workplace charging.
EVs can be built with the same factories - for instance, the Volt shares a factory with 2 other cars. They drive on the same roads.