| Will U.S. Oil Consumption Continue to Decline? | The Oil Drum | Tech Talk - Iran and the New EIA and OPEC Reports |
Oil Watch: North America Liquid Fuel Production
Posted by Euan Mearns on December 14, 2012 - 2:21pm

Figure 1 North American (USA, Canada and Mexico) total liquid fuel production stood at 16.3 million bpd in august 2012. 9.0 million bpd was conventional crude + condensate comprising 55% of the total.... 5 more charts below the fold.
Oil Watch posts are joint with Rembrandt Koppelaar.
Figure 1 continued Despite much hype about energy independence, conventional crude oil production is continuing its long term and gradual decline. Total liquid fuel production was on a stable plateau of around 14 million bpd from 1994 until 2009. In that period slow decline in conventional crude was compensated by growing tar sands production. Strong growth in total liquid fuel since 2009 (over 2 million bpd increase) is attributable to the shale revolution with additions from shale oil and NGL from shale gas. Future growth from tar sands seems assured for so long as their is economic and political will to continue exploiting this vast resource and there is a supply of cheap natural gas that is central to the success of this energy intensive source of liquid fuel. Future growth from shale is less assured since production comes from sweet spots that are more analogous to conventional oil accumulations and once they are all drilled declines can be expected to overtake new supply. Data sources: Energy Information Agency, National Energy Board Canada, Statistics Canada, North Dakota Drilling and Production Statistics, Railroad Commission of Texas. The chart includes a 150,000 bpd assumption for Canadian shale oil 2011/12.
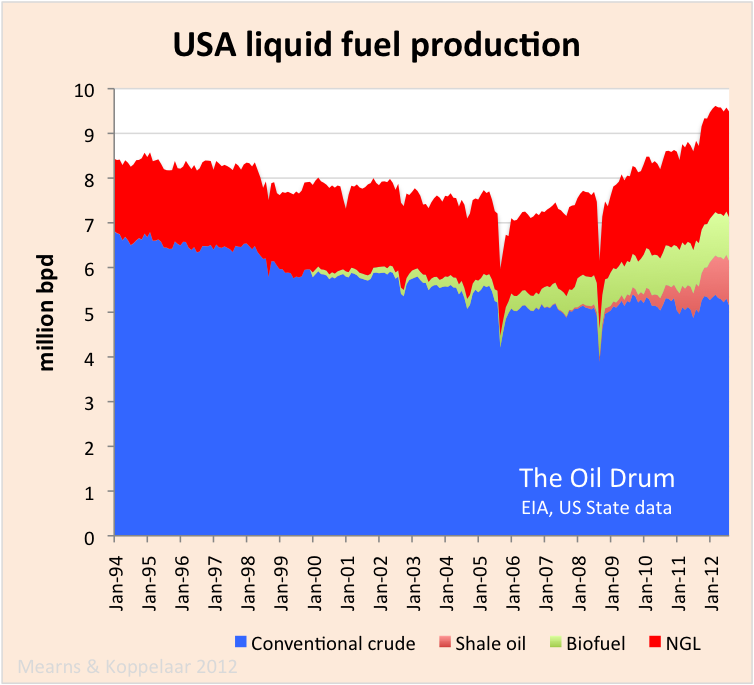
Figure 2 The long term decline in US conventional crude production was arrested around 2006 and since then production has been on a stable plateau just over 5 million bpd. In 2006, total liquid fuel production was just over 7 million bpd and since then it has grown strongly to 9.5 million bpd in August 2012. According to BP, the last time the USA produced >9.5 million bpd of C+C+NGL was 24 years ago in 1988. Growth in shale oil, NGL and biofuels have all contributed to the growth in total liquid fuel combined with stable underlying conventional crude production.
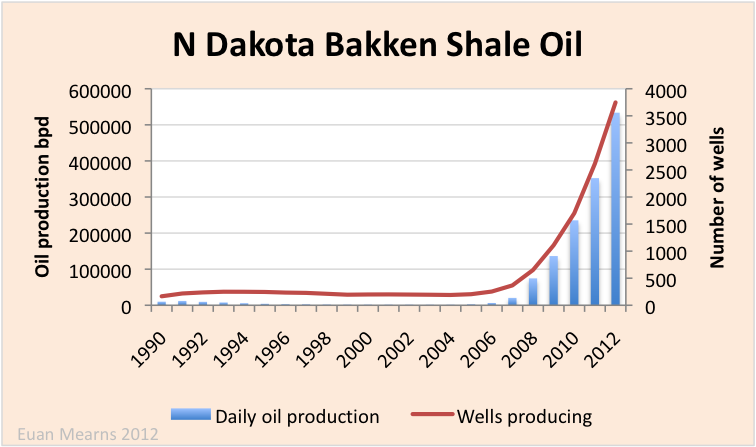
Figure 3 The "miracle" of US shale production is often discussed in the context of the application of new technology. In fact horizontal drilling and fracking have been around for decades and while more recent technology refinements have helped commercial drilling and exploitation, US shale oil production has been brought about more by the application of raw force, drilling thousands of wells that has been enabled by sustained high oil prices.
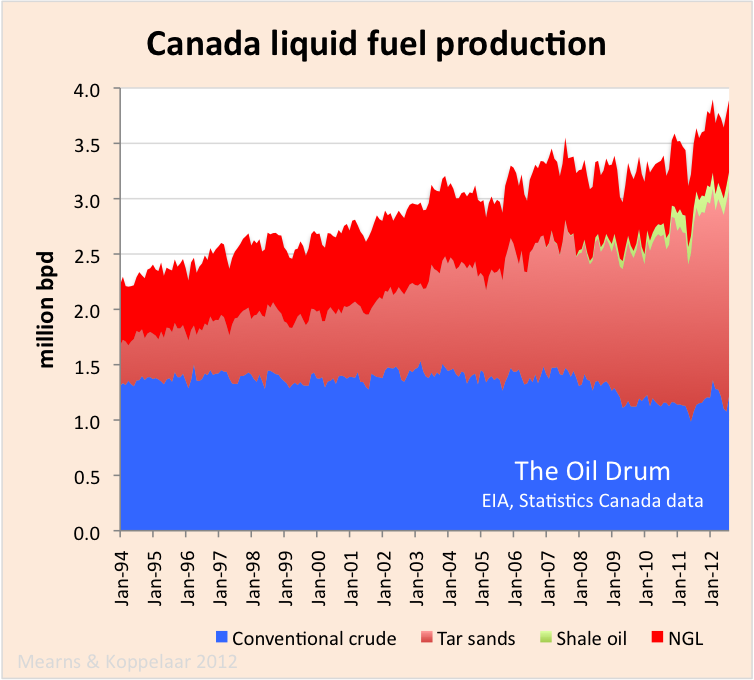
Figure 4 Canada's conventional crude production was on a stable plateau of around 1.4 million bpd until 2007 when a new phase of decline set in. The main feature of Canadian production is of course tar sands that have grown from 0.36 million bpd in January 1994 to 1.87 million bpd in August 2012. The Canadian Association of Petroleum Producers have forecast that tar sands production may grow to 5 million bpd in 2030. The main obstacle to this may be availability of cheap natural gas that is currently central to this energy intensive form of liquid fuel recovery. The Bakken province of N Dakota crosses the Canadian border and Shale oil production in Canada was estimated to be 159,000 bpd in June 2011. Current data are not readily available and production since then is assumed to be running at 150,000 bpd.
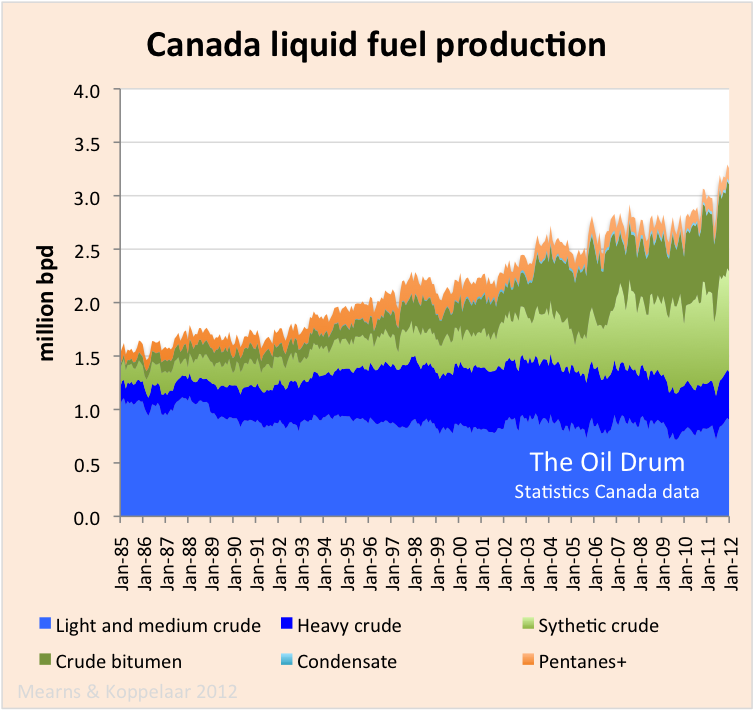
Figure 5 Figure 4 was generated by deducting the Statistics Canada data on tar sands production from the EIA data on Canadian crude + condensate production. Statistics Canada provide more detailed information on the composition of Canadian fossil liquid fuel production which are displayed above. Light and medium crude production is stable. Heavy crude production is in decline. Upgraded synthetic crude and non-upgraded crude bitumen are split roughly 50:50. Pentanes plus we guess is condensate.
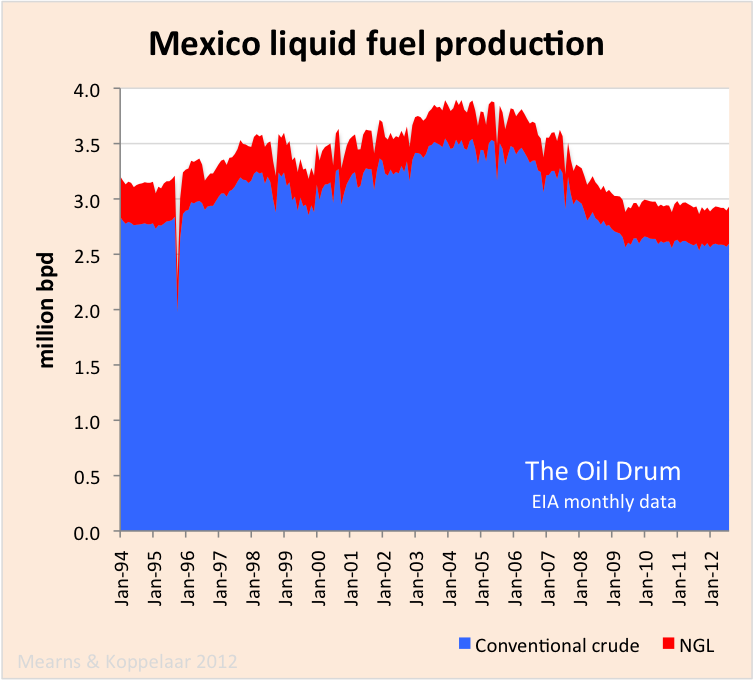
Figure 6 The EIA data confirm the picture of the IEA data which is that Mexican production has stabilized at just below 3 million bpd (C+C+NGL) following the transfer of nitrogen gas injection from Cantarell to Ku Maloob Zaap.
Earlier reports
Oil Watch Monthly
Oil Watch - World Total Liquids Production
Oil Watch - OPEC Crude Oil Production (IEA)
Oil Watch - OECD Oil Production (IEA)
Oil Watch - Rest of World Oil Production (IEA)
Oil Watch - Global Liquid Fuel Production Trends (EIA data)
Contact
- Content: editors at theoildrum dot com
- Tech support: support at theoildrum dot com
License

This work is licensed under a Creative Commons Attribution-Share Alike 3.0 United States License.
New post on my website on EIA Annual Energy Outlook 2013 Early Release dated 5/12/2012
The IEA WEO 2012 from Nov 2012 had the shale oil production plateau continuing much longer
13/12/2012
US still needs to import 50% of its crude oil requirements despite increasing shale oil production
http://crudeoilpeak.info/us-still-needs-to-import-50-percent-of-its-crud...
Thanks a lot for this Matt, these reports (their authors) are now so much "walking on eggs"(french saying), quite amazing (even if one could say it's the case for decades already).
2 questions:
1: The US crude decline has been arested at stable levels since 2006. Is this GOM production add ons? If not, where does this come from? I was also of the impression that the GOM crude added a bump to the production graph, here it is more of a flat line.
2: In Mexico gas injection has been re-routed from Cantarell to KMZ. This halts the decline there. Any ideas for how long?
1) high price = drill baby drill. I don't know specifically where the incremental production comes from, I'd guess it is across the board. Not least interventions in old wells (work overs). Maybe Rockman can answer.
2) Decline has bee arrested in Mexico as building production on KMZ has cancelled declines in Cantarell. When KMZ reaches plateau (next year?) Mexico will carry on down. And when KMZ comes off plateau, Mexico will head on down fast - unless they have some new large fields to bring on.
Here's a good general overview of Pemex's situation: Mexican Oil Crisis. Pemex themselves expect a gentle decline from KMZ: Mexico raises view of peak oil from Ku Maloob Zaap | Reuters
They said much the same in re: Cantarell.
Also: Pemex to announce Chicontepec oil auction in 3 weeks | Reuters
So we have Pemex yelping "uncle!" and easing the reigns on their vaunted NOC a bit.
Here you go Euan. Sorry for the slow rsesponse...been logging a well all night. From: http://www.politifact.com/truth-o-meter/statements/2011/mar/15/barack-ob...
I don’t have the breakdown for Deep Water vs. the shallow shelf but only a relatively small amount came from the shelf for at least the last 10 years.
From the Energy Information Administration not including production from state waters.
The agency’s data goes back to 1981. Here are the annual figures for Gulf production in barrels per day.
1981: 719,000
1982: 786,000
1983: 876,000
1984: 956,000
1985: 941,000
1986: 960,000
1987: 892,000
1988: 818,000
1989: 764,000
1990: 739,000
1991: 799,000
1992: 822,000
1993: 825,000
1994: 860,000
1995: 943,000
1996: 1,021,000
1997: 1,129,000
1998: 1,228,000
1999: 1,354,000
2000: 1,430,000
2001: 1,536,000
2002: 1,556,000
2003: 1,559,000
2004: 1,453,000
2005: 1,282,000
2006: 1,299,000
2007: 1,277,000
2008: 1,152,000
2009: 1,559,000
2010: 1,640,000 (estimate)
After the Deepwater Horizon oil spill began in April 2010, the federal government allowed existing wells in the Gulf to continue production but imposed a moratorium on new drilling. While that moratorium has now been lifted, it slowed production, as output began to decrease at old wells and new ones were not on line yet to pick up the slack. In May 2010, production in the Gulf peaked and then continued to decline for the rest of the year. And the Energy Information Agency expects this decline to continue for at least two years more -- by about 240,000 barrels per day in 2011 and by an additional 200,000 barrels per day in 2012.
Since there is a lag time from the time an exploration permit is approved to the time of actual production, and since only a handful of permits for new wells have been granted since April of 2010, it is likely that Gulf of Mexico production will continue to be hit hard in 2012 and beyond”.
GOM flat, but West Texas Permian Basin is booming. Combination of EOR, horizontals, multistage frac'ing, and newly exploited tight zones.
I see your point and agree that there are some elements of flatness in recent GOM production totals. But I would also point out the following details, as observed in ROCKMAN's GOM oil output data above:
1) While not a series of perfectly steady increases year to year, GOM oil production has essentially doubled over the past 18 years (to 2010), going from 822,000 bpd in 1992, up to 1,640,000 bpd in 2010.
2) GOM output was 1,152,000 bpd in 2008, then it increased to 1,559,000 bpd for 2009. That's a year to year increase of +35%! - not bad, and far from being flat.
Yeah, the data is the data however we categorize it. Big deep water GOM increases in mid-2000s from big deep Miocene fields coming on. That has slowed and most new discovered volumes are in the more challenging lower tertiary which will be coming on more slowly. My only point, though, was that the biggest domestic increases in crude are coming from the Permian basin; I think even larger than the Bakken (sorry, posting from my phone, don't have data in front of me). Permian basin doesn't seem to be getting press attention it deserves.
Moratorium/permitorium also has delayed GOM growth a bit.
Yeah, lookit this. Texas production up from 1.1 to 1.8 mbpd since 2010. Bakken (N Dakota) booming, but still less than 0.6 mbpd and rise is steeper than Bakken. The untold story. I seem to remember seeing that Midland now has the second highest per capita income of all us cities. Yeah, here it is:
http://www.chron.com/news/article/Texas-richest-city-may-come-as-a-surpr...
US production by state:
http://3.bp.blogspot.com/-8PZ9RQ7ZAh0/T_RSferbFHI/AAAAAAAAC0s/OGRtED7Lan...
Geo – Here you go…something of a measure:
http://eaglefordshale.com/news/texas-oil-production-surpassed-1988-level...
“Texas oil production eclipsed 2,050,000 b/d in September of 2012. That’s more than the state has produced in almost 25 years! It’s no small feat. Production growth has been fleeting for more than a decade. The Permian Basin and the Eagle Ford account for almost all of the state’s growth. Since September of 2008, production has grown from 31,661,000 barrels per month to 61,500,000 barrels in September 2012. I’ll spare the science, that’s almost double.”
http://www.bloomberg.com/news/2012-09-21/eagle-ford-oil-production-above...
The Eagle Ford: “The nine fields that make up the majority of the 400-mile-long (644-kilometer) play pumped out 310,370 barrels a day, preliminary data on the Texas Railroad Commission’s website showed. That’s up from a revised count of 309,979 barrels a day in June, and 120,532 a day in July 2011.
So a rough measure: increase of around 1 million bopd with 300k from the EFS. So about 2/3 from the Permian and 1/3 from the EFS.”
RockMan / Geonola, tks for useful links. Anyone know where I can get the data used to make this chart:
http://3.bp.blogspot.com/-8PZ9RQ7ZAh0/T_RSferbFHI/AAAAAAAAC0s/OGRtED7Lan...
Here's an old article I wrote on KMZ - worrying how time passes....
Flesh on the bones of Mexican oil production
http://europe.theoildrum.com/node/2247
Sorry, I should have posted original source of the by-state production that I stole from peakoil.com. They say it's from the EIA. See original post here:
http://peakoil.com/production/us-crude-production-by-state/
Tks, so the original blog post is Early Warning and the data source is EIA here:
http://www.eia.gov/dnav/pet/pet_crd_crpdn_adc_mbblpd_m.htm
Lost of nice charts to make from this.....
JW – “In Mexico gas injection has been re-routed from Cantarell to KMZ. This halts the decline there. Any ideas for how long?”
Where did you hear that? I serious doubt its true. First they are generating N2 at Cantarell and not CO2. And that largest N2 plant in the world is offshore and 100’s of miles away from that onshore field. The little I know about the field is that it’s not a field per se but hundreds or thousands of small reservoirs in a trend. Thus a field wide EOR project wouldn’t be applicable. Just a guess but I suspect they are using conventional pump jacks perhaps with some solvent injection to help. You should find more details if you search the field name.
Huh? Ku-Maloob-Zaap Field - Offshore Technology. Pemex has rerouted the N2 over to KMZ. You're thinking of Chicontepec, the field or play with thousands of discrete sections. I gave a link above about Pemex auctioning contracts for it. Drill Baby Drill, or shall we say "Taladro del bebé!" ;)
Great article. I now know that the KMZ is named after its 3 main sub fields. And if I remember my mayan correctly, Ku is their word for "turtle".
I don't get this paragraph. First they will peak at 927 K in 2013, then they will bring it up to 1 M in 2015. Can someone clarify?
Jupp, nitrogen injection it is. They obviously plan to produce this area for 15 more years.
I read it in the article. The gas injected is the N2 produced for the Cantarell, according to the article above. I have read it elswere to, linked from TOD.
I have been wondering about this N2 re-routing. Did they build a pipe from the N2 plant to KMZ or what? It seems a bit odd to me but I am just the average guy here.
JD - my bad...thanks. I was mixing apples with potatos. Given that the N2 plant at Cantarell produces more N2 than all the rest of the plants in the world it may be more economical; to pipeline it than build a new plant.
From the pictures the plant is on land, built by Linde. Still haven't worked out where it is relative to KMZ but there seem to be long runs out to Cantarell.
NAOM
The maps I have seen has Cantarell and KMZ located relatively close to each other. So I guess they just made a pipe between the fields.
Combined net oil exports (total petroleum liquids, BP) from the seven major net exporters* in the Americas in 2004:
*Canada, Mexico, Venezuela, Colombia, Argentina, Ecuador, Trinidad & Tobago
Jeffrey
Now that 2012 is almost over, do you have an estimate for what the Western Hemisphere Net Exports will be for this year? Likely to be up a bit over last year continuing the "trend" from 2010 to 2011?
And how about World Net Exports and Available Net Exports for 2012 as well?
I would guess basically flat from 2011 to 2012 for the (2004) top seven net exporters in the Americas. Probably only two countries will show increases in net exports from 2011 to 2012, Canada & Colombia. For GNE (Global Net Exports), my guess is probably about flat, with a continued decline in ANE (GNE less Chindia's Net Imports).
But as I have previously noted, the real, and very much hidden danger, is the sky high rate of depletion in post-2005 CNE (Cumulative Net Exports). In my opinion, we are only maintaining something resembling BAU because of an extraordinarily high rate of depletion. I estimate that the remaining post-2005 volume of Available CNE* is being depleted currently at the rate of almost one percent per month.
*Total volume of Global Net Exports available to importers other than China & India
I see conventional crude is still somewhat stable. Any information on when the US Mexican Gulf oil production will face the same fate as the North Sea? 2016?
The prediction on North Sea worked well because both UK and Norway have good estimates on discoveries and make that available to the public. For Mexico, the discovery estimates are probably not as comprehensive. When I did a prediction of Mexico decline several years ago, it was pretty straightforward to anticipate a decline, but the recent plateauing was not at all predicted. A good model for probability of future discoveries would help correct this.
Feed the SUV and Starve the Children
The strong increase in US biofuels comes at the expense of starving the extreme poor in developing countries!
Food Crisis: How High Food Prices Continue to Impact the Poorest, Justin Valente, Bryan Andrews, Jerid Leigh, and Phil Currie, in Hunger, Agricultural Production, and Government Policies, Eds. Dr. Alok Kumar and Abdullah Al Mahmood Mosfeq
Could biofuel policies increase death and disease in developing countries? Indur Goklany, Journal of American Physicians and Surgeons Volume 16 Number 1 Spring 2011 pp 9-13.
The Cost to Developing Countries of U.S. Corn Ethanol Expansion, Timothy A. Wise
October 2012, Tufts University, Medford MA
The Effect of the U.S. Ethanol Mandate on Corn Prices, Colin Carter, Gordon Rausser, Aaron Smith
This is the fundamental problem I have always had with fuel ethanol - it is converting food into fuel. About 40% of the US corn crop is now going into the gasoline pumps, and this is corn that would otherwise be sold at discount prices to poorer countries to provide them with a cheap source of calories.
To simplify it, people are starving in third-word countries so Americans can drive SUVs. It just seems wrong to me.
Any gut will give you a visceral answer to biofuel sustainability. Compare the thermal power from food burning in your gut (roughly 100 Watts) to that of fossil fuel burning on your behalf (roughly 10,000 Watts in developed countries).
http://neodymics.files.wordpress.com/2010/10/foodfnergyflow081021b1.png
Since most arable land is already being cultivated, it is a sin to divert it to biofuel production. I'm all for burning otherwise wasted agricultural waste in lieu of fossil fuels, but my gut says that there is not enough such waste to make a dent in our problem.
This is the fundamental problem I have always had with fuel ethanol - it is converting food into fuel. About 40% of the US corn crop is now going into the gasoline pumps, and this is corn that would otherwise be sold at discount prices to poorer countries to provide them with a cheap source of calories.
To simplify it, people are starving in third-word countries so Americans can continue to drive gas-guzzling SUVs. It just seems wrong to me.
The corn becomes Distiller's Dried Grain (DDG) to feed cattle and live stock without the starch. If you want to help feed the third world, eat less meat.
At a volunteer meeting with the local food bank recently we were told that there isn't a shortage of food in the world, just a shortage of money for some people to buy it. Has the ethanol boom raised the price of corn as much as it has raised the production volume?
There are about 100 million acres of corn in the U.S. and 30 million are for corn ethanol. Since the ethanol production produces DDG, that displaces corn that would have been used for feed anyway.
Corn commodity speculation has more to do with the price rise of corn than ethanol IMO. People speculate and drive the price up even though they do not grow corn nor produce any corn products. This is where to start if you want to stabilize corn prices.
How exactly do people speculate and drive prices up even though they do not grow corn nor produce any corn products?
Rgds
WeekendPeak
I don't see how speculators could drive up the price of corn given the breadth and openness of the markets. I think the real culprit is low demand elasticity. People have to eat, so they will pay the price regardless of what it is. The problem in third world countries is that they might riot if they don't have the money to pay.
Agree. Not just that, but the fact that demand for food tends to be very front loaded - you have to eat now - not "some time" so you timing food purchases is more difficult.
It doesn't take a brainsurgeon to understand that as you divert more and more of the supply of corn to fuel the quantity available for other uses goes down. More importantly perhaps, as spare capacity is reduced (and this is the same for FFs btw) price volatility increases which increases the required rate of return for producers.
Rgds
WeekendPeak
as you divert more and more of the supply of corn to fuel the quantity available for other uses goes down
What?! We can't just keep increasing the total supply as much as we want to meet the demand, forever and ever? Isn't that what we've always done? Are you saying we can't keep doing what we've always done? Are you saying we can't have more of everything forever? That's just unAmurikan.
Please accept my apologies. I won't do it again.
Rgds
WP :-)
Purely financial speculators who never take physical delivery can't affect prices. But if you have storage capacity, you can, by withholding grain from the market to drive prices up.
Well, maybe not you or I. But the Cargills and Archer Daniels Midlands of this world have massive grain silos and can conceivably do it. Of course, there's always the chance someone else has an unexpectedly good harvest or decides to sell their stocks and drives prices down, but that's the essence of "speculation". It's taking a risk.
Farmers are not going to drive their own prices down by planting 100 million acres for feed and food, they get a good price for supplying ethanol makers and the ethanol makers supply ranchers and dairy farmers with DDG.
Futures speculators buy up crops without taking delivery. If someone needs 100,000 bushels in 90 days, they will pay the price or it is sold to someone else. THAT is how grain futures speculators drive up prices. Most of the corn grain goes to animal feed in the U.S.
We could make all our ethanol from stalks and cobs, then use all the grain for feed and food, but DDG is actually healthier for livestock than all the starch. If we used all the cobs and stalks, they would not have to plant the corn for ethanol, but they would not plant it for feed and food, it would drive prices down.
I hear the "speculation" argument pretty frequently but don't quite understand it. Let's see how futures (trading) work. Derivatives (and futures are derivatives are fundamentally different from stocks, bonds and other "real" assets in that for every long position there has to be short position.
On day one there is no corn contract for a given month. When a speculator buys a futures contract the only way s/he can do this if another speculator sells it. The total of longs and shorts is always zero, and so are the profits. One future contract's holder gains are another future contract' losses.
Let's assume the speculator has significant capital and can rent storage for corn and hold it for a while. Although s/he may be driving the price up a bit when it comes time to sell s/he will drive the price down by the same amount.
The only way that I can envision speculation drives up prices is because it increases price volatility which increases the required rate of return of those who actually extract the stuff. This is because the extraction business is an NPV business and the higher the volatility of your expected cashflow the higher your required return will be. That would increase the hurdle for projects the investor would want to invest in. Although real, it is a long, long term effect and not something which is likely to explain day to day / week to week price volatility.
I am open to any suggestions / explanation of mechanism or papers which explore mechanism in which speculation drives up short term prices. Note that you never read about how speculators drive DOWN prices. That asymmetry of reporting should set off an alarm bell or two in the back of your head.
Rgds
WeekendPeak
Corn future speculators amplify volatility. If there is no volatility, they can not make any money, but if there is, their actions increase it...hence they can make even more money due to their actions.
It is the only betting game where the players can effect the outcome. Horse tracks change odds according to the betting, but the roulette wheel does not change its odds if more people bet red than black. Futures are the one place where big players can effect the outcome in their favor, they win you lose.
Calguy, you're welcome to eat frankencorn and frankenwheat. I'm going to work against feeding the world by demanding grass-fed organic beef. And there's no amount of starchless grain pulp they will require thank you very much.
But wait, you want to tell us how to eat and what to plant on ever worsening soil to make things cheap for car drivers by producing biofuel that has barely any EROI? Come on man, I get where all the people are coming from that keep hounding you with questions on your biofuel dreams.
You are very negative. The Department of Energy and Department of Agriculture are working on this and awarding grants, it is not my dream. The DOD is working on bio synthetic fuels for jet fuel, it is not my dream. If you want to criticize people, then you are just negative, but it will not stop progress.
I'm negative in your eyes and you're negative in my eyes. I'm positive too, you may be a bit too. Whatever. I'd rather eat a good beef stock soup and forgo the car.
We're all here to advance our points of view. Synthetic fuel can also be made from coal like the Germans did a lot in the 30s and 40s.
I'm not saying I'm going to save the world, just outlining my personal choices as I feel the ship goes down.
I will say this, and sorry if I repeat myself.
You could also be a bit more modest about any the role biofuels can or will have to 'save' anything here. Sure there will be 'progress'. Somewhere I'm hoping for some technical fixes to the crises I believe we are facing too.
And there are other posters that are more eloquent and knowledgeable so I keep to myself until I feel compelled to add in my own trivial concerns and interests.
And I'm not against feeding the world either. But we could do a better job of it if we realised driving and eating are in many instances conflicting goals.
Flooding the world market with cheap GMO frankefood Corn tends to put the local farmers out of business. That can be very counter productive long term.
Cheap corn and cheap transportation fuel were a factor in those countries growing their populations beyond their local carrying capacities. Cheap food is part of their problem. Population reduction is their solution.
If corn ethanol accounts for 20% to 40% of the price increase, then other factors are dominant.
There are a number of common misnomers in the terminology, so I'll just go through them for the benefit of anybody who is interested.
shale oil is better described as tight oil. Many of the so-called "shale oil" formations are not really shale. The oil produced from the Bakken Formation, for instance, is really produced from the Middle Bakken, which is sandstone and dolomite. The defining characteristic is not that the rock is shale but that the formations have very low porosity, which is to say they are "tight" and don't give up their oil easily. Shale is like that, but so are other rocks.
tar sands are better described as bituminous sands if they are in Canada. Bitumen is different from tar in that bitumen is oil that is too viscous to flow toward a well - it has the consistency of molasses, whereas tar is a man-made substance produced by the destructive distillation of organic material such as coal (coal tar) or wood (pine tar). Bitumen can be persueded to flow toward a well by heating it or diluting it with lighter hydrocarbons, which is what the producers do. But, the quality of oil produced in Venezuela is about the same as Canadian bitumen, even though it flows at the temperature of the Venezuelan oil reservoirs. The Venezuelans call it "extra-heavy oil". Since the oil is essentially no different in quality as far as the oil refinery is concerned, and both Canadian and Venezuelan formations are highly porous sands, the generic term is oil sands. Tar is absolutely useless to an oil refinery, but has other markets.
oil shale is better described as kerogenic marlstone. Kerogen is a waxy substance that is the source of most of the oil in the world. The US has vast amounts of it, but the rock it is in is not shale but marlstone. However, unlike bitumen, kerogen is not oil, it is an oil precursor. It will turn into oil if it is heated under pressure for a sufficiently long period of time - a process called retorting - or through long term geological processes, but until that is done, it won't flow so it has to be mined - unlike bituminous sands, which can either be mined or produced using steam injection. Because "oil shale" has to be mined and has to be retorted, it is much more difficult to produce than oil sands, and at this point in time there are not even any pilot projects in operation. Oil sands are just easier and cheaper to produce.
non-conventional oil is oil produced using techniques that are not conventional, but the definition of conventional varies somewhat. In the US, the production of oil using horizontal drilling and hydraulic fracturing is usually described (at least in the media) as "non-conventional". However, in Canada, horizontal drilling and hydraulic fracturing have been in use for a long time and are more or less routine because the reservoirs are more difficult to produce than the larger and simpler American reservoirs. In Canada, the oil industry is basically a lot more complicated than in the US, so horizontal drilling and fracking would be considered conventional production technology. Canadian companies would have to get into oil sands or tertiary recovery technology before they think of it as non-conventional.
It's not surprising that pundits conflated the term "oil shale." Labeling it "tight oil" might have prevented confusion; or perhaps that's what boosters wanted in the first place; or these terms are simply backed by tradition. At any rate the frenzy of pronouncements of trillions of barrels now unlocked by the producers in the Bakken was predictably depressing.
In re: oil shale in its various forms, Wikipedia says that "Their common feature is low solubility in low-boiling organic solvents and generation of liquid organic products on thermal decomposition." Is all kerogen in the US encased in marlstone, then? I know it occurs in regions outside of the embayments from early Tertiary mid-continent regions, deposits in California, for instance.
I didn't know Canadian production methods were more complex than those employed in the US - which often appear far from simple, heavy oil production in CA or UDW GOM for instance. Is that just the happenstance of geology that makes production more complex? It seems to me that the older US industry would have the luxury of using simpler techniques in its earlier stages simply owing to the lack of any alternative; Canadian production ramped up later and had a larger toolbox at hand, and thus was always less simple. Is that close to the mark?
Well, no, all "oil shale" is not kerogen trapped in marlstone, but most of the vast US deposits are. There is "oil shale" in other parts of the world or even the US which is kerogen trapped in some other kind of rock, even shale, but I don't think that helps the production problems much. It's all difficult to produce and the energy returned on energy invested (EROEI) is always low, which is always a problem.
The geology of the Western Canadian Sedimentary Basin, which has most of the oil in the country is sufficiently complex that for the first half of the 20th century they could have found more oil by drilling completely at random than by paying any attention to the geologists. If they had just thrown darts at a map they could have found more oil. There is no indication of subsurface geology on the surface on the Prairies, so if you drill the absolutely flattest piece of land you can find as far as possible from any oil seeps, and go as deep as you can, there is a really good chance you will hit oil and/or gas. I know of some wells which are producing from five different formations.
Anyhow, after WWII seismic was introduced, and they were able to find oil. They still couldn't see most of the the oil reservoirs because carbonate reefs don't reflect sound waves, but the sound speed and amplitude is different from the surrounding rock. They suffer from "accoustic impedence attenuation" or "positive time structure variations". One company (Imperial Oil), after drilling 133 consecutive dry holes, decided to drill one one of these anomalies to see what the heck was causing it, and found it was caused by a huge oil field. The rest is history and Imperial became very rich. So did many other people.
Just to keep geologists from thinking they knew what they were doing, the biggest oil field in Canada (Pembina) is not in a carbonate reef but in flat sandstone. Several companies drilled right through it without finding it, until some geologist took a hard look at the wireline logs, and realized he had a giant oil field there. They had to frac the discovery well in 1953 to get it to produce, and they probably had to frac every other well, but they have produced nearly 2 billion barrels of oil out of the field (I have a "Pembina: 1 billion barrels of oil" pin from a company I used to work for that was really good at fracking.)
This is conventional oil in Canada. The geology is not nearly as simple as in the US, where most of the big fields were found from surface geology (drill on the top of a hill) or from oil seeps. As far as "non-conventional oil" goes, they tried drilling oil seeps to find the source of the Oil Sands. They hit natural gas, two of the wells blew out and they burned for years. They also found salt, and that was a lucrative industry for a long time. However, they did not find oil. If you are going to produce non-conventional oil in Canada, you really need to do a lot of outside-the-box thinking.
All of this is probably too much information, but I find it fascinating because it has made a lot of otherwise normal and unassuming people rich.
Thank you for the clarification RockyMtnGuy. There is much confusion particularly between kerogen shale, oil shale and tight oil.
The one crucial thing that your definitions doesn't capture are the crucial difference between source and reservoir. This distinction between highlights the different risks in finding conventional reservoir and unconventional resources.
I don't know what to call things, but often shale oil/gas means the source and reservoir are the same, while tight oil/gas means that the hydrocarbons are sourced else where and the tight formation is the reservoir.
How you capture all these important distintions into a definition I am not sure, but you have made a good start.
Thanks as well, very interesting. So the geologists were ready with the usual advice to drill anticlines etc. Not that you need a geologist to tell you that. I wonder what percentage of reserves in each region - and others around the world for that matter - were from formations with surface representation of some kind.
I think most of the really big oil fields in the world are in anticlines, salt domes, and other structures that are easy to find. In western Canada most of the conventional oil is in Devonian reefs which give no surface indication of their existence. Geologists had to wait for the introduction of siesmic before they could find them.
Even at that, they had completely missed the Devonian reef trend and had no idea that the Prairies had once been a shallow inland sea - there were hundreds of relatively small reefs rather than a few big anticlines.
Just to confuse matters as much as possible, the first oil discovery in western Canada was in pre-Cambrian rock, if you can imagine. Normally, that would be the last place to look, but in that case, the pre-Cambrian formation had been overthrust over a younger source rock when the Rocky Mountains were formed. That threw several generations of geologists off track and had them looking for oil in all the wrong places..
Canadian production statistics are not completely comparable to US ones, and the differences are not limited to the fact that Canadian production is measured in cubic metres (note Canadian spelling) and gigajoules (GJ) rather than barrels and cubic feet or BTU's. The fact is that the Canadian industry is much more complicated than in the US. Either that or the US government doesn't know what is going on in its oil industry, which I would also believe.
What typically happens in Canada is that gas wells produce natural gas, condensate (natural gas liquids), and water. There will be a three-phase separator at the wellhead to separate the three. The company will take a gas and liquids analysis at least twice a year that separates this into individual components, from methane to pentanes plus (pentane, hexane, heptane, octane, etc.) The water then will be flowlined or trucked to a water disposal system to be injected into deep formations (in the US they might just spray it on the ground).
The natural gas and condensate will typically be recombined and flowlined to a gas plant (rather than having two flowlines). The three-phase inlet separators at the gas plant will separate it into gas, liquids, and water again, but the key thing to know is that in the flowlines, some gas components will go into the liquid phase and some liquid components will go into the gas phase. The plant will take gas and liquids analyses at the inlets - often minute by minute using on-line chromatographs, and these will be completely different from what is at the wellhead.
The plant will then fractionate the gas and liquids into propane, n-butane, isobutane, and pentanes plus. The propane, n-butane, and isobutane will be stored in tanks under high pressure, or in the case of pentanes plus (pentane, hexane, heptane, octane, etc) which are liquids at atmospheric pressure and temperature, not so much pressure. The remaining components (methane and ethane) will be deemed to be natural gas and flowlined to customers. However, if the plant is a deep cut unit, they will fractionate off the ethane using cryogenic processes and sell it to the petrochemical industry. In that case the customers will get pure methane.
The bottom line is that what StatsCan calls "pentanes plus" is pentane, hexane, heptane, octane, etc that the gas plant sells to oil refineries because - well, it's basically straight semi-refined gasoline. How it corresponds to what the US government calls "condensate" is anybody's guess. And what they call "natural gas liquids" (NGL) is just a whole different world.
RMG - tks for 2 instructive posts. I think I will continue to call the tar sands, tar sands. But it is probably a good idea to use "tight oil" with added advantage of not confusing with oil shale.
Stat Can report M3/month - which is fairly straight forward to convert to bbls / day. More tricky converting from mass to volume. Agree that NGLs are a world of complexity and I guess lack uniformity of reporting standard around the world.
Well, it is fairly easy to convert Canadian crude oil statistics (cubic metres) to American terms (barrels). There is a small difference because the base temperature is 15°C in Canada and 60°F in the US, but that is minor. Probably the biggest difference is that Canadian statistics track ethane, propane, and butane separately from pentanes plus - the latter being added into "light oil" and the former accounted for separately. In the US, they would all be "NGL".
"Bitumen" is something of an arbitrary term in Canada, because if heavy oil is produced in a designated oil sands area, they will deem it to be bitumen. The main distinction is between "bitumen", "heavy" oil, and "non-heavy" or "light" oil, the latter being light and medium oil in US terms. And the benchmark crude oil, "Western Canadian Select", is a blend of bitumen, heavy oil, synthetic crude oil, conventional oil, condensate and pentanes plus. The objective is to achieve a consistent chemical analysis, not track the source of the oil.
The US seems to be about one to 3 months away from passing Saudi Arabia in Total Liquids oil supply. The US seems to be about one year from passing Russia on Crude oil and Natural gas liquids supply.
The US is almost overtaking Russia for #2 in crude oil, natural gas liquids, ethanol and other liquids.
US daily crude oil production added 35,000 barrels per day and natural gas liquids and renewable fuel added 99,000 barrels per day in the most recently reported week. Crude oil production is at the highest level in 18 years. Crude oil production is up nearly 1 million bpd since the same time last year
http://nextbigfuture.com/2012/12/us-all-liquids-oil-production-increased...
Crude oil,Natural Gas and Other Liquids for the US for the days in the Week ending Dec 7 was 10.22 million barrels
The EIA has information comparing oil production by different countries.
Total Oil supply for the US for the days in the Week ending Dec 7 was 11.33 million barrels
The US is getting very close to Saudi Arabia in total oil supplied (which includes crude oil, natural gas liquids, ethanol and other liquids and refinery processing gains.
Something else that could help enable faster drill baby drill.
http://nextbigfuture.com/2012/12/laser-enhanced-drilling-will-speed.html
This drilling technology is more suited to penetrating igneous rocks and thus better for geothermal energy as opposed to oil and gas. The heat from (in this case) a laser causes the rock to thermally expand, increasing stress that induces microfracture growth, and finally spalls (small rock chips) are ejected from the heated rock (the physical mechanism is called spallation). This works well with igneous rocks that are composed of a rigid matrix.
However, oil and gas that is (essentially only) found in sedimentary rocks, so this won't work as well. This is because the interstitial material between the rock grains is (relatively) soft and the rocks inherently have more porosity than igneous rocks, thus the thermal expansion of the grains is 'absorbed' by the surrounding rock matrix and fracture growth will not necessarily occur.
If this laser drill is combined with a rotary drill bit, it's penetration rate might increase because the rock is softening/fractured by the heat source, but it comes back to the issue of ROI (both energy and money). The technology is still pretty experimental, so it's still a huge challenge to say this can be done in a 10,000+ ft hole. Some major obstacles include delivering power to the laser downhole (no easy task) and knowing the stand-off distance of the bit from the bottom of the hole. There's also the issue that that any advantage that may be gained can be eliminated pretty quick if for some reason the electrical equipment gets fried by the heat or borehole fluids.
C+C for Aug:
USA 6,146.677
Russia 9,907.000
KSA 10,040.000
Is any progress being made on exploiting tight oil basins outside of North America? To date all this drilling hasn't tamped down prices in any recognizable fashion, outside of stranded markets in the drilling regions themselves.
Thanks for the informed reply, Hillson.
What exactly is wrong with advanced nano?
A nice top level post clearly describes how USA conventional crude oil continues to slide despite price increases, yet he throws some foo into the mix by generating a bunch of word salad links.
Are you capable of doing decline analysis?
Given that the energy content of the specific liquids mentioned in the graphs is different and considering that the liquid mix has been varying significantly over time, does anyone have any idea about the evolution of the net energy liquid fuel production in North America.
JB
Good post. I would not be surprised to see N.American energy-independence by 2025. My real concern is that the industrializing world will be demanding vastly more oil over the next few decades. Some estimates say world oil demand will hit 110M-120M b/d by 2040. After studying oil for almost 10 years, I just don't see how we can deliver 120M b/d of affordable oil.
On the two major energy fronts moving forward, I'm very optimistic about electricity but quite pessimistic about oil. I know that markets adjust to whatever is affordable. This probably means that much of what today is oil-powered will fairly quickly become NG- and EV-powered. Sasol just announced the largest foreign infrastructure investment in U.S. history -- a $30B natural-gas-to-oil conversion plant that will do 100k b/d. Sasol is forecasting, as I am, that oil will get increasingly expensive, as U.S. NG remains relatively affordable.
I think we'll see installed small PV for less than $1.00/DCW by 2030 ($0.035/kwh median U.S. raw cost), and certainly no later than 2040. I think this trend towards cheaper electricity will signal vastly greater investment into storage and EV mobility research, which will help offset much of forecasted vehicle oil demand growth over the next few decades. The "market" can't magically make cheap oil, but it can trigger massive structural adjustments.