| Tech Talk - Iranian Oil and the Global Future | The Oil Drum | Will U.S. Oil Consumption Continue to Decline? |
Oil Watch - Global Liquid Fuel Production Trends (EIA data)
Posted by Euan Mearns on December 10, 2012 - 12:40pm
Executive Summary
Monthly oil production data reported by the US Energy Information Agency (EIA) offers several advantages over the equivalent data published by the International Energy Agency (IEA). First and foremost, the EIA report natural gas liquids separately enabling a more in depth analysis of underlying crude oil and condensate (C+C) production, they report data for a larger number of countries and make data available to download as XL spread sheets.
Asian oil production (C+C+NGL) has been on a plateau of 8 million bpd for over a decade. FSU oil production has been on a plateau of just over 13 million bpd for 3 years. African oil production has been on a plateau of 10 million bpd for 6 years and S American oil production has been on a plateau of 7 million bpd for over a decade. That is 38 million bpd of global production, or just under half, that has been static for many years.
European oil production (C+C+NGL), centered in the North Sea is in steep decline, down from a plateau of 7 million bpd a decade ago to 3.2 million bpd in August 2012.
The loss of European production has been compensated by rising production in N America and the Middle East. Rising production in N America comes mainly from unconventional oil - shale oil and tar sands.
Deducting N American shale oil and Canadian tar sands production from global C+C shows that the latter has been on a plateau of just over 73 million bpd since May 2005 with a near-term peak of 73.3 million bpd in April 2012. All of the growth in global total liquid fuel supply since May 2005 has come from natural gas liquids (NGL), unconventional oil, refinery processing gains and from biofuels.
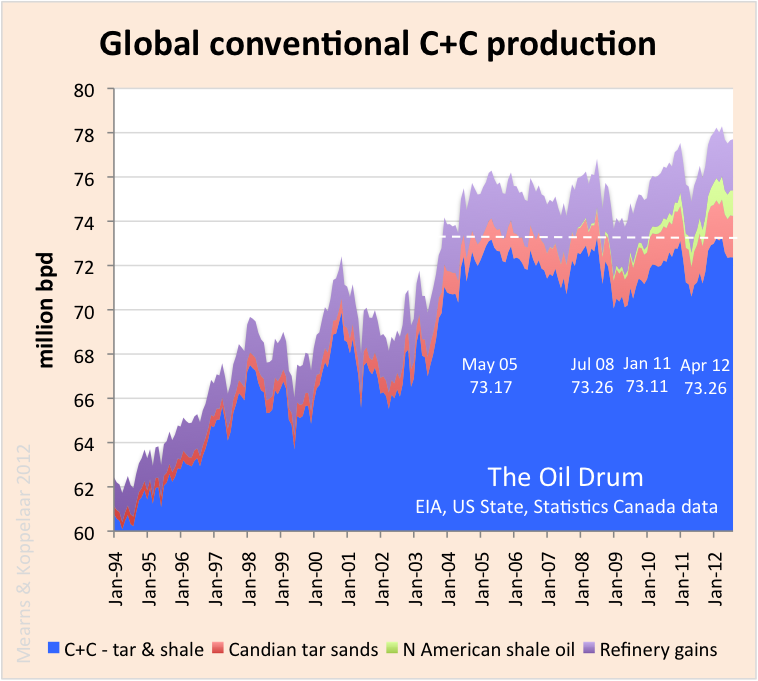
Figure 1 Global C+C less tar sands and shale oil (US Bakken, US Eagle Ford and Canadian Bakken) has been on a bumpy plateau of just over 73 million bpd since May 2005. In May 2005 Iraqi production was just recovering from conflict and has since come back strongly. Currently Sudan is offline, Syria is all but off line and Iran is being squeezed out of the market by sanctions. The ups and downs reflect masterly control of supply by OPEC. Data sources: Energy Information Agency, National Energy Board Canada, Statistics Canada, North Dakota Drilling and Production Statistics, Railroad Commission of Texas. The chart includes a 150,000 bpd assumption for Canadian Bakken 2011/12.
This is the fifth installment of our tour of global oil production statistics, this time based mainly on EIA data, co-authored with Rembrandt Koppelaar. In this report we begin with a look at the make up of global total liquids production and then go on to look at individual continents / regions. Subsequent posts will look at the regional picture in greater detail.
Global total liquids production

Figure 2 EIA data, combined with other sources, shows a steady rise in World total liquids production from 67.7 million bpd in January 1994 to 88.5 million bpd in August 2012. As detailed in Figure 1, conventional crude oil + condensate production has been static since May 2005, thus most of the liquids growth since then has come from NGL, non-conventional oil and other sources (See Figure 4).
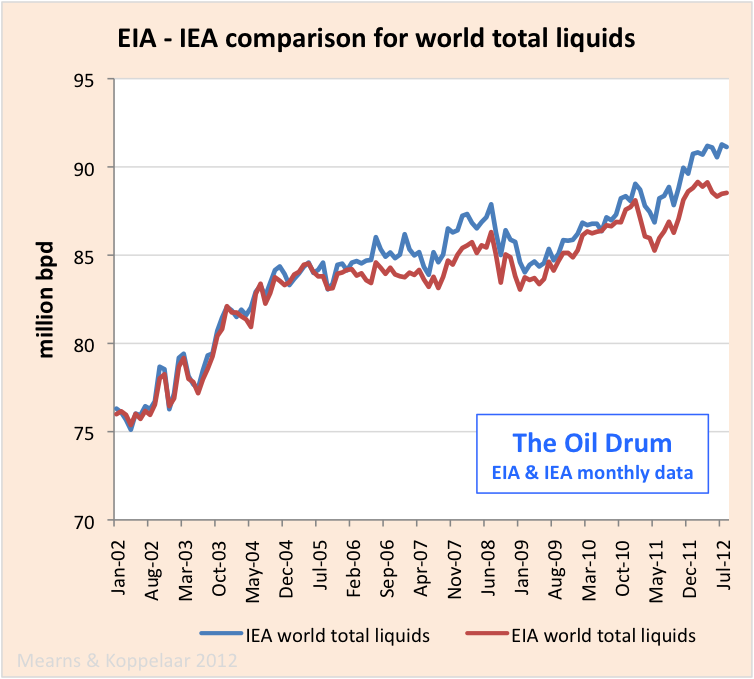
Figure 3 Comparing the EIA total liquids data with the equivalent data reported by the IEA shows that there was good agreement between the two data sets up to 2005 but since then the data have diverged somewhat. The IEA estimate 91.1 million bpd for August 2012 whilst the EIA estimate 88.5 million bpd. The difference of 2.6 million bpd (2.9%) is material and requires an explanation.

Figure 4 Natural gas liquids, refinery gains, Canadian tar sands, N American shale oil and biofuels have grown from 6.9 million bpd in January 1994 to 16.2 million bpd in August 2012. Note that the EIA have not yet reported 2012 biofuels data and so data from 2011 have been substituted in 2012. Similarly, my source for Canadian Bakken ends in 2010 and values for 2011/12 have been assumed. NGL is used mainly as petrochemicals feedstock (ethane) and for home heating and cooking (propane and butane).
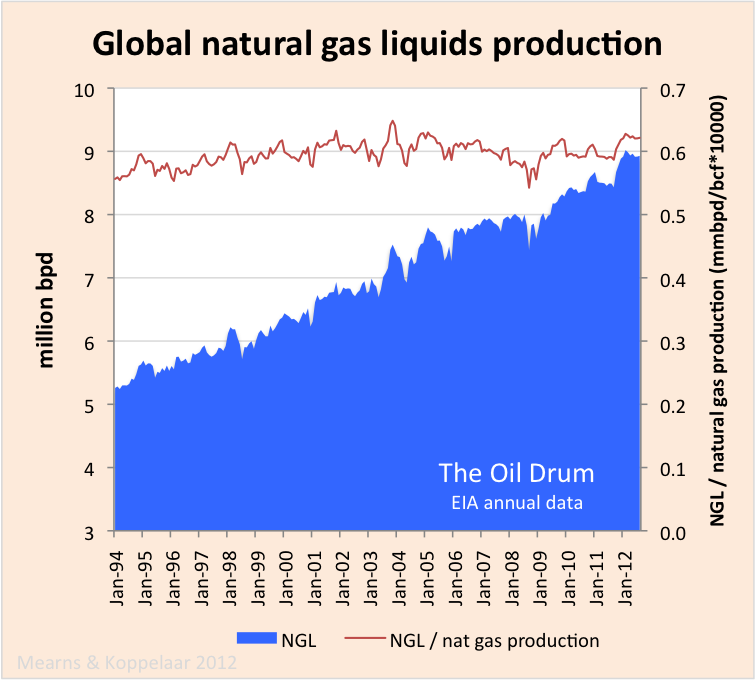
Figure 5 A simple volumetric ratio of million bpd NGL / bcf nat gas *10,000 (right hand scale) shows that the linear growth in global NGL production mirrors growth in global natural gas production. For so long as natural gas production continues to rise, so it can be reasonably expected that NGL production will continue to rise with it.
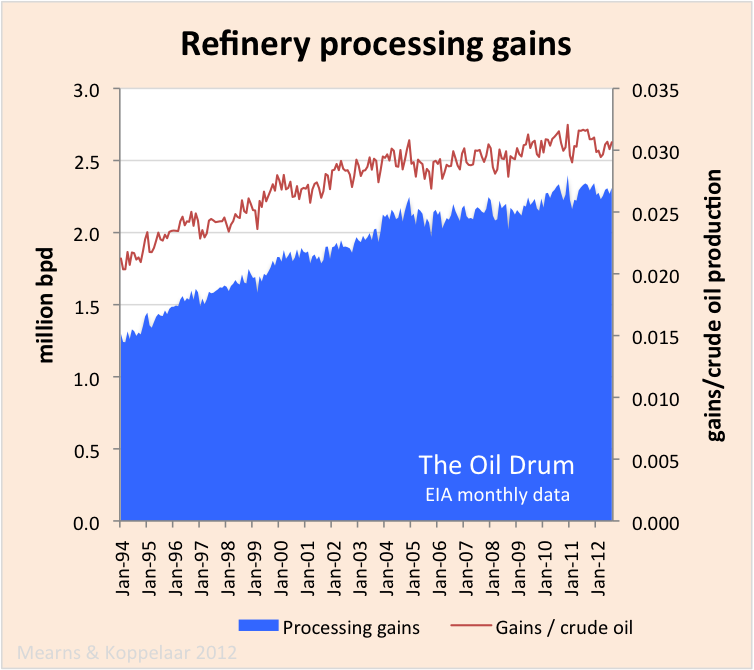
Figure 6 Processing gains have also grown with global oil production and higher volumes of oil refined but the relationship is not linear. Processing gains are increasing more rapidly than crude oil production as a result of a steady shift towards heavier and heavier grades of oil. When quoting oil production on a volumetric basis, processing gains are a valid component of the equation that tends to normalise for varying densities of crude oil.
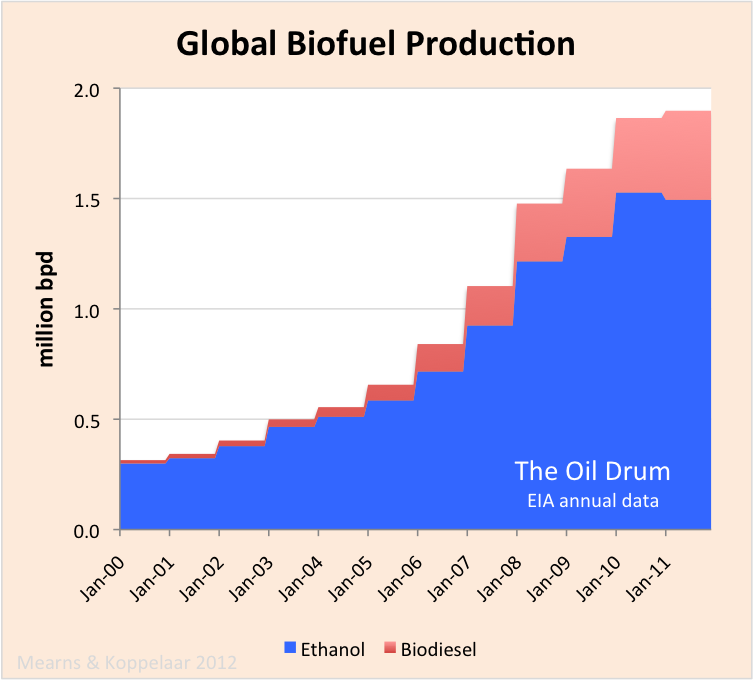
Figure 7 The EIA do not report monthly data for biofuels and the last report was for annual production in 2011. They do however provide a useful breakdown between bio ethanol and bio diesel. The data suggest that bio fuel production has stalled between 2010 and 2011 with a small decrease in bio ethanol compensated by a small increase in bio diesel. The IEA data also showed biofuel production stalling in the 3 year period 2010 to 2012.
Regional trends
In these regional compilations C+C+NGL production has been aggregated making the EIA data comparable with IEA and BP data. In future reports on the countries from each region we will disaggregate C+C from NGL in order to provide a more detailed picture.
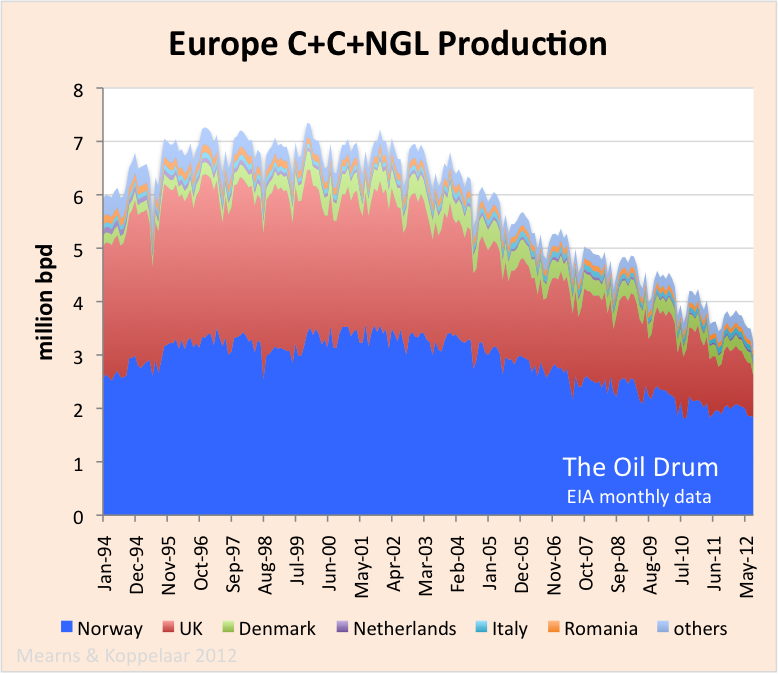
Figure 8 European oil production is in steep decline. This is the only world region / continent to show such significant decline and the question needs to be asked to what extent growing energy import bills are underpinning the economic malaise. The key reason for this decline is the dominant offshore nature of European oil and it remains to be seen if other offshore provinces, such as Brazil, Angola and Azerbaijan, experience the same demise.
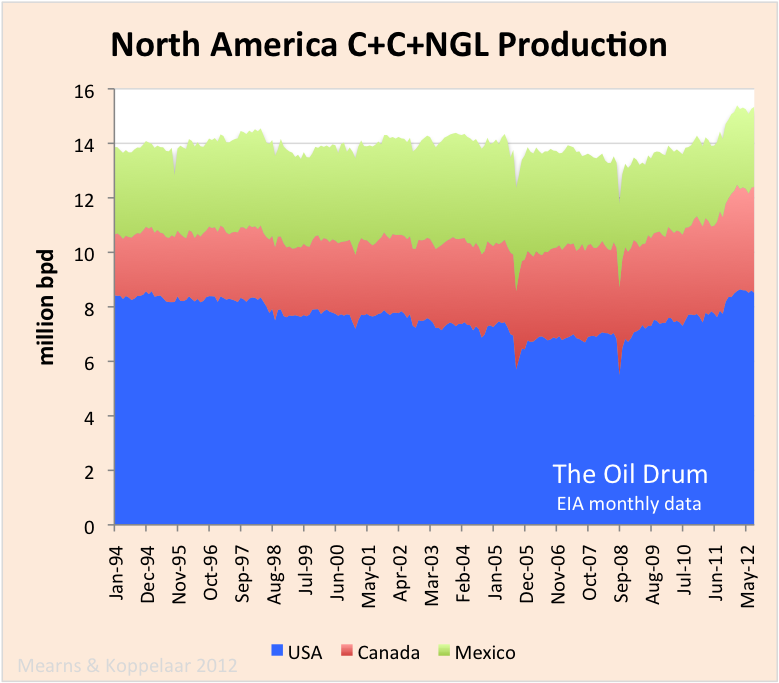
Figure 9 North American oil production is the global success story, starting to rise once again after more than a decade on a 14 million bpd plateau. Much of this growth comes from unconventional tar sands and shale oil production that will be looked into more closely in a future report.

Figure 10 Middle East oil production shows a punctuated rise from 19.8 million bpd in January 1994 to 27.0 million bpd in August 2012. The punctuations reflect OPEC control of supply to match demand and loss of production during regional conflicts etc. The EIA no longer publish statistics on OPEC spare capacity hence we must rely upon the IEA for this vital data that is discussed here. Much of the rise in OPEC production took place in the period to 2005, since then production has been on a plateau and inability (or unwillingness) of ME OPEC to raise production further has underpinned the raising of the oil price to a new norm >$100 bbl (Brent spot). Note how Iran is currently being squeezed from the market.

Figure 11 FSU production, recovering from the turmoil associated with collapse, grew strongly until 2005 when the rate of growth stalled. This is one of the major factors in triggering the run in oil prices with demand growth running ahead of supply growth since 2005. Russian production is still growing slowly but Azerbaijan is now in a phase of slow decline. FSU production has been on a plateau of 13.3 million bpd for three years.
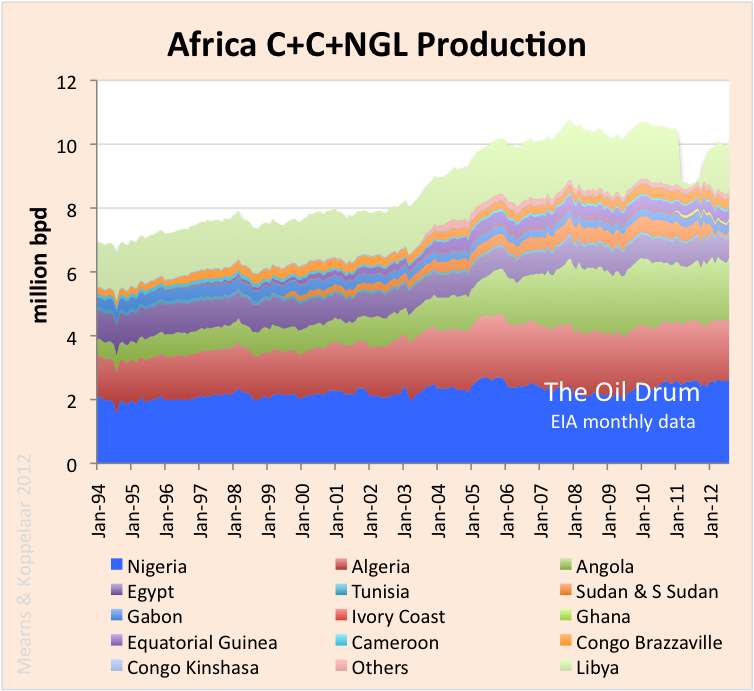
Figure 12 African oil production rose steadily from January 1994 until 2006 at which point it has stalled at close to 10 million bpd. With a large amount of exploration and development activity ongoing around the coast of the continent and along the East African Rift Valley, it is somewhat surprising to see that production growth has stalled. Part of the story is the Arab Spring with Sudan still off line and Libya newly back on but not yet up to pre-revolution levels. But the story is more complex than that which will be examined in detail in a future report.
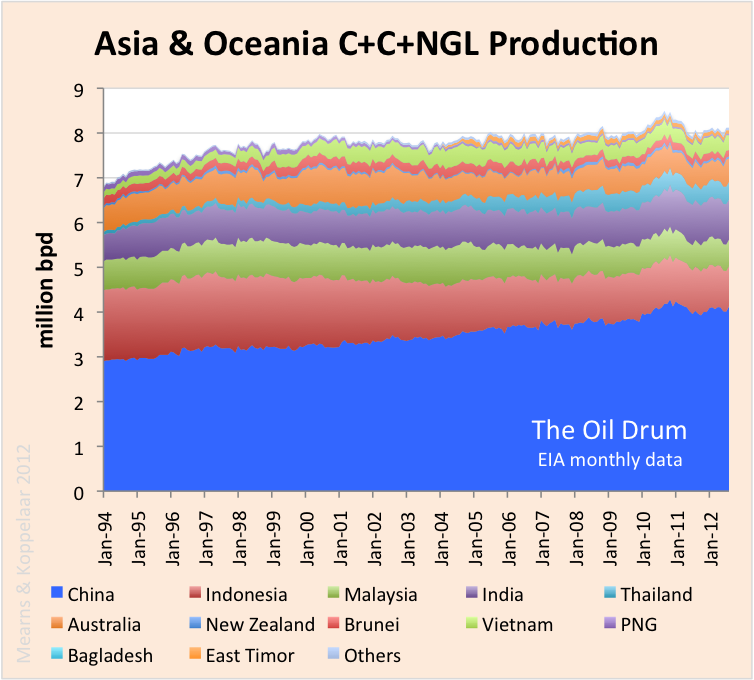
Figure 13 Oil production in Asia / Oceania is dominated by 6 producers - China, Indonesia, Malaysia, India, Thailand and Australia. Production has been more or less flat at 8 million bpd since 2000 with declines in countries like Indonesia and Malaysia compensated by growing production in China. Notably, the EIA data confirm the observation made from IEA data on China where production hit a near term peak of 4.2 million bpd in September 2010 and has since drifted side ways and down. This trend will be something to watch in the months ahead.
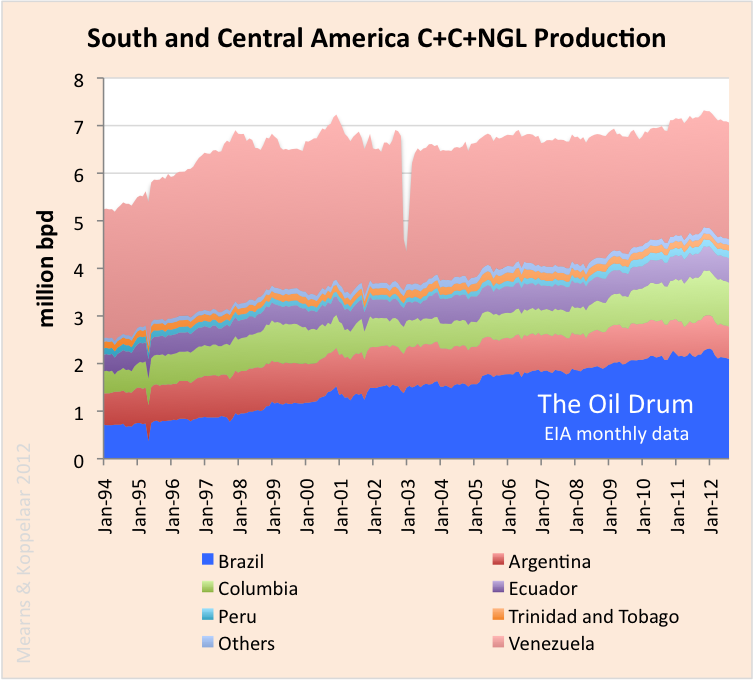
Figure 14 Production in South and Central America is dominated by Venezuela and Brazil. Note the impact of the 2003 national strike on Venezuelan production. Brazilian production has risen steadily since 1994 but is currently coming down off a near term peak of 2.3 million bpd hit in January 2012. With production centred off shore, Brazil can look forward to the same demise as the North Sea once they run out of new giant fields to develop. South and Central American production hit a peak of 7.2 million bpd in December 2000. Since then it has drifted sideways but hit a new near term peak of 7.3 million bpd in November 2011.
Earlier reports
Oil Watch Monthly
Oil Watch - World Total Liquids Production
Oil Watch - OPEC Crude Oil Production (IEA)
Oil Watch - OECD Oil Production (IEA)
Oil Watch - Rest of World Oil Production (IEA)
Contact
- Content: editors at theoildrum dot com
- Tech support: support at theoildrum dot com
License

This work is licensed under a Creative Commons Attribution-Share Alike 3.0 United States License.
European oil production is in steep decline. This is the only world region / continent to show such significant decline and the question needs to be asked
to what extent growing energy import bills are underpinning the economic malaise.
A couple months ago i tried to roughly approximate the EU fossil fuel bill using price data available from the BP review and the French Commissariat Général au Développement Durable and ignoring complications like refined product cost. Units are 109$/TOE:
Yet a visit to the Eurostat website shows that both current account and trade balances for the EU are doing fine. And the Union should still be a substantial net exporter of renewable energy equipment.
Even without being a professional bone reader, it is safe to say that the fossil energy bills are a much larger drag on many poorer nations than on the EU. But most of them have done relatively well since Lehman, yet another hint at these pesky general electric financial services.
I would even argue that we get a pretty good return on payment in terms of added stability/development and relationship/commerce improvement with some of our neighbours, compared to what the history books say. Syria's isolationist stance for instance did hurt them quite a bit in the current process, even if we used to get a wee bit of crude from them.
Serge
Can someone please explain what NGL means? Can natural gas be converted to gasoline, diesel and kerosene?
NGL = Natural Gas Liquids, ethane, propane, butane
Natural gas can be synthesized into liquid hydrocarbon fuels, but it's a very capital and energy intensive process:
http://en.wikipedia.org/wiki/Gas_to_liquids
Thanks. So in other words NGL does not give us transportation fuel.
How is NGL different from LNG (Liquefied Natural Gas) and LPG (Liquified Petroleum Gas)?
LNG is very cold natural gas, primarily methane.
I believe that LPG generally refers to propane and butane, which can pretty easily used as transportation fuels (with a new fuel tank and some engine modifications), but of course, the energy content per gallon is less than gasoline, and one has to have access to refueling options.
Fossil fuels can be thought of as a continuum, from gas to liquid to solid (also from cleanest to dirtiest):
Methane==NGL's==Condensate==Light (generally sweet) Crude==Heavy (generally sour) Crude==Bitumen==Various Grades of Coal
If liquid transportation fuels (LTF's) are what you want, we get the most bang for the buck from light, sweet crude. We can get LTF's from the gas and solid endpoints, but it takes more money and energy. But at the end of the day, depletion is a one way street.
Thanks. But aren't propane, butane, etc gases? In that case should the NGL component be included in total liquid fuels?
Propane (like methane) can be, and is, used as a transportation fuel.
More importantly, NGLs can substitute for oil as a petrochemical feedstock.
I am confused. According to Wiki ethane is not a liquid, at least at room temp. Butane and propane can also exist as a gas or a liquid??
"Ethane is a chemical compound with chemical formula C2H6. At standard temperature and pressure, ethane is a colorless, odorless gas. Ethane is isolated on an industrial scale from natural gas, and as a byproduct of petroleum refining. Its chief use is as petrochemical feedstock for ethylene production."
Butane, ethane and propane are all gasses at room temperature and pressure, but are very easy to compress back to liquids for transport and use. Think of a butane lighter; the tiny amount of pressure is enough to keep it in liquid form. The boiling point of butane is 1 degree C. Propane is closer to methane, it boils at -42 degrees C, so greater compression is needed to keep it in liquid form at room temperature (think of a barbecue canister). By contrast, methane (pure natural gas) boils at -164 degrees C; liquefying natural gas requires enormous pressure and refrigeration. Propane is a common liquid transport fuel. When natural gas is used to power cars, it can only be compressed but not liquefied, making it much more bulky and much less practical as a transport fuel.
Natural Gas Liquids = butane, propane, ethane; gasses which can be easily compressed and used as liquids.
Liquefied Natural Gas = methane that has been compressed and chilled into a liquid so it can be transported on ships (instead of in pipelines).
Ethane boils at -89°C so describing it as a "liquid" is a bit of a stretch. It cannot be stored in non cryogenic pressurized canisters as a liquid like propane or butane. It is normally a component of natural gas, comprising 1 to 6% of it, but since it can be used to make plastics like polyethylene, it is often separated using cryogenic cooling and sold to the petrochemical industry.
I used to work for companies that made a great deal of money extracting ethane from natural gas. They operated what are known as "straddle plants" because they "straddle" the natural gas transmission lines and separate the ethane from the methane. They bought it as natural gas and sold it at a higher price as petrochemical feedstock.
However, I have a lot of difficulty thinking of ethane as a liquid, never mind a form of oil. It is not easy to liquefy.
Propane and butane are usually compressed until they condense into a liquid for distribution. They are used for transportation fuel, heating, cooking, running generators, refrigeration and making petrochemicals.
Butane & Ethane is added to petrol in small percentages 2~3% especialy in winter grade fuel to raise the octane rating . It does not boil off due to the "law of partial pressures"(see wiki). To much or oo high a temp will cause fuel vaporisation problems and hot start issues.
The key strategic data is the net amount of energy produced out of all these combined liquids.
Hence a production analysis to be really useful needs to take into account:
1) the EROEI of the oil (liquids) extracted from various reserves around the planet;
2) the specific energy content for each type of liquid extracted.
JB
P.S: It is urgent that someone from The Oil Drum attempts to get to the bottom of global net energy production because despite apparently increasing volumes we might find that the net energy produced is in fact declining...
LFROLFI (liquid fuel return on liquid fuel invested) is far more important.
Energy isn't in short supply (especially in the US and Canada, which have abundant and cheap coal, NG and electricity from many sources) - liquid fuel is.
LFROLFI (liquid fuel return on liquid fuel invested) is indeed a key issue.
However that "liquid" is not homogeneous... Oil does not have the same energy content as NGL or other "liquids". So what is the evolution of the energy content of the "liquid mix" that we getting to power our machines?
In addition, one must understand that oil and gas production is today largely subsidized (in particular in the US) by highly positive EROEI coming from other forms of energy sources and mainly coal.
Hence, it is critical to have a global picture concerning the evolution of the net energy generated from all forms of energy sources currently powering complex human civilization to know where we are really heading. That country by country data is also highly strategic to determine who is "winning" and who is "on the path to oblivion"...
JB
oil and gas production is today largely subsidized (in particular in the US) by highly positive EROEI coming from other forms of energy sources and mainly coal.
"Highly positive EROEI" is a bit of an illusion. The difference between legacy oil at 100:1 and modern natural gas at 20:1 is the difference between 99% net energy and 95% net energy. IOW, really not much.
It's similar to MPG - the upside down ratio is very misleading. Which is better: moving from 10MPG to 20MPG, or from 50MPG to 100MPG? Well, the first goes from .10 gallons per mile to .05 gallons per mile, while the 2nd moves from .02 gallons to .01 gallons. So, the first alternative saves 5x as much fuel!
There is a huge difference between the equations describing EROEI and MPG, but it is masked as long as EROEI is high enough.
The difference in doubling gas mileage is always a factor of two in fuel use on a given trip, but any fuel embodied in production goes inversely as EROEI-1. If the trip uses 100 gallons of 100:1 EROEI fuel then 101 gallons worth was ultimately consumed; that becomes 102 gallons for 50:1 EROEI fuel, 110 gallons for 10:1, 150 gallons for 2:1, 1100 gallons at 1.1:1, ...
The same behaviour occurs in electricity generation; the 8 per cent increase in heat rejected when thermodynamic efficiency drops form 33% to 25% means a whopping 25% increase in fuel usage for a given *electrical* output. The cliff becomes severe around 30% (which is why nuclear plants tend to use cooling towers to get that extra couple percent in thermal efficiency).
And, we can see that the difference between 100:1 EROEI and 20:1 is pretty trivial: 101 gallons vs 105 gallons (assuming inputs are also liquid, which will only be partially true). As we drop below 10:1, then the change starts to be significant.
100:1 and 20:1 sound very different, and so we see discussions in which people suggest that the change from 100:1 to 20:1 would make a significant difference - and it wouldn't.
The only problem is that the EROEI of most of the newly found oil reserves is below 10/1 (ultra-deepwater, shale oil, tar sand oil, etc.) and sometimes a lot closer to 1/1 (or below) than 10/1 , in particular if you consider EROEI at the point of usage instead of EROEI at the well head...
At that level you really hit the low EROEI "energy cliff"...
JB
Do we have any good analysis of the EROEI of ultra-deepwater, shale oil, tar sand oil, etc.?
Charles Hall has supervised a comprehensive set of related EROEI analysis in:
http://www.esf.edu/efb/hall/New_Studies_EROI_final4.pdf
JB
Nicely chosen array of charts
I just want to say thank you for this series, great work. It's really good to have the data all aggregated like this. Signal, noise, etc.
Especially as it helps us see a couple of trends so clearly, Europe's decline and North America's Tight and Tar rise. But also the perhaps somewhat surprising and encouraging 'demand destruction' in the US + Europe, and the consistent decline in driving across the OECD.
So it looks like life on this precarious plateau is likely to last longer than previously thought, which means, in theory, more time to transition [?], but also, ever more carbon in the atmosphere and the seas, and deeper delusion for those who are determined to never change....
I'm just getting the data together to look at demand / consumption patterns. "Demand destruction" has two courses. One is the virtuous course of improved energy efficiency and the other is exclusion from energy use owing to high price. At the "start", N America was much less efficient than Europe in motor transportation and therefore has much more lee way to improve efficiency. Europe is currently stuck between a rock and a very hard place.
But Europe is much further along the track of providing reasonable quality public transport and also encouraging the most fuel-efficient cars; high fuel tax also discourages consumption in Europe. The net result is per-capita oil use in Europe is significantly lower than in the US.
Yep, but does that produce higher GDP and the tax revenues to pay for healthcare and well fare and education?
It's always more efficient economically to price things properly - that way, markets can allocate things to their highest value.
I think $7 per gallon for fuel is about right, given the external costs of oil - security/military costs, pollution, climate change, etc.
The US may pay less at the pump, but what about that $2T Iraq war?? Think of the engineering talent being wasted on weapons!
Euan, it would be nice if you could place a faint line into all of your charts showing the CO2 levels in the atmosphere. IOW, the results of the FFs' combustion.
I could do and may do, but what it will show, zero scaled, on the timescale I'm plotting, is a flat line.
Not true, unfortunately -- CO2 levels went up about 10% in the timescale you're plotting (1994-2012).
Euan,
As best I can tell, Europe's main problem is truck freight. I'd be very curious for analysis of this - is it lower taxes for commercial users of diesel? A fragmented rail system?
Don't know, but there is a lot of detailed data to look at.
The following chart shows production (total petroleum liquids, BP + Minor EIA data) from the top 33 net exporters in 2005 on the top line, from 2002 to 2011. The dark red colored interval is top 33 consumption (total liquids). The next line is Global Net Exports (GNE). The light red colored interval is Chindia's Net Imports (CNI). The next line is what I call Available Net Exports (ANE).
The following chart shows the ratio of GNE to CNI from 2002 to 2011. An extrapolation of the 2005 to 2011 rate of decline in the ratio is shown.
In 2005, there were 33 major net exporters (net exports of 100,000 bpd or more), a handful of minor net exporters, and about 155 net oil importing countries. Extrapolating the six year rate of decline in the GNE to CNI ratio suggests that two of these 155 net oil importing countries, China and India, are on track to consume 100% of Global Net Exports of oil in only 18 years--theoretically leaving zero available net exports for about 153 net oil importing countries.
But soon the US is going to join those 'major net exporters' and save everybody's a$$!
Now, seriously, these charts are nice, crisp, clear, concise. The most accessible ones since your very first simple ELM chart! Thanks.
Courtesy of a helpful Oil Drummer, who is working on several new slides.
Summary to a draft of a paper on the ECI Ratio (ratio of total petroleum liquids to liquids consumption in oil exporting countries):
Of course price must by included assumptions about Chindia demand. How many trillion in US securities are held in China? They won't be worth much if the US doesn't get enough oil to keep its economy fueled...
...a bit of a juggling act on a few intricately entwined tight ropes could be in store for the major players...but the players really look to marionettes...and they seem to be controlled by even more marionettes. Fun visual...but maybe not all that far from the mark.
Of course, it's a historical chart (through 2011 for the Saudi & global data). The $64 trillion question is what will the next few years of data look like.
I am going to do a similar chart showing estimated remaining post-2005 CNE for GNE, for Saudi net exports and for ANE--versus the actual historical remaining post-1995 CNE data for the Six Country case history.
Chinese oil consumption is probably about to peak. Year to Date, consumption is probably less than 3% higher than 2011. (September and Octob June to August, Chinese demand dropped .3% from the 3 month period the year before, while September and October showed 6.6% growth YoY, so things are still unclear).
The Chinese economy is heavily dependent on capital spending - more than 50% of their GDP - that will have to change, and the transition is unlikely to go well. Japan went through a similar transition: the result was the current 20 year stagnation, and it could have been a much worse crash.
Capex demands much more on commodity inputs like oil, iron and concrete than does consumer spending. There's a pretty good chance that Chinese oil consumption growth will stop pretty soon.
http://www.mpettis.com/2012/09/16/by-2015-hard-commodity-prices-will-hav...
Really ? With 18 million new vehicles (mostly ICE) being put on the road every year ? No way.
That is significant, but the question is how large it is compared to Industrial/Commercial fuel consumption related to capital investments? Anyone seen good breakdowns of Chinese fuel consumption??
Fortunately, Chinese fuel efficiency standards for new vehicles are much higher than the existing US fleet: about twice as high (42.2 MPG for 2015, vs about 21 MPG for the existing US fleet). Anyone seen info on the Chinese testing cycle?
I thought I saw an article on Chinese average travel per vehicle (VMT) on Stuart Saniford's blog, but a quick search didn't find it - I seem to remember Chinese VMT was quite low.
If we assume 40MPG, 10k miles per year (in between US and Europe), and 2M per year in scrappage, we get an increase in fuel consumption of about 260k bpd, per year. That's about what we're seeing right now, which suggests that I/C demand growth is zero.
------------------------------
It's interesting to note that if we include two wheelers, there are more EVs sold in China than gas vehicles. The EV installed base is up to 200M now...
http://www.flickr.com/photos/jurvetson/4503260722/#comment72157630081967672
No doubt the higher fuel economy standards will be a help
but maybe you should peak at this couple year old blogspot post
it has several informative charts on the growth of China's motorized transport--unfortunately the end around 2007. But they are worth a look.
18 million cars now being added to Chinese roads a year nearly matches the total added during that explosive growth period between 2000-2007.
I am not too sanguine that There's a pretty good chance that Chinese oil consumption growth will stop pretty soon.
Maybe westexas would be kind enough to put the annul barrels of oil per capita by country comparison again. It is sobering.
Sure, I've read Stuart's post.
Did you read Michael Pettis' post, that I linked to? Let's compare quotes:
Stuart:
"Admittedly it's hard to see such astronomical growth rates continuing for long. Maybe they won't. But then, it's hard to imagine them having continued for the last 25 years, and apparently they did. If you'd said in 2000 that growth was slowing down and certain to slow down more, you'd have been wrong. And they'd still be a long way from US per capita car ownership at that level, since the population is four times larger.
The world has never seen anything like this Chinese industrial machine."
And Pettis:
"The consensus on expected economic growth among Chinese and foreign economist living in China has already declined sharply in the past few years. From 8-10% just two years ago, the consensus for average growth rates in China over the next decade has dropped to 5-7%. But the historical precedents suggest we should be wary even of these lower estimates. Throughout the last 100 years countries that have enjoyed investment-driven growth miracles have always had much more difficult adjustments than even the greatest skeptics had predicted.
After all, there were many Brazilians in the late 1970s who worried that Brazil’s growth miracle was unsustainable and would end badly, but none expected negative growth for a decade, which is what happened during the terrible Lost Decade of the 1980s. Towards the end of the 1980s, to take another example, a few brave skeptics proclaimed that the Japanese miracle was dead and predicted that for the next five or ten years average Japanese growth rates would slow to 3 or 4% (in 1994 the IMF belatedly proclaimed that Japan’s long-term growth rate had dropped to 4%), but no one, even the most skeptical, predicted twenty years of growth below 1 percent. Finally when the USSR’s economy was hurtling forward in the 1950s and 1960s, and expected to overtake the US within a few decades, even the most die-hard anti-communists did not expect the virtual collapse of the economy in the 1970s and 1980s."
----------------------------------------------------------
What's the most dreaded phrase in economics?
"This Time Is Different."
Just how much of the world's economy was Brazil responsible for in the 1970s--guess we'd best throw that example out as they weren't playing in the league we are talking about. Japan had what percentage of its population living at or close to poverty in 1990? Not very comparable to today's China either. Potential for domestic demand growth in China is incomparably larger--both absolutely and relatively--than what that potential was for Japan around 1990.
The USSR? I haven't read much on its peak years, but I will tell you that I can't recall having ever bought one solitary item in a US store that said made in USSR. Anecdotal I know but considering I have spent more than a couple score years buying stuff in the world's largest market you'd think if foreign trade were ever near the engine for the soviets that it has become for the Chinese I would remember buying at least one thing made by them don't you?
This time is different. Never before has a country of a billion brought about a third of its population from 'feudal communism' to the industrial world 'instantly.' Or as Stuart put it.
The world has never seen anything like this Chinese industrial machine."
but as you said
The Chinese economy is heavily dependent on capital spending - more than 50% of their GDP - that will have to change
Best way to do that over course is to grow the domestic markets, and where in history do you look to find the fastest way to do that. The US post WWII car centered growth is the poster child.
Of course considering the state of world oil supplies I'd have to agree such a course seems unlikely to go well.
I've a strong inkling that if that transition does not go well for China no one else is going be able to gloat about it. China falters big time and the transition away from fossil fuels in the OECD is also unlikely to go well. It might buy us all a bit more time if the China share of the CNE does keep growing for a while.
Looking at the Chinese Total Primary Energy Supply graph from the IEA, it shows a sharp, even a momentous uptake after 2002. I didn't follow the situation closely enough at the time to be aware of the specific policy measures initiated by the then incoming executive team, but the bend correlates strongly with the moment of their installment.
I would assume that the 2012 guys are busy assessing the options available to them right now, or rather that they have done it already. Again i've not been eavesdropping, not even been trying, but i would expect there to be a New Energy Policy upcoming that they can stick to for at least ten years. Very hard to imagine them not having a policy.
Shouldn't take long to find out.
Serge
Last I heard China has passed the US in total energy use.
here is as piece of its policy from China Energy Outlook: An Inside Look at Chinese Energy Thinking posted on TOD last month.
Policy stated there: get as much cheap fossil fuel as it can from elsewhere--the same report says that is exactly what the US does with oil, no doubt China will follow suite in that area as well. I'm sure China is aware it's own demand will drive up oil prices but I doubt they plan to try and hold their consumption to the 2.6 bbls/yr/capita it stands at now. They do not feel great breakthroughs in renewable technologies will supplant fossil fuels in the near term.
Just how much of the world's economy was Brazil responsible for in the 1970s--guess we'd best throw that example out as they weren't playing in the league we are talking about
I'm not sure why that matters. Brazil is big, and the fact that their economy wasn't enormous is directly relevant, as they had the kind of potential for bringing people out of poverty that we're discussing in China.
Japan had what percentage of its population living at or close to poverty in 1990?
Japan had a very large percentage that had low consumption levels - very small or no car, very small home, etc. Everyone expected Japanese consumption to have a very large potential for growth.
Potential for domestic demand growth in China is incomparably larger
Everyone knows that. But, can they do that? They have increasingly empty bullet trains and industrial/commercial/residential buildings - will they figure out how to get income into the hands of poor workers before they are forced to stop building things that won't be used? That's not at all clear.
if foreign trade were ever near the engine for the soviets that it has become for the Chinese I would remember buying at least one thing
We weren't their target market, in part because we were in the habit of boycotting their exports at the drop of a hat. Go to Eastern Europe, or look at military hardware anywhere outside the OECD. Or, of course, the labels on a lot of oil & gas containers.
Foreign trade is, of course, now a weakness for China, as exports to Europe become more difficult.
The US post WWII car centered growth is the poster child.
We were already a consumer-driven economy before that. The problem we're discussing is the transition to it.
I'm not a China expert, but there seems to be a general consensus that the longer China delays that transition the harder it will be.
I never said China's future was clear but you did say
There's a pretty good chance that Chinese oil consumption growth will stop pretty soon.
The article you linked had hard data and reasonable assumptions about commodities but stretched things quite a bit when it brought Brazil, Japan and the USSR in for comparison--that was my point. The sole similarity between those three cases themselves is that at one point everyone thought the sky was the their limit.
For Chinese oil consumption to keep edging up does not require their economy to zoom toward the sky. It just has to lurch forward. If the lurching includes anything approaching 18 million new car sales a year it is not that hard to envision the Chinese sipping a tad more oil.
per capita consumption of oil in barrels (2010)
China 2.6/yr ~ 1.35 billion people
U.S. 22.5/yr ~ 0.31 billion people
It just doesn't take that much bigger sip for China's oil demand to keep growing.
A half barrel more per capita per year for the Chinese (nearly a 20% increase) and they still use a half barrel per capita per year less than the Brazilians.
per capita consumption of oil in barrels (2010) for the rest we've mentioned
Brazil 3.6/yr ~ 0.19 billion people
Russia 5.7/yr ~ 0.14 billion people (USSR numbers not calculated)
Japan 12.8/yr ~ 0.13 billion people
The sole similarity between those three cases themselves is that at one point everyone thought the sky was the their limit.
I think the author's argument is that they shared another similarity: a boom that was based on capital spending, that couldn't be sustained during a transition to a consumer-based economy.
For Chinese oil consumption to keep edging up does not require their economy to zoom toward the sky. It just has to lurch forward.
Well, consumer consumption appears likely to grow, but commercial/industrial consumption appears likely to decline, possibly fairly sharply.
per capita consumption of oil in barrels (2010)
Yeah, in the long-run something has to give - consumer demand could continue to grow for a while.
OECD consumption will continue to fall, and developing countries will continue to grow. I/C consumption will fall fairly quickly in the OECD, and that will happen in developing countries fairly quickly thereafter. Personal transportation will be the big remaining piece of consumption. 10 years from now EREVs and PHEVs will be clearly cheaper than ICEs, so that's the logical direction for things to go.
There is some room for give that is certain. For every two gallons per week Americans and Canadians reduce consumption 1/2 gallon a week is freed up for the Chinese to increase consumption. Simpler to just look at the two biggest players--the Canadians have huddled so close to the US border it doesn't seem that out of line to lump us all together for this simplification?-) ROCKMAN alluded to this sort of redistribution among 'the haves' somewhere on this page.
I think the author's argument is that they shared another similarity: a boom that was based on capital spending, that couldn't be sustained during a transition to a consumer-based economy.
Yes but he prefaced it with this paragraph
That you would support your conclusion that Chinese oil consumption is very likely near peak with the few paragraphs that follow the above shows me it is very likely that you and I use quite different weighting strategies when formulating our world views.
The size of the Chinese economic engine, it's positive balance of trade and China's relatively secure position militarily (relative to say major European nations during their industrialization, or the soviets during in the cold war) do set it apart historically. And though it must rebalance away from capital spending that might not have to happen quite as quickly as the Pettis and some others think. After all, China still has a bunch of our money they can use to build out their infrastructure--even if India is critical of some of its plans.
I'm puzzled. What I said about his argument is consistent with the paragraph you quoted.
The size of the Chinese economic engine
Is much smaller than the US or Europe, and doesn't matter - what matters are growth rates.
positive balance of trade
Is small, much smaller than Japan's at the same transition
China's relatively secure position militarily
Is very similar to that of Japan's or Brazil's.
Yes, China can delay the transition - but the longer you prolong the bubble the worst the crash...
Chinese oil consumption is probably about to peak
Is what this thread is all about in case you have forgotten--I have my doubts that is the case.
The paragraph I quoted hardly says China is on the verge of collapse-but rather that gears must shift in the coming decade--shift toward more domestic demand, and in this world more domestic demand will increase oil use when the starting point is 2.6 bbls/yr/capita. So again that may not happen but see earlier comment for how I think that ends up playing out.
China is at nowhere near the per capita wealth Japan was when hit its slump--which doesn't seem to have lowered Japan's standard of living by the way.
So again even a Japan type slump for China is very likely to include increased Chinese oil consumption because the oil use starting point in China is still very low on a per capita basis.
I noticed you left the soviets out last comment. It was really lack of a market economy brought the USSR down. China has not exactly fallen into that trap it seems. When he mentioned the USSR it looked to me Pettis was grabbing every boogie man he could, regardless how bad the fit.
And yes the size of China's economy does matter--since it and the US/Canada feed off one another in a big way. Brazil was never in that league. It fell off the map for a while and some financial institutions took a hit but it was not that big a bump in the road for the world economy.
Yes China has enormous challenges ahead of it--this is a new thing for China????? Those who predict its imminent collapse are very likely to be disappointed--or too distracted by their own difficulties to take much notice when it happens.
The paragraph I quoted hardly says China is on the verge of collapse
That paragraph is the beginning of his argument. He proceeds to argue that those two things - decelerating growth and a transition from capital investment to consumer consumption - are very tricky to manage, and are likely to cause much lower than expected growth overall.
China is at nowhere near the per capita wealth Japan was when hit its slump
True. Brazil and Russia were closer examples income-wise. Still, Japan still had great pent up consumer demand - it still does - the average Japanese consumer is very unhappy about shortened hours and forced retirements, and the failure of Japan to fulfill it's expectations about continued growth.
Just because there is very large potential for growth in consumer demand doesn't guarantee it will arrive quickly enough to keep growth going.
even a Japan type slump for China is very likely to include increased Chinese oil consumption because the oil use starting point in China is still very low on a per capita basis.
Again, consumer demand is likely to grow (though more slowly than before) but industrial/commercial consumption is likely to fall more quickly, at least for a while.
the size of China's economy does matter--since it and the US/Canada feed off one another
It matters to the US/Canada, but it doesn't matter to internal Chinese policies and economic management.
Those who predict its imminent collapse
Pettis isn't predicting collapse, just much lower growth rates.
Pettis isn't predicting collapse, just much lower growth rates.
It doesn't take much growth to raise China's oil consumption. A new gasoline generator that burns a gallon of fuel a week (very low use) used to supplement solar panels for eight or ten rural people who move up to electric bikes and/or other tools/appliances that require charging is significant--if/when a large enough portion of China's huge rural population adopts such practices.
Market expansion into rural regions for whole arrays of consumer goods must be significant as China moves toward a demand driven GDP--no one is more aware of this than the party controlled command structure, nor is anyone more aware of the potential rural China has to increase productivity if the right mix of goods becomes affordable.
Add to that the momentum toward automobile use that comes after a certain critical mass of infrastructure/middle class income is reached...very, very likely these demand sectors increase their oil consumption far faster than the capex sectors reduce theirs even in an economy that is growing at a much lower rate.
A new gasoline generator that burns a gallon of fuel a week (very low use) used to supplement solar panels for eight or ten rural people...is significant
Doing that for 100M people would require about 40k bpd (52 gallons/yr x 100M /9 people per generator /42 gal per barrel / 365 days).
no one is more aware of this than the party controlled command structure
And there's the crux of the problem, and the heart of Pettis' argument. Everyone knew that in Brazil, Russia and Japan. The industrial planners at Japan's MITI knew that. They were considered Masters Of The Universe, able to plan Japan to the point where they Owned Everything. And...they failed.
Capex in China is in a bubble, and bubbles are very, very hard to handle. If you try to pop them in time, the people who benefit from them fight like tigers to protect the Great Thing they have going. Look at PV: it bubbled and collapsed, and yet Chinese regional governments are still subsidizing them, prolonging the pain for the whole industry for another couple of years.
very, very likely these demand sectors increase their oil consumption far faster than the capex sectors reduce theirs even in an economy that is growing at a much lower rate.
Maybe. Strong car sales are a good sign for that strategy. Still, capex can collapse much faster than consumer demand grows.
Worse yet, consumer demand, which by it's nature is decentralized and hard to control, can be frightened away by that collapse - that's a big part of the problem. Japan's planners are frustrated to death by consumers who prolong Japan's current economic problems because they won't spend, because...they're scared by Japan's current economic problems.
One other thought - you've mentioned China's size. Well, that's actually a disadvantage, for two reasons.
1st, as you know, it's bumping into resource limits because of it's relative size in the world economy.
2nd, and possibly worse, it's bumping into the limits of it's export-led, beggar-they-neighbor mercantilist strategy. At a certain point your subsidized exports become too large relative to your trade partners economy, they set up trade barriers, and you hit a wall. That's a big part of what happened to Japan.
Doing that for 100M people would require about 40k bpd (52 gallons/yr x 100M /9 people per generator /42 gal per barrel / 365 days).
Of course doing it for 400 million people and upping the generator usage to 6.25 gallons per week comes out to a million barrels a day--what is Iran exporting these days?
I happen to have a Chinese Honda knockoff 2KW generator sitting under my porch for emergencies (talk about a wealth differential between two scenarios eh, I've used it once in nearly a year, it was just so cheap I couldn't pass it up--and I was coming off my worst income year in at least 30--loss of power in my house with all heat requiring some electricity could be very expensive if we had a long outage on days like today where the temp is likely to hover around -30°F for a spell).
I just cranked out my example to show possibilities for increased petroleum use in a place like China with a huge under mechanized rural society can be found everywhere--I couldn't find how many households had poor grid access on a quick search.
The trade barrier part is a consideration--but wages have been so stagnant (at best) for the median US worker that our economy is now dependent on cheap Chinese goods to hold the standard of living up so the increasingly mired bottom 40-60% of the people don't feel the fuel/medical/food bite as hard. The situation here when Japan hit the growth wall certainly didn't seem quite that stark. Romney lost the election so talk setting up trade barriers has cooled for two to four years anyway.
Japan's people had got to the point where they had just a little bit to lose if their savings egg couldn't protect them when they hit their growth wall--we will see if China has already achieved that level while only consuming an average of 2.6 bbls/yr/capita. Maybe China arrives there when they get up to Brazil's womping oil use level of 3.6 bbls/yr/capita, which would be a world market staggering ~40% increase. We are not contemplating anything close to Japan's 12.8 bbls/yr/capita here remember.
our economy is now dependent on cheap Chinese goods
Manufactured goods get cheaper everywhere primarily because of labor productivity gains - that applies to all goods, wherever they're from.
China is losing it's wage advantage, and shipping costs (as we know) have risen. For instance, Apple is starting to move it's manufacturing to the US, back from China.
The situation here when Japan hit the growth wall certainly didn't seem quite that stark.
Ah, perhaps you didn't work in steel or autos. It was quite stark (remember "dumping"?), and the very large trade barriers that were raised were a prime cause of Asian car manufacturing moving to places like Tennesse.
Romney lost the election so talk setting up trade barriers has cooled for two to four years anyway.
Democrats are just as hot for barriers. Heck, look at the recent barriers to Chinese PV and wind imports. It's worth noting that the Chinese really are subsidizing their exports, so the barriers are probably a good idea.
Maybe China arrives there when they get up to Brazil's womping oil use level of 3.6 bbls/yr/capita
Well, China experts say that China's capital investments are already badly bubblicious. I noticed a link someone else posted on TOD yesterday that just coincidentally mentioned that Cummins' diesel engine exports to China have fallen 16% YTD year over year - Cummins notes the capex bubble problem and says, hopefully, that China is working on a "soft landing"...
Democrats are just as hot for barriers. Heck, look at the recent barriers to Chinese PV and wind imports. It's worth noting that the Chinese really are subsidizing their exports, so the barriers are probably a good idea.
Not as hot, Romney campaigned that he would declare China a trade manipulator on his first day in office. Trade barriers are very tricky--check out their contribution to the Great Depression in case you have forgotten--most of Romney's ilk are in complete denial that forgetting lessons learned from that era was a main contributor setting us up for the touchy situation we now find ourselves in.
And speaking of the Great (I might as well go here, you have done very little to show how China has reached it's peak oil consumption in this whole string of threads), this 'recovery' from the Great Recession has left things quite a bit starker in the US than any time I can remember--and I was in the timber industry during the Carter/Reagan lesser great recession. It was hit hard. Couldn't miss it in a Rocky Mountain lumber town.
We are working on our own soft landing--from over focus on consumption for consumption's sake. That is how I would describe what we are going through--and most downtown planners would likely agree as they consider our retail space about 90% greater than is optimal--no doubt room to argue the percentage but it does look like ridiculous retail overbuild to me.
You will of course say that was just the real estate bubble--that is your option, that point of view certainly sanitizes what I consider a very unhealthy obsession with consumption here in the US--the 'he who has most toys when he dies wins' mindset, which sadly seems to have been the very foundation of our version of a 'demand economy.'
I'll leave off with that...
almost...
Alan's comment on rail in another key post does indicate that China is doing major work on it's oil consumption issue...
but with capex...
China is in the process of electrifying 20,000 km this decade
Romney campaigned that he would declare China a trade manipulator on his first day in office.
Sure. I suspect that was just campaign rhetoric. In any case, trade barriers, like PV/Wind, came before him and will continue.
Trade barriers are very tricky--check out their contribution to the Great Depression
Smoot-Hawley was different - it was a general attempt to "beggar-thy-neighbor". In this case, the Chinese gov has been subsidizing exports - I think everyone agrees on that. Right?
you have done very little to show how China has reached it's peak oil consumption
hmm. I thought we made more progress than that. Too bad. Ok. I guess we need to proceed one step at a time. 1st, let's note that it's not my argument so much as Pettis', based on the work of a lot of others.
Can we agree that China's expansion is based on capital investment, and that the % of capex (higher than 50%) is unsustainable?
this 'recovery' from the Great Recession has left things quite a bit starker in the US
Yeah, things are hard. A lot of that, of course, is deliberate: the rich trying to defund gov, unions, etc.
over focus on consumption for consumption's sake.
I agree. We need fewer hard goods, and more services - health, education, etc.
Thanks for always keeping us up to date about the elm, mr. brown, we really appreciate it. Every day I WAKE up and think about what a big challenge particularlly we have in the u.s. and how we will come out better off in the end. Every few months Ire watch your youtube video from UC santa barba0?ra and Al Bartlett's talk, and I wonder just how much longer this immigration invasion will last? We in the u.s. have the highest immigration in the first world, and rapidly falling oil imports. Real oil use in the u.s. is now just 13.6 mbpd, down from 19 in 2005. What do you think it will be in 2020? 2030? I think we will be importing 1 or 2 in 2020 and producing 5. In 2030 we may be using only a few million barrels a day, and with a low eroei. Tight oil will be declining by 2015. The u.s. will also be using significantly less coal, gas, and rare U 235 in 2030. I think that by around 2042, fossil energy will be almost gone for the u.s., and we will be back to the way things were in the 1800s. How do you think it will all play out? Will we really let oil exporters consume all their own production while we power down? l think we will be forced to send recent Third world migrants back home. I would much prefer this to neocon resource wars. Even metals are running out. Everything we know about physics today says that fusion, cold fusion, lenr and 'renewables' will never work. Fusion has a major neutron problem unless we go to the moon for helium 3, and I just don't think that will ever work. Solar has a negative eroei with battery storage, and is expensive and unreliable, and will never be even 1 percent of our electricity. Wind is more efficient, and may one day rival hydropower, but is so unreliable that more fracked nat gas is needed to ramp up and down to balance the wind than if we never bothered with it in the first place. None of this stuff is going to work. I think that by 2042 we will have 2030 million people, and be back to the America of Thomas Jefferson. In your video you said that oil prices were doublind every 18 months, but they have stabalized around $100. When do you think we'll reach $200? It could be just a couple of years, if the plateau ends. Do you live in a bunker in Texas? What are you doing to prepare? I have explained the situation to many people, and they all say that nuclear fast breeder reactors should not be pursued, so there really is a compelling scenario that we power down tremendously. Obama doesn't seem interested in nuclear, and we have basically abandoned it, so our economy and population will have to come down dramatically. Good luck! I am a huge admierer, and consider you to be like the new Matt Simmons, bless his soul. This is it! We have a front row seat to the end of civilization!
Regarding annual oil prices, I think that we will continue to see a cyclical pattern of higher annual highs and higher annual lows (said prediction is worth what you paid for it).
Perhaps the best advice I have offered in recent years:
http://www.energybulletin.net/stories/2011-08-08/elp-plan-economize-loca...
EIA World Crude Oil and Lease Condensate Production, January 2000 to August 2012
The record high production now exceeds 76 Mb/d in April, 2012, at 76.03698 Mb/d.
The previous 2004 - 2010 plateau range of 73ish Mb/d seems to be yielding to a new plateau roughly 1.5 to 2.0 Mb/d higher. It's been suffering from a lot of Peak-Oil-Lite so it shouldn't be too surprising. The rise is probably related to the lack of active wars in significant producing countries, namely Iraq and Libya, along with the economic recovery - tepid as it is - which brought oil prices back up, and the recovery of offshore production after Deepwater Horizon. I have a feeling that all should have added up to more than 2.0 Mb/d - the rest must have gone "somewhere."
Substrate - A valid point. Again it goes back to how one defines a plateau and how it's scaled. I've always been a plateauite but looking at the westexas data it would seem to make sense to start focusing on charts with net exports as much as oil production/net exports. It can also be broken down to imports by country. Let's be brutally honest: the vast majority of the US public only cares how much export oil is available to the US and at what price. And despite a more moderate and logical leaning then J6P many of the TODsters fall into such thoughts.
As wt shows the exporters are consuming an ever increasing amount of their production and thus reducing the amount available for export. Of course import volumes are not only dependent upon availability but pricing. Someone made a good point the other day IMO: demand isn't the volume desired but the amount that can be afforded. Today there is more than enough exported oil globally to meet all US consumption even if we produced no oil ourselves. The question is whether the US can afford the price. Obviously one prime competitor is China. Or are they? If China and the US (we can throw India in also) can outbid the rest of the world for their imports needs then we really aren't competing with each other...yet. It's that MADOR thingy again...Mutually Assured Distribution Of Resources.
So again, the oil import volume per country may be a nice addition to an ELM adjusted export volume. Now that wt has some graphing help (besides being poor spellars geologists also strugle with Excel graphics) perhaps he can indulge us further. Maybe even some new ratio relating these aspects. You busy this weekend, wt?
What an "Undulating Plateau" in production can hide . . .
This graph shows normalized production, from 1992 on for the Six Country* Case History, versus remaining post-1992 CNE (Cumulative Net Exports). Production rose (total petroleum liquids) from 5.8 mbpd in 1992 to 7.0 mbpd in 1998/1999.
1992 production = 100%, and by definition, post-1992 CNE at the end of 1992 = 100%.
*Six Counties = Indonesia, UK, Egypt, Vietnam, Argentina, Malaysia
They showed an "Undulating Plateau" between 6.9 and 7.0 mbpd for 1995 to 1999 inclusive (total petroleum liquids). At the end of the plateau, in 1999, when production was at still record high levels, remaining post-1992 CNE were down to 40%. Note that by the time that production fell back to the 1992 level, remaining post-1992 CNE were down to 6%.
In a similar fashion, from 2002 to 2011, production from the (2005) top 33 net exporters increased by 17%, from 54.0 mbpd in 2002 to 63.2 mbpd in 2011, but of course we have been on an "Undulating Plateau" since 2005.
I estimate that as (2005) Top 33 production increased by 17% from 2002 to 2011, the remaining volume of post-2002 Available CNE** fell by about 52%.
**Available CNE = total cumulative volume of (net) exported oil available to importers other than China & India.
Check out the normalized 1995 to 2001 Six Country ECI decline versus the normalized 2005 to 2011 GNE/CNI decline up the thread. The only difference I see is that, so far at least, the GNE/CNI ratio fell at a faster rate, from 2005 to 2011, than the Six Country ECI ratio from 1995 to 2001. At an ECI ratio of 1.0, combined net exports from the Six Countries hit zero. At a GNE/CNI ratio of 1.0, the volume of global net exports of oil available to about 153 net oil importing countries would theoretically be zero. But as the new year dawns, the only question in the media seems to be how low oil prices will be future years, as shale oil plays flood the world with cheap oil.
wt - I hope folks look at your chart long enough to grasp the hidden story. I think some folks are still having difficulty believing how the majority of producers react when prices decline (as we've been seeing for a bit). It might make sense on paper to cut production in an effort to get prices back up. But most won't. In fact, it been seen time and again: many operators will do whatever possible to increase production in an effort to max cash flow even if it causes a further drop in oil prices. This happened back in '86 when the KSA got tired of reducing production in an effort to keep OPEC prices up. They opened the valves wide and increased their cash flow. But in the process knocked oil prices to under $10/bbl. Of course times are very different now: many OPEC members don't have the delivery capability they had back. Perhaps not even the KSA.
I think there is a simple way to explain the increase in production since 2010: it is the price response. Oil companies around the world are in a drilling frenzy because the high price of crude oil has made previously uneconomic prospects profitable to develop. If the price of crude oil rises a bit higher, then demand will stall or some economies will crash. Tar sands, tight oil, some heavy sour crude, some deep water oil and reworking some old fields is probably all consumers can afford. The last hurrah might create the peak in the middle of a plateau. I suspect Matthew Simmons' (?) statement will be shown correct: when Saudi Arabia peaks, the world will peak.