| #4 - Gas Leak at North Sea Elgin Platform | The Oil Drum | #2 - After The Gold Rush: A Perspective on Future U.S. Natural Gas Supply and Price |
#3 - Is Shale Oil Production from Bakken Headed for a Run with “The Red Queen”?
Posted by Rune Likvern on January 1, 2013 - 7:12am
The Oil Drum staff wishes a Happy New Year to all in our readership community. We are on a brief hiatus during this period, and will be back with our regular publications early in the new year. In the meantime, we present the top ten of best read Oil Drum posts in 2012. The eight in this series is a post by Rune Likvern on shale oil production in the US Bakken basin.
In this post I present the results from an in-depth time series analysis from wells producing crude oil (and small volumes of natural gas) from the Bakken - Bakken, Sanish, Three Forks and Bakken/Three Forks Pools - formation in North Dakota. The analysis uses actual production data from the North Dakota Industrial Commission as of July 2012 from what was found to be a representative selection of wells from operating companies and areas.
The reference in the title to the Red Queen from “Through the Looking-Glass” by the English author Charles Lutwidge Dodgson (perhaps better known as his pseudonym Lewis Carroll) who was also a mathematician and logician, is deliberate to create associations with the Red Queen’s statement "It takes all the running you can do, to keep in the same place".
After presenting, discussing and concluding the results from the study presented in this post, the reference to the Red Queen was found to be an apt analogy to describe why technology and/or price cannot overcome the inevitable fact that field size and well productivity declines in most plays, whether in shale or any other plays. Put in a different way: shale plays do not get a pass on the laws of physics or the history of play and basin developments.The potential and technology for extraction (production) of shale/tight oil has been around for several decades.
There is every reason to embrace the recent additions of shale oil (from Bakken, Eagle Ford and other plays). These additions will help ease the present tight global oil supply situation and thus slow down the growth in oil prices.

Figure 01: The illustration above is from “Through the Looking-Glass”. At the top of the hill, the Red Queen begins to run, faster and faster. Alice runs after the Red Queen, but is further perplexed to find that neither one seems to be moving. When they stop running, they are in exactly the same place. Alice remarks on this, to which the Red Queen responds: "Now, here, you see, it takes all the running you can do to keep in the same place".
Continued below the fold.
MAJOR FINDINGS FROM THE STUDY
All charts in this post are clickable for a larger version.
Findings from this in-depth study of time series for production from some individual wells:
- Presently the estimated breakeven price for the “average” well in the Bakken formation in North Dakota is $80 - $90/Bbl In plain language this means that presently the commercial profitability for new wells is barely positive.
- The “average” well now yields around 85 000 Bbls during the first 12 months of production and then experiences a year over year decline of 40% (+/-) 2%
- The recent trend for newer “average” wells is one of a perceptible decline in well productivity (lower yields)
- As of 2007 and also as of recent months, the total production of shale oil from Bakken, has shown exceptional growth and the (relatively high) specific average productivity (expressed as Bbls/day/well) has been sustained by starting up flow from an accelerating number of new wells
- Now and based upon present observed trends for principally well productivity and crude oil futures (WTI), it is challenging to find support for the idea that total production of shale oil from the Bakken formation will move much above present levels of 0.6 - 0.7 Mb/d on an annual basis.
Authoritative research companies (like Bernstein Research) and widely acknowledged specialists/institutions like USGS and SPE have recently and in general arrived at identical conclusions by applying different sets of methodologies and from studying other areas.I am of course in no position to rule out that the required breakeven price in the future could be lowered driven by technological innovations and improvements in well design and operations. However recently there have been a flow of reports that casts a reasonable doubt that this will become a given.
The content for this post was first posted in two parts (with data as of June 2012) on my Norwegian blog; “Fractional Flow” Part 1 and Part 2.

Figure 02: The map above from EIA (Energy Information Administration) shows the extent of the Bakken formation, areas with considerable activity and oil and natural gas wells. The most active areas are also the most productive ones (sweetest spots) and data now shows that these are well developed (saturated).
As of July 2012, data from the North Dakota Industrial Commission documented extraction (production) from 4 319 wells in the Bakken formation (which includes Bakken, Sanish, Three Forks and Bakken/Three Forks basins). Total reported production in July 2012 was around 610 000 Bbls/day with a specific average of 141 Bbls/day/well.
The production of shale oil/tight oil (which is not to be confused with oil shale; kerogen) is proclaimed by many to constitute a “revolution” and/or “game changer” for the global supplies of crude oil. Shale oil has unquestionably added valuable supplies during a period of tight global crude oil supplies.
SCOPE OF THE STUDY
The scope of the study incorporated companies/areas that had a specific average production (Bbls/day/well) above the average for the Bakken formation, see also figure 06. Further the study concentrated on newer wells where there were reported starts of production as from January 2010 and later. This was also to make sure that effects from those newer wells with “state of the art” technologies (technological innovations/improvements like horizontal wells also with laterals, multistaged hydraulic fracking, to name a few) were incorporated. This was done to document recent trends. Normally it takes somewhere between 5 to 6 months from start of drilling of a well until it starts flowing. Then add time for planning and approvals.
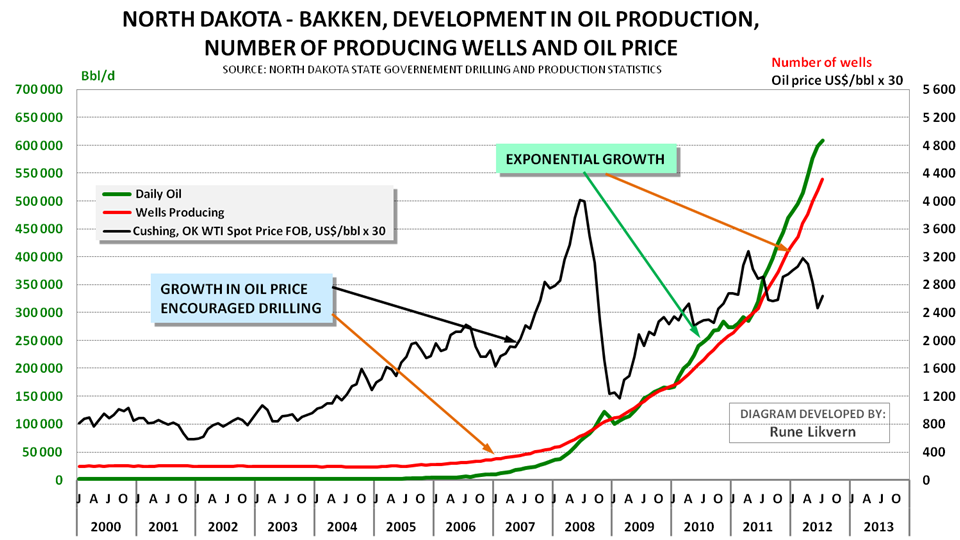
Figure 03: The chart above shows the development in the number of reported producing wells, oil production and the crude oil price (NOTE; to enable the inclusion of the oil price in the chart the actual price has been multiplied by 30. In other words actual prices are found by dividing the value in the chart by 30.). The chart shows that the growth in oil prices has been the dominant driver for acceleration of drilling and the resulting growth in oil production from the Bakken formation in North Dakota.
Figure 03 could also create the illusion that growth in shale oil production from the Bakken is still continuing at a rapid pace.However if the time series of actual production data are studied in further detail and are presented in an appropriate manner it becomes easier to document and spot the true underlying trend. From figure 03 it may also be seen that the collapse of the oil price during the fall of 2008 led to a slowdown of activities and lower total production. As illustrated in figure 03 it was primarily the growth in the oil price together with technological innovations in recent years that caused production of shale oil to make economic sense.
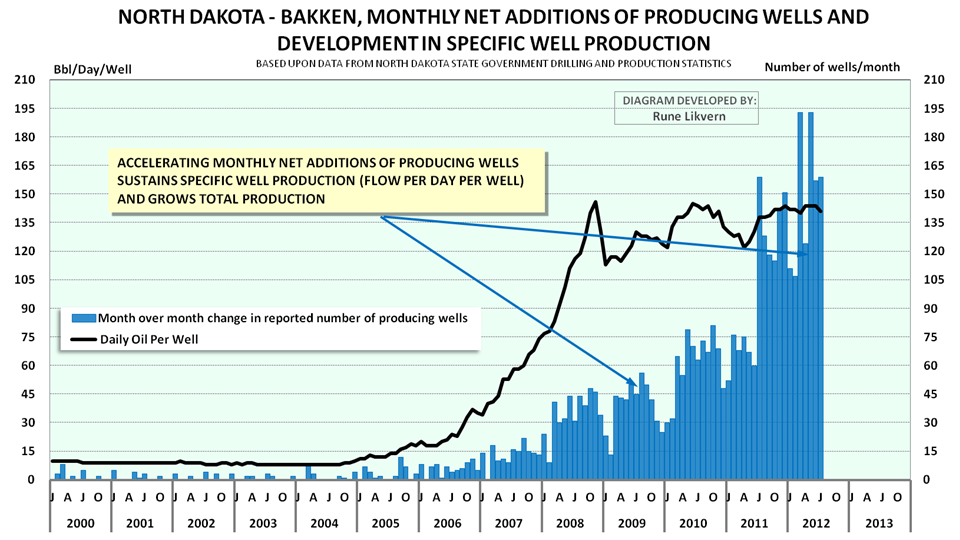
Figure 04: The chart above shows the development in the reported net total monthly start up of wells (blue columns) and the development in the specific productivity (Bbls/day/well; black line) for the Bakken formation from January 2001 and as of July 2012.
Figure 04 shows that the specific average production (Bbls/day/well) had strong growth as from 2006 to 2008 and has since been sustained at around 140 Bbls/day/well. Start up of new wells shows an accelerating trend as from 2006. It is this accelerating start up of new wells that have resulted in growth in total production. Extraction/production of oil and gas from shale formations has its own distinct physics governed by geology and comprised of steep decline rates and challenging dynamics that define the rules to create overall growth, sustain a plateau and/or declines.
There are also considerable variations in the productivity between plays within the same play and normally the areas with the best production potential (sweetest spots) become developed first (harvesting the lowest hanging fruit first etc.). The development of shale plays thus follows exactly the same pattern as developments of other petroleum basins.
THE WELLS, AREAS AND COMPANIES COVERED BY THE STUDY
What follows is a presentation of some selected wells from the study and the wells from the areas/companies covered by the study.
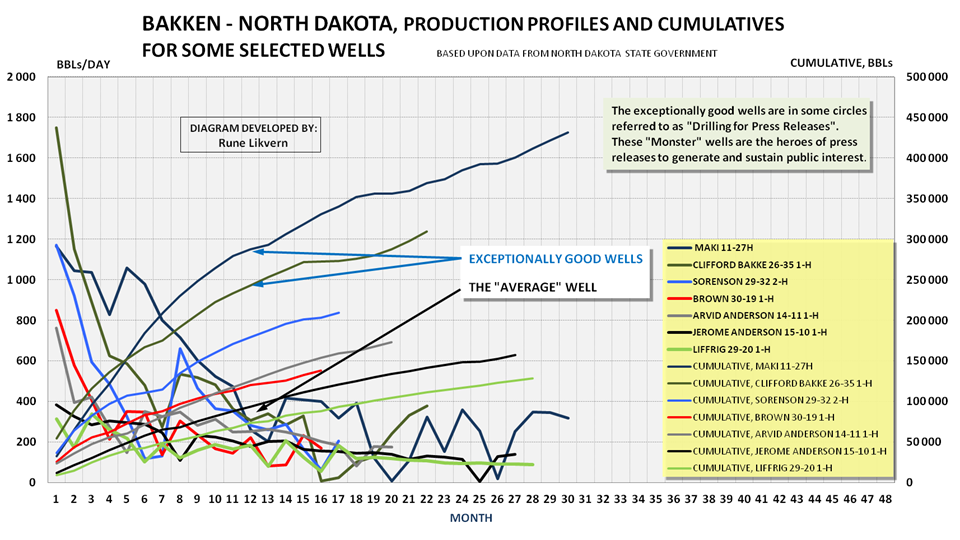
Figure 05: The chart above show the development in reported average daily production versus number of months in production for some selected wells (well identifications in the legend box) (left y-axis). Incorporated in the chart is the development of total production versus number of months in production (right y-axis).
The chart above illustrates that there is a huge spread in well productivity, cumulative and decline rates amongst individual wells. The well Sorenson 29-32 2-H (blue line) got attention from, amongst others, the Oil&Gas Financial Journal back in April 2011. Normally it is the exceptionally good wells that get the attention of media and its readers.

Figure 06: The chart above shows the development in specific average productivity (Bbls/day/well) for all Bakken in North Dakota (black circles connected by black line), Whitting Oil and Gas Corporation’s wells in Sanish (green triangles connected by green line), all of Brigham’s wells (blue circles connected by blue line) and Marathon’s wells in Reunion Bay (red squares connected by red line) from January 2010 and as of July 2012.
Figure 06 documents that the wells from the areas/companies that were subject to the in depth time series studies had productivity that was above the average for all reported wells in the Bakken play in North Dakota. Notice also the pronounced decline of more than 40% over 2 years in the average well productivity for the wells in Sanish.
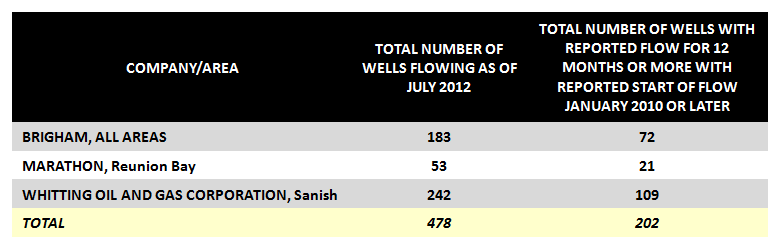
Table1: The table above lists the number of wells that were subject to the in depth time series studies, and what companies/areas these were reported.
The in-depth time series study was comprised of 478 wells (around 11%) of the 4 319 wells reporting production from the Bakken. These wells represent around 13% of the total production as of July 2012. The wells with reported start of production as of January 2010 and later and that had reported production for 12 months or more were subject to additional analysis which includes the wells with reported start of flow as of August 2011. In the period January 2010 and through August 2011 there was reported start of flow from a net addition of 1 417 wells of which 202 (or more than 14%) were subject to extensive statistical analysis. The statistical analysis formed the basis to define what is presently considered a pro forma well (or “average” well) for Bakken. The “average” (pro forma) well should not be expected to be static as it will continually change with time and presently the trend is one of declining productivity.
For this “average” (pro forma) well an economic analysis was performed which is presented further down.
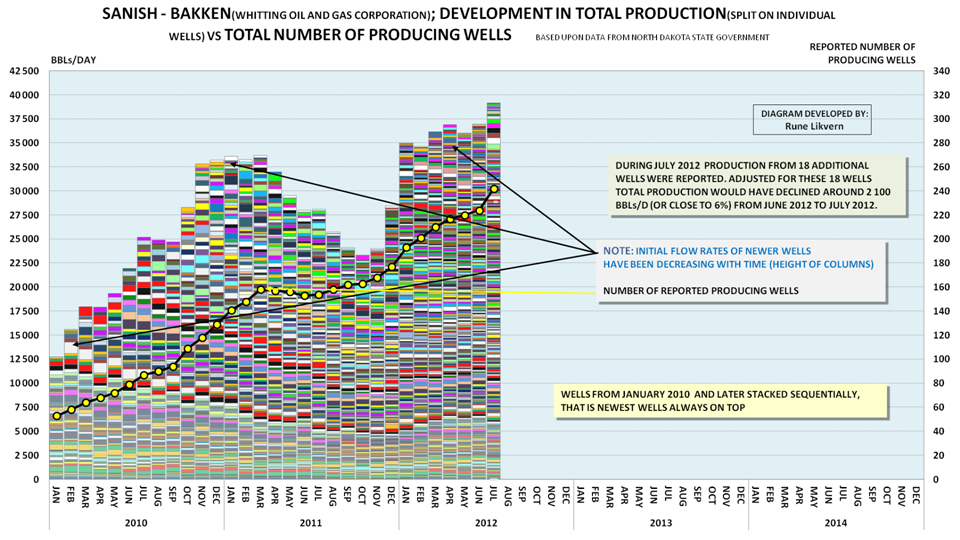
Figure 07: The chart above shows the monthly total number of wells, month of start up of reported production from added wells, production from the individual wells and total production from the 242 wells reported for Whitting Oil and Gas Corporation in Sanish - Bakken as of July 2012. The chart spans the period January 2010 through July 2012. The wells in the chart are stacked sequentially according to reported start up of production that is newest wells always on top.
Figure 07 is a suitable illustration of what is to be expected in developments of shale formations (or areas within shale formations) for both oil and natural gas. From the figure it should also be possible to perceive the development of well productivity with time.
- The wells normally have a high production at start up that rapidly enters into steep declines.
- To facilitate growth in total production an accelerating number of wells needs to be brought into production.
- To sustain a plateau requires a continual addition of a high number of producing wells.
- Note in figure 07 how total production declined between March 2011 and as of October 2011 while the reported number of total wells with production saw little change.
- Figure 07 also shows how well productivity (note the arrows and height of columns) has shown a general decline for newer wells.
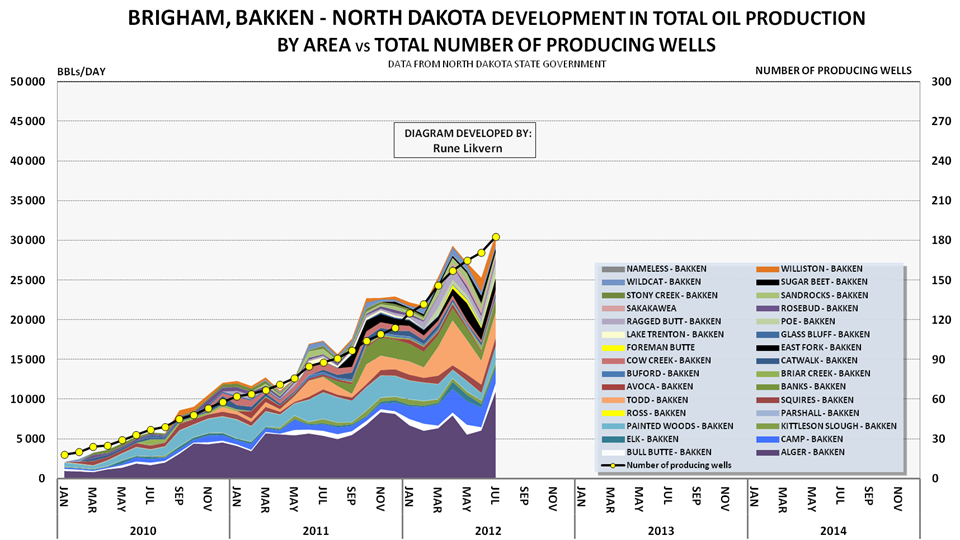
Figure 08: The chart above shows the development in reported total production by area for all the wells for Statoil/Brigham in the Bakken formation, North Dakota. The chart also shows the development of total number of wells. The chart spans January 2010 through July 2012.
The chart in figure 08 also illustrates how an accelerating number of additional producing wells are needed to create growth in total production. Brigham was acquired by Statoil December 1st 2011 for a price of US$4.4 Billion.
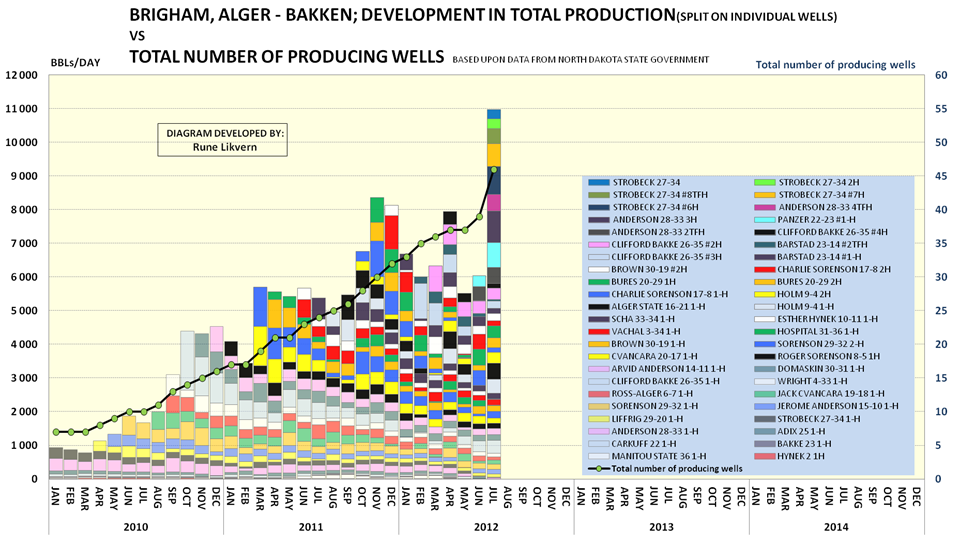
Figure 09: The chart above shows development in total production by individual wells (ref the legend) and total number of reported wells with production for all Statoil/Brigham wells in the Alger area of Bakken.
The wells in the chart are stacked sequentially according to reported start up of production, that is newest wells always on top.
The chart may also serve as an illustration to what in some circles presently is referred to as “the Red Queen” effect. It is not a given that total production will grow by adding new producing wells.
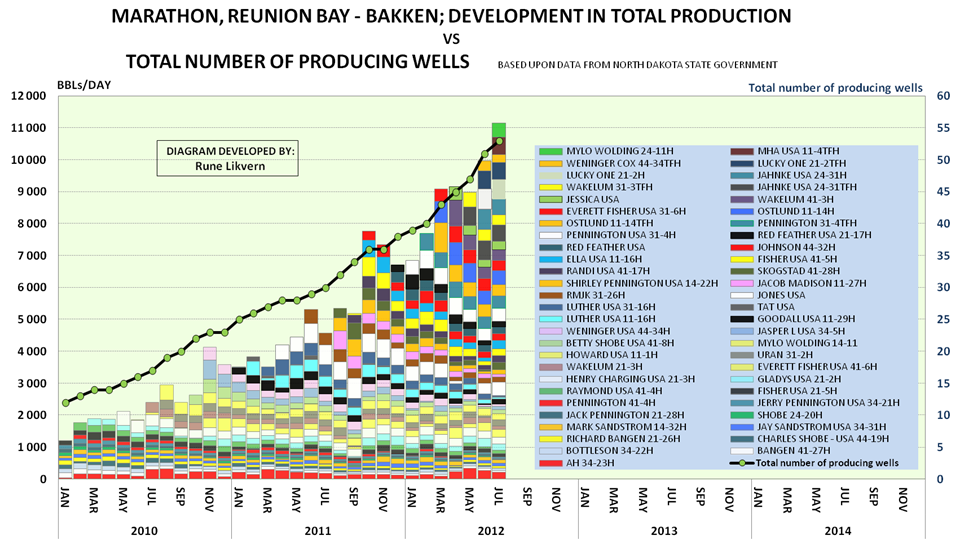
Figure 10: The chart above shows development in total production by individual wells (ref the legend) and total number of reported wells with production for all Marathon wells in the Reunion Bay area of Bakken.
The wells in the chart are stacked sequentially according to reported start up of production, that is newest wells always on top.
The chart above also illustrates that growth in total production requires accelerating additions of producing wells. The Marathon wells in the area above have recently seen some improvements in well productivity.

Figure 11: The chart shows development in total production from wells started within specified calendar years for Marathon’s wells in Reunion Bay - Bakken.
The purpose of including the chart above was to give a better feel of annual production declines from wells within an area.
THE STATISTICAL ANALYSIS
What follows are the results from the statistical analysis of the wells that were subject to the in depth time series analysis. If the trend described by the statistical analysis persists and the wells analyzed are representative for Bakken it should be expected that total production from the Bakken formation is about to experience what in some circles is referred to as “the Red Queen” effect.
In plain language this means that a high number of new wells needs to be brought to production to sustain total production.
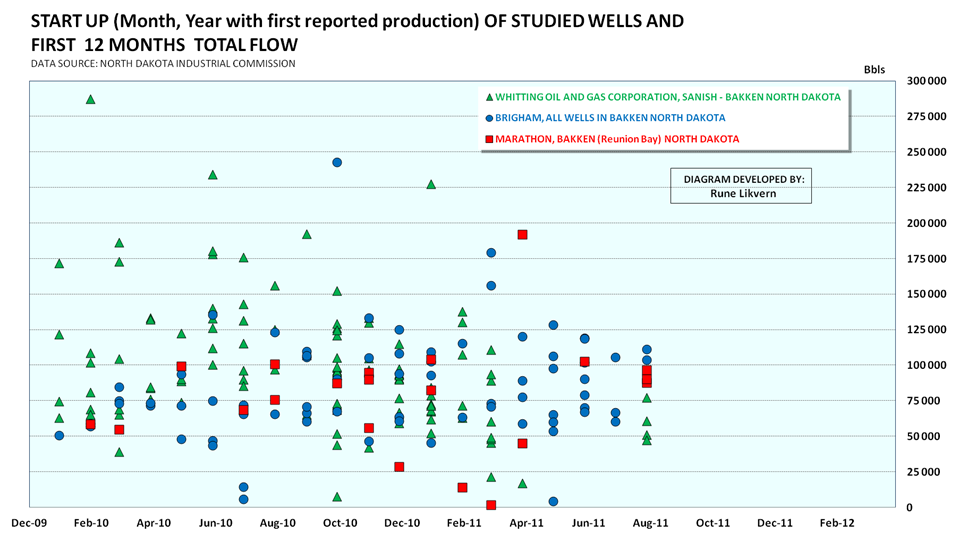
Figure 12: The scatter chart above may appear complex for those who are not familiar with this kind of chart. Based upon data from the North Dakota Industrial Commission it shows total reported produced crude oil for the 12 first months (y-axis) versus reported start of first production (x-axis). Wells that were started as of August 2011 or later had as of July 2012 not attained 12 months with reported production. This is the reason why there presently are no data points in the chart after August 2011.
The figure shows that there is a huge spread in the total production for the first 12 months amongst the wells. It may be challenging to perceive any trends for well productivity with time from the scatter chart, but as of now it appears as the spread in productivity has narrowed with time.
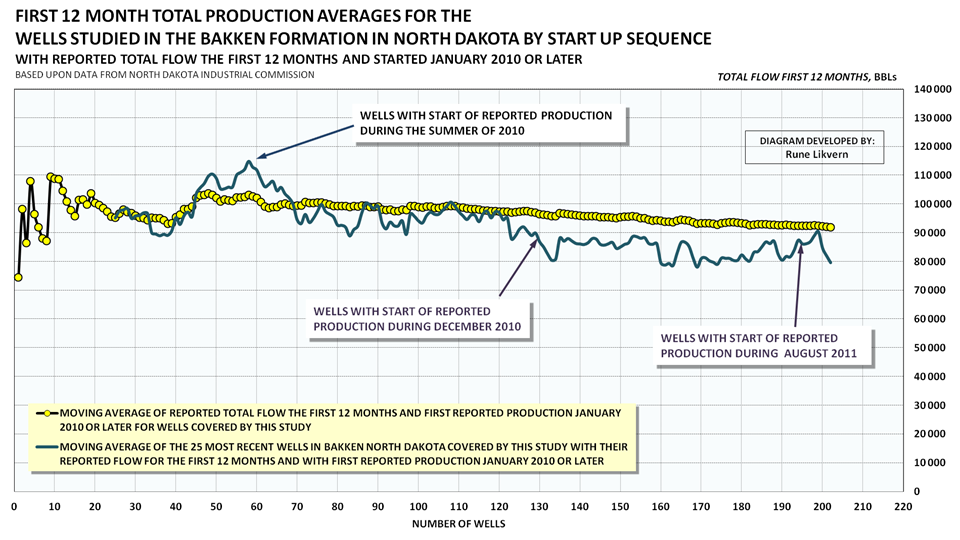
Figure 13: If the data on total reported production for the first 12 months on all the wells that were subject to in depth time series studies are organized sequentially according to when production were started and a moving average is used, the picture above emerges. The moving average is the total first 12 months production divided by total number of wells (yellow circles connected by black line). Described another way the first data points are for wells with reported production from January 2010 and the last data points in the chart are for wells with first reported production as of August 2011. This function is slow. To both speed up the function and improve visualizations a 25 moving average was added. The 25 moving average shows the average of the 25 most recent wells (aquamarine line, 25 moving average was chosen as a compromise to smooth out wild swings and achieve an acceptable speed).
Figure 13 shows a worrying development for newer wells in the Bakken formation. Productivity as expressed by total first 12 month production has shown steep declines for newer wells. The productivity was growing until the summer of 2010 where it reached a high. Since the summer of 2010 to the summer of 2011 average first year productivity for newer wells in Bakken declined around 25%!

Figure 14: In the chart above the same methodology as used for figure 13 is shown for the companies/areas covered by this study. The green triangles connected by green line are the moving average for Whitting Oil and Gas Corporation’s wells in Sanish. The green line shows the 25 moving average. The blue circles connected with a blue line are for the wells of Statoil/Brigham. The dark blue line is the 25 moving average. The red squares connected by a black line are for Marathon’s wells in Reunion Bay.
On a long enough timeline, the highs in well productivities for the Sanish area and Statoil/Brigham will melt into a point. To repeat, the wells for the companies/areas subject to these in-depth studies had all a specific well productivity (as expressed by Bbls/day/well) that was above the average for the Bakken formation, see also figure 06. The Sanish area in the Bakken formation is/was considered being one of the best and during a year (from the summer of 2010 to the summer of 2011) the well productivity (as described by total reported production during the 12 first months) declined about 40%. For Statoil/Brigham the well productivity declined about 10% in one year.
Do the above create associations to the law of diminishing returns?
THE ECONOMICS FOR THE PRESENT PRO FORMA (“AVERAGE”) WELL IN BAKKEN
What follows is a little about the economics for what the analyzed data presently describes as the pro forma (“average”) well in the Bakken formation.
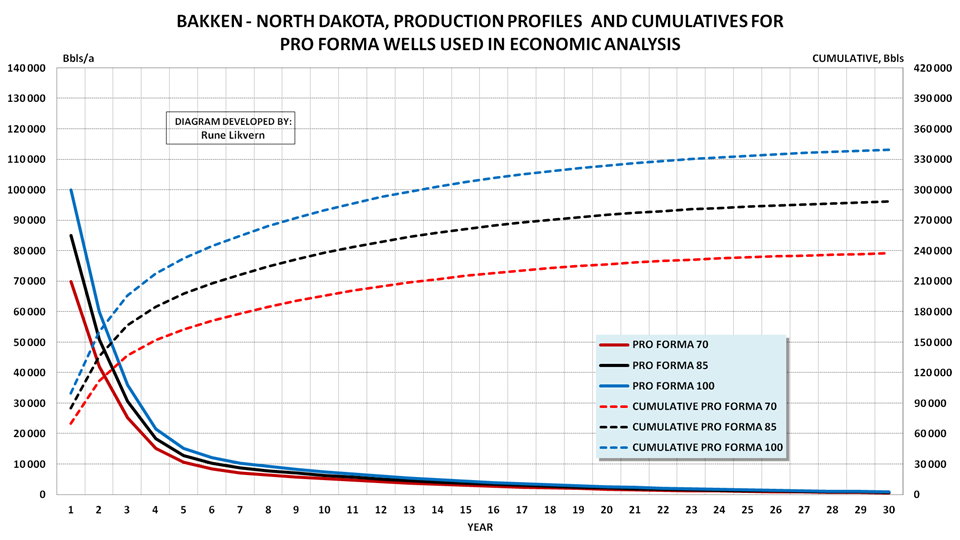
Figure 15: Based upon the data from the wells that were subject to in depth time series studies a pro forma well (an “average” well) was established. The future development for this was forecast by using data from the North Dakota state government and what is presently available of forecasts from several reputable sources with regard to declines, total recovery or EUR (EUR, Estimated Ultimate Recovery) for wells producing oil from shale. From this study it was found that the pro forma (“average”) well yielded around 85 000 barrels with crude oil during the first 12 months of production.
The chart shows production profiles for pro forma (“average”) wells with respectively 70 000 (red lines), 85 000 (black lines) and 100 000 Bbls (blue lines) for the first operational year, and how these are forecast to develop with time.
Presently the data documents that the production trend for the “average” well is in slight decline.
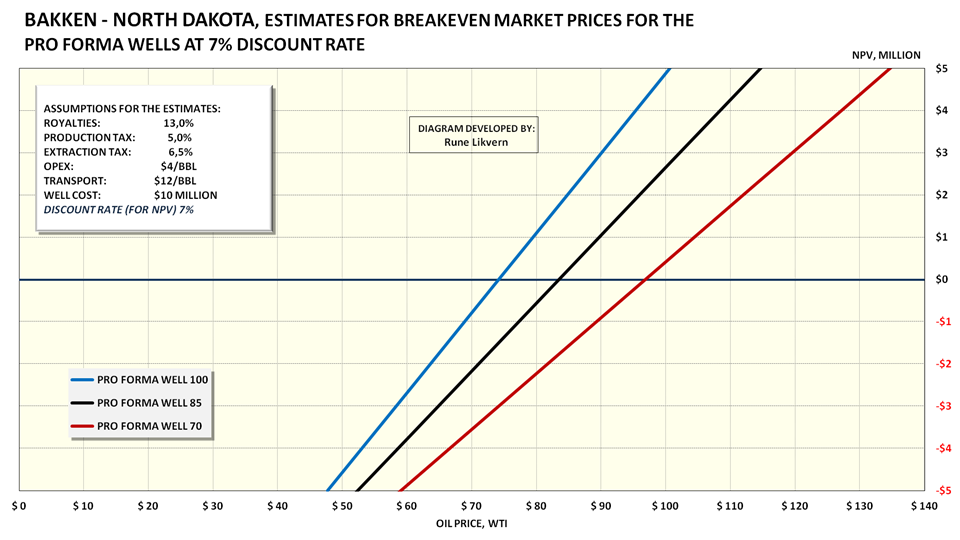
Figure 16: The pro forma (“average”) wells shown in figure 15 were subject to economic analysis. The assumptions used for the economic evaluations are shown in the box within the chart. (PRO FORMA WELL 100 = well with a total of 100 000 Bbls produced during the first year, etc.). The well costs include preparations of the well site (inclusive access), horizontal drilling, completion, multistage hydraulic fracking and hook up for processing, storage and transport. The well cost does NOT include full life cycle costs, financial costs, costs for mineral rights (acreage costs) and effects from potential changes to statutory regulations.
NOTE: The “average” well also produces 0.5 - 1.0 Mcf/Bbl with associated natural gas. The natural gas may be flared or sold if there is available infrastructure. Presently the natural gas price in USA (Henry Hub) is around $3/Mcf. In other words the potential contribution from natural gas is marginal and well within the uncertainties for the estimates.
The profitability analysis shows that the “average” well for Bakken now requires $80 - $90/Bbl to make commercial sense. A requirement for a higher rate of return (than the 7% used here, which is moderate) will raise the commercial threshold. If the trend with declining well productivity persists (all other things remaining equal) the threshold for profitability will move higher. During the planning of drilling campaigns several assumptions are made with regard to well productivity (performance), oil price, financing and an associated package of risk assessments. If these evaluations show high uncertainties (as in high risk) and a potential for no or at best uncertain profitability, the wells under consideration are most likely to not be drilled. The exception will be wells that the licensee is contractually obligated to drill within a specified deadline to maintain the rights for mineral extraction, so-called “drill it or lose it!”
Normally before wells within shale areas are put into production, it is close to impossible to issue any guarantees that it will make commercial sense. After six months or more of production, data will be available that may support the profitability expectations. For a well in a conventional reservoir information about whether it is worth completing will be available at the end of drilling. For wells in shale plays (both oil and natural gas) the companies (operators) commit themselves to produce these long before they know if the wells make commercial sense. If production from a completed well after some time shows that it will underperform (that is yield less than expected) then the oil company/operator will continue production from it as long it generates a positive cash flow. As with regard to total well costs given by oil companies/operators there are presently some spread in these. These spreads should be considered to be real and rooted in geological particulars like depth to and thickness of the organic zones, applied technologies, laterals, number of hydraulic fracking stages, topography, costs for hook up for processing, storage and transport to name a few.
Production of crude oil and natural gas from shale is also a lot about growing shareholder value. As long as shareholders do not suffer any losses it does not matter if production from shales makes little or no commercial sense. These dynamics led to the boom in drilling for shale gas. The recent collapse of natural gas prices in North America has resulted in huge balance sheet impairments for several oil and gas companies.
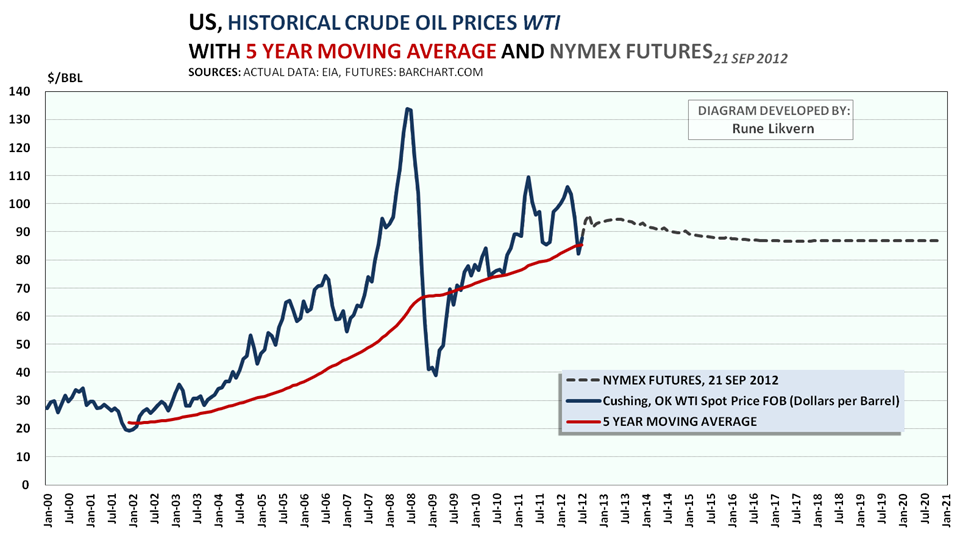
Figure 17: The chart above shows the development in the oil price, WTI, as from January 2000 and now. Further the NYMEX futures (WTI) as of 21 September 2012 through December 2020 have been added. FWIIW the 5 year moving average of the actual WTI has been added (red line).
In reality, it was the growth in the oil price to an apparent structurally higher level that secured commercial support for crude oil production from shales. In that respect it was the oil price that was the true game changer and unleashed the “shale/tight oil revolution”. There is a saying that goes like; “Do not listen to what they say. Look at what they are doing!”. This may as well go for the Bakken formation.
The oil service giant Baker Hughes recently expressed concerns about slowing activity levels in shale plays if oil prices moved below $80/Bbl. Further the oil companies Marathon and Occidental recently cut back on their activities in the Bakken formation. Oil and gas companies still care about the colors of the numbers at the bottom line for their projects.
Indicators to follow that may be a harbinger of emerging developments in activity levels in shale plays:
- Number of drilling rigs, uncertain as there has been improvements to drilling.
- Net added number of wells with reported start of production.
- Changes to total reported production.
SOME RECENT REPORTS
U.S. Geological Survey (USGS) recently published (recently as in a few days ago) the report: “Variability of Distributions of Well-Scale Estimated Ultimate Recovery for Continuous (Unconventional) Oil and Gas Resources in the United States”. USGS has revised their estimates for many U.S. shale plays (oil and natural gas) and their recent estimates ought to have a sobering effect.
For production (extraction) of shale oil in the Eagle Ford formation in Texas the study:”Eagle Ford Shale - An Early Look at Ultimate Recovery” (SPE 158207; SPE, Society for Petroleum Engineers) documented a trend of declining well productivity.
ROCKMAN is an experienced geologist and as close you get to an inexorable fountainhead for oil and gas field experiences on The Oil Drum.
ROCKMAN applied the same methodology as I did for Bakken on data from Texas Rail Road Commission (TRCC) for shale/tight oil in Eagle Ford and documented the same trend.
Does it appear as if shale oil production from Bakken is headed for a run with “the Red Queen”?
#3 - Is Shale Oil Production from Bakken Headed for a Run with “The Red Queen”?
PDF version
77 comments
#3 - Is Shale Oil Production from Bakken Headed for a Run with “The Red Queen”?
PDF version
77 comments
Contact
- Content: editors at theoildrum dot com
- Tech support: support at theoildrum dot com
License

This work is licensed under a Creative Commons Attribution-Share Alike 3.0 United States License.
Curious and question:
When these decline rates and need for frantic drilling become common knowledge including the requirement for 80-90 dollar oil to break even, will the industry hypsters simply fade away? How will the idea of Saudi America be abandoned by msm? Will Fareed say he was misinformed and by who? Rockman and others have stated that this hype is a current and next bubble designed to benefit pubcos; in other words, a cheesy and dishonest way to fleece investors. What's the next bubble? Food production, again?
Thank you for this extensive work and analysis. When I read your work and others I always wonder why this is not shouted in headlines across the world? Why is it only a few websites that seem to understand the obvious and are willing to share this knowledge?
Paulo
I have wondered if this shale oil and it fast drop off will contribute to more of a sharks fin decline in oil in the next couple of years, could even be this year .....
ah interesting times....
Forbin
Maybe brace for impact ?
Forbin – I’ve never been a shark fin advocate. Individual wells/fields: sure…shark fins can happen. But on a national/global basis: very unlikely IMHO. General declines exist for sure but at rather modest rates. Now the bump up from the shales/Deep Water might produce some small shark fin drops if prices fall and reduce drilling significantly. Those very high individual well decline rates guarantees that. But that would just drop us back to our long trend decline rates. Which is why I think those optimistic long term estimates are dangerous to accept. Even with the upticks the decline of the major heritage fields is still happening. As the wise man said: depletion, like rust, never sleeps.
For once, I agree with you oh' fountainhead of ........er.....eh.... rhetoric. The shark fin presented in Future production from U.S. Shale or Tight Oil, referenced below by Darwinian, is based on the most restrictive of assumptions. Namely a total of 11725 operating wells by 2017.
Operators are drilling up to 8 wells per 1280 acre unit. There is no valid reason, except possibly good sense, to expect a limit of 11725 wells. Some operators have suggested up to 17 wells per 1280 acre unit. I suspect excessive good sense will prevent that from ever happening.
The phenomenom described by Rune Likvern whereby second generation wells produce 25% less in the first year than first generation wells shows nothing more than reduced recovery from 'infill' wells. Sanish field, used by Rune Likvern, is the prototype for excessive infill drilling - that is a whole different subject.
The case for 11725 wells is the essentially the 'no-infill' well case. The 'final solution' is somewhere between 'no-infill' and 'excessive-infill' , imo. That won't result in a shark fin, again, imo.
Sanish field is currently at an effective average of about 4 wells per 1280 acre unit and is showing serious symptoms of excessive infill drilling.
The shark-fin concept was ambiguous to begin with. The shape of a shark-fin could be concave down or convex down, depending on the species of the shark.
Not that its a big deal, a lot has been made of a throw-away line based on someone's metaphorical alliteration.
Of course, we tend to see pretty sharp declines when it comes to net export declines:
Rates of change in net exports for the top 33 net exporters in 2005:
http://i1095.photobucket.com/albums/i475/westexas/Slide1-28.jpg
The years in which six of the (2005) Top 33 net exporters (countries with 100,000 bpd or more of net exports, total petroleum liquids, in 2005) fell below 100,000 bpd in net exports are shown below.
Note that production declines generally do not exceed single digit values, versus the observed, and dramatically higher, net export decline rates, i.e., "Net Export Math" at work. The 2005 to 2011 (or last year of net exports where noted*) respective rates of change in production and net exports are shown below:
Malaysia, 2007; -3.4%/year, -32.6%/year*
Vietnam, 2007; -3.0%/year, -29.0%/year*
Denmark, 2008; -8.7%/year, -21.0%/year
Argentina, 2011; -3.0%/year, -21.0%/year*
Syria, 2011; -5.0%/year, -15.7%/year
Yemen, 2011; -10.0%/year, -28.7%/year
The median rate of change in production was about -4%/year, while the median rate of change in net exports was about -25%year.
I think that it is highly unrealistic to expect that thousands and thousands of wells quickly headed toward stripper well status, 10 bpd or less, will make a material long term difference in the global net export situation.
Thanks, Westexas! That was the info I requested from you in a different post.
There is some data that is critical to evaluating the productivity of unconventional resource wells, and that is the lateral length and the number of frac stages as there is a significant degree of correlation between these and IP rates for a well. Likely, much of this data is unavailable.
I just started reading this and have to comment on one thing before I continue. You stated in your intro section:
"shale plays do not get a pass on the laws of physics or the history of play and basin developments."
Why would you say something so obvious? Is there anyone suggesting that the Bakken shale (or any other gas or oil deposit for that matter)is not subject to the laws of physics and generally accepted historical trends?
Thanks for the great read.
Regarding the economics of the Bakken wells, the $12/bbl transportation cost really eats into profitability and I don't think that will last in the medium to long-term. Production growth has been so fast that the limited avenues to transport the crude oil from the Bakken have really bid up transportation costs. The lack of necessary pipeline infrastructure is really disadvantageous in the Bakken region. Transporting crude oil by rail is inefficient. There are proposed pipelines expected to come on line in 2014-2015 that will help. If production does decline, transportation costs will also decline b/c there will be less demand to outstrip the transportation infrastructure. This transportation cost will be a buffer to support sustained production, but not necessarily the growth. $12/bbl to transport crude is just so expensive -- it won't last forever. The problem is building the infrastructure takes a years, not months.
I don't know where crude oil prices are going, but there will be a gradual narrowing of the WTI-Brent spread and these transportation costs will gradually reduce over time, which will support Bakken production. I do agree, though, that this breakneck speed of Bakken production is concerning.
Transport of oil may or may not become an issue.
Availability to capital may become an issue. For 2012 it is estimated that close to $20 Billion will be used on wells in Bakken and an estimated $6 Billion need to come from external sources, like lending.
Some 30 % of the natural gas is now being flared in Bakken, mainly due to lack of solutions for the gas, transportation, industrial uses. Some wells (with high gas to oil ratio) are being shut down as their permit to flare are not extended. Operators are granted a period (one year normally) after start up of the wells where they are allowed to flare the gas, if there is not a transport/industrial solution around.
Then there is wear and tear on the roads. An average well in Bakken requires around 2 100 heavy truck loads with materials to produce a flowing well.
The article “America’s low-volume Roads need Help – and they’re getting it!”.
Then some wells needs the oil to be trucked to gathering stations for further transport.
- Rune
Can that gas be re-injected to be recovered at a later date should technology/economics improve?
NAOM
This is not really a candidate for gas injection, imo. The natural and anthropogenically induced fractures provide a conduit from injection gas well to producing well, displacing very little oil. There is not enough vertical relief for gravity to be of much assistance, as is the case with Cantarell.
The Bakken doesn't appear to be much of a candidate for gas storage either. Although operation as a gas storage facility would most likely result in additional recovery because of the volatile nature of the oil. Maybe when most of the oil turns to gas, gas storage may suddenly become sexy.
The Bakken has some similarities with Cantarell, Cantarell is apparently highly fractured, with fractures bounding lower permeability matrix blocks. That part is similar to the Bakken, the similarity ends about there, imo.
EOG resources tried CO2 injection in Parshall field. CO2 breakthrough occured a mile or more away within days.
EOG got approval for, but has not implemented, a water 'imbibition' project in another part of Parshall. Statoil(Brigham) may be planning an 'imbibition' water injection project also(not in Parshall).
Some news on oil pipeline developments from Bakken.
ONEOK Partners Elects Not To Proceed With Bakken Crude Express Pipeline Project
If memory serves Cushing is that narrow point in the bottleneck right now, not surprising another pipeline using it as a southern terminus is not happening. Is rail able to get Bakken crude to the Gulf Coast refineries and pay the extra freight in the process with the price differential these days?
Rune – In about 3 months I’ll update that Eagle Ford stat. The TRRC numbers have such a lag and just for symmetry I want the update to run on an annular basis.
The stat Rune is referring to: the production rate of a well after 12 months of production. Estimating future rates/URR from a well’s initial production rate is very difficult and typically proves incorrect. But after 12 full months of production you have a fairly reliable metric. In my previous analysis I compared that 12-month rate metric for EFS wells since the trend heated up. Though I’ve never been very optimistic about the long term aspect of the play I was very surprised: in just one year the 12-month metric had declined about 25%. Indicating the newer locations were not nearly as productive as the initial ones drilled. The weakness of this stat is that it’s comparing a relative small population of wells and might not be representative of a major trend. But next time I run the numbers it will include a very large number of wells.
ROCKMAN – that is very helpful of you. (and may result in additional sales of Blue Bell Ice Cream ;-))
I am working on a follow up post which has the preliminary title “The Red Queen has an invisible helper named debt.” where I look on how the well developments in Bakken may be financed also with debt. Huge amounts of debt eats into the profits (interest payments and fees) and a highly leveraged company becomes vulnerable to lower prices (higher prices have the other effect).
With this I try to present the options a generic company has going further. There are several considerations the board and upper management needs to assess all depending of what kind of metric that is applied for measuring success. Profit is of course the overruling one, but this may be obtained through different paths.
Additional wells have been added (and more will be) and also an approach with a huge number of random wells from all over Bakken and for most of the operators. So far these data shows that they confirm the average well used in this post, but it appears as the decline rate for the “average” well (decline from first full year of production to the second year of production) on average is in the area of 50 % (in this post around 40 % was used for the “average” well).
These additional wells (and as of now) also documents the same pattern with a high in well productivity during the summer of 2010 followed by a decline.
Further the decline rate appears to be higher for wells with high first year production than for wells with lower first year production.
Most of the production from Bakken in North Dakota presently comes from 4 counties.
And certainly like in any petroleum region Bakken may provide surprises to the upside.
- Rune
About 84% of tight oil production from Bakken comes now from 4 counties (see map below), Dunn, Mackenzie, Mountrail and Williams, all in the western part of North Dakota.
Oil production from Bowman is in steep decline.
North Dakota has an area of around 183 000 sq km and the 4 counties with the major portion of tight oil production cover an area of around 23 400 sq km (or around 13% of North Dakota).
A little exercise in math with area (adjusted for lakes) and well spacing should give some idea about the potential and what can be expected going forward.
- Rune
Hi Rune,
I was wondering if you looked at Falloon's four part 'Red Queen' rebuttal series?. Two sections focus on 2011 well production, but only use wells that have at least 360 days of production. So no well will have an IP test date before January of 2011. Those wells are all located in McKenzie and Mountrail counties. My reading didn't let me determine whether he was cherry picking wells from those sets or if his production data included all wells in those counties that met his criteria. Any comments from you on his series would be appreciated.
Hello Luke,
Anyone that needs several articles in an effort to produce what they consider a rebuttal I stop following.
The author says (in the article you linked to); "….and believe his study used companies that consistently underperform."
The author then fails to follow up by producing documentation that supports his claim. His readers should demand he did.
The author (Filloon) consistently and repeatedly uses phrases like “I believe”, in other words this is just production of “hot air”. Belief has nothing to do with a scientific approach.
During 2011 around 1 200 new wells were put into production in North Dakota. Filloon presents data for 40. Further he does not care about presenting them in the sequence these were started to flow.
If Filloon should make a point he should present results from a larger data set (more than 10 %) and try to show the distribution of productivity with time.
Since I wrote this post I have added more wells (and updates as data becomes available) and included a lot of random (picked by a third party) wells from all over Bakken and from (hopefully) all the operators. So far this has not changed much about the profile for the “average” well. Data on first year total production (running average) wobbles between 80 000 - 100 000 bbls for 2011. However as more data for the second year production are available it now appears as the decline from first year year to second year is higher than what I used for this post.
- Rune
Thanks Rune,
All the points you mentioned I had already noticed. An additional thing I noticed is that during the first part of the series Falloon was long on KOG (small but often praised Bakken producer in the series) and that he had no Bakken related holdings by the end of the series--actually he still had no holding into December, but of course his disclosures only cover the periods mentioned in them, he could have traded in an out in between those periods.
Like I said I could not tell whether or not 40 wells on which he presented data (in article IV) were all of the wells even the in the area of northeast McKenzie County he was highlighting and which went into production in 2011 with at least 360 days of production, the criteria he chose. I was just hoping you might know just how many McKenzie and Mountrain wells would have fit that criteria--essentially wells which started production between Jan 1 and Oct 1 2011. But then as Falloon doesn't even say how exactly he weeded out the areas he chose to highlight I can't imagine how you could guess what it was either.
His preface to the first table he presents (in part III) makes me suspect cherry picking in the extreme
In the table below I have listed 2011 wells in western Mountrail County. This is a very good area, but the results I found were better than I originally expected
Just how he bounded the area in which wells were chosen (my guess is by finding the highest producing section) and whether or not he includes all Jan 1 - Oct 1, 2011 starts in even that bounded area is not at all clear.
One thing I did come away with after reading a few more of his posts is that one really must know how Continental is handling and plans to continue handling their huge lease areas. They dwarf the other players and knowledge of their strategy is important to any set of production projections.
[ a marginally related aside: I strongly suspect a geologist who often comments here commented on the first part of the 'rebuttal' series. If he ever chooses to coin a new handle for TOD 'Dave's not here' might be a good one ?-) ]
Luke
Luke,
As of now I am not in a position to say anything about criteria that was chosen by Filloon and I do not know how many McKenzie and Mountrail wells that would have fit those criteria. Given time I could have sorted the data to show this.
I have seen mapping done by others I am in regular contact with, which shows productivity by area in Bakken. As of now the most productive areas are very concentrated.
Again given time I will also have liked to plot wells according to their geographical location and productivity.
- Rune
Thanks again, always look forward to your presentations.
Last time around we were talking about Great Bear's Alaskan tight oil play--very little new to add on that right now, except to say the cores and all are undergoing extensive analysis and that they have called their drilling season to a halt. Duncan, the CEO, seems to have toned down his hyped up sales pitch substantially now that Great Bear has actually sunk a couple holes. We will see what we can make out of what he has to say next.
Luke,
Thanks for your brief update on Great Bear. It will be interestingly to see how that develops.
- Rune
I believe Falloon exclusively uses company presentations and press releases - I
can't imaginehave no doubt the data is cherry picked to the hilt.Greetings TOD'rs ... what comes after tight oil ? ... would it not be wise to save (conserve) something till we get that future concept under control ?
curly - Certainly would be. It would also be wise to stop over eating, stop driving drunk, stop smoking/abusing drugs, etc, etc. And I have yet to meet one person who didn't beleive in conservation...for someone else. LOL. Or put another way: how many folks do you know that readily admit to using more energy then they really need to? If like me I suspect very few. Seems to be a common problem: obvious solutions with litte ability to have them implimented.
FOR ALL
EIA recently publicized the AEO2013 EARLY RELEASE OVERVIEW (AEO; Annual Energy Outlook).
With EIA’s data for AEO2013 the two charts below were developed.
The chart shows EIA’s projection of US crude oil production towards 2040 in their Annual Energy Outlook (AEO) 2013 Early Release (ER) split on sources for crude oil.
The chart shows EIA’s projection of US tight oil production towards 2040.
As of now, total tight oil production for 2012 on an annual basis from Bakken (Montana and North Dakota (NDIC data) and Eagle Ford (TRCC data and inclusive condensates) is expected in the range of 1.1 - 1.2 Mb/d.
EIA expects a total of 2.0 Mb/d with tight oil for US for 2012.
- Rune
I think it has been poster "Advancenano" who has noted that production over the past few months has been significantly higher than the EIA forecasts (on an annual basis) would suggest. If these production-rate increases hold up, it seems quite likely that US production could be more like 8.5 mbpd in 2015 or 2016. But following Rune's work, the decline will be much steeper. EIA's expectation for tight oil production to be more or less constant at 2.0 mbpd through 2040 looks like a WAG !
Exactly. Look what the EIA forecasted as recently as 2009!
LINK
Here's a chart of that "limited growth after 2010!"
I can't believe anyone here would have the nerve to say that after past predictions on this site about Bakken production have been so fantastically wrong!
I don't recall any prediction concerning the Bakken that has been proven fantastically wrong. Could you post the link to them so we may know just how fantastically wrong they were? Bakken production in October was 682,393 barrels per day so it is not breaking any records yet. And we do have a prediction that the Bakken will peak out at around 973 kb/d in 2017. Future production from U.S. shale or tight oil
And that prediction may be wrong. But it will by no means be fantastically wrong.
Ron P.
LINK
75,000 x 3 = 225,000 bpd. At the current 682K bpd (750K+ for all of ND), I think it's fair to say that prediction was "fantastically" wrong. By a factor of 3 ... so far.
Okay, I don't know who Piccolo is but he made this post in April of 2008, almost five years ago. I really think no one had any idea about how the Bakken would work out five years ago. What were your predictions five years ago? Got anything more recent? After all you did say predictions, meaning more than one.
Ron P.
And what makes you think anyone has any idea how the Bakken will work out five years from now?
I wasn't here 5 years ago. However, more than 2 years ago I said to YOU, Darwinian [emphasis added]:
So now that ND at 750K bpd is well, well beyond 400K and 500K bpd, it's payback time: Ahahahahahahahaha!!!!!
And from that same link, to show that even I was far too conservative, here's what I also said:
OK, do you get it now? Even a Cornucopian like me was way too conservative!
But wait - there's more! You yourself said in that same thread
At that time North Dakota production was at 300K bpd - LESS THAN HALF of what it is now! So there's another Bakken prediction that was fantastically wrong - YOURS!
No one listens to what abundance.concept says.
Anyone with an ounce of physical intuition can understand that Bakken wells are diffusion-flow limited. Even with the limited data that is available, the transient cumulative returns show the hyperbolic Fickian shape characteristic of diffusional flow.
http://theoilconundrum.blogspot.com
Obviously, petroleum engineers have worked through the math of flow rates. The issue is that they only advertise the successes and don't use the analysis to illuminate failures. Not being an oil person, I don't have those qualms.
The problem with abundance.concept is that he is math challenged. You can't go around chasing noisy data like he does and expect to get anything out of it except cherry-picked numbers. The models are the only means we have of generating real projections at the moment.
oh some of us listen , its good to see a counter point arguement on the Oil Drum , makes us go back and re check our facts
all I can say in reply to his rather emotional out burst is that, meh, 300Kb of more expensive oil isn't going to save the world , yet alone the US of A .
now if abundance.concept would like to comment on the EIA record , please go ahead
I did note that he didn't say Peak Oil is dead , like some have in the past ( I don't think they post anymore )
he should know that predictive models are just that, predictive, they change over time as new data comes in . If I go back far enough I'm sure I'll find one about North Sea Oil not being much of a play , if at all.
Doesn't help at all does it ?
so abundance.concept, yes. I'm interested in you prediction for Shale oil, Bakken, etc for the next three to five years
balls in your court.
Forbin
Maybe someone should. I don't agree with abundance's unbounded optimism, as of now, there is no data proving him wrong.
I underestimated the potential of the ND Bakken. I assumed that a few sweet spots would be drilled-up and that would be the end of the boom.
Current optimism may be overshooting reality.
What does your 'Fickian shape diffusional flow' model show for the next 12 months ?
My analysis forecasts 860k bpd from 6800 ND Bakken wells in October, 2013 and assumes the current rate of completions, about 165 per month, will continue for the next several months.
---- " What does your 'Fickian shape diffusional flow' model show for the next 12 months ?"
My analysis shows what it will be for the next 12 months.
That is what is nice about doing a quantitative analysis.
It is there for all to see and someone else can derive or verify the results if they care too.
Since we've been on the topic of Bakken predictions, let's see what WHT had to say about it some years ago, no?
August 13, 2005
Methinks they knew something you didn't. And who is it who had no clue?
2005. Those were the good old days, less than a year into when I started blogging about energy.
That time was wrapped up in mining data sources and reviewing oil depletion theory to try to make sense out of the whole thing.
Push forward a few years and sure enough, here we are at the bottom of the barrel, analyzing the remnants of a dynasty.
http://theoilconundrum.blogspot.ch/2012/09/bakken-approaching-diffusion-...
If you have something constructive to say, have at it. The model is available for perusal.
You didn't provide a link or enumerate your forecast.
ac - "And what makes you think anyone has any idea how the Bakken will work out five years from now?" It seems you are saying that current predictions of Bakken production, high or low, are no more valid than ones made 5 years ago.
I think one of the biggest problems with any prediction made for future production in any trend is that folks tend to leave out the most critical ASSUMPTION that must be the basis of any prediction: pricing. You have an expectation of X bopd some years down the road. You may be correct or not. But whether you or any other predictor states it or not any specific forecast assumes some price point. If you assume oil averages over $110/bbl for the next 5 years you might predict Y millions bopd. But if you were to assume the average is $60/bbl I have no doubt your forecast would be much lower.
Thus it appears much of the difference between different predictors isn't based so much upon drilling activity/productivity but pricing. Get that assumption correct and the prediction has some chance of being close. Guess wrong and it's unlikely the forecast will be in the ball park. Someone who predicted lower future Bakken production 5 years should have qualified that estimate with the pricing assumption. Had they said the Bakken would only be producing Z million bopd if oil prices averaged $60/bbl they would have had an out. Likewise someone who's predicting a significant increase in Bakken production should also be stating that BIG IF: if oil prices average so much per bbl. Thus the debate should initially center on that price prediction first IMHO. Otherwise the discussion collapses into apples vs. oranges...a waste of breath.
ac – What is it that prevents you from presenting your predictions/forecasts for tight oil from Bakken (ND)?
-Rune
There's nothing preventing me from presenting a prediction for oil from the Bakken. In fact, I already presented a prediction from 2+ years ago. And not only was I right, I was conservative. Is that not good enough?
If you want my next prediction, on Dec 11, 2007 on the peakoil.com forum, I said:
So there's my next prediction - which was actually made 5 years ago. For this prediction I'll ignore the Montana and Canadian sides of the Bakken and use all of ND production as an easier-to-track proxy. Beyond that, I have no idea. And neither does anyone else.
ND Bakken production is as easy to follow as ND total:
https://www.dmr.nd.gov/oilgas/stats/historicalbakkenoilstats.pdf
And for the record, I think the ND Bakken will make a run at 1 million bpd by 2015 and then stall out and begin to decline. My model assumes wells will be completed at the same rate and be of the same quality as the past year or so up to October 2012 (about 165 wells per month).
And so as to not get a ticket from the assumption police, my assumption has price, capex, and infastructure built in - about the same as has applied over the past year or so.
Am I the only one willing to make a specific forecast ? Hell, I could be wrong, I was wrong once before and that was when I thought I was wrong - but only mistaken. In other words wrong about being wrong. Rockman - he is never wrong, if you don't believe him just ask him.
Tony - " Rockman - he is never wrong, if you don't believe him just ask him". Mucho thanks for acknowledging my infallibility. Well, modestly let's just say near infallibility. But I can't take full credit and have to acknowledge the role of FACTS. Not that on rare occasions I get some of the details wrong you obviously can document how seldom I'm wrong. That and the fact that even with my huge ego I don't try to make numerical predictions. As Dirty harry says: "A man has to know his limitations".
Glad you took it good naturedly - that is how it was intended.
Tony - Of course. We just toss about opinions more than anything else on TOD. And I find that more interesting than playing fact checker. And opinions are never wrong IMHO...just some of us have different opinions. And besides I've been a petroleum geologist for 37 years so it takes a lot of serious/nasty rejection to bother me. LOL. I've been told my ideas were wrong more times then good. just the nature of the beast. Fortunately they were often wrong in that judgement. Which is why I'm still doing my thing while many of my cohorts/managers are pursuing other careers. It takes time for things to shake out but as I just posted elsewhere the oil patch has been slowly dying for the last 30 years. And despite the BS from the pubcos just about all of us have known it. The majority of geologists/engineers I know wouldn't have a job today if the pubcos hadn't jumped onto the shale plays/DW GOM.
It could be good to keep track of predictions to see how accurate they were based on certain assumptions. I would not go around beating up people because all their predictions were not perfect. Maybe some of the assumptions were different, maybe a factor came out of nowhere. The point is, one inaccurate prediction does not invalidate that person's opinions from here on out. They may get a lower batting average, but they are not out of the league...yet :)
CalGuy - "The point is, one inaccurate prediction does not invalidate that person's opinions from here on out." I fully agree. Also someone making an accuerate prediction doesn't mean they have a good understanding of the dynamics. For instance AC may have been correct in his prediction about the Bakken some years ago. But I'm not very interested in his numbers (or Rune's or anyone else's)unless I see the assumptions behind them. If he had predicted $100+ oil all tghose years ago I could understand his logic. Had he been assuming $60/bbl oil then his correct prediction would have been a fluke IMHO.
I still think some folks were too pessimistic in their predictions because they didn't anticipate how deeply the pubcos would throw themselves into the shales. I'll repeat it again: if it weren't for the shales high prices (originally for NG and now for oil) I doubt half the pubcos would still exist today. There aren't enough conventional prospect for companies like mine to develop let alone all those shale players. There are thousands of small non-public oils in his country and you're hard pressed to find more than a few in the shales.
Speaking in baseball terms (you started it LOL) many know babe Ruth was often the home run leader. many don't know he often had one of the highest strike out stats. Home runs are great...when you hit them. predictions are great when you're correct. they're even more impressive when you make that prediction based on logical assumptions.
I don't recall exactly, but I believe I was probably assuming that the going price at the time (WTI high $70's) would generally continue for some while.
And yes, if the price of oil crashes anytime in the next few years and stays down for a while, of course you'll see drilling pulled back and production increases moderate, maybe even reverse.
ac –
Further up you stated your prediction of 1 Mb/d (tight oil, Bakken (ND)) sometime in the future.
That prediction must have been based upon some assumptions, like:
That should be some easy ones to answer.
- Rune
I see. So the trick is, now that I've made a successful prediction 2+ years ago - which happened to be completely contrary to what most people on this site believed - in this new prediction, the game is to get me to provide as much detail as possible, so in the event my new prediction becomes correct, I'm bound to get one or more of the details wrong, which will give you an opportunity to invalidate the correct prediction.
Well I'm sorry, but I'm not going to play your game. So far, my intuition has proven far superior than all of the number crunching and analysis anyone on this site has done in the past regarding the Bakken. That being the case, there's no reason to change my formula, is there.
The prediction is 1 million barrels/day for the state of North Dakota. Guessing the timing is extremely difficult, so I'm not going to try. Could be 1 year, could be 5 years, who knows. The only thing that will nullify my prediction is if the price of WTI falls below about $60 and stays there for more than about 4-5 months, before the 1 million bpd mark is reached. That's it.
AC, it seems to me that you have more than earned the benefit of the doubt re Bakken! Yes, TOD commenters were all very pessimistic about tight-oil production, as far as I recall. BTW, how does your 1 million forecast tie in to EIA's most recent outlook for tight oil to max out at around 3 mbpd for the US as a whole?
The EIA has been known to be wrong. See my reply above, with graphic. Whether or not their latest prediction meets the same fate, I know not.
Abundance.concept:
Where is your model of Bakken production flow?
Do you understand the physics?
What you are selling is similar to the huckster that sells perpetual energy. If people would simply apply first-order physical models, they could begin to understand the limits.
Where is your model of Bakken production flow?
I use a proprietary model known as the Binary Reductive Associative Inverter Nodule
Do you understand the physics?
Yes.
[edit]
In practice, the scenario of billions and billions of molecules making their way through a disordered substrate becomes a prime candidate for statistical mechanical modeling.
Yet, does this modeling make you money? Does knowledge make you money? If you and a competitor have the same access to the knowledge, it may not help either one of you.
Aye, there is the rub. Making money on investments is about keeping your adversaries in the dark.
So keep at it abundance.concept, we know your game.
ac - Please don't take this as criticism but that was my point. Looking back had oil held at $70/bbl do you think we would have had the increase in the Bakken we've seen? Or if oil dropped to $70/bbl tomorrow and held for a couple of years would we see the same rig count in 2014? Perhaps you didn't fix that $70/bbl in your mind but subconsciously you were expecting higher oil prices in the future.
I was serious: I couldn't care less about how much or how little someone predicts for future production in any trend. What interests me (and may enlighten me) is what assumptions are made to create that prediction and the support for those assumptions. I can easily predict a big increase or decrease in Bakken production depending on what the future price of oil will be. Take your projection: if you assume oil would drop to $60/bbl and hold for a couple of years wouldn't you lower your prediction significantly? And if you thought oil would hang in there at $110/bbl for a couple of years wouldn't you consider your current prediction a tad pessimistic? As I said I don't really care what production numbers you or anyone else predicts but the rationale behind it...that the interesting conversation IMHO.
It increasingly appears as ac is not around on TOD to provide meaningful input to an informed discussion.
That people make predictions based upon supporting evidence and logical reasoning makes it possible for other readers to both engage in a constructive discussion and help them understand the rationale behind the predictions.
This is called transparency and moves the discussions further.
When they become evasive or do not show any sign to elaborate on their positions when posted a professional, logical, rational question, the only thing they achieve is to draw skepticism towards themselves.
- Rune
When a website such as this spends years writing long and elaborate articles on the Bakken - and time and time again is consistently wrong, underestimating it by large factors - people who write yet another article attempting to make yet another prediction on its future potential, deserve every bit of scorn and ridicule thrown at them.
ac,
That was very constructive and informative!
Since you apparently has such great talents, why not share your insights and rationale with others or write articles presenting your case.
- Rune
Thanks for adhering to site guidelines and keeping the conversation civil.
A peaceful and creative new year to all!
Kate
I dont think that abundance.concept realizes that Rune had painstakingly parsed out the data from PDF files to be able to make sense of the numbers.
Obviously, the state of North Dakota has much more raw data that they could conceivably make available yet they choose not to.
I take it as a challenge not to require all that data; information theory can full in the gaps, and they can't hide the decline forever.
Cheers
If I am proven wrong I am wrong.
As of now, no one is either proven wrong or right, which should call for some restraint in the phrasing. The next few months/years will provide the answer.
As you point out the State of North Dakota has all to gain to keep the activity going. They receive taxes directly from the production and from employment which results in both direct and indirect taxes and is likely to come out of this with profits without risking much.
Those who really have put their money at risk are the owners of the oil companies. Oil companies are in it for profit. Oil companies will stay in the game as long they see possibilities for profits. The oil companies make their decisions on informed expectations which include what they expect of return from a well. If the oil companies gains experiences that tell them to slow it, they will.
- Rune
Really don't know. $70/barrel would seem to be a sort-of gray area. However, given that we were seeing rapid increases in ND production 2+ years ago when prices were in the $70's and $80's, it doesn't seem to me that that price level is a deterrent to rapid increases in drilling and production. At least it wasn't back then.
Again, $70 could be a gray area. Wouldn't be surprised at some cutbacks, question is, how much? $60 seems to be a clearer threshold, as I said in my prediction:
For my 1 million bpd prediction, I'm largely assuming oil prices will bounce around current/recent levels. $80's and $90's, maybe some dips into the $70's.
FWIW, it's becoming increasingly obvious all this extra oil at some point will overwhelm the system so much that the price will tumble, and for quite a while. The US and Canada could become the Saudi Arabia of 1985-86. The only question is, will this happen before or after my 1 million bpd prediction is reached? That's why I included the "out" about oil falling below $60.
"all this extra oil"
Just a reminder - regardless of what happens regarding Bakken extraction, there and everywhere else, depletion never sleeps... Not sure all that 'extra oil' will do more than modestly mitigate the decline.
A news item from back late November 2012 that may be of relevance for Bakken (Whiting has lots of wells in Bakken).
Whiting Petroleum Explored Sale
Rune - might say something about their lack of faith in the play...or not. Many companies having been putting their oil production up for sale but typically for too high an asking prices hoping for some fool to come along and pay it. Which does happen sometimes during a boom period.
I know this will defy logic but there's a shorthand approach to estimating what oil production will sell for in the US. Take the net daily production rate bopd (production less royalty and production taxes) times $60,000 to $100,000. So a field netting 100 bopd will likely sell for $6 million to $10 million. Notice I said that's what he production will sell for...not what its worth. Often there are undeveloped asset values that drive the price to these levels. But there's always some risk aspect to those unproved reserves as well as the additional capex expense.
ROCKMAN,
How does your shorthand approach factor in steep decline rates?
- Rune
Rune - that's the crazy thing: the details often don't matter very much. Like I said it's such a simple unqualified metric but run the numbers you see in press releases about production deals that close. Make sure you use net bopd. Again it's not indicating what a field is worth. About a month ago we put a $24 million bid in on a 700 bopd field based upon a detailed analysis. That would allow us an acceptable ROR and factoring in a bit of risk. But at $60,000/bbl/day it would calculate to $42 million. Last I heard the high bid was $51 million ($72,000/bbl/day).
The task isn't so much estimating what the production is worth but using that meatball estimating guide and then figuring out how to make the acquistion work in that projected range. If you can't see that happening then it's typically a waste to spend anymore time on the project. Rarely have I ever underestimated what a property eventually sells for.
BTW: biding high based on the hope that oil prices will rise to make the economics work is a fools game. You don't need to saddle yourself with all those operational head aches. Just go buy some oil futures.
ROCKMAN,
Appreciate your answer.
the details often don't matter very much.
I have seen many cases where the devils are buried in the details.
In the assessments I have been involved in it has all been about the flow versus time.
And as always to make money you need to buy as cheap as possible.
- Rune
More news on tight oil in Bakken
Chesapeake Drills Unsuccessful Wells in Southwest ND.
Rune - Fate of a pioneer: sometimes he gets the cheap land...sometimes an arrow in the back. LOL
EOG resources is trying a pilot water injection project in Parshall Field. Injection has been ongoing since April. The only response so far has been increased water production and decreased oil production in nearby wells(as reproted to the ndic).
That project isn't over as the operator plans to let the water 'soak' and then put the current injection well on production. This is apparently an 'imbibition' waterflood.
EOG also started a separate pilot injection project in October a few miles away. No response is apparent, as yet.
Filloon thinks it is a success:
http://seekingalpha.com/article/964181-bakken-update-williston-basin-est...