| Tech Talk - The BP View of the Future | The Oil Drum | Is the Typical NDIC Bakken Tight Oil Well a Sales Pitch? |
Tech Talk - OPEC and EIA Short-term Projections
Posted by Heading Out on April 28, 2013 - 5:13am
Just this month, Saudi Aramco announced that production had begun at their Manifa oilfield, and by July would be supplying up to 500 kbd to the new refinery that is being built at Jamail with the collaboration of Total. The first oil from the refinery is expected to ship in August, and both projects are currently ahead of schedule. Manifa will further increase in production next year, to 900 kbd, with the additional flow going to the Yanbu refinery being built with the collaboration of Sinopec. Both these refineries are designed to take heavy crude, and can also accept oil from the ongoing projects to expand production at Safaniya. Collectively this is said to ensure that the company will be able to achieve a maximum sustainable production of 12 mbd.
The gains in available reserves are required as the current production from Ghawar and the other major fields in the Kingdom continue to decline in production, as was discussed last year. I remain relatively convinced that Saudi Aramco will not increase their crude oil production above 10 mbd, despite the wishes and projections of others that they will end up doing so. By the time that their domestic consumption reaches the point that it lowers exports to a level that would hurt the KSA economy at current prices, the shortages globally will have raised the price sufficiently that the available production at that time will continue to suffice to meet their needs. (This is, however, a projection only for this decade).
This month’s OPEC Monthly Oil Market Report continues to anticipate a significant increase in available crude over the next three years, although this is indirectly recognized through the growth in crude distillation unit (CDU) capacity around the globe in that interval.

Given that the world must increasingly deal with a heavier crude supply, the need for new refineries, as exemplified by the new Saudi construction, is evident. Increased demand to absorb this supply will come, in part, by an increase in the growth rate of the GDP of the BRIC nations, although the poor growth in the developed nations continues to hamper their export markets.
Overall demand is still anticipated to increase by around 0.8 mbd, with half of that coming from China and the rest of the non-OECD nations contributing an additional 0.7 mbd, offset by a decline in demand from the OECD nations of around 0.3 mbd, taking global demand, by the end of the year to nearly 91 mbd. Internal demand in the Middle East will continue to sap a fraction of this relative to exports. Overall the Middle East demand is anticipated to increase by 280 kbd, though the impact of the turbulence in various nations is hard to estimate.
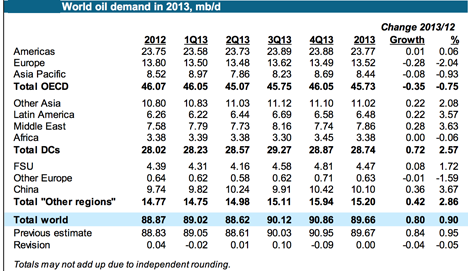
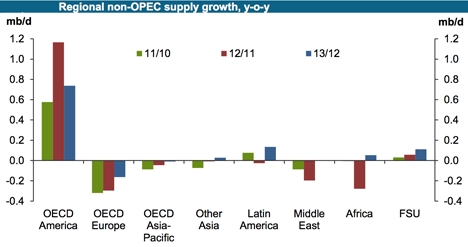
Virtually all the growth in supply is anticipated to come from North America, with a slight increase in production from South America coming from Colombia and Brazil. There is some concern, however, over the impact of attacks on the energy structure in Colombia.
For the US the OPEC report has the following projection:
The expected growth in 2013 is supported by the anticipated supply increase from shale oil plays in North Dakota and Texas, as well as by minor growth from other areas in Oklahoma, Kansas, Colorado and Wyoming. The infrastructure situation is improving in North Dakota, with reports suggesting that the railroad loading capacity will reach 1 mb/d. Eagle Ford oil production in January continued to increase from the same period a year earlier. On a quarterly basis, US supply is expected to average 10.57 mb/d, 10.62 mb/d, 10.56 mb/d and 10.55 mb/d respectively.
Canada is expected to reach a production total of 4 mbd by the end of the year, with the largest impact coming from the Kearl Oil Sands production anticipated to bring 110 kbd to market in the third quarter. (This is not dependent on the Keystone pipeline.) Mexico will see a slight decline in production though the Kambesah field (at 13.7 kbd) and increased production from Tsimin will offset most of that.
OPEC is anticipating that Norwegian production will fall 110 kbd this year, with a small decline of 40 kbd in UK production. OPEC expects that Russian production will increase to average 10.43 mbd in 2013, slightly down from first quarter numbers, while, in anticipation of Kashagan production, OPEC expects Kazakhstan to increase production to 1.67 mbd. The decline in production from the Azeri-Chirag-Guneshli field is expected to cause a slight ( 50 kbd) reduction in Azerbaijan production.
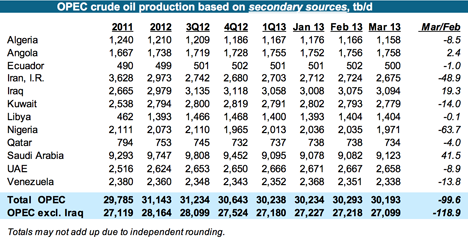
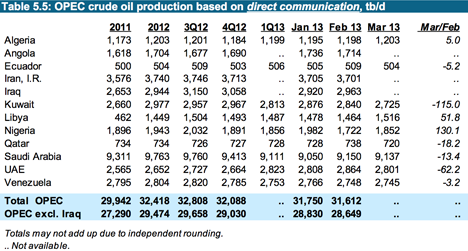
There is, as previously, some difference between the production that the individual nations of OPEC report each month and that reported by secondary sources.
In short, over the course of this year OPEC remains relatively complacent that North American production gains will continue to meet the global demand, and that OPEC (i.e. largely the KSA) can back away from full production in order to balance supply and demand at a price level that keeps the OPEC bankers happy.
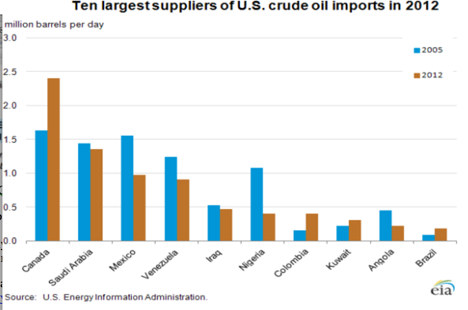
Back in March the EIA TWIP noted the change over the years, not only in amounts, but also in the sources of US imports, which remain significant. There has been quite a bit of change since 2005, when imports were at their highest level (10.1 mbd).
The EIA anticipates that US liquid fuels consumption will remain sensibly stable through the end of 2014, ending that year at 18.61 mbd. At this time production is expected to rise to 11.75 mbd.
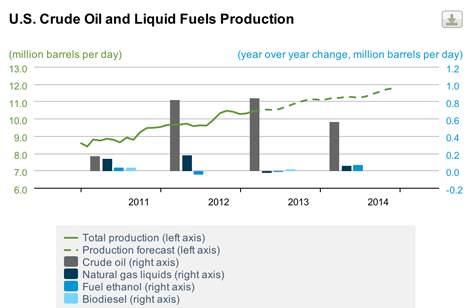
In that interval they anticipate that the price of gasoline in the United States will slowly decline. In contrast with the reports by the major oil companies that were discussed recently, these forecasts are short enough that it will be fairly quickly evident how accurate they are.
Contact
- Content: editors at theoildrum dot com
- Tech support: support at theoildrum dot com
License

This work is licensed under a Creative Commons Attribution-Share Alike 3.0 United States License.
How long will Canada increase their oil sands output? Or, how much willing are they to make sure they do increase output into the future?
The shale dream/nightmare also has its limits. The optimists says the dream will grow far into the future.
The pessimists think the nightmare will end soon.
How long will Canada increase their oil sands output? Or, how much willing are they to make sure they do increase output into the future?
In theory, given the fact that the oil sands are the size of Florida, Canada could increase its production to exceed that of Saudi Arabia. In practice, environmental and political considerations will probably restrict production rates long before that. The oil sands operations are already big enough to scare the wits out of people, and increases will scare them even more. Most likely the curve in PetroSlurp's comment is realistic and Canadian output will peak out at 5 million bpd or so.
The elephant in the room for Americans is, "How much of this oil will go to the US?" since Canada is now exporting more oil to the US than it consumes itself. Canadian politicians are very annoyed with the US for delaying tactics on pipelines which have resulted in low prices for Canadian oil companies, and consequently low tax and royalty receipts for Canadian governments. Chinese state-owned companies have quietly bought up a lot of the Canadian oil sands, but no doubt would like to ship their oil to China rather than the US.
The interests of Canadian companies, Canadian governments, and the Chinese companies and government coincide on this issue, so I think that in the long term the objections of environmentalists and native groups will be overcome by the amount of money on the other side of the debate, and much of the oil will eventually go to China.
The way I see it, North American production until 2015 is set to rise and then essentially stagnate, which even the optimists accept as a premise. Canada might increase it over the long haul but it'll take 15 years or so to increase it maybe 1.5 mb/d.
From 2015 onwards it's essentially all about Iraq and Brazil. China's fracking for their own tight oil is not going that well, in large part because they will have difficulty finding all that water. America has far less people per square mile, so it has much more resources per person than China has to throw at the problem.
Including water, of course.
Brazil is not doing well at all and has essentially stagnated completely the last 5 years. Iraq is still increasing but almost daily now we see more news of ethnic and sectarian conflict. The government is even using helicopters bombing villages with the 'wrong' kind of muslims in it(it's still a matter of Shia vs Sunni in Iraq, only that the majority now rule the government which was the opposite under Saddam). Still, it's still a 35-40% minority that's being increasingly discriminated against.
Some people believe that we'll see a resumed civil war in Iraq this decade. I'm still betting against that, because of the vital necessity it plays to the oil markets. China is now the most important foreign power in Iraq, not America and China needs that oil. Still, what might happen instead is a slowing of oil coming from the spigot. But the thing is.. the only thing that is new these past few years was North American(really, American) tight oil.
We've known about Iraq's capacity for years now. We've known about Brazil for years. Both are underperforming. Iraq wanted to get to 10 mb/d by 2020. Now they'll be lucky to get to 5 mb/d (they're slightly above 3 mb/d right now, but their own internal consumption of that oil is rapidly increasing, something many are forgetting). Brazil as previously stated has totally stagnated and they will not deliver.
Basically what was happened is that tight oil saved us post-2008 Great Recession. It's still too early to tell if that was a temporary thing, but I'm leaning on it. However, I'm not necessarily subscribing to the total doom camp, but I think that while many underestimated peak oil up to 2008, many has since become overly optimistic and even arrogant.(Hence all the 'peak oil is dead' stories that are now flowing about).
China has more gas shales than they have oil shales. Russia has the largest oil shales, while China has the largest gas shales.
Brazil is difficult to have an opinion on, some sources say they will reach more than 3 mbpd, others think they will hit peak very soon.
I saw a graph where someone had pointed out that Brazilian oil production would hit a sharp decline around 2020, but I cant find it.
-
Iraq probably has a lot of potential, but they are having trouble stabilizing the country. I saw a very interesting graph of African production though:
Considering analysts say both Russia and China will peak in 2020, we'll get a rough future in the coming years.
Your chart does not accurately represent Brazil's current or past production.
Petrobras oil output in Brazil falls 3.9 pct in March
I put "equivalent" in bold because Petrobras is not producing 1.85 mb/d of C+C but likely between 1.7 and 1.8 mb/d. Brazil peaked, so far according to the EIA, in January of 2012 at 2.231 mb/d and have fallen almost every month since that date.
Your chart does not show that peak nor the subsequent decline of over 300,000 bp/d since that date. Your chart does show Brazil producing 3 mb/d by 2015. I think that is laughable.
Ron P.
Yeah I dont think most charts made are accurate, especially when it includes the future. Its important to look at the long run, not small increases or decreases. They have not just fallen since January 2012, but gone up and down: "Petrobras said oil production in the country reached 1.94 million barrels per day in October, a 5.3 percent increase from the previous month." That said, I dont disagree with you, Brazil is most likely going to have difficulties keeping up production, even though it has many field developments still to come.
Either way, these fluctuations are minimal compared to the overall Iraq and North American increases.
Here is Brazil by ASPO Ireland (Campbell?)
It seems to me that whoever's figures you take, whether optimistic (less cornubiotics) or pessimistic the play is roughly:
2020 - we'll know which way we are going
2050 - there will be decline of one extent or another
2100 - game over
Am I far out? Isn't it about time real plans were made given it may take 50 years to get a reasonable amount of alternatives into place?
NAOM
Yeah I'd say you are about right. However I would refine it and say:
2015-2020: we'll have an idea of how fast and far we are declining
2020-2050: decline sets in
2050-2100: game over on global industrial civilization
Personally and collectively then we have rest of this decade to sort our affairs as much as possible, move somewhere Transit oriented, or somewhere self sufficient. Get that PV up on the roof.
And as Westexas said; 'to get ourselves on the non-descrestionary side of the economy'
Try:
2000-2010 : G8 governments have a pretty good idea of the decline curve, when, how much, etc. They also have a pretty good idea of how unequal access to oil (via money, rationing, national-first, etc.) will distort the amount available to them ('lands modelling). Production is essentially plateaued.
2010-2020 : It become obvious to others roughly how things are going to go, first the interested, then the general populous. At some point long term financial gamblers start making big, long term shifts as a result (companies fail, pensions fail). Production tends to trend downwards, but with 'lies, damn lies and statistics' hiding the extent and form of the fall. National security apparatus is enhanced as those in power seek to maintain it.
2020-2030 : Peak oil has gone from 'a future problem' to 'well of course it's happening' without much inbetween, and people recognise how unequal distribution effect collapses economies hard'n'fast. People agitate for other access control/sharing mechanisms, not just cost, whilst exporters cut production via slowed new projects, accidents, etc. and make powerful friends (who get first dibs in exchange for military muscle). Eventually you get the first invasion for oil, transnational revolutions and a general retreat from a globalised world. Decline goes from 'dealable' (<2%) to 'general civilisation killing' (>4%) although the unequal distribution aspect means it's been killing civilisations since 2005.
2030-XXXX : Post Peak, Post Oil, Post Globalisation - we are in an age when local is the thing, with societies trying to form sustainable models in what's left. The big die off occurs.
Yeah, I would say you are a long way out. Today we know which way we are going. 2017 we will be in decline. 2025 game over.
Ron P.
Ron, I don't want you to nail on that quotation, I just want to fuel a bit the discussion: You wrote in an earlier discussion you were 90% sure that april 2012 was the global peak date. So things might develop even faster?
Doomers have always been picking early dates. Its like they want to see it go down ASAP. Campbell predicted 1998 as peak when he first set a date. Now we're in 2013 and have never produced more oil. Iraq is increasing, Kazakhstan is increasing, Colombia is increasing, the US and Canada is increasing, Iran is under sanctions and can produces a lot more... I think its still too early to set an exact date, but this half of the century is probably accurate. It all depends of the success on unconventional production and how much the financial crisis develops into further mess. Perhaps a peak around 2025-2030 and a slow decline ten years later.
Yes I think 2012 was likely the peak. But a fast decline will not begin, I believe, until 2017 or around that time. Production in 2013 will be pretty close to 2012 and production in 2014 will be only slightly lower.
Predicting the future is a very inexact science at best. But high oil prices have brought out heroic efforts by every nation to produce more oil. And now those efforts are starting to peter out. But it will all be over when that tight oil goes into decline. And what's more it will be quite obvious to everyone that it is over.
Ron P.
People have been saying that for years. Will you predict a decline in 2021 when nothing happens in 2017?
Of course, "Something" has already happened regarding Global & Available Net Exports:
And to the extent that we have seen slight (3% to 5%) increases in global C+C and total liquids production from 2005 to 2012, it's quite likely that it was primarily due to increasing liquids production from natural gas sources and from biofuels (regarding total liquids).
The only thing in the last few years that has caused me to adjust my thinking has been the tight oil in the US. We'll know fairly soon, I think, how much difference US tight oil is going to make. I've never been a doomer, because I've always said that there is a massive amount of wasteful oil consumption happening and that high prices will squeeze that out - although the changes that people have to make involve moving house or job and getting a more fuel-efficient vehicle, so the adjustments are ones that take months or years rather than days or weeks.
Some things to keep an eye on:
(a) "Saudi" Arabia. Now that Manifa is in production, there will be nowhere to go but down. Most of the general public believes that "Saudi" Arabia is floating on oil and will still be producing and exporting* massive amounts for the next century. Rising US tight oil production will allow them to mask their geological limitations for the time being through voluntary production restraint, but truth will out in the end. We also know that the way Ghawar is being exploited means production from it may collapse suddenly rather than tail off.
(b) Russia. A massive number of oil fields came into operation in a short space of time, courtesy of Boris Yeltsin handing fields over to the oligarchs (or merely turning a blind eye while they helped themselves, which had the same result) in the 1990s. This increases the risk that the down side of the production curve turns out to be just as steep. Russia is the one place on Earth where I fear that "up like a rocket, down like a stick" may apply to conventional oil (we already know it applies everywhere to tight oil and deepwater).
(c) The Bakken. This is the most advanced of the large tight oil plays in the US and its fate will show how the others will turn out. There are already signs that the predictions of the tight oil boomers are not being upheld in reality and that production from the Bakken will top out soon. The evidence is far from conclusive yet, but the ultimate production rate from the Bakken is one of the biggest variables in making predictions for future oil production.
As I said, I'm not a doomer. I see a relatively slow decline in global oil production once we come off the plateau and much scope to adjust to lower production rates. If (a), (b) & (c) all go pear-shaped, the decline will be more rapid at first, but won't continue on at that rate.
* Yes, that's a reference to the Exportland Model. Westexas has made sure we're well aware of it by now.
If world crude oil production reached a plateau (area of the peak) in 2005, the plateau is symmetric around the peak and the average production during the plateau is 74 Mb/d, then:
(year)
(year)
(Gb)
(Gb)
For comparison world total C+C production is currently about 1.2 Gb. I suspect the peak in 2020 is unlikely because it implies a rather high EUR.
If enhanced oil recovery causes the global peak to occur after 50% of the URR is extracted, then I expect the plateau to be a little asymmetric around the peak. It should be longer on the rising edge and shorter on the falling edge by a few years. If the peak occurs when 60% of EUR is extracted then the table might be:
(year)
(year)
(Gb)
(Gb)
All of these EUR's are plausible.
UK production is forecast to rise by a third over the next few years due to investment. A new oil boom is predicted by the Scottish Government. Surely if production can rise like this in a mature area like the North Sea there must be potential for this to happen in a lot of mature areas and cumulative effect could be substantial?
A forecast for a rebound in production may or may not turn out to be correct (I was tempted to say that I was forecasting that I would soon be as rich as Warren Buffet). Although we have certainly seen a strong rebound in US production due to onshore tight/shale plays, in my opinion it is likely that we are seeing a post-1970 "Undulating Decline" in US crude + condensate production.
In any case, regarding the UK, the EIA shows that offshore UK Crude + Condensate production peaked at 2.6 mbpd in 1999. 2012 production was down to 0.86 mbpd, a 13 year decline rate of 8.5%/year. The 2011 to 2012 year over year decline rate was 16%/year. So, while government officials can continue to think happy thoughts, recent data show an accelerating rate of decline in production.
A lot of things have been predicted by the SNP; and they look to be running on a very low success rate, with most of their 'predictions' being far out, wishful, thinking.
I doubt this prediction is any different, and so do the OBR :
http://www.guardian.co.uk/politics/2013/mar/20/salmonds-scottish-oil-boo...
To be additionally fair, the OBR's prediction success rate is also appalling,
Peter.