The Carbon Economy
Posted by Stuart Staniford on January 30, 2006 - 4:15am
One of my goals in my peak oil studies is to understand the whole system of planet+economy as best I can. I want to develop an informed opinion on what humanity's options are as it faces these interlocking crises-in-the-making. That's obviously an enormous task. The relevant disciplines include at least geology, petroleum engineering, economics, sociology, urban planning, international development, climatology, demography, political science, mining engineering, military strategy, archaeology, history, chemistry and chemical engineering, physics, statistics, biology, ecology, agricultural science, and electrical engineering. No-one can hope to master all these subjects to the point a specialist in them would know them.
And yet it seems to me that, while accepting this limitation, it's worthwhile for a few generalists such as myself to attempt to try to understand the situation as deeply as possible in all aspects; it may be that new ideas and insights can only come from deeply integrating a number of the important perspectives. Only time will tell.
In that spirit, I'm trying to understand the carbon cycle and in particular the current carbon flows in the economy. I have two goals - one is to better understand the debate over the viability of biofuels. The other is to better understand whether we have any real options over climate change other than just suffering the consequences of our collective fecklessness. Either way, I can never make any sense out of any debate like this until I start to understand the relative sizes of the flows involved, and the trends in them.
Let's start by looking at the overall planetary carbon cycle, which is summarized in a nice graphic from the Wikipedia. (I also recommend the more detailed version in the 2001 IPCC report).

Earth's carbon cycle with stocks in Gt (Gigatonnes), and flows in Gigatonnes/year. Click to enlarge. Source: Wikipedia. Click to enlarge.
The black text represent the stocks of carbon in the system in gigatons (billions of metric tons/tonnes). To give you a feel, one gigaton of carbon is the amount of carbon in about 8-9 gigabarrels of oil. So when the world is currently producing about 30 Gb a year of oil, that is a little less than 3.5 Gt of carbon (just in the oil), most of which is released into the atmosphere in the form of CO2. (However, the quoted weight is just that of the carbon in the CO2, not the oxygen chemically bonded to it).
There are 750 Gigatons of carbon in the atmosphere, an enormous 39000 Gt or so in the ocean, about 610 Gt in vegetation, and another 1580 Gt in soils. Finally, there is a huge amount in the earth's crust.
Actually, the atmosphere is likely up to about 800 Gt now - the Wikipedia's numbers are a little out of date in this and a couple of other respects, as we'll see.
Anyway, the purple lines and numbers represent the flows in the system. We'll focus on the flows in and out of the atmosphere, as that's where our big problem is. Carbon leaves the atmosphere through two main routes, the ocean, and vegetation. The ocean exchanges about 90 Gt/year with the air, but there's a net sink of about 2 Gt/year. This is because humans have increased the CO2 concentration in the air, the ocean is not in equilibrium with it, and there's a net flow into the ocean (which should increase further as atmospheric concentration goes up further).
More interesting is the exchange with the biosphere. Plants absorb about 120 Gt of carbon/year and turn it into sugars via photosynthesis (and then onto other materials). This is the gross primary production of photosynthesis in the biosphere. Of this, the plants themselves burn about 60 Gt of carbon (in the form of sugars) to power their own operations, so that is released out into the atmosphere again immediately. The remaining 60Gt or so is called the net primary production. Almost all of the net primary production ends up going into the soil (a small amount passing through some animal on the way), but humans use and burn some of it. The soil releases back pretty much all of the carbon influx through the action of decay organisms. The (biosphere+soil) system as a whole is pretty much in equilibrium with the atmosphere, but not quite. According to the 2001 IPCC report), there is a net release overall of 0.2Gt/yr of carbon from the (biosphere+soil) because of the actions of humans (but there has been considerable uncertainty on this issue historically). Again, these numbers are a little out of date (more below).
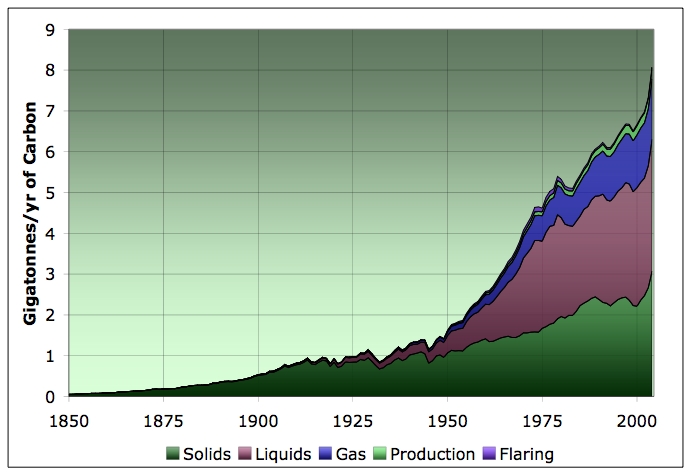
Since 610 Gt is stored in the biosphere, about 20% of the carbon there turns over annually - this represents a weighted average of annual crops and weeds together with redwood and bristlecone pine tree trunks. The main net flow into the atmosphere is that 5.5 Gt/year in fossil fuel burning that the Wikipedia has. However, this next graph contains more accurate information with the trend over time:
Carbon emissions in Gt/year 1850-2004. Click to enlarge. Source: ORNL through 2002. 2003-2004 were estimated by scaling the 2002 numbers by the appropriate percentage increases in coal, oil, and natural gas from the BP annual production numbers.
As you can see, we are at 8Gt/year now, and climbing fast. I started with this graph that goes back all the way to 1850 so you can get a sense for how much of the emissions have been since 1950. I also want to draw attention to the fact that this net flow is not yet enormous compared to the exchanges in the system - eg it's significantly smaller than the 120 Gt that runs through the biosphere each year (although as we shall see, it's quite a bit larger than the amount of carbon entering the economy from the biosphere currently). Let's now focus in just on the timeframe since 1960:
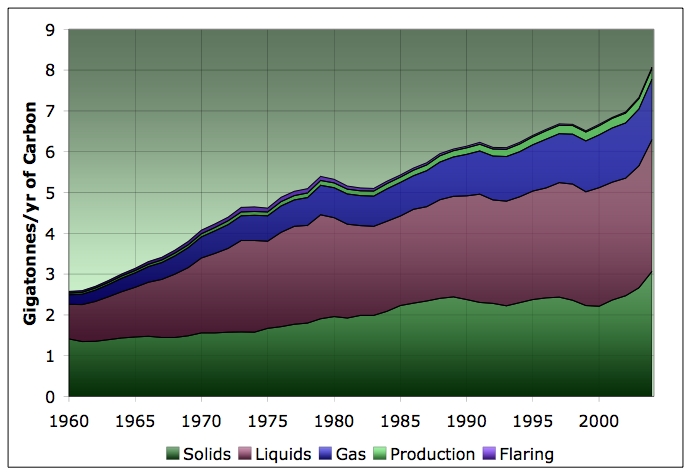
Carbon emissions in Gt/year 1960-2004. Click to enlarge. Source: ORNL through 2002. 2003-2004 were estimated by scaling the 2002 numbers by the appropriate percentage increases in coal, oil, and natural gas from the BP annual production numbers.
The big uptick in Chinese coal production is very clear after 2000, and the big run-up in oil production from 2002-mid 2005 adds to it. As you can see, the implementation of the Kyoto protocol is not having a dramatic effect on the overall world emissions yet - the trend is going exactly in the other direction. We'll take up Kyoto further in a future post.
Before we move onto looking at how much impact this has on the atmosphere, let's briefly discuss how we might extrapolate this into the future. Obviously, peak oil is going to have an effect on the oil piece of the picture. However, since I currently favor the slow squeeze idea, I think that, while there might be a significant transitional reduction in carbon emissions due to peak oil, over the decades-long timescale we'll see the carbon emissions continue to grow. Initially, natural gas will take up some slack, but the big issue is this:

Ten countries with the largest 2004 coal reserves, in Gt of coal. Click to enlarge. Source: BP.
As you can see, with 1000 Gt of coal reserves (which is probably somewhere in the range of 600-800 Gt of carbon), we can keep up a high rate of emissions for a long time to come. And then there's the tar sands, Orinoco belt oil, oil shale, 3000 Gt of coal under the North Sea, etc. These sources are capital intensive, so they cannot be exploited quickly. But slow declines in oil production will allow them to be brought online as alternatives. And at a minimum, I think we have to assume that the Chinese can keep up a healthy rate of growth in their coal production (running at 10% annually recently). Furthermore, to the extent coal displaces oil, coal has more carbon per Joule of energy than oil. As many of us have studied, energy usage is very price inelastic and tends to have income elasticity close to one - so it grows with GDP and it takes an awful lot of price to change it much. Similarly, this inelasticity corresponds to enormous political resistance to reducing fossil fuel usage.
All in all, keeping it simple, I'm just going to assume that we can linearly extrapolate the trend of the last 45 years into the future for a "business-as-usual" scenario where the world make no effective attempt at emissions control. I've also put in an exponential extrapolation, and the line that would happen if the world could keep fossil fuel emissions constant at the 2004 value.
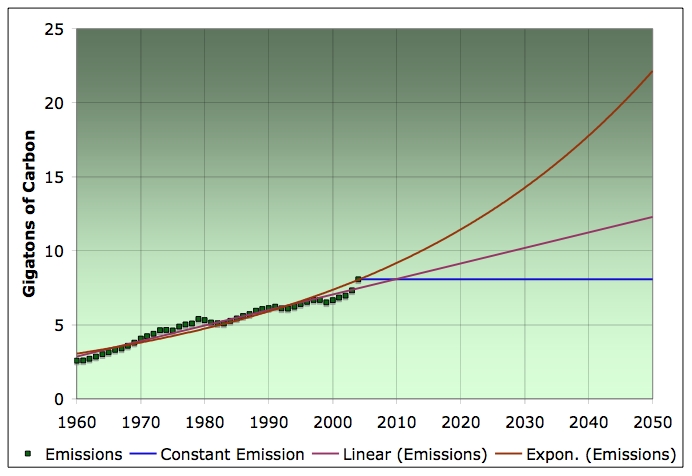
Carbon emissions in Gt/year 1960-2004, together with linear, exponential, and constant extrapolations through 2050. Click to enlarge. Source: ORNL through 2002. 2003-2004 were estimated by scaling the 2002 numbers by the appropriate percentage increases in coal, oil, and natural gas from the BP annual production numbers.
Obviously, there is a great deal of uncertainty here, but the linear extrapolation is probably as good as any other. At any rate, the area under that purple curve is significantly less than the world's existing coal reserves alone, never mind the alternative hydrocarbons. So there's no physical barrier to humanity releasing this much carbon. The exponential curve would use up all the existing reserves of coal by 2050, so we'd be mining for coal under the ocean. Hence it's probably a very generous upper bound on what the economy could actually do. Similarly, the constant (blue) line seems quite hard to square with the implications of Chinese cement production. The global economy is not on track to control emissions like this any time soon.
The effect of burning this stuff is as follows:
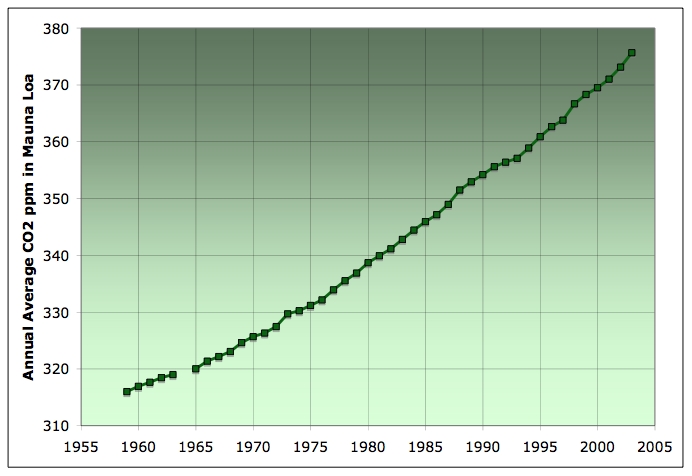
Annual average concentration of CO2 in the atmosphere since 1959 as measured by Keeling et al in Mauna Loa, Hawaii. Graph is not zero-scaled. Click to enlarge. Source: Keeling via ORNL.
Now, the mass of the atmosphere, according to the Wikipedia again is 5.1 million gigatons, and almost all of that is well-mixed on the relevant timescales. So we can take those measured percentages, and convert them into a net uptake of carbon by the atmosphere. (If any reader should decide to check my calculations here, remember that the ppm numbers are by volume, and you have to correct for CO2 having higher molecular weight than the other species in the atmosphere, and you only want the tonnage of carbon, not CO2).
So then I get this graph. The green line is the fossil carbon emissions, the plum line is the net addition to the atmosphere according to the CO2 measurements, and the blue line is inferred difference - the sink of CO2 because the atmosphere is out of equilibrium with the other components of the system (together, possibly, with any net effect of humans on the biosphere).
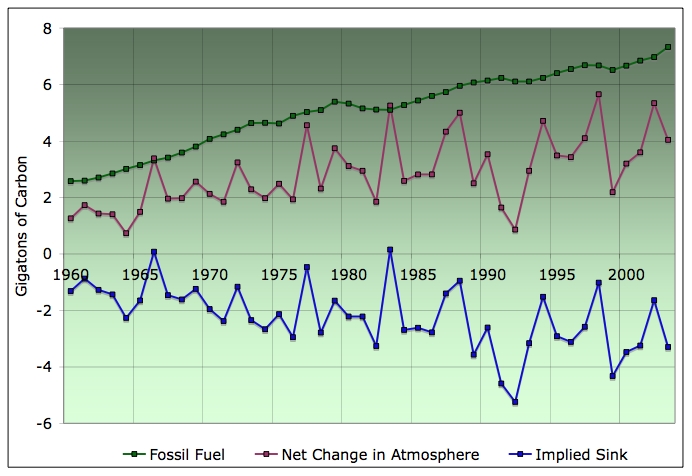
Carbon emissions in Gt/year 1960-2004, together with net increase in carbon in the atmosphere, and the implied "sink" of carbon via all other processes. Click to enlarge. Source: carbon emissions from ORNL through 2002. 2003-2004 were estimated by scaling the 2002 numbers by the appropriate percentage increases in coal, oil, and natural gas from the BP annual production numbers. Annual average concentration of CO2 in the atmosphere as measured by Keeling et al in Mauna Loa, Hawaii via ORNL.
Notice that the sink is a significant offsetter of the fossil fuel emissions, but is quite volatile year-to-year. This makes sense if you think about the fact that there's big exchanges in the system. Eg. 120 Gt/year of carbon fixation by plants is offset by a similar amount of carbon release due to respiration by plants, animals, and microorganisms in the soil. It doesn't seem hard to believe that fluctuations in weather, etc, could cause that system to be different than its average by a few percent either way in any given year. Likewise, CO2 exchange with the ocean must involve deep upwelling waters with low concentrations of CO2 taking on more carbon, and CO2 rich water giving up carbon to winds that had crossed rural areas and lost carbon to plants. The vagaries of currents and weather could cause significant fluctuations in this also.
In the graph, it rather looks to me as though the overall volatility in the absorption of CO2 is increasing over time.
Now this net sink of carbon has spawned an enormous scientific literature trying to measure, study, model, and project it. I am going to cheerfully short-circuit that literature and develop a simple planetary-engineering rule-of-thumb for it instead. I hypothesize overall that the annual sink of carbon into the non-atmosphere components of the system should be roughly proportional to the difference between the current atmospheric concentration of CO2 and the pre-industrial value for CO2. This is because that flow represents the atmosphere re-equilibriating with slowly-changing components of the system, such as the ocean (which takes O(1000yr) to turn over), tree trunks, deep layers of soil, etc.
If we plot the annual sink of carbon versus the excess of CO2concentration over and above 270ppm (which gives a slightly better fit than the generally accepted value of 280ppm), we get:
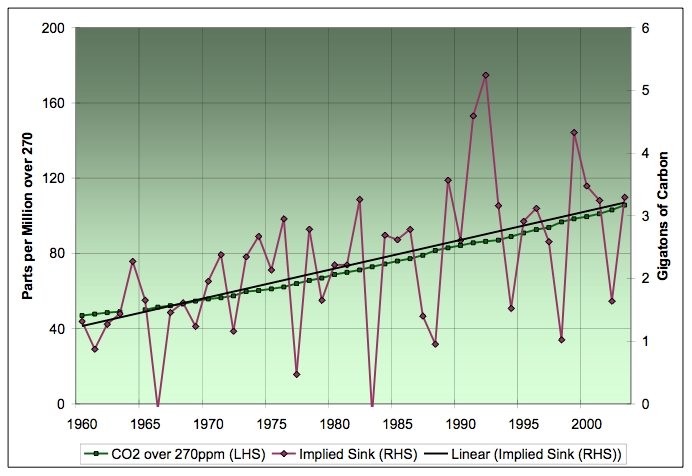
Excess of annual average concentration of CO2 above 270ppm (left scale), and inferred annual sink of carbon in Gt/year (right scale). Click to enlarge.
The annual sink value, although noisy, has a definite linear trend to it (eg a quadratic fit lies very close to the linear fit), and when plotted on suitable scales, the two align nicely. This suggests that for every 100ppm additional of CO2, we will get another 3 Gt/year of additional sink. Now, no doubt this linearity will break down at some point. Thus the extrapolation, like all extrapolations, has its dangers. However, I doubt that modeling all the individual and poorly understood components of the sink will lead to a very reliable extrapolation either - when you add together lots of uncertain things, the result is usually a great deal of uncertainty.
Anyway, if you buy that, we can put together the extrapolated carbon emissions, partially compensated by the growing sink, and project CO2 out to mid-century:
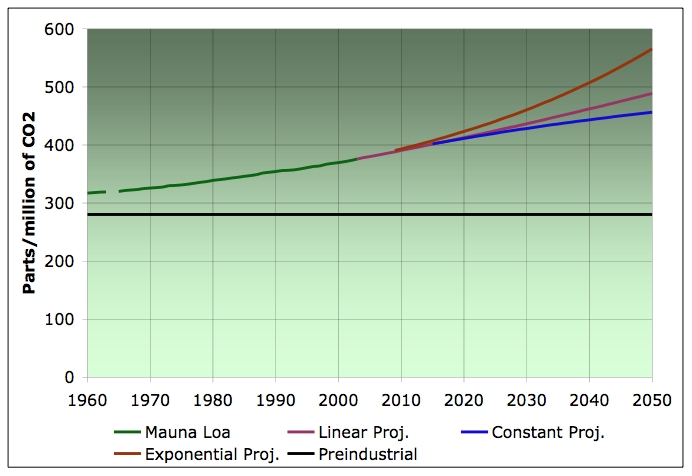
Annual average concentration of CO2 in the atmosphere since 1959 as measured by Keeling et al in Mauna Loa, Hawaii, together with model projections. Click to enlarge. Source: Keeling via ORNL.
My preferred linear baseline case is the plum line, and you can contrast that to the brown exponential emissions growth and the blue constant emissions at the 2004 level. Obviously the result contains the uncertainties that we just reviewed - will carbon emissions really grow approximately linearly, and is the rule-of-thumb for the sink adequate. However, the thing is visually plausible, and will serve as our baseline for further consideration in future posts.
What I would draw attention to right now is this. We are now about 100ppm over the pre-industrial value. We will hit 200ppm above the pre-industrial value in the late 2040s in in the linear model. We could view this value as some kind of approximate indicator of the driving force behind "weather problems" - mountain glaciers all melting, increased storm activity, record heatwaves, etc. So during the expected lifetime of anyone here under about 35-40, that driving force is going to double. Whether the system is likely to respond linearly to that is another day's subject.
Next I will talk about how much we should worry about these levels of CO2. After that we'll have a look at the Kyoto protocol and its likely impact, and then we'll begin looking at how much of the 60 Gt/year of net primary productivity for carbon in biomass makes it into the economy, and where it goes. I have some interesting graphs of the total weight of matter the world economy processes each year as context for that.
Contact
- Content: editors at theoildrum dot com
- Tech support: support at theoildrum dot com
License

This work is licensed under a Creative Commons Attribution-Share Alike 3.0 United States License.
Might I add that if you have 4 of these, I think a book is on the way on this subject alone.
There is also another force that we must worry about regarding climate change, what is happening under the earth's crust. These 2 forces will cause some serious havoc. (I guess it's already starting)
http://www.stabilisation2005.com/day1/Turley.pdf
- 22 pages, with an error on the last page "increasing pH" should be "decreasing pH" (point 1), mainly graphical.
http://www.stabilisation2005.com/55_Jerry_Blackford.pdf
- much the same info but in 5 pages of text.
Note that pH is a logarithmic scale ( a "p" function in chemistry = -log [], where [] = concentration )
So hot or not, more CO2 = more oceanic uptake = more carbonic acid = acid oceans? Or is there some suspicion that the uptake will slow if the pH of the oceans start to drop? I'm gonna find out here.
Thanks for this post Stuart. Though I'm a bit dazzled by the analysis, identifying a difference between the preindustrial carbon levels and those of today is crucial. I have often tried to explain to the curious the difference between short cycle and fossil carbon. Too few people understand the different climatological impact of burning wood versus burning coal or oil.
We are launching ourselves into the upside of a carbon cycle that spans many millions of years. This carbon enrichment of the biosphere is the atmospheric reenactment of a time in which humanity did not exist.
Just more checks and balances that the earth has. As hurricanes increase it stirs up the ocean causing more phytoplankton to bloom.
Phytoplankton is where half our Oxy comes from. Now I see why all this talk about biofuels coming from algae, is so big.
Problems with Algae:
- De-wetting the oil-algae
- Energy/materials needed to contain the growing algae (including the land set aside)
- Most of the 'cost effective' projects are using CO2 output from some other burning hydrocarbon event going on.
I was 'excited' by algae - until I looked into the need for non CO2 feedstocks, location and energy investment needed to make the algae holding areas.Then I became less excited.
Here is a great article that describes what you are talking about.
The Chart on Page 11 says it all.
Maybe SS can spiff if up a bit.
This is a very good point. In reality we ought to be looking at coal reserves on a country by country basis, and trying to get a feel for how accurate those numbers are.
You also have the same problem with coal as you do with oil - namely you can get light sweet crude, and heavy sour crude. With coal, you can get low-sulphur or high-sulphur. The low-sulphur is in high demand right now, but we will run out of that sooner.
Along with the GHG effects, we might also pause to remember sulfur emissions and acid rain at some point.
It looks like every non-renewable resource is subject...
http://www.sciencedaily.com/releases/2006/01/060126195628.htm
Since then an aggressive tree planting program (~5 million/year in recent years) has been in place and 4% forest cover is within sight.
Reforesting much of Iceland (sheep farming is highly protected and is still uneconomic) with larger and faster growing trees has the potential to reverse/slow down global warming by a year or so (over the better part of a cantury).
That is my goal and I & others* have found a leverage point, introducing higher value trees** that have been overlooked in earlier surveys. The American chestnut (no blight in Iceland) and Sugar Pine (world's largest pine tree, from 3,000 m in Southern California) have been introduced so far with my help.
I am the only nonIcelandic member of the Tree Growing Club in Iceland, Trjáklúbbur.
*
Humans are more motivated to plant trees if they can make money than if they are motivated just by love of nature, etc.Globally, increased carbon capture can be part of the solution.
local or not Icelandic people are asking people to come from all over the world for an "eco defence camp"
http://www.savingiceland.org/
HELP! NATURE UNDER ATTACK!
STOP THEM KILLING ICELAND!
Stop the Icelandic government and Alcoa destroying Europe's last remaining wilderness for an aluminium plant!
Be aware of the `master plan' to `develop' Iceland's beautiful nature into a heavy industry hell servicing the greed of aluminium corporations!
It has already started. The Kárahnjúkar dam project in the Icelandic highlands is well under way... But it can be stopped!
Karahnjukar (I have been there) is being built where a natural ice/rock dam existed about 10,000 years ago. Remnants of the sedimentary silt left at the bottom of that ancient reservior are still left and can be clearly seen going up the valley at the same elevation.
"Unspoiled wilderness" ? I will quote an offical of the Icelandic Forest Service, "Iceland is an unspoilt as a strip mine. Our forefathers and mothers cut down every tree in sight, introduced grazing animals and decimated the environment. They created the only blowing sand boreal desert. Add to this the lasting effects of massive volcanic explosions & eruptions and the glacier advances that scrubbed the landscape clean of anything living every Ice Age and we did no worse than nature. This "unspoilt nature" is just PR lies by the Tourist Bureau".
Greenland has far more wildnerness left than Iceland. And then there is Spitzbergen and other Artic islands.
Aluminium is one of the most sustainable metals, perhaps the most sustainable metal. We realy can not get too much of the stuff, massive ammounts of aluminium would be a blessing for future generations. The only problem with aluminium is that it require enourmous ammounts of electricity for its original manufacturing.
I hope those greedy corporations make an enourmous profit and invest it in even more aluminium works in areas with abundant hydro och geothermal power.
I suggest that the next death blow for the Icelandic scenery is more trees.
Stupid humans to change things to make the world better...
Since then an aggressive tree planting program (~5 million/year in recent years) has been in place and 4% forest cover is within sight.
Reforesting much of Iceland (sheep farming is highly protected and is still uneconomic) with larger and faster growing trees has the potential to reverse/slow down global warming by a year or so (over the better part of a cantury).
That is my goal and I & others* have found a leverage point, introducing higher value trees** that have been overlooked in earlier surveys. The American chestnut (no blight in Iceland) and Sugar Pine (world's largest pine tree, from 3,000 m in Southern California) have been introduced so far with my help.
* I am the only nonIcelandic member of the Tree Growing Club in Iceland, Trjáklúbbur.
** Humans are more motivated to plant trees if they can make money than if they are motivated just by love of nature, etc.
Globally, increased carbon capture can be part of the solution.
graphs that give am excellent
basic understanding of what it is
all about, but there are many
complicating factors that make a
definitive analysis almost
impossible.
The mere fact that we are adding an extra
7 or 8 billion tonnes of carbon to
the atmosphere every year should in
itself be cause for alarm. When
that gas dissolves in water it forms
a weak acid H2CO3, which depresses
the pH to as low as pH5.5. That may
not sound too terrible, but it is
sufficient to wreck the chemical
balance that permits corals and
shellfish to deposit their
structures. Even more disturbing,
many plankton are rather pH
sensitive and we risk annihilating
the organisms at the base of the
ocean food chain.
Another particularly scary phenomenon
is the release of carbon dioxide and
methane from permafrost that is
thawing. This is clearly a self-
reinforcing phenomenon that can easily
lead to runaway global warming
-abrupt climate change- that could raise hte average temperaure of the planet by as much
as 8 or 10 C in a matter of a
decade or so.
Disturbance of the metahane-ice
clathrates that are deposited on
ocean floors will almost certainly
have a similar effect.
Finally, there is the totally
unknown aspect of how elevated
temperatures and elevated CO2
levels will affect the uptake of
CO2 by plants. Although many
scientists blitely assumed that
higher temperatures and higher COr
levels would increase photosynthesis
this may not necessarily be so. In
particular, if higher tempertures
result in lower moisture content of
soil, plants stop transpiting and
photosynthesis comes to a halt.
There have been reports of reduced
rice harvests that have been directly
attributed to global warming...
sorry I don't have the link.
Everything tell me we should be
applying the Precautonary Principle
to everything we do.
The report of an extended drought
in the Amazon in the latter part
of 2005 should have sent alarm
bells ringing around the world,
since if the Amazon stops absorbing
carbon dioxide and starts releasing
it, we are likely to be toast in a
decade.
Published on 17 Jan 2006 by Fortune. Archived on 19 Jan 2006.
Cloudy with a chance of chaos
by Eugene Linden
A disturbing consensus is emerging among the scientists who study global warming: Climate change may bring more violent swings than they ever thought, and it may set in sooner.
If you ever decide to have a day or two of downtime, you might enjoy Roy Rappaport's "Pigs for the Ancestors". It's about measuring energy as it is harvested, or displaced, by humans. In this case, the humans are a primitive society, who channel solar into their herds of pigs. The social traditions and mythologies that direct the activity <leveraging energy> are fascinating.
http://www.scienceblogs.com/
Taking one step back, and looking at the global human response to this problem, it doesn't look good. While it will be interesting to look at Kyoto & etc., here's what I currently expect:
A sufficient global concensus for effective action won't come until the environmental effects are painfully obvious. (The fact that they aren't obvious enough now is cause for extreme pessimism.) Given that, I think we have to blue sky what a global mobilization (on things like tree planting and carbon sequestration) would do at some late stage.
Either we can play catch-up at some point, or we'll have to ride it out (whatever the heck that comes to mean).
Right now it looks like we are not going to halt the increase (remember yesterday's stories of China's concrete and coal expansion?) ... and we're short a "plan b."
For much of the world's tired fields, this would not only help with climate change, but vastly improve the soil's productive capacity. The methods of raising organic matter are very simple: Minimize tilling, leave agricultural waste (straw, for example) on the field. Switching cattle production back to a grazing centered approach would do a great deal of good too. One can go as far as growing a crop just for the purposes of knocking it down to stay on the field to contribute organic matter to the soil (and shade out weeds, and conserve soil moisture, and reduce soil erosion).
I can look up the exact statement in a couple of days and stick it in the next open thread.
Of course, I just don't think this, or any promising actions, will be implemented for the usual reasons (ignorance, short-term greed, ...).
I'd suggest that we accept an international treaty instead of Kyoto, according to which at least 20% of the areable land of each country each year must be subject to such treatment. Instead of carbon emissions we will start trading "carbon absorbtions" based on areable land treated. Of course this will put an end to the biofuel madness and we'll step directly for electric transportation (also a step in the right direction IMO).
Our base wiring favors short term concerns. Without an internal mechanism for longer timescales, we have to try to patch one together with the general cognative machinery ... and we see how well that works.
My initial thoughts after reading this is: we're going to be having alot more 'degree cooling days' than 'degree heating days'. Perhaps that theme is already occuring in the natural gas markets as the historical wide spread between winter months and summer months has flattened dramatically.
It would be interesting to include in this analysis any estimates of the contribution made to global carbon by methane hydrates released via permafrost destruction. I recall seeing a report on the amount of methane released to the atmosphere via permafrost destruction at Prudhoe Bay, (Colette?), do not have a reference.
The amount of methane released to the atmosphere exceeded oil production by a factor of 20 (I recall). Since permafrost destruction is a circumpolar problem and methane hydrates are common in this environment perhaps a very large source of atmospheric carbon is being ignored
http://www.realclimate.org/index.php?p=227
I'd note that the picture above showing carbon flows is current rather than projected. To keep things apples-to-apples, we'd really want to know the current rate of permafrost and hydrate melt/release. I don't think anyone knows.
Source: Wikipedia
I looked up the Joint Global Ocean Flux last year, curious about the oceans' place in the carbon cycle, and see that it has not been funded since about 2003 or so. They have published a lot of raw data, but I haven't seen many studies of it ...
Also I see Kevin mentions methane as a cause for concern; with the Gulf Stream, well with the whole thermohaline circulation system being disturbed, methane hydrates which have been kept frozen by cold bottom currents from the poles may begin to melt, and that process will likely be catastrophic rather than linear. A couple of questions come to mind:
Here is an interesting note on the big energy balance picture of the climate by one of the leading climate scientists, Jim Hansen.
http://pubs.giss.nasa.gov/docs/2005/2005_Hansen_etal_1.pdf
There is a wealth of info at this NASA site if you want to wade though it - much having to do with the best climate models available at present.
Joint Global Ocean Flux Study
Clearly man is increasing the carbon emissions over background. This is now not disputable, the way it was a decade or so ago. Two points with this.
- Are the emissions self reinforcing? As you stated there is a lot of carbon in the ground as peat, organic matter and frozen tundra. Prairies used to be carbon sinks they are now farm fields and net releasers of organic carbon. Ditto for tundra that is thawing. Centuries of trapped carbon is being released in forms other than oil.
- What data set says we need large carbon increase (compared to total world amounts) to have negative effects on life? Small changes in temperature can have lethal effects on species. That we have been able to pump a measurable surplus of carbon into the environment, in this complex a system is quite alarming. Ecosystems tend to run at equilibrium and it is usually hard to alter the system due to the enormous energies invovlved.
Point 2 is often used by business and conservatives to say the problem is not worth worrying about. I think we should be cautious on minimizing our impact on the carbon cycle at this point. Saying it is only a small percentage of the total is a value judgement and not based on cause and effect.Remember, they use mountain top measures (as in the Mauna Loa graph above) because there is such huge variation in terrestrial environments.
Searching now:
http://www.co2science.org/scripts/CO2ScienceB2C/subject/u/summaries/urbanco2dome.jsp
Does that mean that the more people taking that final exam the lower my score? ;-)
Given this drastic variability, you have to average it over a whole year and then subtract one year from the next in order to get the net addition. It is no wonder that there is a lot of noise in this measurement, since the raw data is clearly highly variable. I don't know if it is right to attribute this noise to genuine variability in atmospheric sinks or if it is purely measurement error.
No, what we've got is the interesting phenomenum that air blowing over the top of a mountaintop shows a seasonal variation in CO2 concentration.
Worldwide annual concentration of C02 peaks in the end of the winter and drops until the end of the summer. Reason: photosynthesis, the northern hemisphere has much more biomass and in northern hemisphere summer and spring the vegetation blossoms and absorbs CO2, while in the winter you get the opposite process (loss of biomass).
And I just thought I'd pause after narrowing the "measurement" question and let the others pick it up, as you have done.
I'm not sure I understand the rationale for this hypothesis.
Are you saying the the rate of CO2 uptake by the oceans, etc. is more or less linearly proportional to the increase in atmospheric CO2? Maybe; maybe not.
While the CO2 dissolved in the oceans (where it reacts with the water to instantly dissociate into hydrogen ions and bicarbonate ions) will increase as the oceans start coming into a new equilibrium with the atmosphere, there are so many factors affecting where that equilibrium point is and how fast the system will readjust that I don't think you can make such a blanket assumption. The chemistry of this whole thing is extremely complex and subtle. Furthermore, increased CO2 in rainwater will cause increase weathering of minerals, and that in turn will affect the chemistry of the whole system. And it's not just about chemistry but also about physical transport, as affected by wind, currents, photsynthesis, and at least a dozen other things.
I strongly suspect that with respect to CO2, the atmosphere and the ocean will probably never get back into complete equilibrium as along as we continue pumping the huge amount of CO2 into the atmosphere. In other words, it will always be out of balance, with the ocean trying to catch up with the atmosphere. I'd venture that if all man-made CO2 were to cease tomorrow, we wouldn't return to pre-industrial-era atmospheric CO2 for a long, long time.
Finally, to address a concern raised by another poster, I wouldn't worry about the oceans running out of buffering capacity and experience a sudden drop in pH. The reason is the when CO2 is dissolved in water as H2CO3 (so-called 'carbonic acid'), the pH may lower slightly but the total alkalinity of the water-carbon system does not change. The reason (somewhat simplified) is that for ever H+ ion added, there is also a corresponding HCO3- (bicarbonate) ion added. Furthermore, a slighly lowered pH will cause more CaCO3 deposits to dissolve, thus releasing more alkalinity. So, I wouldn't worry about the affect on ocean CO2 chemistry all that much (at least not for now).
The Acid Ocean - the Other Problem with CO2 Emission
http://www.realclimate.org/index.php?p=169
It further reinforces my belief that as long as we pump CO2 into the ocean at the enormous rate we are, the equilibrium between the ocean and atmosphere will never be fully reestablished, because the ocean will always be lagging due to the long time it takes for things to balance out. It all seems to be very mass-transfer limited.
I would agree that even very tiny pH changes can have a profound effect on the marine biota, and I didn't mean to downplay its importance. My only point was that the ocean will probably not see a really large pH spike due to increased CO2 in the atmosphere.
If these concerns about increased CO2 in the ocean are valid, then what does that say about some of these schemes to 'sequester' CO2 from power plants by pumping it into the ocean? (Maybe I'm missing something, but that has always struck me as a totally hair-brained idea anyway.)
Of course, local upwelling and sinking occurs (Greenland, Antarctica, Peru) but the bulk mixing is still slow.
Of course, the deep ocean holds far more carbon (because it is so much bigger in volume, I guess) so it would be affected relatively less by a given quantity of increased carbon input.
This means that it will take a while for the CO2 that's absorbed on the surface to get to the deep ocean. So the surface will be able to hold less, and its chemistry will be affected more.
Chris
You wrote: "If this is correct then the surface water is connected to the deep ocean about as well as it is to the atmosphere, and we would not expect CO2 impacts to be limited to the surface."
Suppose that it takes 10 years for CO2 to get from the top of the surface water to the bottom of the surface water. Meanwhile, 90 Gt are crossing the surface/deep boundary every year. Thirty years after you transfer extra CO2 from the atmosphere, it works its way through the mass of water containing the 1,020 Gt listed for "surface ocean," and then it can start transferring to the deep ocean.
So for ten years, that CO2 has been concentrated in the surface water, not absorbed by the deep water. So we should expect that CO2 will affect the surface water more strongly than it would if it were immediately dispersed throughout the whole ocean.
Of course, after the delay, it will indeed reach the deep ocean, and have an effect there too. But as long as the system is out of equilibrium, we should expect CO2 to have more effect in the surface than in the deep ocean.
When I first read your post, I thought you were suggesting that the CO2 would immediately be shared among surface and deep ocean. That would be incorrect. But if you were instead saying that the CO2 will eventually get to the deep ocean, then I'll agree with that.
Chris
I would seem reasonable to me that the surface ocean would be relatively well mixed because of wind and wave action. So I don't see it taking 30 years for CO2 to percolate from the top to the bottom of this so-called surface region. But at this point I am just speculating, as I think you are as well, so perhaps we should wait for more authoritative information.
Re: "However, I doubt that modeling all the individual and poorly understood components of the sink will lead to a very reliable extrapolation either - when you add together lots of uncertain things, the result is usually a great deal of uncertainty."
I appreciate the need to make some simplifying assumptions and so I just thought I would make some comments on whether they are correct. As you already know, we can't expect the Earth's carbon sinks to remain "roughly proportional to the difference between the current atmospheric concentration of CO2 and the pre-industrial value for CO2" in the future. This is due to postitive feedbacks that have deleterious effects in so far as humans have altered the carbon cycle as it has operated in the Holocene. Here's a few remarks on that.
Let's look at an authoritative paper on all these "poorly understood components". From The Oceanic Sink for Anthropogenic CO2 by Christopher L. Sabine,1* Richard A. Feely,1 Nicolas Gruber, et. al.
Note: Pg = Petragram = 1 billion tons
Click to enlarge
As you alluded to, the error bars are high. This is especially true for land use. Here's a nice paper on that subject, Land use effects on terrestrial carbon sources and sinks. The conclusion of Sabine, et.al. speaks to the future of the oceanic carbon sink [emphasis added].
As for the terrestrial carbon sink, some climate models (that include a carbon cycle) actually project that the Amazon will become a source, not a sink, by mid-century. This is due to changes in land use and burning. The same thing is going on in the rainforests of southeast Asia (Indonesia). Rainforests are micro-climates which basically means they create their own weather. Changes due to landuse changes or severe drought conditions (perhaps brought on by conditions in the Pacific) affect the rainforest carbon sinks in a positive feedback. The less forest, the less carbon absorbed, the more released. The same type of process is at work in the high latitudes of the Northern Hemisphere. Already, we note that the Siberian and Alaskan permafrost is melting down, releasing both CO2 and methane into the atmosphere whereas these GHGs had been sequestered in those soils at least since the previous glacial maximum. Note the large numbers (measured in petragrams) due to land use in the included graphic. Nobody really knows what's going on with the Earth's terrestrial carbon sinks but climate scientists are starting to get that anxious feeling in the pit of the stomach. See Land Won't Soak Up Carbon Indefinitely. Also see Sinks for Anthropogenic Carbon for a good overview. Finally, for the really brave, try Terrestrial Carbon Sinks -- Uncertain Explanations.The bottom line is that there are almost certainly positive feedbacks at work in the carbon cycle having to do with land use, saturation of the ocean's ability to absorb carbon and the ongoing warming itself. None of these are likely to be good news.
best, Dave
IIRC, the results of that work suggested that it wasn't going into North American cropland, and it wasn't going into tropical rain forests, but it might be going into the oceans. At least one theory was that microscopic organisms were fixing carbon in some fashion and carrying it to the sea bottom when they died -- a theory that still does not seem to have been settled. I wasn't all that interested in the "big picture" at that time; I got paid to make sure the diffuse radiometer was properly aligned, not to think about carbon sequestration :^)
Some years ago I read about Iron being used to increase the growth of plankton. I just did a search and found
http://www.cem.msu.edu/~cem181h/projects/96/iron/cem.html
It seems that Iron is a limiting factor and so I suppose the idea is to add iron to the seawater, increasing plankton and the ability of the oceans to become a carbon sink. Obviously the mission of a "non-profit" organization.
http://www.scienceagogo.com/news/20040318210325data_trunc_sys.shtml
I hope they can find a slow/safe level of iron/mineral seeding.
Note to Stuart: You build a variety of interesting small data sets, and you are meticulous about sourcing them, but you don't always pose the analysis quite the way I would like. Is there any chance that we could get you to make those sets available somewhere convenient? I know I'm just being lazy, but if it's easy to do...
Now that you mention it, it really does look that way. A lot. And that's over just a few decades! I repeat: That increase in volatility took only a few decades to develop!
Anything that can change a global mechanism that drastically in that short a time needs to be understood. If the carbon sink is a function of the weather, then this would seem to be proof that the weather is getting more extreme. If it's a function of ocean currents, then there's proof that ocean currents are changing. And so on.
Can we get more historical data on this? Can you quantify the degree of volatility? If you are the first to notice this, you should publish your observation.
Several posters here have recently mentioned one or another graph as the first time they've been scared. I won't be scared quite yet, until it's understood a little better, but this could be the one that scares me.
Chris
http://currents.ucsc.edu/04-05/03-14/silver.asp
http://www.livescience.com/environment/050314_silver_ocean.html
The amount of silver in the North Pacific apparently isn't toxic, but the first article mentions concerns about "hot spots" of greater concentration.
Chris
Something about the graph "Carbon emissions in Gt/year 1960-2004, together with net increase in carbon in the atmosphere" had a vaguely familiar look to it...
The graph at http://en.wikipedia.org/wiki/El_nino#Southern_Oscillation_Index_.28SOI.29 seems to match the peaks for the applicable years extremely well
It doesn't seem hard to believe that fluctuations in weather, etc, could cause that system to be different than its average by a few percent either way in any given year.
Indeed not.
--J
mya = million years ago, kya = thousands years ago.
This might give you all an insight into the special circumstances we find ourselves in now. There is no known analogue to the special circumstances we find ourselves in now in the paleoclimate record as known in Geological Time. None.
So, you can see why some climate scientists, especially those who have looked at abrupt climate change, are not able to sleep well at night.
All this seems futile given the size of the problems and the obvious fact that there is no agency on earth with authority to limit the use of coal, oil and methane. One shudders to think what kind of agency WOULD have such authority. We may yet have even more German words - Chinese more likely.
For better for worse, price will have to do since money is the only authority with sufficient reach.
TOD is primarily about oil. Climate issues are obviously very important but may be a bit off topic. I think of the TOD constituency as a band of individuals from many walks of life mulling over oil related issues while warming our hands by an internet mediated campfire. Climate is obviously related to oil but it's actually more a superset than a subset. Once the topic shifts to climate we find oil just one piece of the puzzle. I think TOD should keep its oil focus. There is nothing to prevent spinning off a website related to the oil/climate connection.
Given that your concerns about climate change are real, what exactly do you propose as a response other than a great gnashing of teeth and refrains of, "We're f%%ked, we're REALLY f%&ked!"
I get tired of listening to Kunstler and the apocalypticons rant and rave. It's both repetitive and a real downer.
If you are right and climate change is the real elephant in the room (and you probably are right about that), there's nothing much we fleas can do about it. Even limiting carbon combustion may be too little too late. Once these cycles get started they tend to run to completion due to positive feedback loops. The earth has seen many changes of climate and life has managed to hang on.
Perhaps we should simply sit back and watch what happens realizing that, much as it may damage our fragile egos, this is a Greek tragedy in the most real sense: the inexorable working of things. I personally lay the blame for our situation at Aristotle's door with his creation of logical thinking. Logic allows the forebrain to separate itself from the world. But, as we see, the rules of logic, even augmented by statistics, can't model the complexity of life with enough accuracy to allow predictive control of things like an Amazon rainforest.
Furthermore, and even more important, underneath this thin glaze of rationality we remain emotionally similar to chimps. Man is not a rational animal. The civilization we inhabit encourages a certain limited kind of rationality while feeding the lurking animal Monday night football. We may think the animal sleeps but scratch the surface and look at your own behavior - how many times does your actual behavior violate what you rationally think is in your best interest?
So pretending that we are rational animals capable of stepping back and sacrificing our material comforts to achieve a stable climate, borders on absurd. In the first place we would never know that it worked even if it did. In the second place we would likely sacrifice our comfort for the next ten to twenty years and discover we're past the tipping point. Methane would be dumping into the atmosphere from the far north. How in hell do you tell people to give up la dolce vita on such long odds? You don't.
I think your criticism of Stuart is misplaced. Of course there is no model for the current situation. I find it fascinating to watch him try and model the world even knowing it's probably futile. I think trying to make sense of things using the tools at hand is a noble effort no matter what the outcome, don't you?
I disagree strongly about TOD sticking exclusively to a narrow oil focus. Climate change and some aspects of economics are intimately enmeshed with the peak oil problem.
Hold on there, partner, I didn't criticize Stuart at all! I was just emphasizing a point I think he had made in his figure illustrating the carbon cycle as it is presently understood. That model will be changing over time due to human interference and that was another point I was trying to make.
Please don't miscontrue what I said, LJR.
I would like to see a wiki, drawing on a number of existing blogging communities (TheOilDrum, RealClimate, WorldChanging), which set out to brainstorm an agenda similar to that of the "alternative to Kyoto" which met in Sydney, Australia recently. (The "work plan" of AP6, the Asia-Pacific Partnership on Clean Development and Climate, can be seen here.)
The agenda of such a site, as I imagine it, would be both factual and normative. There would be an attempt to hammer out a consensual understanding of the facts regarding climate, economics, and politics; and an exploration of future scenarios, policy options, and technologies. Wikipedia, with the talk pages that accompany every article, shows how a consensus document can coexist with threaded discussion.
Most ambitiously, one might hope that such a site would be more than a means for a self-selected group of people to improve their understanding of the situation, and that it might actually enter into dialogue with its institutional counterparts (e.g. the AP6, and whoever administers the new AEI). But that may overestimate the contributions that ad-hoc net-forums like wikis can make...
If you look way back in human history, everywhere humans have gone, large-scale extinctions and environmental damage have followed. It was occurring far before Aristotle opined on anything. It was probably occurring before we had effective language skills. Call it id, greed, or whatever--humans have always been bad for the environment. Aristotle may have given us the tools to rationalize our behavior after the fact, but he didn't cause our transgressions.
But it's always great to add another villain to the list. And I love the "internet-mediated campfire" image.
clarification:
methane is very much more active than
carbon dioxide as a greenhouse gas
-it is all to do with bond energies
- and is about 22 times as active
per molecule. The reason we focus
on CO2 is that the concentration of
CO2 is so much higher.
methane in the air oxidises to
carbon dioxide when it passed
through a flame or when lightning
passes through air. It should not
build to excessive levels in the
atmosphere unless there is a
catastrophic release (as per major
disturbance of methane trapped in
tundra, bogs etc, that may have
taken tens of thousands of years to
accumulate, or release from methane-
ice on the sea bed.
It is suggested that the massive
extinction event that occured 55
milion years ago was caused by a
large volcanic system erupting
under a major oil field, thereby
vaporising the hydrocarbons
and oxidising them; the sudden
increase in carbon dioxide and
methane content of the air was
enough to trigger an 8C rise in
average temperature, wiping out
95% of living things.
By continuing to add carbon dioxide
to the atmosphere and pushing the
Earth's systems to the point of
positive feedback, we are probably
creating a situation that will lead
to a similar abrupt climate change
(increase in average temperature of
5-10C in a decade) and similar
mass extinction event.
This is not the kind of analysis
any politician like to hear, nor
the kind of discussion any mainstream
media like to publish, hence we get
the rather preposterous 'sometime in
the next 1,000 years' phraseology,
rather than some time in the next
100 years (or even worse of course,
some time in the next 10 years).
The Precautionary Principle tells
us that unless we know it is safe,
we should not do it. Our economy
operates on the basis that we
should keep doing it until it is
no longer possible to do so. That
is the really scary part. Once is is no loner possible to keep adding carbon, we will have gone well past the triggering point for abrupt
climate change (we may have already
passed it -we do not know).
it= unconstrained addition of
carbon dioxide to the atmosphere
in this case, but PP should apply
to most aspects of our lives.
The irony here is that Peak Oil may
save us from abrupt climate change, by forcinga reduction in emissions.
But PO may also trigger unrestained
use of coal and bring abrupt
climate change faster than ever.
Here's a great new factoid. If there really is as much carbon burned as that graph suggests, over 2,000 lbs of C-14 (radioactive, undergoes beta-decay) are produced annually. Gee, now I know why everyone has cancer.
-Stop the Iran war-
Uranium, thorium and decay products are a different story.
First, I know the percent abundance is not even a thousandth of a percent, but when one talks about 8 gigatons of material, that fraction of a percent becomes significant. My post was to illustrate that point.
Second, even if all that was burned was C-12, as you point out, C-12 is made into C-14 in the upper atmosphere. Consequently, if we are burning 8 gigatons of C-12 per year, that would put plenty of carbon atoms in the upper atmosphere to be struck by cosmic rays, which would still increase the C-14 levels.
-Stop the Iran war-
The coal and oil have been sitting for at least 500 million years. 500 million years is roughly 8500 half-lives of C-14. Each 10 half-lives is roughly a factor of 1000, so the original C-14 quantity has been reduced by a factor of ten-to-the-2550th-power. Even if you started with 8 gigatonnes of pure C-14, it would all have decayed by now.
Never underestimate an exponential process.
Successful solutions must arise out of collective action. TOD is a crucial part of that by providing an open forum for civil scientific discourse - good minds from a variety of disciplines come together here to discuss our possibilities. It is my observation that TOD participants are economists, oil folks, geologists, professors, farmers, retirees, business executives and perhaps even a lawyer or two. And the list grows daily.
It's really quite exciting when I step back and look at what's happening here. This seems close in spirit to the town hall meetings in New England at the beginning of our country. Perhaps just a tad more scientific. More like the wonderful scientific clubs of 18th and 19th century Europe.
What I find most appealing is the rock solid civility and genuine kindness of spirit that pervades these posts. It is clear that our moderators put a lot of their time and thought into providing a tableau of topics that illuminate and help direct our conversations into productive channels. Stuart's post on the carbon cycle is a perfect example. I'm aware that the carbon petagram numbers Stuart has used may be off by an order of magnitude - but that's merely a technicality. Stuart's quest is helping me learn how to think about this problem numerically. And, unlike carbon scientists, his post is not filled with opaque scientific jargon.
While there is no guarantee rationality will pull us out of the maelstrom, I far prefer it to the shrill apocalyptic approach. Sufficient unto the day is the evil thereof. Let us survey our world with a cool, calm eye and assess our possibilities.
I fancy this is the kind of conversation that would give Garrett Hardin, that tough-minded and brilliant ecologist, great hope. I found his "Filters Against Folly" to be one of the best books I've ever read. We must think with both words and numbers. Finally we ask "and then what?"
There are no easy answers.
The test can not be taken again if we fail.
The test will not be graded on a curve.
Which is why I never actually post (but will occasionally comment) on climate change issues at TOD. As always, I recommend Real Climate. But, I still hope to read Start's continuing series on the subject because I will find it interesting and in the end it is a much bigger subject than maintaining our pathetically shortlived affluent lifestyles based on fossil fuels addiction.
Does that sound bitter? You bet.
I recommend that TOD energy enthusiasts get themselves acquainted PDQ (pretty damn quick) with climate change issues as caused by fossil fuel emissions. Then maybe we wouldn't see so many pie-in-the-sky solutions to our problems (like CTL--coal to liquids or Canadian tar sands or Venezuelan heavy oil/bitumen) that don't change the Big Climate Change Elephant In The Room that nobody cares to acknowledge.
(Heck, I sit here in a cold house as I type this.)
I saw the "million years" post and didn't feel a need to responed. Sometimes "no response" equals "ack."
I continue to see PO and GW as "population response" problems, and my feeling is that "early adopters" can only push so far. They (we) will be seen as strange by the majority until (if or when) some magic condition occurs.
I mean look at GM's "SUV shock" ... did that happen because we convinced everyone that PO/GW was around the corner ... or did $3 gas do more than we ever could?
Stepping back, and pretending to be a martian observer - I think we're screwed unless (if or when) we are fortunate enough that some "shock" wakes everybody up. It is my (maybe cycnical) opinion that fringe ideas do not change majority minds.
The world will not willingly cut its consumption of energy, IMO. They will instead demand of their governments cheap energy, if for no other reason that that is the only proven way to a good standard of living. As long as there are people that say that an energy crisis or global warming does not exist, a majority of the population will believe them because it's easier.
That's probably what's going to happen, that and coal based power and synfuel plants. Oh, and some nukes. Probably the crappy PWRs we have right now.
Unless technology changes and we go and do something completely unexpected like cold fusion or whatever.
Chris
I've been swamped with work and family and "off-line" life.
Also, I'm trying to absorb info on other threads and some other sites. But, yes, climate change is a big deal and my guess is that we will be overtaken by an enevironmental tsunami that will dwarf our geopolitical bickering and our haggling over just how much oil is left, EROEI of alternatives, and specific nuances of the application of HL to various places.
Even so, I think that Stuart S. is right to note that many of us are trying to integrate data and analysis as best we can.
Many of us are taking action as well....as you know.
Keep posting, I for one chime in when I can and when I suspect that I contribute.
-- bathed in petroleum and the effluence of coal burning, nuclear weapons testing and use, and Lord knows what other goodies -- beggar
the elephant in the room and
every day that passes it's getting
a little bigger and a little angrier.
I am going to fly a kite here and put
it to the group that September 2006
will mark a turning point for the US
and probably for humanity.
Remembering the horrendous damage
that Katrina, Rita and Wilma caused,
and noting that the CO2 level in the
atmosphere rose by a biggest amount
in recorded history through 2005,
(up 2.2ppm in the first ten months),
we should surely anticipate even
greater damage than last year in
the coming [Northern] summer of
2006.
Note also that September 2005 saw
the smallest area of sea ice in
the Arctic, the culmination of a
several-year sequence. Logic would tell us that the meltdown will be greeater this year
and that disturbances to normality
will be greater.
And I concur absolutely with your
comments regarding pie-in-the-sky
solutions to peak poil, such as
converting coal into liquid fuels,
in ordrer to keep the system going
just a little bit longer.
At some stage those who do not
curently accept that pratically
everything we do adds to the
problem, rather than reducing the
problem, will be forced into such
acceptance of reality.
I will cite the dropping of water
onto forest fires by helicopters as
a classic example of short term
thinking that adds to the long
term problem -using a fast
depleting resource and generating
harmful emissions in order to solve
an immediate problem that is
almost certainly exacerbated by
consumption of oil and release of
emissions into the atmosphere.
As an observation that will
undoubtedly upset many, I will
add that I oten personally find
engineers the most difficult
'scientists' to deal with, because
they always seem to think that
there is a technical fix to every
problem. I am not sure whether it
is that kind of mind that takes
up engineering, or whether that
attitude develops as a
consequence of engineering training.
Carbon/Global warming and peak oil certainly dovetail in terms of calling out for solutions that will enable some creature comforts going forward. I would love to hear about real-live existing companies (not just Rocky Mountian Institute think tanks) that are making money promoting conservation technologies. Right, the market does not price externalities well, but there must be so much low-hanging fruit in terms of our overall energy usage that enterprising folks could do well by doing good and get us off of this trajectory. I work in the capital markets, and investors will fund anything that can make a buck with a good story around it. And nothing seems to be quite so sustainable (or credible) as a company making a buck. What does the collective wisdom of TOD see in terms of emerging conservation technologies? I think we are all dying to support them!
preset 60, to 100, as suggested, so this is
just a test to see how that works out. I must
say it was frustrating to be typing away and
having the text disappear off the right of the
sceen so quickly, then having to hit 'enter' to
view what I had written -hence the unintended
breaks. Thanks for the tip.
The problem is that lack of word-wrap, which most of us don't have to deal with. As I type this, I only hit "enter" at the end of each paragraph.
Get Firefox (http://mozilla.org) and then get the Adblock extension and learn to use it. You'll have a much nicer Internet experience. (Adblock is wonderful--I see maybe three flashing ads on my screen in a day's surfing.)
Chris
"As the Himalayas grew, huge amounts of rock were exposed to the elements. The heavy monsoon rains combined with carbon dioxide in the air and eroded the rock. Could this process called chemical weathering take so much carbon dioxide out of the atmosphere that global temperatures would drop enough to trigger an ice age?"
http://www.pbs.org/wgbh/nova/transcripts/2320crac.html
My understanding is that most of the impact of global warming is in the relatively far future, decades away, in the latter half of the 21st century. Some small effects are being noticed now, changes in growing seasons, changes in animal and plant distributions, but nothing major. There has been 1 paper I think claiming to see an increase in hurricane strength but there are many papers that show just the opposite.
Given this fact, and given our great uncertainty about the course of the future, I tend to discount damage that is so far off. There are many things, both good and bad, that could happen between now and then which would make global warming much less of an issue than it now appears.
One obvious possibility which I am sure Peak Oil believers will have thought of is that we might run out of oil and fall into a permanent worldwide depression. In this scenario, even though we have coal and other energy resources (tar sands, methane hydrates?), we are not able to muster the infrastructure to put those into widespread use as we have today with oil, and so we revert to a low-energy society, with or without a dieoff. Obviously, with such a catastrophic outcome, carbon emissions will be greatly reduced and the impact of global warming in the 2050-2100 time frame will be much less.
A more optimistic scenario has us successfully switching away from oil and continuing the long-term trend of economic, technological and scientific growth. In this version, which I see as the business-as-usual model, the world of 2050 is far richer and more capable than the world today. They may have many technological tools to deal with global warming and its problems that we cannot even envision from our current perspective. Maybe nanotech or biotech will let them evolve an organism or machine that can efficiently remove carbon from the atmosphere, or maybe some kind of shield can be constructed in space to reduce sunlight hitting the earth. Of course this sounds like science fiction today, but on the assumption of continued scientific growth, we have to use science fiction to envision the world 50 or 100 years from now.
The point is that so many things can happen, good or bad, that it is almost impossible to judge how great an impact today's carbon emissions will have. By the time they will have built up enough to be a problem, the world will very likely be quite different from today. We can't begin to judge how bad a problem our current carbon emissions will turn out to be.
The way economists model such uncertainty is by discounting future costs based on an interest rate. If we use a rate of 5%, then costs 50 years in the future get discounted by about a factor of 10; and costs 100 years in the future get discounted by about a factor of 100. This provides a basis for judging whether a proposed mitigation strategy makes economic sense. If it is designed to help against problems 50 years from now, it needs to cost 10 times less than the problems it fixes; and if it is designed against problems 100 years from now, it has to cost 100 times less. At this point I don't think there are many proposals on the table that satisfy this stringent cost/benefit analysis.
Actually, what appears to be a fairly subtle effect (e.g, small temperature rise) can have (actually has had) a surprisingly big impact. Basically (if I recall the seminar correctly), since the 1920's April 1 snowpacks in the mountains of the Colombia River system have declined some 50% and, at the current rate of temperature increase, are projected to decline another 50% in some 20 years. Paradoxically, precipitation increased 15% in the same period but it essentially ran off. The hydrologist said the river system managers will shortly have the choice of managing river flows for salmon, for hydropower or for irrigation water but only one of the three because that disappearing snowpack has essentially been the water storage system. He added that even if it were publically acceptable, the river system structure is such that this storage capacity could not be replaced by raising existing dams or constructing new ones. Currently the river system supports both significant irrigated agriculture (Snake River plain in Idaho, Columbia Basin in Washington) and significant hydropower production. Salmon recovery is a major public issue.
Climate Impacts on Washington's Hydropower, Water Supply, Forests, Fish, and Agriculture <http://www.cses.washington.edu/db/pdf/kc05whitepaper459.pdf>
This work is being done by the Climate Impact Group of the Center for Science in the Earth System at the U of Washington <http://www.cses.washington.edu>
I have a criticism too, it is unwise, and incorrect, to apply apparent economic truths (or fictions, sorry for that jibe) to other sciences.
Strangely I think those things you perceive as plausible 'sci-fi' possibilities are our best hope! But that is sadly because i fear those you seem to think may be realistic are in loud cuckoo land.
Perhaps we should arrange an audio chat, i would enjoy.
Halfright (sorry, couldn't resist), it's true that carbon emissions would be reduced. But particulate emissions, which cool the earth, would also be reduced, and particulates leave the atmosphere very quickly. So in this scenario, global warming would hit quite hard, quite quickly.
Chris
Actually, it's been done. It's called a plant. And it works fine to sequester carbon until the plant dies. After that, rotting or burning it releases the carbon, and we're back to square zero ...