DrumBeat: May 21, 2006
Posted by threadbot on May 21, 2006 - 9:15am
Now for some wise words from the readers of The Oil Drum...
“Considering the many productive uses of petroleum, burning it for fuel is like burning a Picasso for heat.”
—Big Oil Executive
Contact
- Content: editors at theoildrum dot com
- Tech support: support at theoildrum dot com
License

This work is licensed under a Creative Commons Attribution-Share Alike 3.0 United States License.
A group of animals are staring open mouthed at a large SUV:
How many humans does it carry?
Usually just one. They are gradually losing their ability to walk.
They didn't see the stop sign, took a turn for the worst
She said, "Listen baby, you can hear the engine ring
We've been up and down this highway, haven't seen a god damn
thing"
He said, "Call the doctor, I think I'm gonna crash"
"The doctor say he's comin', but you gotta pay him cash"
They went rushin' down that freeway, messed around and got lost
They didn't care they were just dyin' to get off...
Eagles '76
I'm optimistic because I think the central question has been answered: will people respond, or will they remain in denial?
We are seeing responses wall to wall. Now, some of those responses are stupid ("E85 Everywhere") but I'll take 'em. I figure the stupid ideas will drop out of their own accord. They are a little wasted energy, but there is your invisible hand, and creative destruction, in action. Heck, a few weeks ago commentators here were maligning the invisible hand for its inaction, and now it is off the stick:
Mobilization ...
"What people are seeing at their gasoline pumps reflects the global economy in which we live," President George W. Bush said last week. "I think we need . . . to encourage conservation, to expand domestic production and to develop alternative sources of energy like ethanol."
Oh my! Dubya used the C word!
I agree... I too am surprised by the amount of response. I thought it would take $5/gallon gas before we saw this.
Hopefully, gas prices will stay high enough in the near term to get people to make more permanent investments and changes.
If our politicians had any guts they would enact an adjustable gas tax that would keep gasoline at a minimum of $3.50 and then increase this amount by 25 cents a year till it hit $5.00 a gallon. If this happened, we would see huge investments in alternatives.
But, if oil prices stay in the $60-$70 range for the next 6 months, I think you'll see this issue drop completely off the radar, as people become used to it.
You have to remember that for US citizens, oil is still really really cheap at $70 a barrel.
http://tonto.eia.doe.gov/oog/info/twip/twip.asp
And check out Cost of raising corn grows
The market doesnt work in situations like this. End users can earn a 100%+ return by buying front month NG now and storing it against Jan-Feb needs (price is over double). But there does NOT exist such storage capacity otherwise people would be doing it. NG market will continue to be just in time inventory - crisis will be here first time we have hot summer or cold winter. (Russia had a VERY cold winter this year).
The mild winter has (because of lowering NG demand) put some relief on coal/rail infrastructure and if there is alot of left over NG by summers end it will likely replace coal for power demand at the margin rather than be potentially flared (gasp!).
This is a long winded answer of saying the crisis in NG in US exists -it just has a time lag.
See bottom middle graphic for disparity of temperatures in US/Canada vs Europe/Russia
Natural Gas production is at its lowest point in years though stocks are building. It is all the result of demand destruction. In the last three years, because of very high natural gas prices, many industrial users, such as nitrogen fertilizer producers, have moved overseas where natural gas prices are much lower. It is easy for a lot of people. Natural gas prices of over $15 last November was the death knell for many industrial users. They either moved overseas or just closed their doors for good.
US natural gas production peaked in 1973 then reached a secondary but lower peak in 2001. We are definitely on the downhill side of the peak and will see lower production each year. But because people can either close shop, move overseas or switch to coal for power generation, we will not likely see prices above $15 again for several years.
http://tonto.eia.doe.gov/dnav/ng/ng_prod_sum_dcu_NUS_m.htm
http://money.guardian.co.uk/utilities/story/0,,1779621,00.html
We have local gas storage tanks in the UK that move up and down with the volume being stored. The local tank, less than a mile from where I live, dipped to its lowest level early winter that I had ever witnessed. Interestingly after a cold spell in March the height was raised in April only to take a dive last month close to the winter level and has stayed low.
I think the UK is going to be very 'interesting' this winterin relation to NG.
It's still coming. Denver, as you probably heard, had its first-ever winter blackout, partly due to a downturn in natural gas supply. A fluke, according to Xcel Energy, but many new patterns begin as flukes.
In Vermont we have had 9 days in a row of rain, heavy at times and the rivers are overflowing. I dont know about how common this is as I am new here. With global climate change and such, I assume we will continue to see higher volatility in weather patterns across the globe. Since its a closed system, is the amount of rain, accounting for any glacial melt, the same on the planet each year? And heavier than normal rain in Vermont means it is less than normal elswhere?
A peak oil forum not exactly the place to ask this, but lots of smart weather people on here. I ask, primarily to know the standard deviation of weather, hence crop, hence energy impacts going forward.
Weather patterns have been highly unusual in a lot of places. Parts of Oklahoma and Texas just went through a 100-year type drought. My family's farm in Oklahoma got drier than I have ever seen it. Creeks dried up, and our large stock ponds were down to puddles. My Dad has lived on that place for 50 years, and said he had never seen anything remotely like it.
On top of that, we just had one of the warmest winters on record in my part of Montana. It rained for a record number of days in Seattle. It didn't rain for a record number of days in Arizona.
Maybe this is just part of the normal weather cycles. But I suspect it isn't.
RR
However a rule of thumb is, the more energy (higher temperature) is in the atmosphere, the more water it can transport and eventually rain down. However this doesn't help, when it is a tropical cyclone (Hurricane) oder torrential summer rains, which we had 4 years ago the eastern parts of Germany, and in parts of Poland the Czech Republic.
The water cycle is a cylce, but there are many "storage factors" which change. Deforestation changes the intensity of run-off in rivers, dams do the same. Agriculture uses masses of water and a lot of groundwater which needes to be replenished finally.
To show a regional example: The western parts of Germany are expected to get more precipitation on account of climate change. Weather pattern, however are expected to bring a maximum of precipitation in the summer months. The eastern parts and here especially the region around Berlin is expected to become more and more a steppe. Which is as well to be blamed to the topsoil quality here, sandy soils drain water very well and therefore moisture can't be given back to the local climate (natural landscapes always create their own weather patterns in some parts, best exampel is the rain forest).
Expect more extreme weather conditions in th forecoming years. I presume North America is more prone to such changes, because the north-south direction of the Rocky Mountains or Apalachians help transporting air masses very quickly in both directions.
matthias, berlin
NOAA is one place to track river levels:
http://newweb.erh.noaa.gov
Also the US corps of engineers is another place to check.
A few years ago we had no rain for all of July and none in August till the last few hours of the month. Unique in records going back over 150 years and newspaper accounts back further than that.
A single data point which is not enough to make any inferences from.
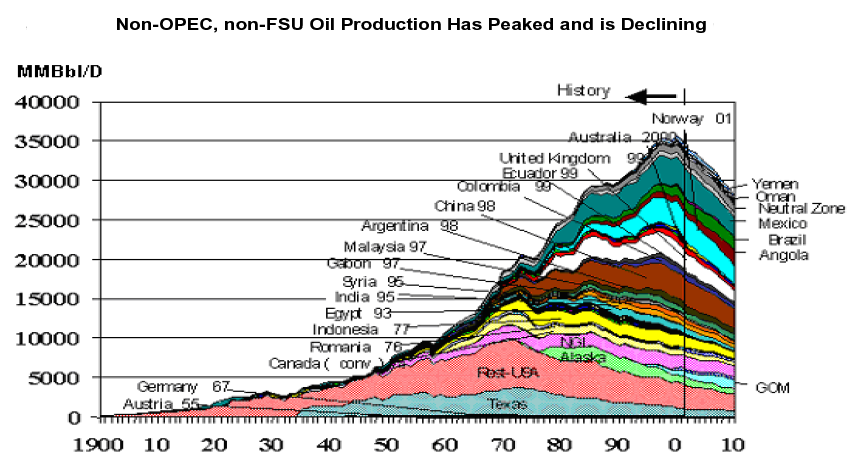
The present plateau is very easy to distinguish from previous ones.
Just look at a graph of total world supply, ex-USA, ex-USSR(and successor states), ex-OPEC.
It's as smooth as you could wish, and it's just peaked.
No outsize contribution of any one country, no political revolutions, no swing producers, no cartel considerations have distorted it.
It suggests that before too long, we're going to plunge.
OK. Just show me one.
In the meantime, you can also see the graph here:
http://en.wikipedia.org/wiki/Peak_oil
RR
Try shrinking the posted dimensions ( to less than the actual picture size) and it should fit a typical browser better. Of course your results may vary with this; Super G probably knows a better way to scale images...
For example <img src="http://static.flickr. ..." height="311" width="574" alt="Hubbertworld2004"> will look like this:
gives
which you should find resizes to fit the width of your center column.
What You Need to Know about Peak Oil
See the 3rd graph down.
RR
http://en.rian.ru/analysis/20060317/44488927.html
A few things worth noting form the above (emphasis mine):
"Viktor Khristenko said the concept of energy security includes the guaranteed demand for its oil and gas abroad. This does not fully coincide with the Western strategy. In February, President Bush called on his compatriots to give up their addiction to oil and focus on the development of alternative energy sources."
So, using President Bush's own analogy, the dealer wants to keep his addicts. I guess the only way to guarantee a certain demand is an agreement to set the minimum for delivery or price, or both.
The Russians seem quite confident that they can deliver lots of energy for several years, quite in contrast to many of TOD's readers.
As the HL model predicted, North Sea crude + condensate production peaked in the vicintiy of 50% of Qt (total estimated recoverable reserves), and production has been steadily falling since 1999. The HL model indicates that the North Sea is about two-thirds depleted.
It's an old story that oil producers are confident of their ability to maintain and grow their production.
Some people in Texas are talking about substantially increasing our production through the use of better technology. Texas is down about 75% from our peak, and we have never shown a year over year increase since we peaked.
Russia's secondary peak was just making up for what was not produced after the Soviet Union collapsed. Existing producing basins in Russia are probably about 80% to as much as 90% depleted.
Is that some of them or all of them?
http://www.theoildrum.com/story/2006/1/27/14471/5832
You can compare Russia to Texas, Lower 48, Saudi Arabia and the world at:
http://graphoilogy.blogspot.com
All math & graphs done by Khebab.
At my request, Khebab took Lower 48 oil production only through 1970 and Russian oil production only through 1984 and used the HL technique to predict the cumulative production for each region through 2004. Actual Lower 48 cumulative production through 2004 was 99% of what the HL method predicted, and actual Russian production through 2004 was 95% of what the HL method predicted. The post-Soviet rebound in Russian production is just making up for what was not produced earlier. I predict that Russia is on the verge of a catastrophic production decline.
(Frontier Russian basins are--for better or worse--a huge wild card.)
A few weeks ago you were on a similar repetition streak posting about how U.S. oil imports were declining and it was a sign of the end. A sampling of your comments on this:
http://www.theoildrum.com/comments/2006/5/2/22318/01508/54#54
http://www.theoildrum.com/comments/2006/4/19/9570/97479/27#27
http://www.theoildrum.com/comments/2006/4/18/2149/32950/8#8
http://www.theoildrum.com/comments/2006/4/15/72931/5527/56#56
http://www.theoildrum.com/comments/2006/4/15/72931/5527/2#2
http://www.theoildrum.com/comments/2006/4/14/133429/051/1#1
http://www.theoildrum.com/comments/2006/4/14/102248/160/26#26
http://www.theoildrum.com/comments/2006/4/12/03534/5286/70#70
http://www.theoildrum.com/comments/2006/4/11/4011/39137/15#15
http://www.theoildrum.com/comments/2006/4/10/01432/2048/25#25
In addition you wrote this all up in an article for EnergyBulletin.net:
http://www.energybulletin.net/15126.html
I got so tired of reading the same thing over and over, almost every day it seemed. U.S. imports are declining, this is a confirmation of our "export land" model, things are about to fall apart.
I guess you suddenly stopped posting about this as imports came back up. Should it affect your credibility at all that you focused so much on what turned out to be a short-term effect? Do you take responsibility for an incorrect prediction?
You're still going on about your HL results, the same thing, over and over again. Texas peaked at so-and-so percent. The North Slope peaked at so-and-so percent. Now Russia and SA are at such-and-such percent, therefore we're all doomed. I can almost write your own postings from memory.
Please, stop this cut-and-paste posting! You don't have to post the same thing again and again.
;)
RR
I posted the Russian stuff in response to a specific question from "Oil CEO."
What exactly do you suggest that I do? Ignore his question?
In regard to the oil export/import issue, I'm addressing it in a proposed submittal to the Energy Bulletin. Let's assume that we have what is initially a small decline in exports. What would happen? My bet is an initial decline of imports into the US, followed by a price increase as we outbid other importers--followed by a (temporary) rebound in imports.
Robert's contention is that the decline in imports was due to less demand by refineries. That probably was a factor, but why did oil prices go up by about 20%--as total petroleum imports were falling?
The fact is that no large producing region--as in zero; nada; null set--has shown higher production that what they showed in the vicinity of 50% of Qt. The big exporters, especially Russia, are much farther down the decline curve than is the world overall.
This implies Russia is on the verge of a catastrophic drop in production. In fact, the world in my opinion is on the verge of a catastrophic collapse in net export capacity. (By the way, the mathematical modeling that we have done indicates that Russian production is within the predicted HL limits.)
To argue that the HL Export/Import model is wrong is to take a position that is contradicted by the facts in every large producing region that has gone over the 50% of Qt mark. You can argue this point if you wish, but it is contradicted by the facts to date.
In regard to my thesis that we are (temporarily) outbidding other importers, consider the following news item, posted on 4/30/06 regarding Thailand, "Even if they could afford the fuel, there is not enough to go around."
Why exactly is that? Do you think that perhaps we are outbidding them for falling export capacity?
IMO, this is just a temporary respite. Another looming crisis is what happens when exporters force us to buy imported petroleum with something besides dollars.
We may--and in my opinion will be--be seeing the same kind of news article, except that it will apply to the US, to-wit, "Even if they could afford the fuel, there is not enough to go around."
http://www.energybulletin.net/15503.html
High oil prices hit Thailand hard
Posted on Sunday, April 30, 2006 (EST)
Excerpt:
"I didn't think the diesel price would get that high," said Pongthorn Chaiwat, secretary of the provincial fishing association.
Even if they could afford the fuel, there is not enough to go around.
I disagree--I think Westexas should continue to periodically cut & paste what I consider as vital info for newbies. Those familiar with the info can quickly scroll past, but I would like Westexas to somehow textually flag any new info he discovers to alert the TOD regulars. Perhaps SuperG could inform Westexas when a significant number of newbies join--then he could paste the info to bring them up to speed. Just my two cents.
Bob Shaw in Phx,Az Are Humans Smarter than Yeast?
One other point, regarding your chart, which BTW I very much appreciate.
The chart shows--as I have been pointing out--eight weeks of falling imports and more recenlty, two weeks of rising imports (following an oil price increase of more than 20%).
Your contention is that two weeks of rising imports (in response to more than a 20% increase in oil prices) means that my prediction of a crisis in net export capacity is wrong? Am I accurately stating your position?
For goodness sake, just look at Cantarell, the second largest producing oil field in the world. The oil column of about 825' is thinning at a rate of about 300' per year, which will translate to a decline rate of up to 40% per year. In a very short time period, we are looking at the loss of up to about 20% of current oil imports, from the decline in this one field.
3)refute the conclusions based on logic or contrary facts.
Attacking a post because it is repeated...........just skip it if you are tired of reading it.
Don't forget that finished products were being imported during that time as well, compensating for the drop in crude imports.
I do, though, appreciate his work and the ideas that it brings to the discussion.
Excerpt:
Russian Minister of Industry and Energy Viktor Khristenko, in an interview with Russian Profile [5], had the following statement, "One important point is that the longer we delay making this decision (encouraging frontier exploration in Russia with tax breaks), the harder it will be to feel the effectiveness of the measures taken: the structure of the country's reserves will continue to get worse and Russia could end up facing a real collapse in oil production."
"The Russian government wants the United States to end is uranium anti-dumping duties "
http://www.indiadaily.com/editorial/8904.asp
Cutler J. Cleveland has interesting data (http://www.ker.co.nz/pdf/Net%20Energy%20U.S.%20Oil%20and%20Gas.pdf) about what happened during the first oil crisis in the US: expanded exploration and huge oil and gas investments led to a significantly lower EROEI. This is happening right now, again, everywhere.
These warnings from the Russian oil officials are not new. They have been telling for some time now that the Russian oil production will be in serious decline in few years. I think Russia is the most important oil exporting country to watch for now. They have saved the oil supply by now, but they will probably tip the world supply to decline in a very short time - may be in 12 months.
It shows tree branches lifting 18 wheel truck trailers and containers off the highway and placing them on railroad flatcars. Words are forgetable, it is a visual commercial.
Definitely pushing multi-modal shipments as a good thing.
One is to with intermodal shipping containers. Standard size (in English units) is 40' long, and 8' x 8' in cross-section. Half sixe containers that are 20' long also available. These shipping containers can be used on ocean going ships, rail flat-cars and truck trailers. Several million floating around the world (The US keeps accumulating a surplus since we ship in more than we ship out). On most North American railroads, containers can be double stacked. Almost all foreign railroads only single stack them.
The other way is taking the entire trailer, wheels and all, and put it on another railroad flatcar with the required tie-downs. Only single stack of course. Carry excess weight of wheels, axles, etc.
Containers are more efficient to haul, but require speciality cranes ($$$) to load and unload. Trailers are less efficient to haul but can just be rolled on, tied down and then untied and rolled off with cheaper equipment.
N-S is one of the railroads that are going heavily into containers and to a lessor extent roll on/roll off cargo. Other railroads don't want to be bothered, despite the profits. (It takes a capital investment to get into this business and build quite a few intermodal centers. All of which pay property taxes).
Norfolk-Southern, CSX, Union Pacific, Canadian National, Burlington Northern Santa Fe, Kansas City Southern all serve New Orleans (plus some short haul railroads) so one can observe differences in cargo if one looks.
http://video.google.com/videoplay?docid=-570288889128950913&q=biofuels
If you don't recognize the name, he's the most respected partner at America's premiere venture capital firm, Kleiner Perkins. When Vonid speaks, people in the business community listen.
But he is way off the mark in thinking that ethanol is going to make us energy independent. After all, as someone recently pointed out to me, ethanol only makes up about 1/10th of Brazil's liquid fuel supply. Interestingly enough, Brazil also has almost 10 times the natural gas fleet that we have in the U.S. See the graph in this story:
http://www.greencarcongress.com/2006/05/pakistan_hits_o.html
I addressed some of Khosla's more outlandish claims here:
Daschle and Khosla Ethanol Propaganda
I personally consider some of his comments to be borderline dangerous, because they give everyone false hope and will ultimately result in time wasted on this boondoggle while we could be working on real solutions.
RR
The ONE thing he said that has huge merit is a price stabilization of oil at $40. If oil goes below $40 (or I could argue even $50), there is a tax that brings it back up to that level. The money could be used for research and development, buying more oil in futures market for later stabilization, or other energy smart options. The other benefit is that alternative fuel developers can then make long term plans on higher energy base costs, rather than volatility.
The downside of course, is that given current momentum, such a price floor will just seal the deal on ramping ethanol capacity in this country.
There are two articles in this month's Harpers dealing with peak oil. One is an exposition by Greg Palast, and the other I don't recall (don't have the magazine with me at the moment).
They are worth a read and I hope some peak oil name would write a letter in reponse, as Harper's is good about publishing a spectrum of responses, and we can be sure there will be oil company reponses assuring everything is fine.
http://www.policypete.com/
Maybe Saudia arbia next?
http://www.sbpost.ie/post/pages/p/story.aspx-qqqid=14376-qqqx=1.asp
Sorry, I am not computer guru, nor can I speak Mandarin or Cantonese, so this is beyond my skill level. I was wondering if the increasing numbers of Chinese with computers can access any native language Peakoil websites, or is this info censored by the Chinese leadership: Google and other search engines don't respond, and efforts to access English versions like TOD and Dieoff.com are censored too?
Does anyone know if Chinese MSM and print sources ever bring up Peakoil and global climate change too? I think it is safe to say that the Chinese leadership, among many other countries, probably have assigned analysts to monitor and digest the info of most websites like TOD, LATOC, ASPO, XOM website, etc. When I read about the ongoing environmental destruction and pollution in China I think the Chinese topdogs are purposely keeping their masses uninformed. Can anyone confirm or deny? Thxs for any documented responses.
Bob Shaw in Phx,AZ Are Humans Smarter than Yeast?
After examining this link:
http://tinyurl.com/gd2u9
and the sad photos of Chinese destruction, I started wondering to what extent will the Chinese go to get potable water? WTSHTF, people will do anything, yes anything for water to live one more day!
WILD SPECULATION AHEAD!
Consider if water gets so precious that the Communist leadership considers a plan to 'harvest' a Himalayan glacier every summer. It could be remarkably simple to do.
- Insert a bunch of electrically powered heating rods into the highest and steepest sections of a glacier. The electrical powerlines could be run long distances, or generators could be trucked in relatively close. Alternatively, building large solar reflective lenses to concentrate solar melting in specific spots may have a better water returned on energy invested ratio. Thermobaric bombing a glacier may be considered too.
- Airbomb the glacier surface with coaldust or leftover flyash to instantly raise the albedo quotient; the sunshine melting factor. We have all seen videos of forest-fire aerial bombers spreading that red-stuff--just imagine the same kind of planes dispersing black coaldust.
- The meltwater sinking to the bottom will lubricate and elevate the ice vastly increasing the glacial flow rate, thus speeding the melting process even more as it gets warmer with lower elevations.
- Build a small collection dam downstream to divert this water into pipelines/canals, then send it on to where it is needed. That way the water won't get polluted with the toxic chemicals and unprocessed sewer sludge normally released into Chinese streams and rivers. It is much more energy efficient to never let this harvested glacial water get polluted in the first place-- it takes gobs of energy & equipment to purify polluted water.
If the Chinese eventually become willing to pay $7/gallon for good water as the Europeans are already willing to pay for a gallon of gasoline: glacial harvesting can be very profitable--isn't infinite growth economics great! =(Bob Shaw in Phx,AZ Are Humans Smarter than Yeast?
1.Glaciers are unstable you can't build things ontop of them to melt the ice. It would be very difficult to truck in generators or electric lines.
2 would work but would contaminate the water making 4 a moot point.
An equally good Idea would be to send Earthmarines in to do pushups on the glacier, their body heat would melt the ice.
If china consumes coal/petroleum at our rate they should get more meltwater per year just by the increase in GHG.
Really though small charges placed at the base of glaciers would increase iceflow downstream which would melt at lower altitudes.
I don't have the expertise to fully evaluate the best engineering methods of glacial harvesting, but if it is already being done in Alaska, it certainly can be done in China too at crunchtime:
--------
A one-ton block of clean glacial ice sells for $500 wholesale. Glacier ice harvesting is a successful business in Alaska. Alaska glacial water is used to manufacture perfume products in Japan.
---------
http://www.worldwatersa.com/sources.html
[Please be aware that the owners of this website seek to own and privatize for profit H2O anywhere.] There are many other companies seeking to do the same thing. =(
Also recall that ice harvesting from winter lakes was a huge industry before the invention of electrical refrigeration for food preservation. I think, at some future point, many people in colder climes will earn a good living restarting this industry. If Phx can somehow not become a future ghost town--we will gladly pay bigtime for ice to be railroaded in when it is 115 degrees outside and Olduvai Gorge has cut the power.
Bob Shaw in Phx,Az Are Humans Smarter than Yeast?
Just about anything is possible if you got the intelligence and the energy. But shipping ice the mind-boggling distance from Alaska to Japan to make perfume does not show intelligence and is obviously a huge waste of energy. Makes driving a HUMMER with a single driver kind of pale in comparision. We will do anything for profits!
-----------
I'm sure of this much, though: If you're looking for a straight word on global warming, the last people to ask are oil companies, auto manufacturers, electric companies or the politicians they hire. They would pump carbon monoxide into maternity wards if they could make a buck at it without getting sued.-- Donald Kaul, Tribune Media Services
in the 10/27 Orlando Sentinel
IF the corporations only can be stopped by human die off, THEN the corporations will be stopped by human die off.
-- Jay's Theorem
------------
http://dieoff.com/page128.htm
Bob Shaw in Phx,AZ Are Humans Smarter than Yeast?
Any engineers out there have access to schematics for a cell phone jammer that i can put in my automobile?
Ok i feel better now!
If TSHTF it would be a really useful thing to have, if it doesn't, then it would be an interesting and probably very rewarding enterprise anyway.
Does anyone know if anyone has actually done anything towards this? It's something I'd be really interested in getting involved in.
Perhaps this link:
http://www.jisc.ac.uk/index.cfm?name=pr_webarchiving_news210604
I have also read articles about imprinting metal sheets [titanium?] with the vital info of civilization so future generations would not have to re-invent everything from scratch. But in the geologic long run: it is all pointless.
Excerpt from "Science and the Human Prospect"
---------------------
Our cosmological calendar in this chapter is very misleading in one sense. It implies that the 14 billion year history of the universe has had but one purpose: the linear, progressive evolution of the human species. Yet the list of events on our calendar is only one possible list that could be displayed showing a particular species at the end. The cosmic calendar is not a list of progressive success. For instance, modern humans did not evolve from less intelligent, more brutal Neandertals. Neandertals were just as intelligent, just as compassionate, and existed at the same time as early humans. They had their day in the sun so to speak. They are gone, but our species will need to survive another 200,000 years to match their longevity.
An understanding of natural selection and evolutionary biology, the science that fills in the details of natural selection on Earth, demonstrate that even on Earth we are not special. No species is special. The majority of life forms that have lived on this planet are extinct, and the average life time of a species is 10 million years and a vertebrate species like ourselves a mere 2-3 million years.
A study of biological evolution is a sobering and humbling experience, revealing no direction or purpose. Life evolves, not with a design in mind or lofty plans for the development of a ruling creature, but by offering variety, spinning the wheel of chance with every birth, gesturing with each unique creature for acceptance from the environment. In the process it produces a "messy" equality, a very wide bush of successful branches with no branch any more fit than another or guaranteed a long future. Human beings are doing well in terms of sheer survival numbers, but insects are also doing very well, and they have been here much longer and are much more likely to survive a human-made or natural catastrophe. As humans, we boast and celebrate that we alone possess "intelligence," but even if this is true, there is no guarantee from nature that this characteristic is any better than the body structure of a mosquito; it is just another experiment, another gesture for acceptance, perhaps only an evolutionary afterthought. All we can honestly say is that both the characteristics possessed by human beings and mosquitoes have served each well, so far.
-------------
http://www.hcc.hawaii.edu/~pine/book1qts/chapter1qts.htm
Bob Shaw in Phx,Az Are Humans Smarter than Yeast?