Heat over the heartland
Posted by Heading Out on August 2, 2006 - 10:53am
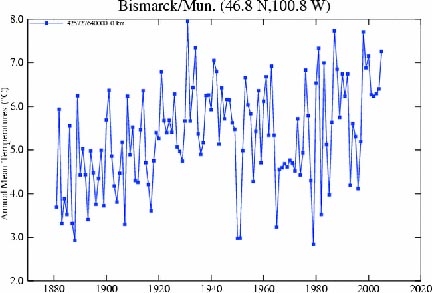
Let's start in North Dakota - how about Bismark, N.D.
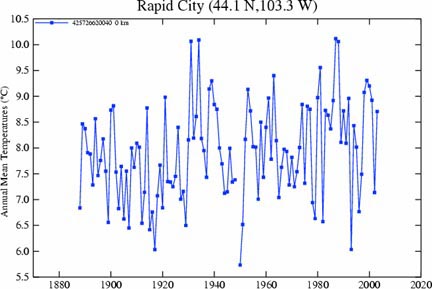
. Then we move to South Dakota, so how about Rapid City
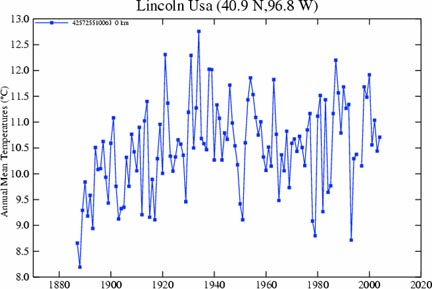
Then there is Nebraska - let's check Lincoln
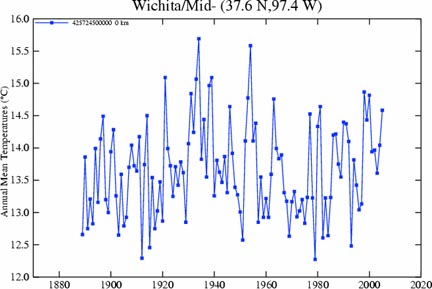
And so we come to Kansas, and Wichita
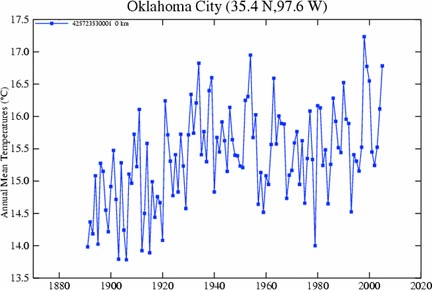
And still heading south we come to Oklahoma, let's pick Oklahoma City
And so we come to Texas, and on to Abilene
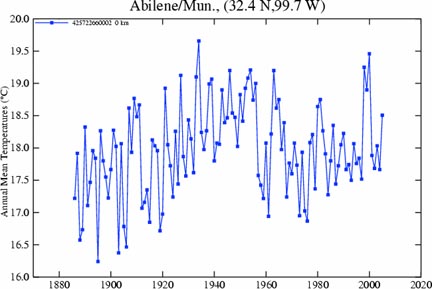
You know, it's a funny thing, but to me it looks as though in almost all these cases it was hotter during the Dust Bowl days than it is now, just as it was for the lone example that I used before.
I was talking to an acquaintance in Missouri the other day, and she was saying that the rain, what there was of it, was getting dirtier. Which is not a good sign. And if, in fact, we are going back towards those days in the 1930's, particularly in the Mid-West, then one has to wonder how successful the transition to a biofueled economy is going to be.
Grin, and in fairness I guess I should also add a couple of spots from the fringes - from the Great State of California we have Sacremento

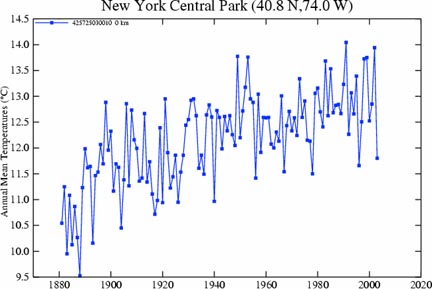
And, for our Big Apple friends, where else but Central Park
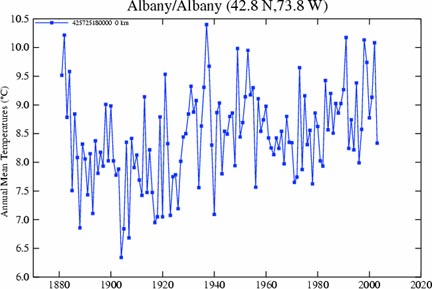
Oddly the temperature change is not that consistent if one looks at Albany
But if I were to make a comment there, I might get my hand slapped again. So I give you this data for your comment.
Contact
- Content: editors at theoildrum dot com
- Tech support: support at theoildrum dot com
License

This work is licensed under a Creative Commons Attribution-Share Alike 3.0 United States License.
I would think that it would be the temps in the city go up quite a bit...even if the countryside stays the same.
Maybe checking cities doesn't give the whole picture.
Thoughts?
Rick
I don't think the airport was there during the dust bowl days, but you'll have to take my word for it b/c I wasnt around. We also have a lot of weather instruments (radar etc) set up in the rural areas so I'm sure the readings are different there too. I think it's hard to be accurate on temps when so many other variables seem to shift the focus a bit each time until you're off course entirely.
http://www.realclimate.org/index.php?p=44
Remember that the areas that are warming the most, as predicted by GW theory, are the poles. Temperatures up 3 to 5 degrees.
My brother lives in Anchorage, AK where the summer temperatures are much higher than even 20 years ago. And you can watch the snow pack dissapear from the Chugach Mountains.
The Global "Warming" phraseology is an unfortunate one that stuck before people realized it may send "wrong messages".
The increased trapping of solar energies by CO2 and other GHG's leads to Climate Change. Part of that Climate Change is the melting of the ice caps. Part of that Climate Change is the shift of annual rain patterns.
When rain fails to come to the MidWestern states, we have a dust bowl.
Yes it does make us pause and re-think the wisdom of the crowds regarding the biofuel strategy.
The fact is, nobody is sure exactly how to do it--except for the ones who are surely doing it wrong.
Based on casual empiricism, my PSI (Personal Sweat Index) tells me that common estimates of the impact of urban heat islands is off by roughly a factor of two; in other words, spreading cities matter (I think but cannot prove) roughly twice as much as the most commonly quoted estimates.
william @ 6:33 pm
There are quite a few reasons to believe that the surface temperature record - which shows a warming of approximately 0.6°-0.8°C over the last century (depending on precisely how the warming trend is defined) - is essentially uncontaminated by the effects of urban growth and the Urban Heat Island (UHI) effect. These include that the land, borehole and marine records substantially agree; and the fact that there is little difference between the long-term (1880 to 1998) rural (0.70°C/century) and full set of station temperature trends (actually less at 0.65°C/century). This and other information lead the IPCC to conclude that the UHI effect makes at most a contribution of 0.05°C to the warming observed over the past century. continues...
http://www.realclimate.org/index.php/archives/2004/12/the-surface-temperature-record-and-the-urban-h eat-island/
How about a series of highest recorded temperatures for cities?
For species less adaptible than ours, the extremes in temperature (and precipitation) are much more important than the annual averages in affecting the health and reproduction of natural populations. Plants and animals are affected, like us, by drought, blizzards, heat waves, etc. The effects tend to be most pronounced towards the edges of their geographic distributions.
I haven't run across a summary measure for heat waves, which is not to say there isn't one. However, I have looked at the annual highest temperature for 36 representative climate monitoring stations in British Columbia, where I live, for the period 1950-2001. Only about a third of the locations show evidence for any increase in the maximum temperature. The increase at those locations is about a degree Celsius in 50 years.
Reasonably complete data sets are pretty rare in my experience, especially when looking at locations with records back into the 19th century. The outcome of even simple analyses can be affected by how the missing data are treated. Temperature records have been kept in BC for about 150 years, but the analysis back to 1950 is probably the best that can be done with confidence.
How have Methane levels in the atmosphere changed over the last 100,000 or so years?
What are the main sources of atmospheric methane ?
What would be the easiest way to reduce the amount of Methane released into the atmospher?
Just curious.
Sewage, landfills, and agriculture forms it, it also occurs naturally in swamps. There is fear melting permafrost could release large amounts, and the seafloor at high pressures and low temps has some.
Methane: A Scientific Journey from Obscurity to Climate Super-Stardom
By Gavin Schmidt
http://www.giss.nasa.gov/research/features/methane/
=======Methane hydrates and global warming
david @ 12:52 pm
There is an enormous amount of methane (CH4) on earth frozen into a type of ice called methane hydrate. Hydrates can form with almost any gas and consist of a 'cage' of water molecules surrounding the gas. (The term 'clathrate' more generally describes solids consisting of gases are trapped within any kind of cage while hydrate is the specific term for when the cage is made of water molecules). There are CO2 hydrates on Mars, while on Earth most of the hydrates are filled with methane. Most of these are in sediments of the ocean, but some are associated with permafrost soils.
Methane hydrates would seem intuitively to be the most precarious of things. Methane hydrate melts if it gets too warm, and it floats in water. Methane is a powerful greenhouse gas, and it degrades to CO2, another greenhouse gas which accumulates in the atmosphere just as fossil fuel CO2 does. And there is a lot of it, possibly more than the traditional fossil fuel deposits. Conceivably, climate changes could affect these deposits. So what do we know of the disaster-movie potential of the methane hydrates?
http://www.realclimate.org/index.php/archives/2005/12/methane-hydrates-and-global-warming/
I think we homo saps are still extremely ignorant when it comes to the atmosphere. Maybe too ignorant to be pretending we know WTF we are doing???
Sometimes our godz of science are like 3 year-olds playing with loaded guns.
Scientists are ALSO politicians - in search of grants. And they are more than happy to tell the politically correct (or politically incorrect - depending on who is paying them sometimez) and incredibly naive public exactly what it wants to here.
==========According to Lowe, "We now have the specter that new forests might increase greenhouse warming through methane emissions rather than decrease it by being sinks for carbon dioxide."
"The identification of a new source should prompt a reexamination of the global methane budget."
The potentially enormous natural source of greenhouse gases had thus far escaped notice, which experts say is not surprising."
(( I wonder what else might have escaped the notice of the godz of science... "just trust us... no really !!"))
http://news.nationalgeographic.com/news/2006/01/0111_060111_plant_methane.html
That article shows Science (includes you) does not know enough about the atmosphere to be confident of any predictions let alone any recommendations for action. The is not an experiment in a test-tube, this is the Real World Atmosphere with Real World Consequences.
I hope someday the godz of Science can produce a working model they can agree on and is consistent for predicting hurricanes and their paths.
Let them Count Carbon molecules but be very skeptical of any actions Scientists recommend beyond cutting CO2 emissions.
The rate at which methane has accumulated in the atmosphere has slowed in recent years. Discussing Keppler's paper in the same issue of Nature, David Lowe wrote:
Since the main sources of methane are biological, it's hard to do much about them. Reducing the area of wetlands is generally thought to be a poor idea. Scientists remain worried that global warming, which is predicted to be most intense in the Arctic, will release large quantities of methane as the permafrost thaws.
Ongoing research here in the Asphalt Wonderland. The blacktop can get so hot here in the Valley of the Sun that a person can get terrible burns.
http://www.epa.gov/heatisland/
http://www.asu.edu/caed/proceedings99/ESTES/ESTES.HTM
http://eetd.lbl.gov/EA/Reports/41973/41973-3C.html
Bob Shaw in Phx,Az Are Humans Smarter than Yeast?
There are some very strong correlations between greenhouse gas concentrations and temperature.
However, science does not know enough to attribute causality to those greenhouse gases; worse, they are nowhere near knowing enough to attribute warming to those greenhouse gases as a single cause.
To compound the difficulty, we are speaking about causation over time, not just at one point, which makes it even more dynamic, if not impossible, inside a complex system to say that a single X caused Y!
Causal language is dangerous, especially in a world with multiple conjunctural causality surrounding us.
I drop a pen, it falls. Every damned time it falls. That's causality.
Does this mean that global warming is not being caused by man-made mistakes? Absolutely not!
It just means that we don't have enough evidence to say if warming is being caused by multiple natural cycles/phenomena, multiple man-made activities, or the more likely of the two, BOTH.
Can we just say that there is a really strong correlation? Please? This whole thing is driving me semantically bonkers.
The argument is much more subtle. It is about how to correctly weigh the known underlying physics of CO2 in the larger climate system.
yes, there are related hypotheses that have shown causal mechanisms and their effects, but the problem is that there are many causal mechanisms going on inside this system, many of them we don't understand...
yes, there are related hypotheses, which the repeated testing of has demonstrated single causal mechanisms and their effects, but the problem is that there are multiple causal mechanisms going on inside this system, many of them we don't understand...
attributing single causality to one of them...that's tough to do.
we cannot reject the null hypothesis that there are not other cyclical factors at work, can we?
and I know that "X causes Y" is a lot easier to market than "Xsub34 is responsible for 38 percent of the variance in temperature, which is highly correlated with factor Xsub3 which also..."...yadda yadda yadda.
I'm just tired of this whole debate being framed in a way that a single X causes all of the variation in Y over time.
Yes, I know it's a minor, trivial point in the greater good. This has to be marketed, sold, etc., and I am supportive of the cause.
It's just been bugging me ever since I saw An Inconvenient Truth. "These two lines covary so they must be causal..." Drives me insane from a scientific point of view, that's all.
But then again, I am terribly methodologically conservative.
- Be conservative.
- Be more conservative.
- Always conclude your article with a plea for more research, because it is always needed. The name of science is replications done over and over and over and over by different qualified scientists. Then when they get the same results, worry; maybe it is all a coincidence, or maybe errors counterbalanced one another.
No claim to empirical knowledge is ever immune to revision.Please never to mention filthy lucre amongst us holy and pure ones.
"And, while you're up, get me a Grant."
He might have gone more math heavy ... but I seem to remember a prof speaking to the public's lack of understanding of the exponential ;-)
I believe CO2 emissions are one of those things currently growning on such a curve.
If you locate a graph which has both CO2 concentrations and Deuterium/temperature plotted on the same time scale you will see that CO2 and Temp are correlated. However you'll also notice that in basically all instances, temperature rises and then CO2 rises. While there is lab evidence that CO2 will cause a temperature increase because of it's properties as as greenhouse gas, CO2 has not historically driven temperatures based on the evidence we have. While I'm skeptical of the magnitude of human influence on climate, I'm also cautious and believe it would be prudent not to "tempt fate."
Just because some or even all past CO2 increases were preceeded by increases in temps first, doesn't rule out the opposite. If there is a positive feedback at work - rising temps liberate CO2 from some reservoir, which drives temps higher, which liberates more CO2, etc - then the current anthropgenic CO2 release can, perhaps uniquely in geologic history, initiate the same positive feedback loop.
In my opinion, recreating SOME of the conditions at the Permian-Triassic extinction event is bad policy, regardless of which exact condition was specifically responsible for initiating the extinction. It does make fascinating geologic experimentation though.
http://en.wikipedia.org/wiki/Image:Vostok_420ky_4curves_insolation.jpg
Now if your going to claim higher temperatures caused the higher CO2 levels in the past rather than vice versa it helps to have a possible mechanism. I offer this: the higher temperatures in the northern hemisphere melted some of the glaciers and permafrost allowing the CO2 and methane trapped in the soil to escape.
is the place to start. I think you'll be suprised. But note: I'm cautious and believe it would be prudent not to "tempt fate" because the potential is there to destabilize this gem of a climate we have going right now, not to mention the (potential) benefits of ending the fossile fuel age.
Also, if you're interested in tracking down such things...there was some research done a few years ago which yeilded an interesting hypothesis that the rise of the Himalayas may actually have much to do with the climate of the Earth and the relative stability we've seen during the past some-odd thousands of years.
Some things to consider with climate(varying scales, of course):
(subject to feedbacks)
Thermohaline circulation
Global atmospheric circulation
Atmospheric composition
Ice/water/land albedo
Ocean - atmosphere interactions
(not subject to feedback, but relavent)
Position and size of continents: epeirogeny, orogeny
Solar cycles:
-earth orbit
-solar "constant" variability
Volcanic eruption
-atmospheric dust loading
Random
I mean, look at the utility of things like Hubbert's methods, which are totally divorced from mechanism.
The tragedy is of course that the only true confirmation will be time, and that ultimate confirmation of course post-dates any possible response.
(really strange to think where we'd be with global warming, but without gigaflop processors)
Seems fairly conlcusive to me...
Re: It just means that we don't have enough evidence to say if warming is being caused by multiple natural cycles/phenomena, multiple man-made activities, or the more likely of the two, BOTH.
Nope, it appears that we do have a considerable body of independent evidence lines (eg. see the Hockey Stick studies and generally speaking, read over at RealClimate.org) for attribution of increased warming to changes we've made in the Earth's atmosphere. Can I say definitively that the 2005 warm year is attributable to GHGs? No. Can I say that the warming since 1988 is attibutable to GHGs? In the absence of other detectable causes, that would certainly be a good hypothesis. Nothing falsifies it so far. If I consider the temperature record since the 1880's, can I make a further inference? Etc. If we look at ice cores for the last 600,000 years and other paleoclimate studies and we can create climate models that are faithful to the proxy temperature record and more recent events (eg. Pinatubo), then confidence increases.
See no trend in the level of solar activity since 1950s. Also, there is a non-linear relationship that must be taken into account --
I agree it is reckless to make specific attributions in individual cases. But the Precautionary Principle tells us to hope for the best but assume the worst... Why don't we go with the best hypothesis we have? Jim Hansen will tell you we better act now before it's too late... Argue with him.I just hate calling correlations "causal." That's all. There's a lot we don't know about explaining the variation in temperature over time, but we know more now than we did yesterday, and we'll continue improving our models.
Tis' a complex world...
Not to pick a fight on this, but how the mean temperatures are calculated are critical to understanding global warmings impact. The mean temperature tells you very little about the variation. This is true for mean per day, month or even year.
There is no richness to the data on why the mean temperatures are warmer. Is it very hot summers alone? Lack of cold winter alone? Mixture of both? Only normal days but very warm night (no radiative cooling at night) causing means to be higher?
All those details are lost in mean data sets presented by the National weather service. But all those details are critical for plant and animal life to survive. 100 F days with 68 F nights during the summer in the midwest are not nearly as destructive to plant communities (even with droughts) as 97 F days and 78 F nights. Might be the same means, based on amount of time at between the extremes, but the impact on plants and animals is worse with high night temperatures.
The same can be said for seasonal extremes and timing. Check the heating and cooling degree days to see what is happening to the climate. Where I have lived in the midwest for the past 20 years both heating and cooling degree days are increasing yearly compared to 30 year averages.
The data presented by HO doesn't really show how we are using more energy. In the upper midwest we are using a bit more energy to fight warmer than normal summers but we are also using much more energy fighting non-normal springs and falls. These transition months have us setting both cold and hot daily records, often in the same month in recent years. Only in the deep winter months are we using less energy, but that is a difference of minus 10 F up to room temperature vs 0 F up to room temperature. This has little impact on people's energy bill because of the short duration.
To end, the spring and fall is where energy consumption has gone way up and the climate has been most impacted. Both cooling extremes and warming extremes are happening often in the same month, with very little change in the mean for those months. The biosphere has more energy in it and fluctuates back and forth between extremes. This has more impact on life than a few weeks of summer heat or winter cold which life has adapted to by geographic location over eons.
Current GCMs have many shortcomings, but they do have enough skill to attribute causes to effects (images from the IPCC's Third Assessment Report):
Doesn't mean the models are right, of course, and uncertainties are large and they have their share of fudge factors ("tunable parameters"). Certainly we'll never prove the case -- science doesn't do proofs. But the models do use testable mechanisms, and it certainly helps with the confidence level.
Nor is it correct to say that GHGs are the only cause for warming. It's more accurate to say that on the timescale involved, and given the behavior of the rest of the system, GHGs are the dominant mechanism that we've been able to find that can describe the present warming.
I drop a pen, it falls. Every damned time it falls. That's causality.
Actually that's still correlation. Now describing a force that causes it to fall and showing that it does -- that's causality.
Bingo. Got me there. :)
Hence why we do not have a "law of global warming."
But yes, correlation matters, and it matters A LOT...I just wish we'd call it correlation...but it's just not sexy enough.
You may be onto something. However, what about the twenty year period from say 1952 through 1972? Was that a period of unusually major volcanic activity? To the best of my feeble old memory it was not.
The most plausible explanation I've heard for global cooling from 1940 to 1973 is that it was due to a decrease in solar radiation during that time period, something similar to the Maunder Minimum and the Little Ice Age. However, the data are as usual, facts that never speak for themselves.
I didn't mean to imply that volcanic activity was the cause; the Pinatubo example provides proof of the degree of climate forcing particulates have in the upper atmosphere. Indeed, many climatologists see pollutant particulates as currently RETARDING the rate of global warming because they change the overall planetary albedo factor. And as mentioned, we have the proposal to use sulfate particluates to cool the planet as a last ditch measure using the same process.
It takes time for particulates to reach the upper atmosphere and accumulate sufficient numbers to force albedo change. Also remember that dust bowl conditions weren't restricted to the USA; it was part of a global drought. WW2 started in 1931 when Japan invaded China; so, particulates related to war and the massive industrial ramp-up for the war started in earnest about that time. Atomic weapons "testing" transfered massive amounts of material from ground to upper atmosphere, and there has been little if any investigation into how atmospheric "tests" contributed to loading the upper atmosphere with particulates, although you'll notice that temps start to rise again a few years after the Test-Ban Treaty was implemented. Personally, I think my hypothesis could become a PhD dissertation. I hope some of the RealClimate folks lurking here will comment on its merits. Lastly, the Ozone Hole shows conclusively that aerosol particulates have great power despite their size to alter the historical norms of the atmosphere enough to greatly impact terrestial conditions.
I supect most of it can be attributed to sulfur or acid rain.
To my knowledge we don't have good number until later
see
http://mitpress.mit.edu/catalog/item/default.asp?ttype=2&tid=10167
For example and consider Soviet production during and after WWII.
In fact the only thing that is probably keeping temperatures where they are now is China industrialization.
If I'm right and we have a global depression that results in major economic slow down in China then you will see massive increases in global warming within 2-5 years of reduced economic activity in China/India.
Other things like cloud formation from high altitude jets also contribute to lowering the rate of global warming.
Agian a massive decrease in air travel would remove the influence.
No the key point is that these suppression factors only effect the rate not the final outcome it means that the warming factor is reduces by some precent probably considerably.
See
http://www.nytimes.com/2006/06/11/business/worldbusiness/11chinacoal.html?ex=1307678400en=e9ac1f6255 a24fd8ei=5088partner=rssnytemc=rss
Dammed if we do and dammed if we don't.
It would be cool to see that plus co2 and temperature on the same plot.
http://solar-center.stanford.edu/sun-on-earth/varsun.html
This may be related to the decrease in temperatures between 1940 and 1970, perhaps its the source of the claim I've read recently that solar activity is susposed to decrease and temperatures fall next decade.
The record from the past is really not an issue anymore. What is still lacking in the climate change community (as far as I understand the situation) are consistent models for geographically localized climate change projections for the future.
--Higher nightime temperatures;
--Higher relative humidity;
--Increase in flash flood types of rainfall.
The data has not shown statistically significant higher daytime temperatures.
Now thats the signature of global warming :)
If your graphs are intended to demonstrate that its really not all that hot this year, you have a few problems:
- The NYC and Albany graphs only include data up to 2003.
- The Sacramento is current up to 2004.
- All the rest do not show any data for the first 6 months of 2006. Obviously, a yearly average for 2006 cannot be calculated yet.
The monthly data in text form can be found at the links you provided. The monthly data DOES include 2006 temps through June, except for the NY and CA cities.If you wanted to extrapolate what the 2006 data point would look like, assuming no unusual temps for the rest of the year, I think you would find that 2006 is off the charts, literally. So far, Jan-Jun of 2006 have been 1 to 2 degress hotter than any Jan-Jun of any previous year in the data sets you linked to. Even hotter than the Dust Bowl years in the few data sets I looked at.
Your data do not support your (implied) conclusion that this year's heat wave is within the normal variation recorded.
We all have access to the same information these days. A previous poster asked some questions about GW. Go find out for yourselves. Read what climate scientists say about GW! Is that so difficult?? Look at the evidence they present. See Al's movie, read his book. Excellent book: Richard Alley's "The Two-Mile Time Machine".
Denying human-caused GW is tantamount to denying PO. Just sad...
Thank you.
Above.
Google: Global Dimming. Learn.
- Fuel scarcity and/or global financial collapse leads to significant decrease in aviation worldwide.
- Decrease in number of flights significantly reduces global dimming (as was proven on 9/11 when all flights were cancelled).
- Reduction of global dimming effect speeds up net global warming.
Actually, this isn't a complete feedback loop unless someone can supply an argument for #3=> #1.> 2 => 3 could contribute to reaching a tipping point for runaway GW.But I imagine 1 =
Too many possible outcomes. Unfortunately, I don't think any of them will be planned.
==========Its all about population!
An interesting point is that the climate scientists refuse to give even "for instance" predictions about what is the "worst" that could happen. They just say, "it could be real bad" and shake their heads. Al Gore alludes to the fact that he has wrung something out of them, but he isn't giving examples either.
Too many are still guilty of rejecting a branch of science because we don't like the answers. The scientific method applied to our atmosphere is the same as the scientific method that made this little internet-thing possible. If we were rational creatures, then arguing about the validity of science over the internet should make our heads explode.
The jury is probably still out on your assumption of the affects that airline travel has on climate. From what I'd heard, in the days following 9/11 when there were flight restrictions in place, there was a noticeable drop in temperature. This was because the exhaust from jetliners is basically CO2 and water vapor, the main culprit there being the water vapor which condenses into wispy high clouds which are better at passing visible light through, yet re-radiate the infra-red spectrum well.
This blurb (I just spent five seconds pulling up so maybe you can find something better) says that "they're not sure" basically: http://archives.cnn.com/2002/TECH/science/08/07/contrails.climate/index.html
Highly questionable hypothesis.
<snip>
# The cooling trend from the 40's to the 70's now looks more like a slight interruption of an upward trend (e.g. here). It turns out that the northern hemisphere cooling was larger than the southern (consistent with the nowadays accepted interpretation that the cooling was largely caused by sulphate aerosols);
</snip>
Google "CFC" "global cooling". Learn.
http://www.realclimate.org/
Everyone keeps providing evidence, things get refined, and we improve our knowledge.
At least, that's how it's supposed to work.
Anything that puts wind in the sails of those who continue to deny GW seems grossly irresponsible to me.
Improving our knowledge is fine and I will assume the climate scientists will do it even while the onlookers posture and deny.
And cut funding.
And nitpick and quibble and pontificate and murmur and grumble.
Chicago, Los Angeles, St. Louis, Joplin, OK City, Amarillo, Gallup, Flagstaff, Kingman, Barstow, San Bernardino. Get your kicks on Route 66.
Evidence! Look at the Evidence! And read what the Climate Scientists say. They aren't a cult, they're scientists who gather data. And if you think it's a scam, then take your next vacation digging an ice core in the middle of freakin' Greenland. Now that's how to party on grant money!!
According to theory, global warming should cause an increase in average sea level over the globe. Correct?
Yet when I look at the same pilings in various places on the globe where I tied up a sailboat forty or fifty years ago, guess what: No evidence whatsoever of a rising sea level. On the contrary, what evidence I've seen suggests a very small (one to two centimeter) decline in average sea level over the past fifty years. Because of wide fluctuations, storms, local settling etc., it is hard to be sure, but just looking at the facts, ma'am, just the facts: I have yet to see any convincing evidence whatsoever of a rising sea level. (And yes, I do know about measurements from space.)
Let's hear from some others who have made first-hand observations on sea level variations since, say, 1950.
The sea level rise, SO FAR, is something like an inch. You won't see it at the docks.
Melting half of the ice in Greenland will raise sea levels 10 ft. Half the West Antarctic ice sheet, another 10 ft. Melt all the ice in the world and we're talkin' 200 ft.
It's just beginning. Be patient.
Complicating matters are a bunch of astronomical phenomena having to do with tidal fluctuations, precession of the equinoxes, and a whole shingle-load of other stuff.
Islands rise and sink all the time. Nowhere have I seen evidence that more are "sinking" than rising.
Ahem . . . cough, choke, sputter, spit, ahem . . . well-understood, like the cycles that cause the ice ages? So predictable those ice ages, . . . . yeah, right.
http://www.grdl.noaa.gov/SAT/pubs/papers/2004BackscatterSSH.pdf
http://www.grdl.noaa.gov/SAT/pubs/papers/2001_Cheney_Encycl.pdf
Now you can't claim such ignorance.
The current estimate of sea level rise based on tide gauges and satellites is 2.8 mm plus or minus 0.4 mm per year. Careful estimates of sea level change due to expansion of the ocean as it warms show that the proportion of sea level rise due to thermal expansion over the last 15 years is 1.7 mm/y, 60% of the total. The remainder is thought to be caused by increased runoff from the land, as glaciers melt and rain and snowfall patterns change.
I would speculate that isostatic rebound could give an apparent cancellation of sea level rise at high latitudes, but it should exacerbate a rise at lower latitudes by forcing some extra water to go there. So at what latitudes does Sailorman tie up?
Do you know the difference between fact and opinion? I think you do, because you have had an education. Knowledge is true justified opinion.
Now, where is the justification for your opinion?
Where are the replications?
Because replications are prerequisite to scientific knowledge, and if you haven't got them, well then, what you have is mere opinion--and nothing more.
I am not talking WAGs. I am not talking cobbled up "estimates." I am looking for solid scientific evidence.
Where is it?
DING! Welcome to the world of the God clearance Sailorman.
Did you read and understand the article?
It supports my position. Thank you again for finding the scientific evidence online that I did not know was in the public domain.
(It does help to read the articles you post, Eric.)
collected since 1992 indicate that global sea level is rising at about 2.8 mm per year.
Yup rising. Not 'earth is falling into the sea' piffl;eing claim by a god cleared inDUvidual.
I just caught this little exchange between some of you and this Don Sailorman re sea level measurments.
It's a real hoot!
If I understand correctly, Don Sailorman believes we should accept as scientific evidence that the sea level is NOT rising because he hasn't noticed any difference in the water marks on some of the piers where he has tied his boat up over the years.
On the other hand, he questions the validity of highly accurate geophysical measurments of sea level that have been accumulated from thousands of locations all over the world.
I guess for Don Sailorman, the location of a smudge of seagull shit on a pier is a more accurate piece of data than TOPEX/Poseidon altimeter data.
Why do you even bother trying to reason with someone like that?
Results:
Empirical evidence gathered from real-world observation is that for this particular car over four years the difference in mileage is approximately ten to twelve percent less for E-85 compared to regular gasoline.
Now who do you want to believe? Somebodies arm-chair theory spinning? Or would you rather put credibility in actual empirical evidence?
The choice is yours.
WANT to believe is the key statement.
But you're going to have do better than showing me the weather temperature record for Lincoln, Nebraska. On the other hand, I could just use Sacremento. But all that goes nowhere.
Generally speaking, mostly Stuart has talked about climate change here at TOD. For the most part, I have just made comments. But, really, why should either one of us have to serve as a proxy representative at TOD for the problem? As always, I suggest realclimate.org, the IPCC TAR (2001), articles in Science & Nature (and other journals), et. al. Here in the US and in Europe, we are experiencing what is called an extreme weather event. Attibuting such events to climate change is weak evidence for global warming. I tried to confine my remarks in my post to a conjecture that increased electricity usage is due -- in part -- to a warmer world. The data and analysis is not in. I cited the only study I could find addressing the issue. Unfortunately, I seem to be trying to cover mostly untrodden territory in this case.
The science is compelling. Perhaps the most telling moment, as far as a good part of this thread is concerned, is when he talks about a meta-study where the published, peer-reviewed literature regarding global warming is reviewed, over 900 studies and they found that zero, none, nil of these studies went against the world-wide consensus in the scientific community that global warming exists.
The only people who argue against global warming are either fossil fuel company hacks or spectacularly dumb people who say things like I heard a taxi driver say the other day, "You know, that global warming ain't true. Shoot. I 'member a day back in nineteen eighty-one, or two, when they was a day jess as hot as this here day."
God bless the stupid people.
Your remark is regrettable, inappropriate and rude.
the remark, with the message and in context of this posting, is painfully telling of our whole human situation on earth.
If, as a society, we're going to reduce the looming death and displacement of tens of millions of people there will be some hurt feelings involved. More specifically, the idea that every opinion is worth balancing and that all people have some magically valid point of view isn't really helping us. Ignorance and weak thinking need to regain some negative connotations and perhaps be partially substituted with humility. Unfortunately, the current administration and media seem to favor ignorance and belief that the truth is whatever you want it to be.
That is regrettable, inappropriate, and fatal to others.
NO!
I suggest you peruse the The Lost Sayings Gospel Q to understand what Jesus of Nazareth was really up to. Or any of the Great Wisdom traditions. I myself have forgotten from time to time.
I was stupid when I forgot.
THIS is a fallacy!
Stupid people consistently are slow to learn or understand, are obtuse, tend to make poor decisions or careless mistakes, are marked by a lack of intelligence or care.
They DO exist and in LARGE NUMBERS, this is precisely the problem!
Of course religious people deny this.
I am an atheist, I am a bit chagrined that natural selection has to wipe out the whole specie to fix this "little problem".
You probably did not read The Basic Laws of Human Stupidity no more than I read your "Gospel", where do we go from here?
A pity you won't look at the scholarly reconstruction of the Q Gospel which is actually a step away from blind faith in a makeover of some Indo-European storm God or Semitic God who will save us.
No evidence?
Sounds like an instance of the fallacy of invincible ignorance to me.
No "sound scientific argument" to prove the nonexistence of the Flying Spaghetti Monster either.
Sounds like an instance of the fallacy of invincible ignorance to me.
I admit you are an EXPERT in "fallacy of invincible ignorance".
google it
Did it.
JUNK!
Anyway we are drifting quite a bit from PO.
I suggest you pray for a "new energy source", it should work...
As for Global Warming, all the pictures of the retreating Glaciers on our planet make the case for me.
When do we the voters form an opinion, when we hear the conclusions of august and learned experts? Or is the burden on the experts to make an arcane scientific case accessible to the general public?
PO and GW both suffer from this. If we wait for a voting majority to understand the guts of the mathematical models, a majority will never be formed. On the other hand, society seems to reject learned opinion at this point in history.
... who are those scientists to tell me what to think anyway? Just because they spend decades learning about a problem they think they know more than I do!
FWIW, I think I'm swayed when experts in both areas say "out best models suggest ..." because, after all, if we aren't going to trust the best models, what are we going to trust?
Personally, I'm trying to rid myself of an excess of brain cells in so far as I have concluded they also cause an excess of pain. I'm sure many here have concluded that I've been successful in my assiduous efforts in this regard. Unfortunately, problems like peak oil, natural gas and the climate do not disappear but re-appear every day just like the morning sun.
A generous daily dosing of ethanol over an extended therapy period will do wonders for clearing out all those pesky excess brain cells.
It worked for me; and it can work for you.
The morons should be made to acknowledge their "moronity" even a Nobel prize can be a moron when speaking outside his domain
The vast majority have "opinions" about ANYTHING, views differ, earth is flat...
A Primeval Tide of Toxins
Runoff from modern life is feeding an explosion of primitive organisms. This 'rise of slime,' as one scientist calls it, is killing larger species and sickening people...
"Scientists gathered from around the world to examine the damage. They wrote a paper predicting that the corals would rebound quickly, as they had for thousands of years.
"We were the best ecologists, working on what was the best-studied coral reef in the world, and we got it 100% wrong," Jackson recalled"
(( be carefull with those loaded gunz Children ...))
http://www.latimes.com/la-me-ocean30jul30,0,486969.story?coll=la-headlines-world
Ghostbusters 1984
I just like the part where the scientists says, "we got it 100% wrong."
Science is not a godz after all.
Think about bowling averages. Here in New England we bowl Candlepins (we call it Real Bowling!), and a decent average is 100. But having an average of 100 doesn't mean that this bowler bowls 100 every game. Sometimes less, sometimes more. Now, as they (hopefully) improve, their average goes up. This increases the probability that, at some point, they will have a higher game than they would have before. A bowler with a 110 average is more likely to bowl a 140 game than a bowler with a 100 average. And do it more frequently.
So it's the same with Global Warming - a slight increase in the Earth's average temp increases the liklihood that there will be warmer temps sometimes. Earth's "bowling average" is a little higher. And if it was just a matter of things being a little warmer that would be one thing, but unfortunately a little bit of GW leads to something else which is called "Climate Change". This is what we are starting to clearly see worldwide, and the potential that we will reach some sort of "tipping point" and the weather will change very dramatically is all too real. Research done within the last 15 years has revealed much about the past changes in climate. Ice cores, ocean sediment cores, numerous land-based and geological studies all show the same thing. The climate on this planet is very, very unstable. Very bad things can happen very quickly.
At 2AM this morning it was 87 degrees on the Mass-NH border. Unprecedented.
This assumes the spread of each bowler is similar. Consider this:
Joe's Games: 105, 106, 108, 110, 110, 110, 112, 114, 115.
Joe's Ave: 110
Stan's Games:60, 60, 60, 60, 100, 140, 140, 140, 140
Stan's Ave: 100
Who's more likely to bowl a 140 and more frequently?
Oh the insignificance of statistical significance:
BTW, I think Einstein was right about God not playing dice.
Right, emotional bullshit is so much more appealing to the "masses".
I think Einstein was right about God not playing dice.
Sure, quantum mechanics does not work, well know to janitors and taxi drivers, God told them...
I think you missed the whole point of that exchange at the 5th Solvay conference. And why the Copenhagen Interpretation issue keeps coming up in Physics Today. And why we are still working on a definitive Bell's Inequality experiment.
Is there a problem? Very possibly. But I tend to be scientifically minded and to wonder about emotional hyperbole. Unprecedented? Now, that's a strong word. It might even be true. On the other hand, we have, what, around 125 years of anything that could be called widespread actual weather records? For times before that, we have what? Non-quantitative diary notes. Thoroughly unreliable oral tales. Dubious anecdotal tales based in part on the sort of selective memory that had so many of our forebears walking five miles to and from school uphill both ways. Dubious Kunstlerian contemporary speculation based on arcadian nostalgia for an imagined dead past when the climate was uniformly equable and life was "simple", leaving people unburdened by such unfair things as the need to study and/or acquire skill.
Before the late nineteenth century, what real clue have we got about the statistical extremes of daily or even weekly temperature? Based on the last 125 years or so, we can guess, maybe, at two-sigma values - while still knowing next to nothing, empirically, of what the long tails really look like, since with such a complex phenomenon as weather they may well not be terribly close to Gaussian. So by what means do we actually know, say, that the nighttime temperature at that 87-degree spot never exceeded 97 degrees sometime between colonization and the late nineteenth century?
Maybe this map is not yet known here:
You can find it on the
US drought monitor page
I think this shows quite impressively, that the middle of the norh american continent is currently very dry, with some especially dry hot spots.
There is an animation which shows the development over the last couple of weeks and months....
cheers, marotti
All this talk about Climate Change and little talk about the topic so dear to our hearts -- oil, black, sweet oil.
The convergence of Climate Change and PO is what we should be discussing. Climate change lends itself to debating little factoids. But if we are going to talk about:
Climate Change or PO or GWOT or overpopulation
we should talk about common solutions -- conservation, alternative energy, conservation, CAFE, conservatation, light rail, conservation, over consumption, conservation, etc.
I just did though my focus was not on peak oil per se.
http://www.earlyalert.com/Resources/templates/DrGray2005c.htm has the update. A reduction in named storms from 17 to 13; a reduction of hurricanes from 9 to 7, and a reduction of severe hurricanes from 5 to 3. If Gray is right this could turn out to be a relatively mild storm season.
After reading "Fooled by Randomness" I only trust people who are willing to throw out their predictions and explain why.
(People who throw out predictions, and restart without explanation are as bad as those who stubbornly stand pat.)