Oil export - import model for the UK
Posted by Euan Mearns on September 20, 2006 - 12:00pm in The Oil Drum: Europe
This post follows up on the work of Khebab and Westexas on US oil imports and the recent discussion on TOD about declining oil exports from Export Lands. In the Export Land model, the focus is on oil exports as opposed to oil production. This recognises that the economies of many oil-exporting countries are booming, e.g. Russia and the UAE, resulting in sharply increased consumption of oil by those countries and this decreases their oil export capacity.
The UK provides an interesting Export Land example because since 1980, the UK has been a net oil exporter. However, following the production peak of 1999, production has been declining at an average rate of 7.56% / year and this year the UK will change from an oil Export Land to an oil Import Land.
UK oil production, consumption, exports and imports
The historic oil production and consumption data are taken from the 2006 BP statistical review. The historic import and export data (1965 - 2005) are calculated by subtracting the oil consumption from the oil production figures. This shows that the UK became a net exporter during 1980 and the data point to the UK becoming a net importer during 2006.
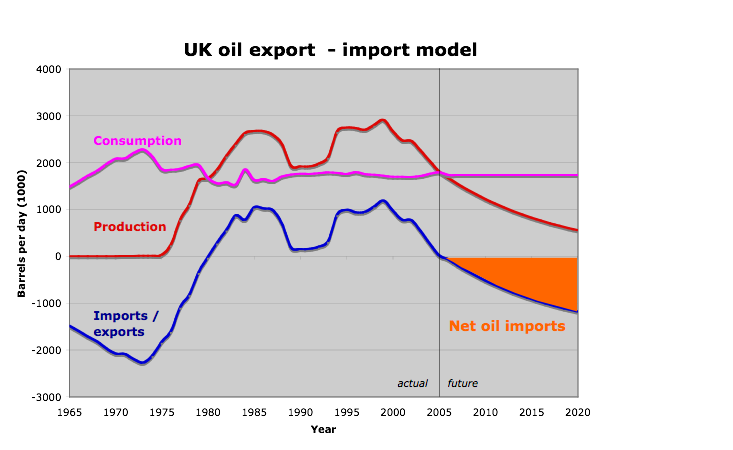
UK oil production peaked in 1999 and has since gone into steep decline. Click to enlarge.
The double peak in UK oil production has compound origins. Production decline in the mid 1980s was initiated by the oil price crash of 1986 that led to the postponement of several projects. Decline was compounded by the Piper Alpha explosion in 1988, which led to lost production from the Piper hub and deferment of production in many fields whilst sub-sea safety valves were installed in the wake of the disaster. During the early 1990s several large new fields were developed (e.g. Nelson, Scott, Bruce, Miller), and this combined with postponed and deferred "1980s" production coming back on line led to the second production peak in UK North Sea.
The situation today is very different. The only significant new field scheduled for production is Buzzard that will come on stream towards the end of 2006 at a planned rate of 200,000 to 300,000 barrels per day (bpd). Otherwise, most fields are operating at maximum and there is no spare capacity or deferred production waiting to be turned on. The decline that started in 1999, therefore, is forecast to continue.
The only area of UK waters that may contain significant, multi-billion barrel reserves that could likely arrest this decline is the deep water of the Atlantic Margin. The geological history of this area is rather different to the North Sea and it seems likely that known oil source rocks are now too deeply buried. Even if significant oil reserves were discovered here it would be many years before they could be developed. It is highly unlikely that any oil discoveries from the Atlantic Margin could arrest the decline in UK oil production within the time frame discussed here.
Production decline model
Production decline since 1999 has been rather uneven. 2002 was an anomalous good year, the result of the Elgin and Franklin fields coming on line during 2001. These fields produced at a combined rate up to 140,000 bpd during 2002 and this was sufficient to partly offset the relentless production decline seen in most other UK fields (note that DTI production figures are quoted in metres cubed per month)
2000 -8.32%2001 -7.16%
2002 -0.53%
2003 -8.36%
2004 -10.15%
2005 -10.86%
The Buzzard Field, coming on line late 2006 should also temporarily reduce the rate of decline seen in 2007. However, with production falling near everywhere else, including Elgin, Buzzard will provide only temporary respite.
I have modelled the future decline pattern using an annual decline rate of 7.56% per year, which is the average of the 2000 to 2005.
However, data published by the DTI for 2006 production, suggest that decline may be accelerating. In the period Jan-May 2006, the UK offshore fields produced crude oil at a rate of 1.53 million bpd compared with 1.76 million bpd in the same period of 2005. This represents a 13% production decline.
Given that decline in 2004 and 2005 was >10% per year and decline so far this year is around 13%, the decline figure used here may prove to be over cautious.
Consumption forecast model
The oil shocks of 1973 and 1979 led to a change in oil consumption patterns in the UK. The use of fuel oil in electricity generation and for industrial use went into sharp decline. These uses have now declined to virtually zero - and cannot decline much further. This decline was largely compensated by sharply increased use of oil in transportation - gasoline, diesel and aviation fuel. Use of diesel and aviation fuel is still rising.
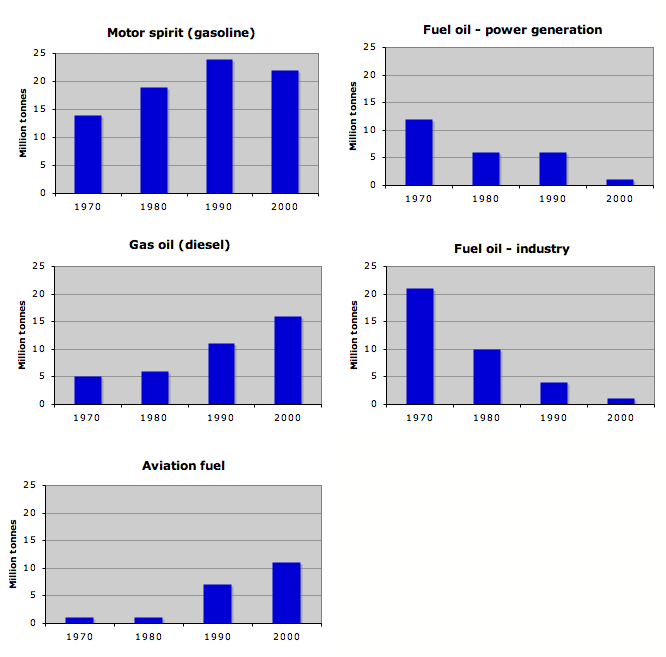
UK oil consumption. Use of oil for transportation is rising while use of fuel oil in power generation and industry is falling. Click to enlarge.
These compensatory trends have resulted in UK oil consumption staying fairly constant in the period 1980 to the present day. The UK population is rising slowly at a rate of about 0.3% per year and per capita use of oil has been virtually flat since 1980 at around 10.9 bbls per capita per year.

UK population is rising slowly and per capita use of oil has been flat since 1980
It is envisaged that increased migration from Eastern Europe combined with increasing use of oil for transportation will apply upwards pressure on future oil consumption and that this may be balanced by downwards pressure caused by higher prices. This may be an over-simplification but this will be the subject of another article.
Thus the flat trend of oil consumption since 1980 is forecast to continue (unless there is a radical change in price and government policy) and the average consumption figure for the last 10 years of 1.74 million bpd is used in the consumption forecast model resulting in a slow decline in per capita consumption as the population rises.
Implications for oil imports / exports and the UK trade balance
The export / import model shows the UK becoming a significant net oil importer in the coming years. Five years ago (2000) the UK exported 970,000 bpd. In 5 years time (2010) the UK may be importing around 500,000 bpd - a swing of almost 1.5 million barrels per day in one decade.
The data plots showing the value of production, imports and exports use the annual average dated Brent spot prices given in the BP statistical review as denominated in 2004 $US. This may be an over simplified picture as not all oil will be traded against this benchmark. But the general conclusions will be valid.
The value of UK oil production peaked in the period 1978 to 1985 (based in 2004 $). Production values collapsed in 1986 as a result of sharply lower oil prices.

The $ value of UK oil production peaked in the early 1980s. Recent high prices have been largely compensated by falling production. Click to enlarge.
Declining production has to a large extent offset the high prices of recent years, though 2005 was the highest value year since the price collapse of 1986 (based in 2004 $).
In terms of export values, the UK has enjoyed a $ trade surplus from oil exports since 1981. By 2005, however, this surplus had all but disappeared and declining production in future, leading to oil imports will see a significant net trade deficit emerge from oil purchases. I have refrained from attempting to forecast the size of this deficit, as this will be dependent upon the future price of oil. However, for illustrative purposes only, assuming an oil price of $100 / barrel indicates an annual oil trade deficit of $25 billion by 2012 (the grey bar).

The $ value of UK oil exports had declined to near zero in 2005. Future oil imports will weigh on the UK trade balance. Click to enlarge.
Mitigation and UK fiscal policy
It is clear from looking at the import / export model from a UK economic perspective (as opposed to an environmental perspective) that everything should be done to incentivise off shore operating companies to produce more oil. This will not arrest the decline curve, but it may lower the rate of decline.

Prudence: UK Chacelor Gordon Brown has increased taxation on UK oil producers even when faced with plumetting North Sea oil production
UK Chancellor Gordon Brown increased taxation on profits from off shore production in 2002 and again in 2005. This is a clear disincentive for companies to invest in North Sea exploration and production.
Equally, serious policies need to be introduced to reduce oil consumption. The oil demand data potentially conceal a worrying trend. In the year 2000, oil used for transportation accounted for >95% of UK oil-fuel consumption and use of oil for transportation is still rising at an alarming rate. It is no longer possible to offset this rising oil consumption by reductions elsewhere. The UK government and the opposition parties are all too keen to flaunt their green credentials. And yet, no serious attempt has been made to reduce oil use in transportation. Indeed the road network and our major airports are still being expanded. Our government needs to act to redesign our transportation network, based on CO2 free electricity. If no action is taken, then future oil shortages will most likely cripple our oil based transportation system.
The sensitivity of the oil import forecast to varying decline rates and oil consumption will be discussed in a follow up post, together with an examination of options for reducing dependency upon crude oil for transportation.
Personnel
Editors
Contributors
Peak Oil Primers
Archives
- November 2010 (3)
- October 2010 (6)
- September 2010 (4)
- August 2010 (7)
- July 2010 (6)
- June 2010 (7)
- May 2010 (2)
- April 2010 (8)
- March 2010 (4)
- February 2010 (6)
- January 2010 (3)
- December 2009 (5)
- November 2009 (8)
- October 2009 (12)
- September 2009 (6)
- August 2009 (5)
- July 2009 (11)
- June 2009 (8)
- May 2009 (16)
- April 2009 (10)
- March 2009 (7)
- February 2009 (10)
- January 2009 (15)
- December 2008 (9)
- November 2008 (9)
- October 2008 (9)
- September 2008 (13)
- August 2008 (10)
- July 2008 (14)
- June 2008 (23)
- May 2008 (16)
- April 2008 (12)
- March 2008 (16)
- February 2008 (9)
- January 2008 (13)
- December 2007 (13)
- November 2007 (16)
- October 2007 (22)
- September 2007 (8)
- August 2007 (9)
- July 2007 (16)
- June 2007 (8)
- May 2007 (7)
- April 2007 (7)
- March 2007 (10)
- February 2007 (10)
- January 2007 (12)
- December 2006 (9)
- November 2006 (15)
- October 2006 (4)
- September 2006 (5)
- August 2006 (5)
- July 2006 (9)
- June 2006 (5)
- May 2006 (10)
- April 2006 (9)
- March 2006 (13)
Vital Trivia
License

This work is licensed under a Creative Commons Attribution-Share Alike 3.0 United States License.
It also does not seem particularly likely in undemocratic countries, because the rulers of those countries are primarily interested in one thing: cash. They will send their domestic oil to where it earns the most money, and in general that will be the international market.
Of course it is automatically true that a country's exports equal is production minus its internal consumption (neglecting any imports). The test of "export land" is whether the per capita consumption of major oil exporters is increasing significantly faster than other comparably wealthy countries around the world.
- they are mature economies, with fairly low energy consumption per unit of GDP anyway, and
- their prevailing ideology does not lend itself to protectionist economic policy.
But it's easy enough to demonstrate the truth of the model on a case by case basis with the major oil exporters (Russia, Saudi, Venezuela, etc...) where oil-product prices are indeed subsidised in order to promote economic growth.I'm not saying this is smart policy, but it's clear that it's happening.
Canada is bound by NAFTA treaty to supply the US on an equal basis to Canada-- the oil flows south from Alberta, not East to Toronto (largely: there are still some refineries in Sarnia, Ontario, near Detroit). Quebec and the Maritime Provinces import their oil.
The UK is, AFAIK, similarly bound to supply oil on equal terms to its EU trading partners, although in practice in 1973 and the oil embargo it was 'every man for himself'. But the price will be set by outside world prices-- no one imagines a UK government would be stupid enough to try to control the domestic price of oil.
PS
Interesting to learn that a plan to seize the Gulf Oil assets was going round Washington and Whitehall in 1973:
http://news.bbc.co.uk/1/hi/world/middle_east/3333995.stm
I agree with you in general, but want to add one qualifier. There is one thing autocratic regimes like more than cash, and that is staying in power.
Iraq had an enormous fuel subsidy when Saddam was still in power. That is changing now, and people are pissed off about it. In short, the rulers have to balance the desire for cash with the need to quell popular unrest, which threatens their regime.
A couple of scenarios are possible:
- despots in exporting countries will tolerate declining exports (rising internal consumption) since the declining oil remaining for export will push up oil prices enough to satisfy their greed.
- The need for cash will get the upper hand and they will back off on subsidies and try to control or suppress public unrest. This reaction would maintain the amount of oil available for export, or at least it wouldn't drop as fast as the Export Land model would predict
Which one should we expect? It obviously depends on what country you are talking about, the severity of any popular backlash to rising oil prices, and a million other factors. In short, it's anybody's guess.Demand destruction is going to occur primarily in the economies that do not benefit from higher energy prices because there will be a massive transfer of wealth from the importers to the exporters. However this only looks at it from a national perspective. The average Canadian is going to be hurting in the wallet just as much as an average Amererican. The big winners are going to be the oil companies and associated industries, their employees, their stock holders and the (Alberta) government.
While you raise some good points what evidence do you have to make the following statement?
"They will send their domestic oil to where it earns the most money, and in general that will be the international market" Does this really depend on the relative purchasing power of the domestic consumer (per capita GDP?)
Secondly exports and imports of oil will also be detrmined by the quality of the oil. Eg In Australia the oil is very light despite declining production much is exported as it is too light to refine into heavier products. So oil such as Tapis and Arab Crude is imported to make gas, diesel and bitumen products.
Thirdly there are long term contracts. Not everything is sold on the spot market to the highest bidder. They may well have to honour these contracts first they may be domestic customers on the other hand they could be export cutomers.
Fourthly distance from markets affects where crude is sourced and where it is sold. For example there are places in the world that it does not make sense to ship oil half way around the world when a local source is close at hand. Consumers rely on more local producers as transport costs impact on input cost.
As for your blanket generalisations about democracy, they are foolish.
An oil exporting country will be enjoying positive trade balance and a strong currency as a consequence. The result is that for the domestic consumption oil will remain relatively cheap even though the price may be rising for the oil importing countries.
The same thing is happening now with the US. Oil is realtively expensive for the US residents, but it is hardly felt outside of the US, because of the weakening dollar.
What is interesting in this article is that it shows exports decline (in the UK example) at consumption increase - production increase. Actually I suppose somewhat obvious.
Saudi Arabia's oil consumption increased by 11% in 2005 -- due to strong economic growth (+6.3%), a growing appitite for SUV's (SUV's are the most popular car in the middle east) and a growing petrochemical complex, and population growth (2.18%). So unless oil production increases 11% then oil exports will decline in the 11% range.
Russia's oil consumption increased 7% in 2005 driven by economic growth (6.0%) and increases in energy usage due to cold weather, and increases in car sales from very low levels.
So looking at the main exporters we are facing about 9% declines in oil exported unless Saudi and Russia slow dramatically and/or alter consumption behavior, or increase production, both of which appear unlikely. Without oil exported there is no secondary market for oil.
Note that Saudi production is down, through 6/06, by 5.2% from last year's level (EIA, crude + condensate). So, as predicted, net oil exports being squeezed from two directions--by falling production and by rising consumption.
- Saudi production down, consumption up, therefore exports way down
- China imports way up (15%?)
- world production flat
- no apparent shortage of oil on the market.
So there is, necessarily, major demand destruction going on. Where? Africa, India? Are the numbers emerging?Saudi Arabia has 20 million people, and GDP per head of c. $8,000.
US consumes 25 bl per person pa, I would bet the Saudis don't consume a quarter of that per person.
Figure 12 bl/per person/ per annum in Saudi: that equates to 240m bl pa or about 600,000 bl/day so less than 10% of total production.
The picture might be a bit more blurry than that because the domestic petrochemical industry soaks up crude (but exports refined products).
The Saudi birthrate is surely an anomaly in terms of classic income-per-capita demographics. It's a rather extreme illustration of the fact that demographic transition is mostly about the emancipation of women.
Income per capita has roughly fallen by 2/3rds since 1974 in Saudi Arabia (population has tripled, the real price of oil is no higher, there hasn't been enough other industry come in to fill the gap).
Saudi Arabia is also dependent on 'shadow water' (the term used to mean the water imported as part of food and other products)- -it doesn't have enough of its own resources.
The country is on the edge of very serious political and social trouble. The combination of widespread religious radicalism, a corrupt ruling class, the absence of any meaningful democracy, and poor prospects for the huge majority of the population under 21 is a lethal cocktail-- precisely what led to Algeria's civil war for example.
Right now, the current high price of oil (and high production) and the ruthlessness of the state security apparatus keeps the lid on. But there is no question the Royal Family has been shocked by the various terrorist attacks, and the incompetence of the Security Forces at defeating them. The security forces themselves are rumoured to be riddled with Islamicist sympathisers.
Whilst Abdhullah remains alive and in power, I don't expect change. He is seen as an honest man, and not personally corrupt. When some of his cousins get to power, the situation may be very different.
Osama bin Ladin may yet see the day when he is welcomed in his homeland as a hero.
India 2004 oil consumption 2,573,000 bpd
India 2005 oil consumption 2,485,000 bpd
One of the developing economies to show a fall in consuption last year. Note that France, Germany and Italy also show falls in crude oil consumption - in part related to de-indutrialisation, but maybe also through introduction of "alternatives"?
When you think about it, the easiest answers tend to be the same ones which make Germany the world's largest exporter - a tight focus on efficiency, a hard headed view of costs, and an awareness of the entire cycle of production, from acquiring raw materials to disposing of the waste at the end.
Oil costs Germany money, whereas wind turbines, for example, are planned as a future export product - and with a fully electric rail transport system, it is possible to substitute long haul trucking with rail, using renewable sources such as hydro, wind, solar - to a major extent, this is seen as an engineering problem, something Germans tend to feel very comfortable in dealing with. Not that Germans are blind believers in technology like Americans - merely that Germans believe technical problems can be solved with technical solutions - for example, if solar is only available during the day, then the freight train schedule will simply have to reflect that fact - in American eyes, that is not a solution, it is a failure.
And Germany has been quite rigorous in creating a bio-diesel framework for trucks and farm tractors. At this point, easily 50% of the long haul trucks seem to be using bio-diesel, from the smell they leave behind.
Germans have known that oil is a finite resource for more than a generation, which is one reason peak oil as handled here is not really a major theme, while consistent effots to conserve through higher efficiency and reduced use are seen as a necessity, not something which can be put off until the future.
But living between Frankfurt and Stuttgart, more or less along the flat and straight A5, which part of the direct route between Frankfurt Airport and the headquarters of Porsche and Mercedes, I expect this stretch of the autobahn to be one of the last unlimited speed routes in the world. Marketing is critical to selling overpriced vehicles.
Speaking very generally, trucks are only allowed 80 kph (50 mph) and up to maybe 90 kph is tolerated - 100kph is not. And those trucks are increasingly using bio-diesel.
This is not a defense of high speed driving - it is that simply the image of the autobahns is not really the same as the daily reality - most cars driven here are not even capable of 200 kph. But those that can go fast are often driven as fast as they can go - which certainly stands out for those not used to driving in such conditions.
After returning from the U.S., I would guess that the average speed of all traffic (not counting heavy rush hour) is at least as high as in Germany, mainly because of all the trucks doing 80 mph (130 kph).
I have noticed lately more trucks driving slower (55mph). I assume on orders to save fuel by the bosses.
It appears Schlumberger's "8%" decline rate is indeed a fact, and perhaps a very conservative one.
If Saudi Arabia and Kuwait follows this trajectory, you'd better be buckled in for a wild ride!
* * *
By the way, WestTexas, is SA production down 5.2%, or is that the decline rate for their Exports?
Based on EIA crude + condensate, highest KSA number last year was 9.6 mbpd. 6/06 was 9.1. 12/05 was 9.5 (9.6 to 9.1 is down 5.2%). Some Saudi ministers suggest about 9.0 for August, some suggest 9.2 range.
The annual production decline rate, based on 12/05 to 6/06, was 8.3%.
Based on the 12/05 to 6/06 EIA data, the top 10 net oil exporters, based on estimated consumption, showed about a 9.2% annual decline rate in net oil exports.
Any models of oil production should take into account that only exportable oil is traded. There is no way exportable oil is going up with Saudi Arabia and Russia growing like they are. I don't think anyone can pound the table hard enough on this point.
A quick calculation using average monthly all liquids production 2004->2005 shows a SA and Russian combined net exports increase of 364,000 bpd.
So yes, there is a way, and you can stop pounding the table.
Same method for Saudi Arabia: http://www.eia.doe.gov/emeu/cabs/saudi.html#oil However the EIA only presents Saudi domestic oil consumption in a graphical format. Therefore you have to eyeball the numbers and make a calculation of growth.
Saudi is closer to 4% from 00 to 04 according to the EIA data in the EIA.
How about trying to extrapolate to first half 06? Use bp data for consumption, assum this continues as in 05, then look at published first half production...
with SA down, even with russia up, my guess is that exports are probably flat at best, but maybe down.
The export number - 52 - is interesting. Its too late here for me to work this out - oil price go up or down with this number?
right side of page inder publications
first link Statistical Review of World Energy
Russia's Institute of Energy Policy's numbers updated through July 2006 show essentially no growth in oil production since mid 2004. see the presentation on this page http://www.energypolicy.ru/enews.php?id=1002255
It is hard to believe that domestic consumption hasn't risen when auto sales in Russia are growing 6%+ every year and the economy is growth above 7%. http://www.autofieldguide.com/columns/0805strat.html
Going forward, Russia's Institute of Energy Policy in the above link states: "Russian oil production will likely remain flat in the next 10-12 months," (from 7/06 to 5/07 to 7/07) also that Eastern Siberia (which is the only area of Russia that offers significant potential for production increases) "remains too underexplored to become new major Russian oil producing region."
The Russian energy minister stated in 2005 that Russian oil production could peak in 2010, which is consistent with the above presentation. Also note that, through 2010, Russian's oil Russian gas production from two of Gazprom's three major gas producing fields (Urengoy and Yamburg) is set to decline by 30%, from 2004 levels. To the extent coal cannot make up the energy difference, some oil may be diverted to satisify domestic energy needs.
So this evidence points to flat to declining growth in production and exports going forward. The EIA's data shows increasing export growth from Russia in the past three years http://www.eia.doe.gov/emeu/steo/pub/gifs/Slide10.gif but I cannot find forecasts by the EIA for Russian exports -- but if the assessment of Russia's Institute of Energy Policy is accurate then there is not much chance of Russian exports increasing.
The expansion of Jubail Industrial City is planned for the next few years, which is, according to Bechtel, the largest engineering project in the world -- a city of 230,000 (up from 90,000 in 1999)based around petrochemical production http://www.bechtel.com/spjubail.htm
Petrochemical production is increasing in Saudi Arabia between 20-25% per year -- due to the goverment's attempts to provide young people with work and the country's strong balance of payments position.
All this points to continued higher domestic oil consumption for Saudi Arabia in the future - -note that Saudi Arabia alone accounts for 23.4% of world oil exports in 2004.
In either case the same amount of oil or gas comes out of the ground and the same amount of products are available to other economies.
From an economic standpoint, it is clearly positive for SA and negative for petrochemical producers that don't have access to resources. However in terms of how it impacts oil & gas export figure it is just a technicality. The statistics capture oil & gas as energy and petrochemicals as "not energy".
Why should this worry people who don't work at or hold shares in Dow Chemical, for example, or large Chinese and Taiwanese petrochem operators?
Good for SA. Good for me. Right?
Math:
SA 2004 production: 10.37 mbpd
SA 2004 exports: 8.37 mbpd
SA 2004 consumption: 2.00 mbpd
Assuming 11% SA domestic consumption growth in 2005 with flat production (2005 EIA not yet available)(never mind that production actually was down in reality):
SA 2005 production 10.37 mbpd
SA 2004 consumption (11% growth): 2.22 mbpd
SA 2004 Exports (prod-consumption): 8.15 mbpd
percentage change in SA exports from 2004 to 2005: -2.7%
Well I guess it always pays to run through the numbers, as there is a material difference in percentage terms.
Exports, as a percentage decline, will decline SLOWER than consumption growth as a percentage increase if domestic consumption is lower than 50% percent of total production.
In the case of SA, consumption is 2.0 mbpd and production is 10.37 (2004 data)(about 20%) so continued 11% growth in the near term will affect export growth at significantly lower percentage than 11%.
Russia, since consumption is 2.6 mbpd and production is 9.3 mbpd (ratio of 28%) will also see export declines as a smaller percentage than 7% (current increase in domestic consumption) (my calculation point to Russian exports down 2.7% with 7% consumption growth)
HOWEVER, once consumption reaches 50% of total production, exports decline at faster rate than consumption.
This assumes production is flat -- if production declines that is another story.
BUT, the production declines impact, in percentage terms, impact the country more severely when the ratio of domestic consumption to production is over higher.
Math -- let's say Saudi Arabia has a decline in production of 5% from 2004 to 2005. Assume SA consumption flat and exports = production - consumption
SA 2004 prod: 10.34
SA Consumption: 1.64
SA Exports: 8.73
SA 2005 prod (5% decline): 9.85
SA Consumption: 1.64
SA Exports: 8.21 = decline of 5.94%
If Saudi Arabia consumed 50% of its produced oil, then I calculate exports, with a decline of 5% of production, would decline 10%, holding consumption constant.
So, in conclusion, production for Saudi Arabia and Russia are still most significant from a percentage decline/increase standpoint, compared to domestic consumption, as the ratios of consumption to production are still relatively low in SA and Russia.
Saudi production increased by roughly 4.5% or 450,000 bpd from 2004 to 2005. (EIA gives 4.7%, BP gives 4.3%)
Start there.
And no, Saudi and Russian production are not the most significant. Your own calculations show they account for only 40% of global exports. That leaves the other 60% for what I would hope would be serious consideration.
I think you miscalculated. If oil production is 9 mbpd and consumption is 2mbpd. Exports are 7mbpd. If Consumption goes up by 11% then exports fall by about 3% right?
Same method for Saudi Arabia: http://www.eia.doe.gov/emeu/cabs/saudi.html#oil However the EIA only presents Saudi domestic oil consumption in a graphical format. Therefore you have to eyeball the numbers and make a calculation of growth
Saudi is closer to 4% from 00 to 04 according to the EIA data in the EIA.
The de-industrialisation of the UK economy also needs to be taken into account.
I looked into Chinese oil consumption growth and it appears half of the increase in China's oil consumption over the past two years has been due to increased demand by power plants -- resulting in increased usage of oil in power generation and the increased sale of diesel generators. (which is not likely to continue as new power plants are built)
It is still not clear to me how much oil consumption growth stems from increased sales -- but it appears for China increased auto sales in the 20% range translates to 7% or so higher oil consumption growth. But it is not clear.
President of Russia's Institute of Energy Policy:
http://www.energypolicy.ru/epres.php?id=1002408
"The growth in oil consumption was particularly high in China - 15.4 percent (this country posted a two-digit increase in demand for the second year running). However, many experts allay possible fears concerning these figures: approximately half of the increase in the demand for oil in China, as well as in other Asian countries, was provoked by a shortage of electric power plants (the inert energy sector cannot keep up with the rapid development of the economy) and by the large-scale introduction of diesel generators. Obviously, this situation will not last long, and additional electric power plants are in the cards. These will operate on natural gas, coal or nuclear energy. However, even if the rapid growth of the Chinese and other Asian economies continues, it will no longer result in an astronomical increase in the demand for oil.
"Competition between different energy sources (natural gas, coal, nuclear energy, and renewable and alternative sources) is possible only in stationary power engineering (most importantly, in electric power engineering), where, incidentally, oil consumption has decreased to a record low in recent decades. However, humanitys "mobility" now directly depends primarily on oil: in the transport sector of the world economy, which is vital for global economic growth and globalization itself, there are no alternatives to oil as a fuel.
There have been power cuts, so there is undoubtedly a diversion to local diesel power sets, etc. As you say, this is being addressed.
But the Chinese domestic market is now 4 million motor vehicles. The car 'park' in China is growing almost exponentially, as is the long distance trucking fleet. And the road network is growing very fast as well. So I would suspect this is the main source of new fuel demand.
http://www.chinadaily.com.cn/english/doc/2005-04/28/content_438345.htm
This says 2008, but I think they got there 2 years early.
Domestic gas prices are about 60cents US a litre, (4.8 Yuan), for reference.
However, UK will soon be in a serious predicament: the balance of payments effect of becoming a significant net importer on top of the already dire trade deficit. The UK £ is no longer a significant reserve currency so it can't just print money (like the USA can for a mite longer) to fund its deficit.
It would be wise for UK to join the Euro zone before this becomes a horrid fiscal problem; if it doesn't I expect painfully higher UK interest rates, increased UK taxation and inflation, a sharp increase in unemployment, in fact: a return to the bad old stagflationary days that prevailed when UK was last a net oil and gas importer.
And before any US lips crinkle a smirk at the probable limey predicament I would say: watch well, you would be going there already if it were not for the hangover of the petrodollar, when that switch flips you will be in much deeper doo-doo faster than a brer rabbit quip. UK will be significantly different from the other exporter to importer switchers, and will probably be the most relevant example for the USA when its turn comes - if there is sufficient time.
On the bright side, it will be an opportunity for UK to make the essential changes to high and going higher fossil energy taxes, investment in renewables for generation etc, mindshift to sustainability for survival. The irritating Brits will probably, hopefully, provide the model for industrialised country powerdown and reorientation. But to do that we will need to learn from an interesting mix: the practical sustainability movement especially in USA, the appropriate technology inventiveness of the likes of China and Brazil, the energy and transport efficiency of Japan, the commitment to renewables of Germany, Austria and Switzerland, the political wisdom and commitment of the Scandinavian countries.
How would that help? On the contrary, it would take away the possibility of fiddling the exchange rate to improve competitivity (Italy, champion of competitive devaluation, is in deep crisis since they joined the Euro.
Agric, I love this stuff from your last paragraph. Let's hope that we in the UK can get beyond Blairite rhetoric and pull it off. There are encouraging signals; not least the Internet enables us to see all the facets of change you mention.
In the natural world: life follows resources to live. Birds pursue bugs, cheetahs chase gazelles... and so on.
In stark opposition to this natural construct: dominant detritovores pursue by economic activity whereby this energy is physically transferred for their use. Recall my posting where I said every ship, laden with resources, that is leaving a foreign land, should pack the deck with native detritovores so that they can follow these resources. A VLCC might have 5,000 people topdeck to follow their native crude. You want the detritus--you get the detritovores too.
This method would make it obviously clear of the detritus-detritovore linkage to the importing country. They will then have a much clearer idea of the true cost of the goods and will conserve accordingly. The migration northward from Mexico into the US is just another example of detritovores pursuing the exportation of their native 1.8 million/barrels day of detritus; seeking the so-called good life.
A universal understanding of never-ending detritus entropy and the ensuing futility of further pursuit: makes it painfully clear that maximal biosolar powerup of large, contiguous habitats to protect as many species as possible for the coming squeeze is, by far, the better mitigative direction.
Bob Shaw in Phx,Az Are Humans Smarter than Yeast?
Population growth is as big a problem as energy and resource consumption (until we change behavior, at least). We in developed countries generally have aging and reducing populations, developing countries tend to have young and growing populations. However, global population is already too high for sustainability once fossil energy production declines.
So, detrivores migrating to developed countries should qualify by killing an appropriate number of their fellow countryfolk first. Note that this, for all its offensiveness, is merely an extension of the inequality of wealth distribution that is practised both within and between countries. Also note that the more impoverished sectors respond by breeding more than the more wealthy sectors.
For most appropriate effect there would need to be a weighting system for kills based on the economic wealth of each kill; there could be scope for migrants to make killing trips to other developed countries as a fast track qualification method, clearly some concept of friendly / neutral / unfriendly country would be advisible, and a refinement of extradition arrangements would be required.
Before anyone gets all politically correct on me - I am not seriously advocating this. However, there is a certain absurd and sick logic in its insanity, I just hope it helps to open eyes and minds to how we are now and maybe helps find happier ways forward.
Thxs for responding. Well said.
Your quote: "So, detrivores migrating to developed countries should qualify by killing an appropriate number of their fellow countryfolk first. Note that this, for all its offensiveness, is merely an extension of the inequality of wealth distribution that is practised both within and between countries."
From this Wiki-link, Idi Amin of Uganda did exactly this in great quantities before retiring in exile to the very fountain of detritus itself: Saudia Arabia. I am sure other people spring to mind, perhaps Baby Doc Duvalier of Haiti. who retired to splendor in a French villa with billion$$.
This process of fast track qualification and refinement of immigration at this elite topdog level has been ongoing for some time.
Bob Shaw in Phx,Az Are Humans Smarter than Yeast?
Aviation continues to grow as a major source of use in both countries (cheap air flights have pretty much crowded out passenger rail and Greyhound).
This has offset improvements in per car mpg.
So overall transportation use has grown.
The big savings have been in using less oil for heating purposes, and also some shift in chemical feedstock towards natural gas.
You will note in the UK data the rise of the diesel fuelled car: a deliberate policy by European governments, to the extent that about half of new car sales in Western Europe are diesels, and there is a shortage of diesel petrol (the refineries are old, and were configured to produce more gas and less diesel per barrel).
A 25% drop in fuel consumption in the US would be pretty devastating unless it took place over long enough time that fuel efficient vehicles could replace less fuel efficient ones. I think the average vehicle life figures I have seen is 16 years. Put it another way, the US car 'park' is, I think, about 180 million cars, and the US new car market (in a normal year) about 12 million cars?
So in 10 years the US could probably replace half its cars with high mileage cars if those cars were available (the big bottleneck being the absence of enough capacity to produce diesel and/or hybrid engined cars in those kinds of volumes).
Americans now live and work further apart than they did in the 1970s. Downtowns are much less centres of employment than they were, and downtown shopping districts are pretty much dead-- the phenomena of the 'Ruburb' and the 'Edge City'. Americans live in suburbia, and beyond. Recent flows back into city centres are small by comparison.
The only area where we can realistically say the world has moved in favour of less driving, less distances is telecommuting. If 20% of your labour force can come into work 4 days in 5 not 5 in 5, that could have a huge impact.
- Dependent on foreign oil
- dependent on foreign gas for heating
- dependent on foreign gas for electricity (only Italy will have a greater dependence on gas-fired power)
http://www.foundation.org.uk/801/20060308_HOward_total.pdf#search=%22deloitte%20and%20touche%20elect ricity%20policy%22(powerpoint slides are at the back)
It's head in the sand time. The 'solution' we are being squeezed towards is nuclear power. But it's no solution for any number of reasons:
- cost: the world's nuclear industry survives on massive explicit and implicit government subsidies. The sector has never delivered on its claims for cheap power
- unresolved issue of waste disposal - the UK cleanup bill as of this moment is £70bn over the next 100 years or so. And we have nowhere deemed safe to put the waste. And once we have put it there, it's still unsafe if geology, weather or human idiocy digs it up
- markets - for the private sector to finance new nuclear stations, there will have to be a guaranteed electricity price. British Energy went bust on a falling pool price
- scale - there is a role for 20% of UK electricity supply (about 70 TWhr now, and 80-100 by 2020) being nuclear. That still leaves the other 80%. I can't see any government building more than about 12 new units (which is about 12000 MW of capacity)
Everyone talks about Finland. However in Finland you have large industrial users prepared to sign longterm contracts with the new power plant. And it appears that the Finnish government has abandoned plans for major investment in alternative energy now that the nuclear plant has been agreed. It is, of course, late and overbudget (that's normal with big capital projects).On energy I don't think we have any coherent policy to use less oil, especially not for transport. And we have one of the world's fastest growing aviation sectors.
For better or for worse, for the last 50 years the British government answer to any transportation problem has been to starve the railway system of investment, and to build more roads.
A related policy has been to discourage cycling on safety grounds and to improve (motor) traffic flow.
I can't seem Prime Minister Cameron, for all his 'green' aspirations, changing that. If the Tories are elected, it will be on the back of the 'Daily Mail readers', and 'Mondeo Man', the suburban swing voter, is married to his car-- he lives in suburbs that don't work without a car, he drives to work and to shopping, his partner drives the kids to school, and to a great extent he derives a piece of his identity from having a nice motor. Look at the public teeth gnashing accompanying this badly injured 'Top Gear' presenter (yes, I watch Top Gear too!-- anti green, anti cyclist, anti PC, anti French etc etc).
The best that we can do is try to encourage more fuel efficient vehicles, and try to revive cycling in British towns and cities. Accept that the car is the predominant British form of transportation, and try to work around that.
Problem is that no party will ever be elected on that ticket. So I think the main parties need to come together on this one, declare reduced fuel consumption is in the national interest, and draw up serious proposals to tackle it.
With the right approach, the UK should aim to stay more or less self sufficient in oil for another decade. We would have safer roads, healthier trade balance and security of supply.
Prudence - taxing production, encouraging consumption
- summer 1985 coal workers strike. A previous strike had brought down the Heath Government in 1974 in which Thatcher was education minister (hence the chant 'Thatcher, Thatcher the milk snatcher' over government school meals policy). Britain had been forced onto the 3 Day Week due to power cuts.
the CEGB (the electricity utility at the time) was ordered to prepare to break the miners. This time, the government was ready. A number of oil fired power plants (most notably on the Isle of Grain in Essex) were retained post the 1974 oil shock, even though they were not economic.
The CEGB was also tipped off. One of their top negotiators had a heart problem, and a friendly negotiator for the most militant coal worker's union (led by a Stalinist named Arthur Scargill) made a comment inquiring for his health in the case of a strike. The CEGB took it as a warning of the coming strike action and stockpiled coal and oil.
The strike was long and bitter, involving the mass movement of police from the London and southern counties of England to the North, where the striking miners were. One faction of the miners, the Democratic Union of Mineworkers, broke away from the National Union of Mineworkers, and refused to strike. there were pitched battles with police using horses against picketers throwing bricks.
The CEGB was days from power cuts when the strike finally unravelled. In the years that followed UK coal mining manpower would go from 250,000 then to less than 10,000 now.
After this the electricity generating industry was privatised, and there was no longer a need for oil fired power. I don't think any of the stations are still in operation, even in reserve.
You can't really understand the energy history of the UK without understanding the political dynamic. No Tory government (or a Labour one) will again be brought down by a single trade union entity controlling energy supply, or indeed transport.
And yet, in 2000 (?), a group of independent road hauliers, organising themselves by mobile phone, blockaded fuel depots across the country in protest against higher fuel duties than their Continental competitors were facing.
http://news.bbc.co.uk/1/hi/uk/920679.stm
At that time, Chancellors used 'the escalator' to raise fuel duty faster than inflation. For 3 days, the country was paralysed as petrol stations ran out of diesel and gasoline. The government was caught flat footed, as the petrol tanker drivers refused to drive through the pickets (who had threatened to put bricks through any truck that did), and critical services ran short of fuel.
Since then, fuel duties have not risen with inflation, in fact they have fallen substantially behind inflation (petrol prices have risen of course with rising oil prices).
It is more or less accepted that no government will again raise petrol duties, even probably by less than inflation.
90% of UK freight moves by road and the rail freight companies have had their activities restricted by growing demand for 'slots' from passenger train companies. Indeed the Post Office has finally stopped using trains to move post.
And the real cost of motoring has fallen by 10% since 1970 (whilst national per capita income has doubled) and the real cost of using buses and trains has risen by more than 40% in that time.
At the same time the number of bicycle journeys has more than halved (? or as a percentage of total journeys).
90% of UK children are now driven to school or taken by bus. less than 10% walk or cycle.
We have also seen the transition to the out of town mall: more than half of all retail space is now in 'drive to' or out of town formats, particularly grocery store 'superstores'. It's fair to argue that now, outside of London, no one middle class lives without a car, most have 2 cars, and it would be very difficult in most British communities to live without a car.
The energy import picture in the UK is worse than it looks as North Sea gas production is now in decline. The UK now imports most of its coal for electricity generation. In addition, the UK's nuclear fleet is beginning the long run down, as most of the units started production in the early 70s (these were Advanced Gas cooled technology, a later pressurised water reactor, Sizewell B, will cease production in 2035). This means the vast majority of new electricity capacity in the UK comes from gas, (combined cycle gas turbines, owned by private companies), which will be almost entirely imported. CCGTs are about 40% of UK generating capacity now, (?), and that proportion is rising.
By 2020, unless there is massive expansion of wind power, 80-90% of the UK's electricity generation needs will be supplied by imported fuels (not counting uranium). The UK has the world's best wind resources (taking on and offshore together) but the planning process and market uncertainties mean we have lagged well behind Spain, Denmark and Germany in realising its potential.
The UK government is in a difficult position, in that transportation fuel taxation increases are not politically feasible:
- on ground transport because of the risk of another petrol strike
- on air transport because the Warsaw Treaty prevents taxation of aviation fuel
The policy seems to be to make nice noises in the right direction, to pay grants to the buyers of hybrids and electric cars (the latter are mushrooming in number around London seehttp://www.goingreen.co.uk/
because they are exempt from the £10/day congestion charge), but basically to do nothing to disturb the vast majority of car users and buyers.
Sounds like they're on a collision course as well. And I just read (was it here?) that the Ramblers want to halt UK onshore wind production.
One interesting point; you note that fuel taxes are frozen, insinuating that without substantial price rises, Brits won't change their ways and conserve. And yet you pay, what, $6/gallon equivilent for petrol? What does that say about the US chances of meaningful change?
It may be that a large percentage change in US gas prices will spur conservation, even if the level of gas prices remains below that of Europe.
However, I think the US consumes 544 gallons of gasoline per person, per annum. So a $1 move up will hit the average family (2.8 people?) by about $1300. Significant, but not enough, I don't think, to radically change behaviour (US GDP just over $40k per head, I think-- $11 trillion GDP and 280m people). Particularly not if that were a tax, which would be rebated in some form (eg lower social security contributions or an Alaska-style personal rebate).
And income elasticities (which are positive: more income = > more consumption) tend to outweigh price elastiticities (higher price => lower consumption) over time.
For this reason, I think the US is going to have to go for significant CAFE regulations. I can't see any other way that Mr. and Ms. Joe Public will buy more fuel efficient automobiles (or energy efficient appliances and homes, etc.).
I think $175/bl oil might give you $6/gal gas (anyone done the numbers?) but I'm not sure.
I suspect the major differences UK v. US gas consumption are:
- UK is a much smaller country (especially as most people live in England, which is only about 40% of the total land area but has over 5/6ths of the population). You can drive to Edinburgh in a day from London easily, if you started at midnight you could drive from Land's End (westernmost point and in the far southwest) to John O'Groats (northernmost point of mainland Scotland) in the same 24 hour day (from memory, it is about 700 miles, so say Washington DC to Maine?)
- our GDP per head is about 60% of yours, so we have less money to spend on everything, including driving (manifested as more households without cars, more people who don't drive, fewer cars per household)
We do drive much smaller engines though, but we drive (at least as) fast, when we can.http://www.theoildrum.com/story/2006/8/31/194053/962#more
I'm pretty keen on the idea of balancing wind with hydro - but it seems that Scottish and Southern Energy (who own all our hydro dams) may be less keen..... the subject of another post to come.
Using renewables needs to be set in a realsitic engineering framework - and I've found TOD a great resource in that regard. The Danish experience with wind on balance seems pretty dismal - if they didn't have friendly Scandinavian neighbours.
It scares me a bit when I see our senior politicians standing up and saying they are committed to 100% renewables by 2050 - without actually having a workable, incremental plan as to how we will get there.
Thanks for your long and thoughtful post - I'd been looking for a potted history of UK power politics.
The next decade will be dominated by debate about views being spoiled by wind turbines and the horrific consequences of Chernobyl - which has killed 50 people to date.
http://www.who.int/mediacentre/news/releases/2005/pr38/en/index.html
The public needs to be asked whether or not they want to have freezers at all in super markets, and lights on in hospitals and schools. If the answer is yes - then they will have to put up with some of the consequences of those luxuries.
How do you think the UK should satisfy its power needs?
- yes we probably need more nuclear, but it is a complete distraction. It needs massive subsidies, and it will never be more than 30%, say, of UK electricity demand. I can't see us building from 12 working reactors now, another 12 to replace them plus 25 more. That's a French scale system. And there's no way we'll have a new nuclear plant working before 2016.
- wind can be big. 30% of UK electricity demand. Whether it can get bigger than that I don't know (the problem of the occasional period when the wind just doesn't blow) but I think it can get that big
- other renewables can be at least 10%: tidal, wave (if it works), Combined Heat and Power.
- coal or gas with carbon sequestration is likely. We pumped the gas and oil out of the North Sea bedrock, we can put CO2 back
- there is probably far more to do in conservation than we realise. LED lights for one. I have heard it said that digital TV (mandated by 2012) will increase UK power consumption by 10% (all those Set Top Boxes). It's an example of something the government will have to tackle.
I can't tell you how casual and careless UK people are with electricity. The fridges in supermarkets are all open: to a North American that looks like a recipe for food poisoning.If the Uk got to 30% wind that would be a miracle - but getting Scotland there is a reasonable first objective IMO. I'm all in favour of setting achievable mid- term goals - achieveing them - and then moving on to the next level.
Tidal may kill a few birds and spoil a few beaches - so the favoured course of action is to kill everyone in the interests of being PC - equal opportunities.
Carbon sequestration - I've not yet learned how they economically separate CO2 from the flu gas of a power stations. What is planned for Peterhead is to separate H2 and CO2 from CH4 before it is burned. I saw some stats suggesting that SO2 scrubbers on coal stations reduced their efficiency - and in the future getting more power out than you put in without creating greenhouse gas will be key.
I think conservation is the big way way forward - I'm basically infavour of the free market - so would make driving <1000 cc cars very, very attractive.
On air travel - there may be a convention about no tax on jet fuel - well its really about time that was re-examined.
The guess is it will cost a ICGG about 10% of its total power output.
But that still makes a coal-fired ICGG with CO2 capture an economic proposition. The main problem right now (as with wind) is that the capital cost is higher, so without government incentives, OR a market price for carbon emissions, no one is going to opt for an unproven technology.
http://energycentral.fileburst.com/EnergyBizOnline/2005-1-jan-feb/Clean%20Coal_janfeb05-3.pdf#search =%22ICGG%20coal%22
http://en.wikipedia.org/wiki/Integrated_Gasification_Combined_Cycle
You are basically going to have to make it harder to buy gas guzzlers.
I agree with you that nuclear power is vital and the dangers can be managed fairly safely, but downplaying the impact of Chernobyl is not going to win you any converts.
Excerpts from the WHO report that drew on expertise from around 7 UN and affiliated organisations:
As of mid-2005, however, fewer than 50 deaths had been directly attributed to radiation from the disaster, almost all being highly exposed rescue workers, many who died within months of the accident but others who died as late as 2004.
Persistent myths and misperceptions about the threat of radiation have resulted in "paralyzing fatalism" among residents of affected areas.
Alongside radiation-induced deaths and diseases, the report labels the mental health impact of Chernobyl as "the largest public health problem created by the accident" and partially attributes this damaging psychological impact to a lack of accurate information.
I accept that this was a dreadful disaster, with consequences that go way beyond those that can be measured in terms of radiation deaths.
However, the real cost of Chernobyl, was the termination of civil reactor building world wide. This has led to greater dependency upon fossil fuels, contributing in no small way to what many now believe might become a climatic catastrophe mid 21st Century. This may kill hundreds of millions through famine.
So this is an issue that the public really need to get straight in their minds:
Do they want to have electric power at home, at school, in hospitals?
If the answer is yes, then they need to live with the consequences of low CO2 power generation.
In the case of renewables that might mean using power when it is available as opposed to when it is wanted.
In the case of nuclear that means living with the threat and consequnces of radiation - and I beleive that it is quite important that the risks to public health associated with radiation are properly understood.
http://www.who.int/mediacentre/news/releases/2005/pr38/en/index.html
Fernex
In particular, the work of Drs Bandarshevsky (who spent several years in prison for daring to publish scientific studies on the health effects of Chernobyl) and Nesterenko (who worked as a liquidator, pouring buckets of liquid nitrogen into the reactor from a helicopter) should be studied by those who are interested in the subject.
But denial is easier.
Did you know that about half of the background terrestrial radiation that we are all exposed to comes from radioactive potassium - 40K which decays via electron capture to stable 40K. Amazing isn't it, that KCl is sold in supermarkets as a safe substitute for harmless NaCl. The other half comes for U.
Thanks for the link - but I'd be interested to know what you make of the WHO report. Do you think this is a whitewash to dupe the public into believeing that radiation is less harmfull than once believed?
That should be 40K decays to 40Ar
I don't question the sincerity of the WHO people. But when you're essentially compiling official statistics instead of doing original research, and those statistics are deliberately selective and/or falsified, then you're going to reach the conclusions the authorities want you to reach.
The deception is not the worst of it. The worst of it are the tens of thousands of children in Belarus and the Ukraine (they accumulate caesium 137 more readily than adults) who develop serious health problems, notably cardiac trouble generally associated with geriatrics, because the government denies the existence of a problem. There is a simple, fairly cheap palliative which fixes the caesium, based on apple pectin. The kids aren't getting it.
Bandarzhevsky's work
Just the other day a report from the research reactor at Kjellar in Norway - where I used to work:
http://www.edie.net/news/news_story.asp?id=11985
In terms of understanding long term health problems associated with low level exposure - I agree we need objective, reliable, trustworthy data. Problem is that such data will almost certainly point to some risk and the public are liable to be scared off - even though they don't really understand the significance of those risks. It is also a very difficult task to balance one set of low level long term risks (radiation) against another (climate change).
[BTW, of all the outcomes to the UK 1985 miners' strike I don't know which might have turned out better or worse: no conflict, Thatcher win, miners win - all seem pretty bad. I might wimp out and say no conflict, but the pre-requisite would inevitably be the untimely death of Thatcher or Scargill]
Fuel escalator: although the increased petrol etc price due to increased oil price is the official reason for ending the escalator the real problem has been the differential between UK and continental europe, UK abandonment of the escalator reflected that as much as the protests. I expect moves towards an EU harmonisation policy on fossil energy and carbon tax to be the prime determinant in future, please hurry, I'd say.
Yes, some of the relatively recent UK trends are very maladaptive (kids travel to school, remote shopping centres) and hopefully ways can be found to help reverse these asap.
Something has gone a bit squiffy with our privatisation of the rail system. It wasn't wonderful before, especially in terms of long term investment, but when it gets so it's significantly cheaper to fly (if your end points are within 20 miles of a connected airport) than use rail then something is fundamentally wrong. We should gear up for rail being the preferable and cheapest internal transport, and tilt the playing field if necessary. I am not informed enough to know the best route to that.
Last thought: distributed mini and micro generation with improved facilitation of their grid connection (price, practicality and balancing) is the most cost effective short to medium term UK electricity generation option. Think 50% grants at BoE base interest rates repaid from surplus supply sold back to grid. Every kWh of locally renewable generated electricity is more than a kWh of centrally generated electricity saved.
I don't know when the DUM came into being, but it was about the time of the strike, I think.
The conflict miner v. government had to happen, the size of the subsidies to the coal industry just kept growing. A less confrontational society would have had a much more consensus-oriented way of dealing with it, but that was not the UK in the 80s: it was widely accepted the trade unions had had too much power in the 70s, and the government needed a major victory.
Fuel escalator: I'm not sure, even if the Europeans raised their tariff, that we would raise ours. Remember in 2000 the breaking point was when fuel crossed 80p/ litre? The government has been able to explain away the recent movements as the market price for oil, but I don't think they can afford to make the problem worse.
Agree with you re EU harmonisation, but my own view is the EU is a busted flush. When we deny Turkey entry, it will more or less signal its increasing irrelevance.
Once the houses and the roads and the shopping malls are built, it's essentially impossible to reverse the pattern. London is still shaped by the decisions of Victorian planners and governments, over 150 years later. The best adaptions made have been by the Dutch and the Danish, who have really pushed cycling, but I don't see anyone taking the risk here.
On rail, the last 50 years of British rail policy is one short sighted political decision after another. The best we can hope for is stability and more investment, a job which Labour has actually carried out to a greater extent. Like so many Labour achievements, absolutely unheralded: the weird combination that they are afraid of the Tabloid Press, so they don't herald their successes in public investment, and the public mood, which is to denigrate everything they do.
I agree it is irrational that it is cheaper to fly than to take Eurostar to Paris or the train from London to Manchester. This is because aviation pays too little, rather than trains are too expensive. But rail is a medium distance solution: say up to 500 miles at max.
The real energy saver would be buses and coaches-- both for local and intercity. Having travelled on Britain's long distance coaches though, it was a horrible experience before they put the TV screens in.
The problem with the Warsaw Convention on airlines is 'path dependence' (the same phenomenon that means your keyboard has its arrangement of letters). It was set up in the early days of air travel, and each new nation had to sign up to it. Now you have over 150 signatories who would have to agree to any change.
The UK can't just decide to tax air fuel: airlines would simply move to the Continent, UK airlines would lose landing slots in other countries, etc.
Chirac suggested taxing air travel to fund development. It would be a start, and Gordon Brown was reputedly sympathetic.
Path Dependence may be why our society is doomed by global warming. Once you start down a road, it's too difficult to change it.
On microgeneration it's a neat idea, but what does it really mean? The Carbon Trust has looked into household microgeneration, by actually monitoring pilot installations. They don't save energy. The problem is that:
- in and of themselves, small generation units are less efficient than large ones
- Combined Heat and Power only saves energy and CO2 if there is a constant load and a constant need for the surplus heat, whereas most household applications don't have constant loads
So CHP is OK for institutional sites (hospitals, schools) and small commercial/ industrial (eg the power plant on the Slough Trading Estate) but it is unproven for households (I was looking into a Whisper CHP station for home, so I have been doing some homework-- RWE is offering them, or it was).But in and of themselves a small Stirling Cycle or gas turbine engine isn't as efficient as a large CCGT. Even assuming 10% transmission losses.
Solar just isn't there yet. Its time is coming, but it is not there yet. Just as a short term obstacle, there is a world silicon shortage until at least 2008.
Maybe nanomaterials will save us. Maybe.
One book: Mayer Hillman's 'How we can Save the Planet'.
http://www.amazon.co.uk/How-We-Can-Save-Planet/dp/0141016922/sr=8-1/qid=1158824168/ref=sr_1_1/026-82 31609-4971644?ie=UTF8&s=books
It reads like a worst case, but even in the 2 years since it came out, the necessity of that worst case has become that much more credible. Hillman is the guy in the early 70s who said that it was all wrong separating pedestrians and traffic, that streets needed to be more pedestrian friendly, not less. That is all conventional wisdom now.
Hillman is the radical. But radicals are often written off by history, until their moment.
http://www.whispertech.co.nz/index.cfm
http://powergen.co.uk/Pub/Dom/A/Ui/Residential/TechnologyAndInitiative.aspx?id=30&WT.svl=6
Certainly CHP should be MUCH more used in mini situations like large hospitals, schools, business and industry sites. There is plenty of scope for mini: wind, hydro, tide, biomass; what is needed is a temporary tilting of the playing field to encourage their implementation until fossil energy becomes innately more expensive (whether by supply deficiency or CO2 taxes).
PV is still expensive, especially for UK, but there are signs of improved cost effectiveness and material effectiveness becoming commercially available in the next year or so. I think all new houses should be designed (roof orientation, etc) on the assumption that they will be retro-fitted with PV once cost effective.
Micro wind can be worthwhile but largely as very small scale, cheap and minor augmentation of domestic supply. Hydro is currently the most cost effective wherever a practical resource is available. Ground heat pumps are apparently a viable option but I know little detail about these.
The fastest CO2 reducer is conservation and a CO2 tax is the most effective method of focusing awareness on that.
But note, I did say that distributed mini and micro generation "is the most cost effective short to medium term UK electricity generation option". To a large extent I think this because of conservation, financial, quick implementation, competition and economic reasons rather than the inherent efficiency of the current micro generation technology.
Firstly, I'd bet that 50% govt grants at 0% interest with the capital repaid by a 50% levy on profit from resale back to grid would be cheaper than any other govt generation investment. Secondly, anyone who invested in micro generation would likely conserve more. Thirdly, the market encouraged by this should foster evolution of innovative, practical and cost effective solutions.
Hillman's book looks good, I've put it on my maybe list but hopefully I know the basics, I'm more into looking at practical tech for both off-grid and grid-linked use.
http://www.carbontrust.co.uk/Publications/publicationdetail.htm?productid=CTC513&metaNoCache=1
as identified in this and earlier reports, the domestic CHP units don't produce energy savings in fact they are producing an energy deficit relative to a high efficiency boiler. this is because (grammar) CHP only works well if there is a constant demand for heat. So district heating yes, home CHP no.
For 'quick wins' on British home energy, I would subsidise the use of more insulation, new windows etc. I have read (George Monbiot's new book) that 16 million homes in the UK could use cavity wall insulation, but only 10 million do.
Ground Source Heat Pumps (Geoexchange in American parlance) are not an energy source. They use electricity to heat/ cool the house. They are just massively efficient. Effectively they use the fact that the ground is a constant 55 degrees F, and run an air conditioning coil through it: in winter, they 'cool' the ground and heat the house, and in summer, they 'heat' the ground and cool the building. However, they are not particularly cost competitive with an efficient gas boiler, for heating only-- even at current rates. In truth the 'big win' will be adopting these in Scotland (bigger extremes in temperature). Big capital cost because you have to bore a 50' hole in the ground or a 200' trench, but good payback.
PV just isn't there yet. I think the government should continue to subsidise installation (maybe making preparations on new roofs is a good idea) for the day when PV cell prices are low enough. They have been rising recently because of the silicon shortage, no one thinks this will be solved pre 2008.
Micro wind is neat. Again like CHP I suspect it is more important for industrial sites and institutional buildings than homes. Not sure what the neighbourhood noise issues are-- maybe with vertical axis turbines?
Micro hydro I am guessing what can be done, has been done. And there is the problem of interrupting fishing.
Passive solar is potentially quite big. Easy to install, no big technical challenges, addresses the main use of energy in a household over much of the year (ie hot water).
Agree that government should stimulate innovation and testing new approaches. I can't think of a technology right now that makes much sense economically, nor from a CO2 point of view vs. simply replacing as many home boilers as possible with condensing ones, and paying people to insulate their homes.
http://tonto.eia.doe.gov/dnav/pet/pet_move_impcus_a2_nus_ep00_im0_mbbl_m.htm
I suspect that the UK may be importing oil and/or refined products to offset these exports to the US. Note that China is an oil exporter (although they are cutting back), but a very large net oil importer.
BTW, as I have previously described, the overall North Sea perfectly fits the HL model. Using crude + condensate, the North Sea peaked at the same point as the Lower 48. And of course the world is now--at about 50%--where the Lower 48 and the North Sea were at when they peaked, and world oil production, as predicted, is trending down.
The UK is not showing the increases in consumption that some other areas are (e.g., about 5% year over year in Arab producing countries), but it does illustrate the key point that exports come "off the top." In about six years, we have seen about a million barrels per day in net light, sweet crude oil exports vanish--from just the UK.
is an interesting piece about what is happening to driving in the Gulf Countries. More grist for the mill that they will have less oil to export.
I have seen that rise in motor vehicle use in many countries from the Bosporus through to China, across that Central Asian arc (Turkey, Syria, Kazakhstan etc.).
The BP data only list production and consumptoion - as you know - so you can only get a net import / export number.
Need to remember gas replacing oil and satisfying growing demand - I posted a chart somewhere below.
I suspect that UK oil use in transportation is growing at an unsustainable rate - on my list of things to look at.
PS While bp have come in for a lot of stick recently - and rightly so - lets not forget the wonderful resource that their statistical review provides. I guess Dave might be out there thinking of a brown nose comment?
Yes, DTI statistics available here (Excel document) show that in 2005 the UK imported very slightly more crude oil and NGLs than it exported, but because it exported more petroleum products than it imported, it was still a net exporter, albeit only just.
So far this year, the UK is a slight net importer of 'Crude oil+NGLs', 'Process oils', and 'Petroleum products'.
While I have not checked this yet, I imagine that the sharp rise in UK gas consumption in the early 1990s marks a dash to address the acid rain accusations, with the expansion of gas - fired power stations and closure of coal fired plant.
Note how nuclear France has much lower gas consumption.
I heard a talk by Mat Simmons last year and he said that burning Nat Gas for electricity is a waste of a valuable resource - and I tend to agree.
The UK is now short of gas ... but that is the subject of another post.
Basically the Regional Electricity Companies (the RECs) were separated from the Gencos (Powergen and National Power: the former now owned by RWE (German) and the latter now split into 2).
To hedge their exposure to fluctuating electricity prices in 'the pool', the RECs began to build gas fired stations.
Combined Cycle Gas Turbines were the preferred method of generating power:
- gas was cheap in the mid 90s in the UK (the so-called British Gas 'Long Term Interuptible III' (LTI-III) pricing schedule)
- a CCGT has very high energy efficiency (over 60% on the GE 9Fs and their successors), the highest achieved for any combustion plant (without Combined Heat and Power)
- CCGTs were quick to build and therefore incurred low interest costs which is a major cost of constructing a power plant. They were also low pollution so relatively fast to get through the local Planning Process.
So the RECs (and a few industrial investors and US utility companies) jumped into the newly deregulated UK power markets and built CCGTs. As a way of freeing themselves from the Gencos.At the same time a lot of coal and oil fired plant built in the 70s was nearing retirement.
The result was at the end of the 90s the 'pool' electricity spot price crashed, some Independent Power Producers (including Drax, the largest coal station in Europe) went bust.
Recently, gas prices have soared. The UK has relatively little gas storage, and a cold winter in Europe, plus the Gazprom-Ukraine disagreement, sent the gas spot price soaring by over 400%. European utilities, which are not deregulated, did not release gas to the UK (legally, they cannot). Electricity prices have responded as well.
On current trends, the UK will be 70% powered by CCGTs by 2020, almost all of it from imported gas-- mostly Siberian, but also LNG.
Nuclear is currently c. 20% of the fuel mix (total generated terrawatt hours) but will soon begin a phase out. Most of the reactors were Advanced Gas (modulated) Reactors, and built in the early 70s, and so are reaching the end of their operating life. The older Magnox reactors have already done so. The estimated future decommissioning liability is £70 billion, which the government has assumed when it privatised the remaining nuclear generators (it had to then renationalise them-- when the pool price crashed, British Energy, as the nuclear operator is named, went nearly bankrupt and the government wound up owning 80% of it).
The Prime Minister is tilting towards a new generation of pressurised water reactors, although he will be in office less than a year more. However private capital markets will not fund these, without substantial guarantees from the government on nuclear waste and financial returns. (the UK had its own mini-Chernobyl, a fire which released substantial amounts of Plutonium to the atmosphere in 1957, at a place called Windscale in Cumbria in the north west, now in an Orwellian stroke, rebadged Sellafield).
In practice my view is nuclear is a way to try to avoid making tough choices about conservation and about wind power and other renewables. Even with massive subsidies, there is no way nuclear is going to be more than 100 Terrawat Hrs/ 10 gigawatts of capacity (UK electricity demand currently about 350 TWhrs pa). It's currently about 8GW of capacity. There is huge industry pressure for a new nuclear industry-- both from the companies (Tory backers) and the Trade Unions (Labour backers).
I think the PM will go for nuclear, and the next PMs (Brown and then David Cameron of the Tories) will simply endorse his decision, ducking reopening the debate. It will look like we are doing something important, when in fact we are not.
There is an enormous opportunity for wind power in the UK: we have some of the most reliable and constant winds in the world, and a large continental shelf for offshore wind. However there is fierce local opposition, opposition from environmental groups that don't wish to see the countryside 'despoiled' (eg the Ramblers) and a planning process which takes literally years, and has part time local counsellors making the final decisions on a subject of national importance.
The latest round is that not only can windmills not be built in National Parks, the Ramblers are arguing they shouldn't be built in places that can be seen from National Parks. Because it will spoil the view (presumably more so than global warming will).
For example, I kid you not, the London Flats project, 200MW at the base of the Thames, offshore, is now stalled because the local council objects to the switching station that will have to be built onshore to bring the power onshore.
NIMBYISM is what rules the UK these days.
Of course every politician ducks this. You can lose a critical Parliamentary seat over local issues (Labour lost one over a closure of a local hospital). A related problem is that the best places for windmills are Scotland, and the big consumers are in England. The Scots don't necessarily want to despoil their landscape for English benefit.
I think we could get to 1/3rd of the TWhrs in the UK coming from wind. There are grid stability issues, and it would be a huge buildup, (to something like 35GW of capacity, or 3 times where Germany is now), but there are no physical reasons why it can't be done and it would cost (roughly) £35-40bn over 15 years (depending on the onshore offshore mix and the 'learning curve' on new rotors).
We might still then need nuclear to achieve our national goal of 70% reduction in CO2 emissions by 2050. But wind is the 'quick win' on this one.
The RECS distribute electric power and did not generate it
The Gencos (as were) owned generation assets, but no distribution assets
The National Grid Co (now Transco, after it merged with the gas pipes company) looks after long distance transmission of electricity. A structural problem in the UK is that the power plants tended to be on the coal fields (ie in the Midlands and North) and the demand tended to be in the south, so the grid is utterly critical to the national energy balance.
Power producers bid on a 'closed gate' system, 60 minutes ahead, to supply power to the grid. They are paid either by the 'pool' (spot) price of electricity at that time, or on long term contract from a customer.
To some extent new CCGTs have addressed this problem of transmission, by being built closer to the southern population centres.
Post privatisation, everyone started setting up in competition with everyone else. One of the GENCOs bought one of the RECs, some of the RECs and one of the GENCOs were absorbed by foreign utilities, the RECs built CCGT generation, etc.
Bet everyone wishes they had bought gas fields ;-).
I understand French electricity is already a structural part of UK consumption, but I don't know the numbers.
You could double it, probably, without difficulty. Whether you could make it 10X I don't know.
I don't know as the French are going to build more nuclear. EDF is investing heavily in wind, and is also building gas turbine stations.
There is no need, in terms of domestic electricity demand, to build anything for 15 or 20 years.
One way or another, the French nuclear industry is export oriented. Having missed out on the huge Chinese market, it is hoping/pushing to build new nukes for other countries, but building them on existing sites to export the electricity might actually be a pretty smart strategy... If the French public will buy it.
Notice that about half of French nuclear sites are very close to borders (north-east and north-west). Long term thinking, thirty years ago...
Interestingly, although France is 70% nuclear, they are investing heavily in wind power (the central part of France has massive and regular winds, and the south has a seasonal wind, the Mistral, which is of very high speed).
Another interesting factoid about French nuclear is that they shut some of them down in the last 2 big heatwaves (last summer, and the one in 2003 that killed 10,000 people). The rivers run low and there just isn't enough cooling water.
Also, France is not very densely populated, and a large and increasing number of people heat with wood, or, increasingly, modern derivatives (pellets or shredded wood).
They are just in the process of privatizing GDF, the state gas monopoly. A profoundly stupid thing to do in these times. A gift to Gazprom, in the medium term.
A lot of people still heat with fuel oil, I forgot to add.
She wants to shut off most of the house, in the winter, and put a gas heater in for a small part of it.
Ground Source Heat Pump
http://oee.nrcan.gc.ca/publications/infosource/pub/home/Heating_and_Cooling_with_a_Heat_Pump_Section 4.cfm
(being Canadian, all this information will also be available on a French page).
http://oee.nrcan.gc.ca/publications/infosource/pub/home_f/Chauffage_thermopompe4.cfm?Text=N&Prin tView=N
http://www.canren.gc.ca/app/filerepository/50974D9B8BBA4675A31461A8FAF526CC.pdf#search=%22POMPES%20G EOTH%C3%89RMIQUES%22
http://www.cmhc-schl.gc.ca/publications/fr/rh-pr/tech/03-118-f.html
http://www.ademe.fr/particuliers/Fiches/pac/rub3.htm
looks like from the French page you can get a grant as well.
in the US they are now called geoexchange heat pumps-- there is some good industry literature if you google it.
The Swedes have installed something like 350,000 of these things, and the technology has been around for over 25 years.
They offer massive increases in heating (and air conditioning) efficiency-- as much as 4 times as efficient as a conventional boiler arrangement. Basically you use electricity to run a giant air conditioner, with the coil under ground. in the winter you 'cool' the ground, and heat your house (and vice versa in the summer if the capability is installed).
The cost is you have to dig a deep enough hole (ground rock has to be right) or a long enough trench. In the UK, cost has been estimated at about £10,000 (but you get a grant).
10 years ago my aunt installed one in Canada. Payback then was about 10 years, but since then energy prices have doubled. There is also something called an 'air source heat pump' which doesn't need the digging. It is not as efficient and doesn't work on the coldest days (below about -10 centigrade, I think). But obviously much cheaper to install.
You keep an oil heater as a backup heater, but you don't need it much, only on the coldest days.
It would be a significant capital expense but it might be well worth it.
In the short run, the best I can suggest is that she install temperature control valves on the rads in each room.
Interesting point about countries with plenty indingenous energy wasting more than those that must import.
As for the 1985 to 1996 - that would definitely be related to phasing out both dirt cheap Russian oil (East Germany) and coal - both in West Germany and in East Germany.
East German coal is especially low grade, and replacing it with through other sources of energy/efficiency/conservation was considered a reunification bonus by just about everyone.
Brown coal is really dirty stuff - but it is likely that a lot of places are going to learn that fact over time.
"However, data published by the DTI for 2006 production, suggest that decline may be accelerating. In the period Jan-May 2006, the UK offshore fields produced crude oil at a rate of 1.53 million bpd compared with 1.76 million bpd in the same period of 2005. This represents a 13% production decline.
Given that decline in 2004 and 2005 was >10% per year and decline so far this year is around 13%, the decline figure used here may prove to be over cautious."
However, the DTI statisitcs here show that between January and May 2006 the decline in comparison to 2005 was 'just' 10%. The June statistics are also available, and are down 14% on 2005, so that January to June is down 10.8% on 2005.
http://www.og.dti.gov.uk/pprs/full_production.htm
go to oil production sorted by year at the foot of the page and select 2005 and then 2006. Copy and paste the data into xl and then do the sums.
I got 42.33 M3 for Jan - may 2005 and 36.81 M3 for jan - may 2006.
I may have got it wrong - every one can make mistakes - but let me know.
Your calcuations are correct - it seems that the DTI statistics are inconsistent.
At http://www.dti.gov.uk/energy/statistics/source/oil/page18470.html you can download a monthly oil production table towards the bottom of the page (click on 'Production (ET 3.10)'), which also contains annual oil production, imports, exports, etc. This data is already in a spreadsheet. (Note the figures in the document are in thousands of tonnes this time). The DTI own calculations show that oil production (crude plus NGLs) is down 10.8% for January to June, and you can easily check that January to May was just 10.1%.
So why do the DTI's statistics from one source show a decline of 10-11%, and from the other 13%? I don't know.
I've not looked into your source yet - you see I've been plotting lots of charts - but will point the DTI at your query tomorrow.
There is always scope for unceratinty built in by NGLs, and on-shore oil - the data I looked at here is just off shore oil fields. The DTI seem to include condensate as crude oil, but liquids from gas fields as NGL.
The spreadsheet I mentioned does give production statistics for 'Total', 'Crude oil' and 'NGLs' (which, according to the spreadsheet, include condensates), and the decline rates for 'Total' and 'Crude oil' production are very similar, so I don't think the inclusion or exclusion of NGLs would explain the discrepancy.
I just feel like I have had a meeting with a Professor of Medicine on my prognosis.
Dont bet the farm on the Atlantic Margin.
My old mans's last job as an Engineer of CEGB Northern was to stockpile High Calorie Coal for the coming miners strike to feed the Big northern power stations.
Stock piling Anthracite quietly started the Year Thatcher came to power.
The miners would have needed to stay out at least 30 months, with rationing hitting by month 24.
In those days, Whitehall was staffed by men and women composed entirely of streaky bacon and cold thought.
Surely, we will miss these mandarins in the years to come.
It said they were quite close to power cuts, that summer. Literally within days. Maybe due to plant outages rather than too low coal stockpiles?
I don't know if there is an authoritative history of this. The story about the negotiator expressing concern for his opposite only came out recently (I think one of them died).
It's not remembered that Scargill never even held a ballot for the strike: he didn't think he would win it.
I don't think 'the National Interest' is something people appeal to any more-- you'd probably be laughed at.
I agree we will miss those Mandarins. They were autocrats, but they would put the country first. Many of them were very highly educated and skilled.
Lovelock' s latest book is a good read in many places.
Put that last in plain English. In any number of lab experiments and real life ones, people:
I was being a bit sarcastic in my comment about the public knowing what is best for them. A combination of ill informed public opinion, minority views and media having too much influence on the decision making processes here is a recipe for disaster.
I think the public do need to be asked however, if they want to have electricty at home that is on all the time. If the answer is yes, then the public needs to live with the consequences of CO2 free power generation.
The government is not doing nearly enough by way of energy saving technology initiatives.
Sorry if I was a straight man to your joke: we Canadians are embarrasingly earnest ;-). I like Monty Python and Blackadder though, so I must be half British ;-).
From the articles in the Guardian about Monbiot's book, it looks like one of the shocking problems in the UK is how bad the housing stock is in terms of energy conservation: Swedish building standards in 1978 were better than British ones now. The building lobby effectively paralyses any initiatives to change that.
Instead John Prescott plans to build huge new towns on places like the Thames spillway, where flooding is almost certain under global warming. People are going to buy those homes, and then sue the government for compensation.
If Katrina taught us anything, it should be that you don't allow people to build along waterfronts, especially not on wetlands. Yet that is precisely what we are doing.
There is so much we could do that is so obvious. There is a form of driveway paving that still allows the water to percolate down (paving is a major cause of flash floods-- the water cannot get away naturally). It would take nothing to mandate that for all new driveways and forecourts.
Urban tree programmes can save a fortune in air conditioning bills. One of my big worries is that as Britain gets hotter, we will install more air conditioning-- it's already started. We had big power outages in Soho this summer because the local grid couldn't take the load. But then most air conditioned stores and restaurants leave their door open to attract custom.
Public opinion polls are useless for policy questions, because they don't force people to make tradeoffs. We all want more government services, and someone else to pay more taxes for them.
There is a 'focus group' technique that takes voters through the tradeoffs via discussions. You get much more informed outcomes.
Right now, the majority of people, including my in-laws, think global warming is something to do with the ozone layer. Or they think it is not a problem. Or it is a problem for the far future. Or it is a problem government can solve. Or it is Blair's fault. Or Lord King is supporting nuclear power because he has been bribed (a common environmentalist criticism).
Still, the Sun had a piece on global warming. I suspect it will be a bit like The Mail, in that it will raise fear (not long before global warming is blamed for housing price collapses and immigration is blamed for global warming) without raising solutions.
The link below is to a post in July documenting through the use of graphics (scroll down) the developement in the year over year collective decline rate for the Norwegian oil fields starting to flow prior to 2001/2002.
http://energikrise.blogspot.com/2006/07/utviklingen-i-oljeutvinningen-fra.html
As of this summer, based upon actual data from NPD, the collective year over year decline rate for these fields were running between 13 - 15 %.
This could of course slow down in the future, and the fields in UK and Norway exhibit a lot of similarities.
My point is that it should be expected higher decline rates than assumed for this post.
The link below is to a post from earlier this month that documents the decline for oil extraction from the Troll field (that was 400+ kb/d at peak), that at some point in time had the highest production of all the Norwegian fields based upon actual NPD figures.
http://energikrise.blogspot.com/2006/09/fallrate-og-oljeutvinning.html
Presently the Troll field (the oil part) has a year over year decline rate around 20 %.
Sorry that the text is in perfect Norwegian, but the diagrams are in English and are clickable for improved viewing.
Interesting to note that 13% decline is not unusual.
I presume you know the Troll West Oil field is a bit unusual - really a thick oil rim below a big gas column - with extensive carbonate cemented layers that hinder water and gas coning - I know, I worked this stuff.
So Norsk hydro (or is it Shell) really deserve a huge pat on the back for getting so much oil out of this using horizontal wells - probably one of the first technical examples of this in the world. It is inevitable given the reservoir geometry that when gas or water hits these producers that the decline will be severe - 20% doesn't sound that bad actually.
I think the 13% number is interesting though - Brent, Statfjord and Paleocene reservoirs both sides of the dividing line.
Hvis du er i Aberdeen og skal ut sa barre mail.
Ulv
Yes, I am aware of the thin oil column of Troll, and the need to develop the oil part before to much reservoir pressure were lost due to gas depletion.
Norsk Hydro developed the oil part of Troll.
Shell developed the first gas phase, which Statoil took over as operator for and still is.
The 13 % decine is the collective rate for all the fields included in subject analysis. Rates varies between individual fields, and some have experienced year over year decline rates above 40 %.
Avtale, planlegger jeg en tur til Aberdeen, i'll mail you.
Energimann
Discuss...
I have seen same evidence that their economy is booming and so is their internal consumption.
I would guesstimate that 2.7 mbpd spare capacity equates to a WTIC next month price of about $53 which leaves a risk premium of about $8 (for the current $61 price) which is $10 down on my recent guesstimated risk premium max of close to $20. I personally guess that global spare capacity is just less than 2.0 mbpd and could be below 1.5 mbpd - more probably than above 2.5 mbpd.
There is a low probability (barring a significant collapse in US or Chinese growth) of oil dropping below $56, so you would probably make more, and more reliable, money by shorting US stocks or stock indices - but take care, though they will turn and drop by 15+% before yearend that turn could begin any time from tomorrow to end October and there is scope for a 2 to 3% increase meanwhile.
Given minimal (about 0.5 mbpd) transient supply disruption due to things like Nigerian conflicts, weather (GOM hurricanes, Russian freezes), geopolitical silliness (uncle Hugo, auntie Morales, fuhrer Putin, his holiness GW), we should chug along at a bare surplus for another year or so, perhaps as much as 5 years but that is very unlikely. A mild depression of demand due to current price levels and slowing economic growth will help.
When demand really does exceed supply you will seriously notice it in price, the range will morph from %50 to $150, where we are now, to $200 to %600 - $100 oil will be gone forever in a blink.
Yes, there are several constraints in current exploration and development: rigs, special steel and other specialist raw materials, expertise, permits, skilled people, political games, insurance costs. It was mostly ever thus, excuses are just excuses, they will always be, and always be. Perhaps more of the limits are being tested just now ;)
Someone at TOD said a few days back that they thought we were at peak now-ish and supply would decline to 77 mbpd by 2010. My rough calcs suggested a minimum price of $515 bbl in 2010 if that were the case, and a price spike of between $750 and $800.
Even adjusting for export loss we will have net exports down probably 15-18%. SUrely you do not think that high prices will not cause a recession of epic proportions. I have been going $175 for 2010.
Your thoughts....
The interplay between energy prices, recession and response are the prime determinant of humanity's future. There are many knife edges ahead and I do not see the probable path clearly yet. Here is my post with next 5 year price predictions:
http://www.theoildrum.com/comments/2006/9/11/231845/209/131#131
Recession of epic proportions? Yes, that happens anyway as the global imbalances unwind, it starts a mite sooner than you think but the official US stats won't begin to fully reflect it until the revised Q1 2007 GDP are issued (about end of May?) - the first guess release US GDP data is largely fictional assumptions.
Two things scare me...
First is mechanical: if we have a recession while oil is about peak then try to emerge from recession just as oil production begins to decline seriously things will get awfully, unpleasantly messy. It is important that peak oil is acknowledged as we go into or are in the recession, it must be part of the solution.
Second is humans: they have a stupid tendency, nuff said.
Boof asks, "How smart is it to be dependent on a natural gas pipeline from another country?"
How about being completely dependent on LNG natural gas ships from another country, because a pipeline isn't possible? Wouldn't that assure poverty? And if the country had no crude oil either?
And over 100 million people who wanted to live the modern life?
I dunno, ask the Japanese.....
Roger Conner known to you as ThatsItImout
I don't know enough about LNG economics to speculate on when or where it is a good idea. However, it does have the potential to broaden the supplier base and create a single market with a global price.
I bet the Japanese hate their vulnerable situation which is why they build fast breeder reactors in earthquake areas. Maybe for cultural reasons they don't discuss it as openly.
- the usual cosy relationship between MITI (the ministry of industry and trade) and the engineering industry-- true since the Second World War
- the importance of construction in the political system. The Japanese politicians pour twice as much of GDP into construction as other developed economies, because they get huge kickbacks from the Yakuza and the construction industry
- Japanese collective tendency to avoid embarassment and public exposure so as things went wrong they just buried them
There may have been a strategic argument in there, but the above factors have a huge impact on anything that goes on in Japan. A lot of bureaucrats and businesspeople will owe their jobs to the pursuit of a breeder reactor programme.Currently there is not much of a LNG spot market. The supplier countries have to build liquefaction trains which cost billions .... which they won't do unless they have a long term fixed contract in place.
This means that no consumer country can casually ask a supplier country for LNG ... it's mostly spoken for.
Even worse, Qatar, the great hope for much of the world's LNG needs has put a moratorium on new supply contracts ... they seem worried that their huge reserves are less huge than first thought ...
I suspect any spot market which develops will simply involve a stray ship here or there being diverted ... for a very hefty price. You can't plan the world's future on this sort of "grey" market.
So diversification of supplies is something that the UK seems to have got right.
IMO, the crazy thing in all this is importing LNG for power generation. First the produced gas has to be cooled, then loaded on a ship that has to sail through Hormuz, then re-gasified, piped to a power station where it is burned and a lot of the energy is lost. How smart is that?
http://news.ninemsn.com.au/article.aspx?id=145980
CA is about to make coal-fired electricity virtually illegal in the state of CA. Those same people are fighting an LNG terminal which will bring the gas CA needs to produce power.
Meanwhile on the East Coast, MASS wants to close the largest LNG Terminal. Lucky for them there is a compliant community of Canadians across the border who will accept an LNG facility. The cost being the energy to move the gas back across the border to New England power plants and gas utilities.
http://www.canaportlng.com/factsheet.htm
The Irving family owns New Brunswick (Irving Oil) and the political system there--they own all the media outlets. So perhaps no surprise the plant is going in there, not in MASS.
And the standard bearers of environmentalism, the Kennedy family, and Sens. Ed. Kennedy and J. Kerry, are opposing a 1000MW offshore wind station because it will ruin their view from their multimillion dollar homes in Cape Cod.
http://www.boston.com/news/nation/articles/2006/04/27/kennedy_faces_fight_on_cape_wind/
Also an LNG tanker makes about the world's best bomb-- a choice target for terrorism. A gas tanker (propane I think) collided with an arms ship in Halifax harbour in 1917, creating the world's largest man made explosion, pre Hiroshima. About 5 kilotonnes of TNT I believe (1/4 Hiroshima). Several thousand people were killed and the Canadian government is still paying compensation to the widows of survivors.
http://archives.cbc.ca/IDD-1-70-971/disasters_tragedies/halifax_explosion/
http://www.cbc.ca/halifaxexplosion/he2_ruins/index.html
You got any links to energy loss and LNG? Also need to take account of embedded energy drilling wells, in LNG trains, in ships etc.
Combined cycle gas power stations are efficient when it comes to burning gas - but they will conveniently ignore that the starting point is 80% when it comes to LNG.
There was a post here on the Oil Drum about LNG economics, cost of gasification/degasification etc, a while back.
People don't think systemically: if I do x here, then y happens there. They thing we just do x, or stop doing x, and all is well.
So the people pushing for CA to do something on greenhouse gases, don't tie that to CA importing more LNG. But the one must follow the other.
That said, in the Malibu case, the Woodside Petroleum proposal (building the facility as a pipe, 25 miles offshore) sounds better from a NIMBY point of view, if not from a practicality point of view.
Far more radiation (radon) is released along with ng, including the bit burned on home stoves, than in the world's nuclear plants.
oil is uniquely efficient in that production, transport and refining doesn't lose you a lot of the energy value.
Gas is OK as long as there is a pipeline.
Coal of course you have to get it to the destination. There was a long piece by John McPhee in the New Yorker, about a coal train from Wyoming to the US' largest coal fired station (in either Alabama or Georgia... I forget which). It's why coal fired stations are traditionally built on top of the mine, or near the consumer but on a major watercourse (water being far cheaper transport than railways).
Any good cite?
Date Shipments Arrivals Net Export
Jul/04 7,680 8,387 707
Aug/04 6,093 7,945 1,852
Sep/04 7,179 6,490 -689
Oct/04 6,550 7,825 1,275
Nov/04 6,817 7,153 336
Dec/04 6,813 8,343 1,529
Jan/05 6,808 7,539 731
Feb/05 6,032 6,391 358
Mar/05 6,433 8,015 1,582
Apr/05 7,066 7,073 7
May/05 7,217 7,710 492
Jun/05 6,989 7,552 563
Jul/05 6,928 7,252 323
Aug/05 7,182 5,658 -1,524
Sep/05 7,099 5,950 -1,148
Oct/05 6,802 6,999 197
Nov/05 6,346 6,316 -29
Dec/05 6,495 7,365 871
Jan/06 6,703 6,547 -156
Feb/06 6,236 6,060 -176
Mar/06 7,550 7,558 8
Apr/06 7,118 6,735 -383
May/06 7,849 6,585 -1,265
Jun/06 6,542 6,397 -144
The UK have been a net importer of petroleum and petroleum products for 8 of the last 12 months.
June output has been on average 10% below the overal average
The Royal Bank of Scotland in commenting on the 13% drop in oil production and 23% drop in gas production in June 2005 over June 2005 said,
"Early summer maintenance depressed oil, and in particular, gas production in the North Sea in June, but the sharp decline in production compared to one year ago suggests that the secular decline of the North Sea continues," the bank said.
It also said it was a
"conundrum that the increase in investment spending seen over the last year has not resulted in measurable output growth."Soaring costs fail to explain the sluggish supply response, since higher input bills have not prevented a sharp pick-up in drilling activity,"
This, it said, is "particularly puzzling given that drilling activity aimed at the development of new fields and boosting existing fields, has accounted for the lion's share of the recent sharp increase. The relative weakness in exploration drilling in turn bodes ill for future production growth,"
HaHaHaHaHa......