| Tech Talk - The Latest Canadian Oil Spill | The Oil Drum | Sincere Thanks to All Who Worked with The Oil Drum |
Maugeri Misses Bakken ”Red Queen”
Posted by Rune Likvern on August 5, 2013 - 5:12am
In this post I will, amongst other things, present the results from my review of the Bakken portion of Leonardo Maugeri’s discussion paper “The Shale Oil Boom: A U.S. Phenomenon”
Leonardo Maugeri is an ex-ENI executive now with the Harvard Kennedy School Belfer Center which receives funds from BP. His discussion paper presents his findings from “tracking” 4,000 tight oil wells in USA.
Maugeri forecasts total U.S. tight oil production to reach 5 Mb/d by end 2017 of which 1.8 Mb/d from Bakken.
In this review I have examined Maugeri’s well productivity claims, cash flow developments and transport/infrastructure issues (which has been ignored by Maugeri).
This post is based upon my previous posts about Bakken;
Is Shale Oil Production from Bakken Headed for a Run with “The Red Queen”?
Is the Typical NDIC Bakken Tight Oil Well a Sales Pitch?
Will the Bakken “Red Queen” have to run faster?
During my studies of tight oil wells in Bakken I have looked at the history of about 5,000 wells in Montana and North Dakota.
Considering the number of wells studied that formed the basis for Maugeri’s paper and over time the huge individual variations in well productivities, decline rates etc., it would have been good if the paper had also presented more of the statistical analysis performed that would support its findings.
Statistics is an excellent and powerful tool for analyzing such extensive research.
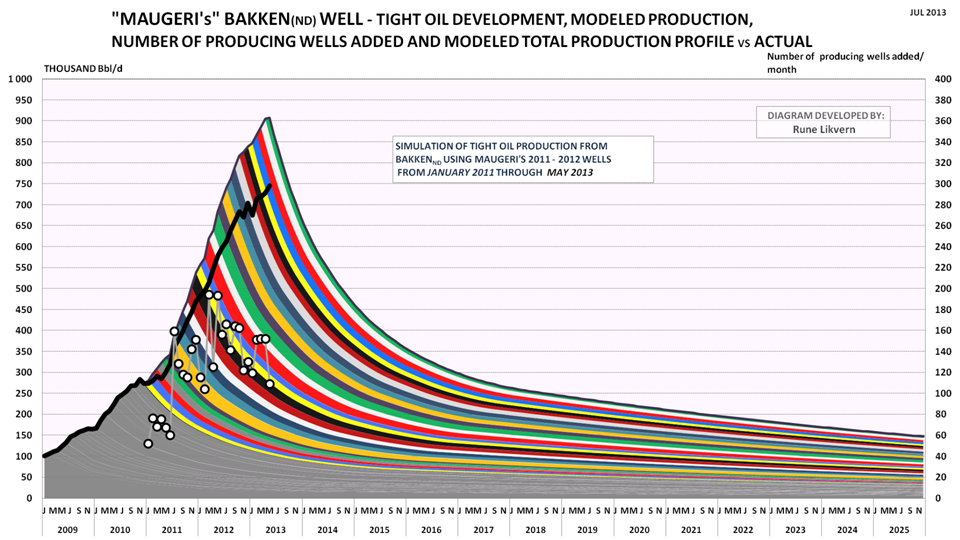
MODELED PRODUCTION WITH MAUGERI’s WELL VERSUS ACTUAL
My modeling found that Maugeri's figures (Fig 3, p. 10) overstate the average productivity of typical 2011-2012 vintage Bakken wells by about 20%. If Bakken/Three Forks (ND) production had followed Maugeri's model, it would have been at 907 kb/d in May 2013.
Instead, NDIC reports the actual production was 745 kb/d."
From Maugeri’s paper p. 31
“My analysis of the productive pattern of more than 1,400 producing oil wells in Bakken-Three Forks suggests that productivity per well has increased dramatically over time.”
Maugeri does not describe any future decline in average well productivity. My analysis Will the Bakken “Red Queen” have to run faster? of actual well data from NDIC documents a significant decline in average well productivity from 2010 which during H2 2011 stabilized at a total of 85 kb for the first 12 months of flow.
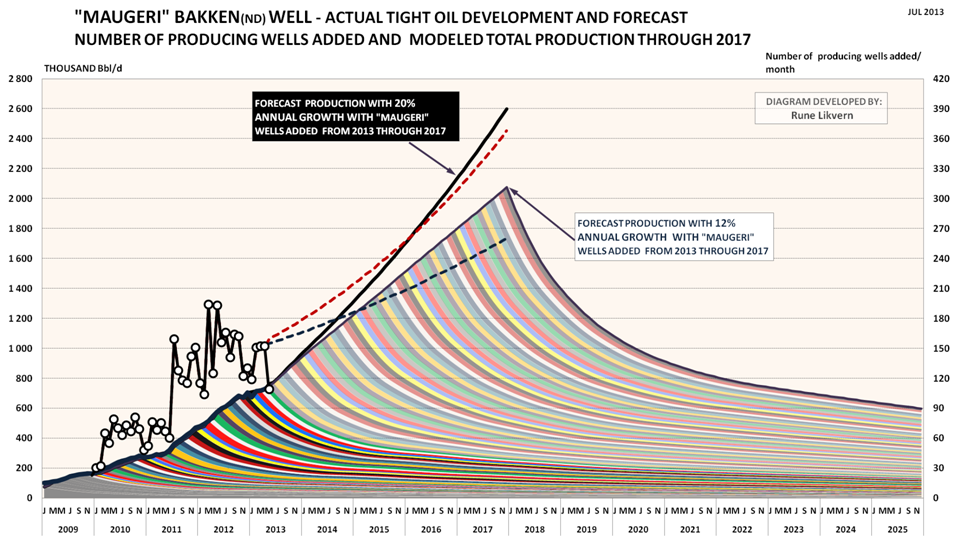
FORECAST PRODUCTION THROUGH 2017 WITH MAUGERI’s ASSUMPTIONS
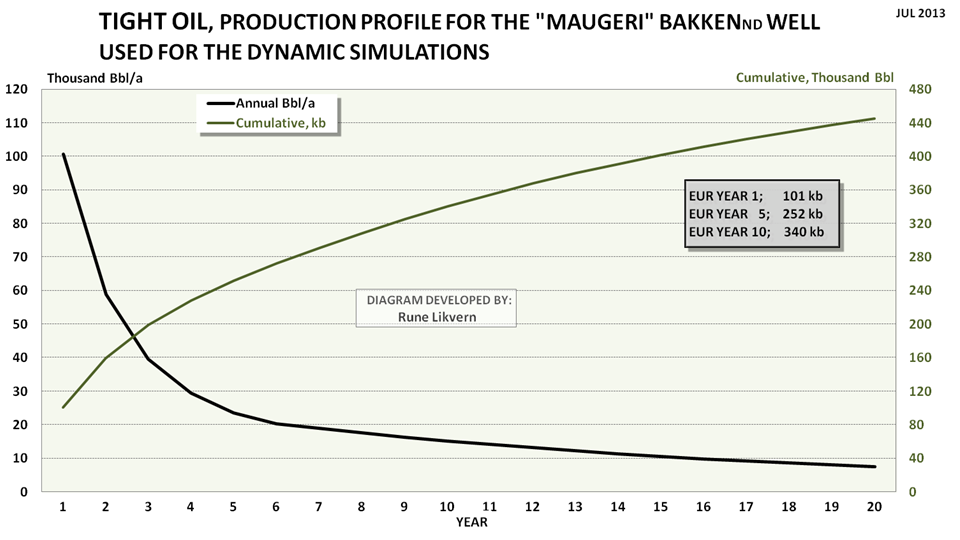
Maugeri’s scenarios assume 12 - 20% average annual growth in well additions from 2013 through 2017. As I found no mention by Maugeri about possible future changes in well productivity, the model used the 2012 well detailed by Maugeri (see also figure 2) throughout 2017.
Maugeri's assumptions would lead to:
12% annual growth, blue dotted line, results in 260 wells/m in December 2017.
20% annual growth, red dotted line, results in 370 wells/m in December 2017.
Recent monthly well additions in Bakken ND have on average been around 150 and in recent weeks NDIC has reported a decline in active rigs in Bakken while the oil price has strengthened.
Estimated total number of net added flowing wells June 2013 - December 2017 using Maugeri's assumptions:
- 11,200 with 12% growth
- 13,800 with 20% growth
As of May 2013 NDIC reported a total of 5,730 flowing wells for Bakken/Three Forks.
Maugeri’s 12% and 20% growth scenarios resulted in estimated/modeled total oil production of respectively 2.1 Mb/d and above 2.6 Mb/d by Dec 2017.
Maugeri forecast 1.8 Mb/d by 2017, page 32 in his paper.
Given the oil price scenario I used for this study, I assumed that if the number of Bakken’s new producing wells increases progressively by 12–20 percent a year from 2013 on, the play may reach a crude oil production of 1.8 mbd by 2017.
The white circles show actual net added producing wells by month (rh scale). The thick black line reported production from Bakken (North Dakota) by NDIC (lh scale).
The 20% growth scenario in well additions is shown by the dark blue line (lh scale).
The chart also shows forecast developments for monthly well additions with respectively 12% growth (black dotted line) and 20% growth (red dotted line) through 2017 (rh scale).
The model was calibrated to start simulations as from June 2013.
NOTE: The chart shows modeled development in total production as of end 2017 and a forecast for production from the total population of wells at end 2017 towards 2025. The chart does not imply anything about well additions beyond 2017.
Maugeri’s assumptions will result in close to a doubling of rigs drilling in Bakken (ND) by 2017 and if this is viewed in the context that it is highly likely that shale gas drilling in North America will have picked up by then from expected growth in natural gas prices, this suggests increased pressure in the delivery chain for goods and services required to manufacture wells, and thus cost inflation.
Maugeri also uses an assumption of an average annual 8% decline in well costs towards 2017 which does not give the impact from future shale gas activities any considerations. Further there were not any references to credible sources that could support Maugeri’s assumption for future declines in well costs.
12% and 20% annual growth in well additions were estimated to produce totals of respectively 5.1 Gb and 6.0 Gb of oil from June 2013 through December 2025 without any well additions post 2017.
As of May 2013 around 0.7 Gb of had been produced from Bakken.
ESTIMATES ON NET CASH FLOW AND CUMULATIVES
- There is no mention in the paper about needs for additional funding and oil companies’ remaining debt capacities.
- Expectations for sustained higher oil prices also encouraged the oil companies to take on more debt to supply the market with (costlier) oil from more expensive sources.
12% and 20% annual growth in well additions starting from June 2013 were estimated to require respectively $5 billion and $9 billion in additional external funding, of which a major portion is likely to be debt additions, through 2015 and 2016 before any reduction of total debts could take place.
If Maugeri has some built in assumption of declines in future well productivities (which there is no mentioning of) in his production forecast this would result in increased needs for external fundings.
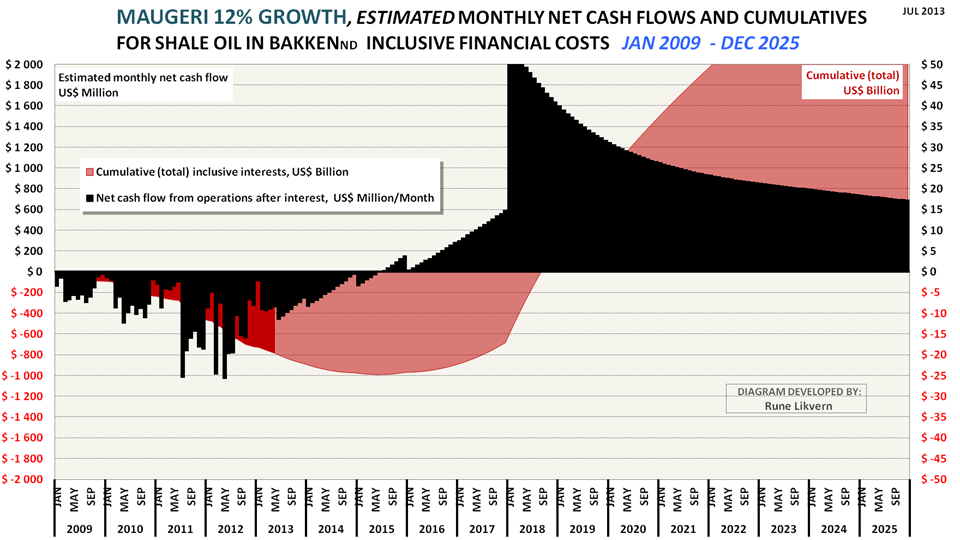
Further the chart shows an estimate on monthly net cash flows through 2025 based upon Maugeri’s assumptions per his paper and 12% annual growth in monthly well additions.
Assumptions for the chart as of May 2013 are WTI oil price (realized price), average well cost starting at $8 Million in January 2009 and growing to $10 Million as from January 2011. All costs assumed incurred as the wells were reported starting to flow (this creates some backlog for cumulative costs as costs in reality are incurred continuously as the wells are manufactured) and the estimates do not include costs for completed non- flowing and dry wells.
Estimates do not include any effects from hedging, dividend payouts, retained earnings and income from natural gas/NGPL sales (which now and on average grosses around $3/Bbl).
Estimates do not include costs for acreage acquisitions and investments in processing/transport facilities and other externalities like road upkeep etc.
INFRASTRUCTURE/TRANSPORT
Above some level of flow the most cost effective way to transport oil and gas beyond a certain distance is by pipeline. Oil production in North Dakota and Montana is landlocked and distant from its main consumers, the refineries.
One of the things that caught my interest as I went through several presentations with forecasts for growth in oil (and natural gas) from Bakken was that I found few maturing plans to move more oil by pipeline.
Why?
As pipelines would offer the most cost efficient solution for bringing oil to the markets, all involved in Bakken tight oil extraction would stand to profit (exception being the rail companies). With lowered costs for transport comes a higher net backed price at the wellhead. This has thus the potential to increase the oil companies’ profits, result in higher tax and royalty payments and provide the pipeline companies acceptable returns.
Long distance big diameter pipelines take years to complete from planning, sanctioning, financing, right of ways, construction etc. before they become fully operational.
To understand possible reasons why more oil pipelines from Bakken might not happen at a scale reflecting many pundits’ forecasts for production growth and levels; it may help to look at what it takes to make a pipeline commercial.
The oil companies are highly aware of the steep decline rates from the tight oil wells, oil price swings, productivity changes etc. which also makes it hard for them as shippers to commit to long term firm nominations/bookings of capacities (transport profile) for tight oil production that could provide the commercial basis for increased transport of oil by pipeline from Bakken.
Tight oil developments offer great flexibilities for CAPEX adjustments with price developments, and periods with lowered prices are likely to reduce CAPEX and thus bring with it the prospect of rapid declines in total production. Committing to long term capacity nominations/bookings thus exposes the oil companies (shippers) to the risk of rapidly growing unit transport costs during periods with lowered needs for transport. This risk appears to be outweighed by the apparent higher costs incurred from transport by rail (or truck), which allows for more capacity flexibilities according to needs.
The pipeline companies need predictability and they therefore strive to build a portfolio of long term ship or pay capacity nominations/bookings (commitments) to ensure a predetermined minimum return from their investments and operations.
The above may explain press releases like this.
TULSA, Okla., Nov. 27, 2012 /PRNewswire/ -- ONEOK Partners, L.P. (NYSE: OKS) today announced that it did not receive sufficient long-term transportation commitments during its recently concluded open season for the Bakken Crude Express Pipeline. As a result, the partnership has elected not to proceed with plans to construct the pipeline.
"Despite the robust outlook for crude-oil supply growth in the Williston Basin in the Bakken Shale, we did not receive sufficient long-term commitments under the terms we needed to construct the Bakken Crude Express Pipeline," said Terry K. Spencer, ONEOK Partners president.
Maugeri’s forecast growth to 1.8 Mb/d from Bakken by 2017 would provide for long term capacity utilization for pipelines with total capacities of at least 0.6 - 0.8 Mb/d, (see also figure 3 above).
A viable indicator of oil companies’ expectations for long term production levels from Bakken would be sanctioned plans for construction and total transport capacities of oil and gas from Bakken to the market.
- Maugeri does not mention anything about the potential for realizing additional major oil (and gas; a big portion of the associated natural gas has been and will continue to be flared) pipelines based upon his forecast for growth in oil production from Bakken.
- Could the present lack of long term ship or pay commitments from the oil companies that could form a commercial basis for considerable additions to pipeline capacities for oil from Bakken be the proverbial “canary” that reflects the oil companies’ true expectations about their growth for oil production from Bakken/Three Forks?
FUTURE OIL PRICE DEVELOPMENTS
At one point I agree with Maugeri. That is about his expectation for a future decline in the oil price.
However, my expectations are well founded for somewhat different reasons, such as persistent lowered global real economic growth, and continued weakening of consumers’ ability to afford expensive energy, which so far and according to EIA data, has led to significant declines in consumption of “expensive” energy within OECD, primarily USA, Italy, Spain, Portugal and Greece to name a few, (see also figure 6). Any growth in global oil supplies will therefore likely intensify any downward pressures on the oil price.
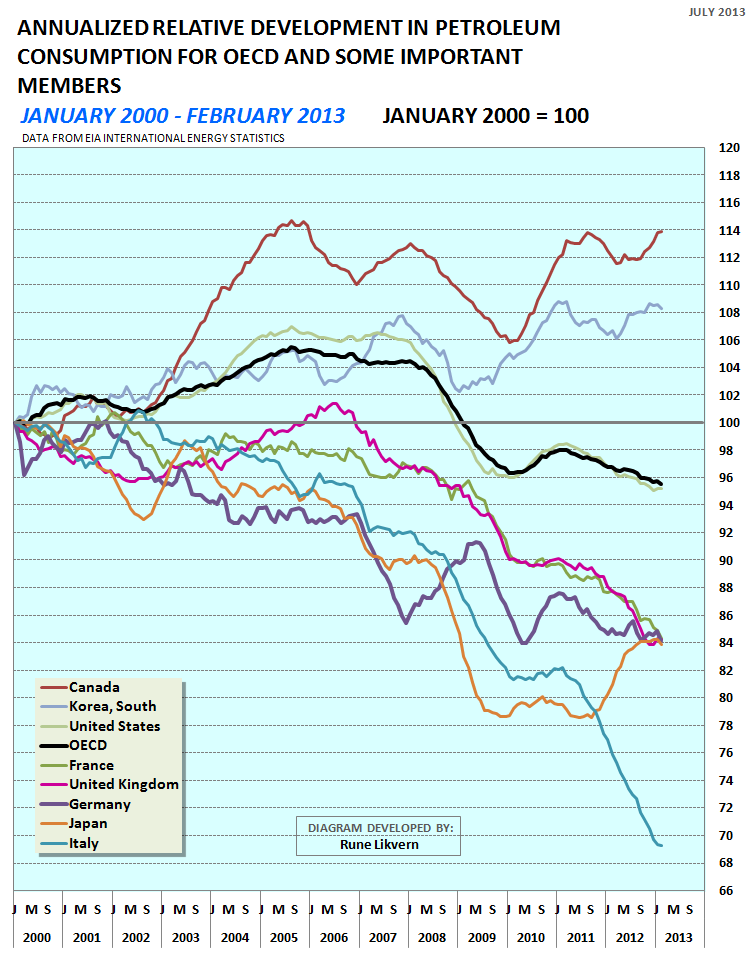
The chart above clearly demonstrates that the recent general higher oil prices together with troublesome total debt levels have led to significant declines in consumption/demand within OECD. It is worth noting that one of the economies with one of the world’s highest trade surpluses and “moderate” total debt levels, Germany, has seen a decline in its petroleum consumption of around 16% in the last 12 years. It is not clear if this decline is all due to efficiency gains.
During the last 10 years Italy has seen a decline of more than 30% in its total petroleum consumption.
One of the prerequisites that enables a country to continue growing imports of more expensive energy is a trade surplus or trade balance at least.
In the last three decades (at times) accelerating growth in public and private debt also allowed for growth in global oil consumption and for some time tolerances for much higher oil prices. Growth in aggregate debt can go on until it cannot. As the combined effects from debt deleveraging (debts are being paid down or written down, which is the definition of deflation) and austerity as it sets in in earnest will continue to affect aggregate demand also for petroleum/oil as shown in figure 6.
So far, the emerging economies, primarily represented by China, have grown their petroleum consumption and thus ensured a modest 2.5% global growth in crude oil and condensates consumption since 2005.
Even China with its present huge trade surpluses and foreign reserves will have limited financial capacity to sustain and absorb the compounding effects from growing petroleum (energy in general) imports and high oil prices.
A growing number of countries will increasingly have to prioritize their use of any trade surpluses amongst providing for more expensive food and any growth in consumption of expensive energy for their growing populations.
Contact
- Content: editors at theoildrum dot com
- Tech support: support at theoildrum dot com
License

This work is licensed under a Creative Commons Attribution-Share Alike 3.0 United States License.
German Oil Consumption
German oil consumption decreased by about 10% over the 12 years from 2000. Nearly all of the reduction is accountable for by the reduced heating oil consumption, with minor contributions from the chemical industry. There is a shift from gas to diesel, caused by passenger cars switching to diesel. I could not find a statistic for passenger miles driven, but I think they have been largely stagnant in the last years. And yes the German economy has grown despite reducing oil consumption. My hunch is that once efficiency gains in roomheating have been maxed out, the next thing to go will be leisurely air travel. www.mwv.de
Heating oil, with rare exceptions, is diesel, or distillate rather. Consumption of it has never exceeded that of transportation fuel in any developed nation, excepting very early on before the widespread adoption of the automobile; I suspect your number for heating oil is for total of all distillates. The EIA listed the following for consumption in 2009 Germany:
Total 2,471
Gasoline 493
Jet Fuel 190
Kerosene 0
Distillate 1,014
Resid 181
LPG 101
Other 492
re:
"12% and 20% annual growth in well additions starting from June 2013 were estimated to require respectively $5 billion and $9 billion in additional external funding,"
Recent news of profits dropping for Majors would seem to indicate such funding is not likely.
I think M's work is based on no declines to existing production, isn't it?. Yet, all graphs look like a 'Jaws' rerun. Only the peak and decline dates are possible variations. The trend is not. The fact that no major pipeline company would build or expand existing infrastructure says it all. This has been pumped for investment and propaganda purposes, or else there is a vast conspiracy to keep America feeling better about rising prices. The media and Industry hype is bizarre and dishonest.
Excellent and thorough presentation. Thank you.
Paulo
It is worth noting that one of the economies with one of the world’s highest trade surpluses and “moderate” total debt levels, Germany, has seen a decline in its petroleum consumption of around 16% in the last 12 years. This decline is not all about energy efficiency gains.
These two sentences seem to contradict each other. Where is the evidence that consumption declines are not due to efficiency and substitution?
The very first comment above suggests that space heating has eliminated oil - this appears to be very effective substitution and efficiency. The next logical step is moving freight from trucking to rail, which would reduce fuel consumption by roughly 70%.
Hi and thanks!
The sentence has been revised.
It is not clear if this decline is all due to efficiency gains.
Ah. That's better.
Now, I recognize that you're just asking the question - I presume you didn't have the time to do the analysis to answer that question, and that's perfectly understandable.
Still, I would argue that efficiency and substitution are indeed the most important factors - much more so than "affordability". Until you have data, I would reduce the emphasis on the speculation about economic interactions.
So much to do and so little time.
Look in figure 6 at the decline in petroleum consumption for Italy over the recent 2 years.
Substitution appears to have happened where possible. Natural gas substituting heating oil. More cheap coal has recently and in some countries been used in stead of "expensive" natural gas. North America is presently blessed with cheap natural gas.
The energy markets are now very dynamic.
I have covered some of these themes in detail on my Norwegian blog, Fractional Flow.
Huge spike in solar installs in Italy recently too.
Here's the first comment, reformatted:
German Oil Consumption
A comparison of 2000 and 2012: Jetfuel use increased from 4.3 to 5.2 million tons, Diesel from 25.9 to 31.3, Gas (road gas) decreased from 25.6 to 20.4, Heating oil decreased from 36.9 to 27.4 million tons, the total oil use from 115.9 to 104.4. Where as the volume of goods transported into and in Germany all went up: seafreight from 278 million tons in 2000 to 295 in 2012, railfreight from 300 to 365, airfreight from 2.2 to 4.3 and roadfreight from 2720 to 2891 million tons.
German oil consumption decreased by about 10% over the 12 years from 2000. Nearly all of the reduction is accountable for by the reduced heating oil consumption, with minor contributions from the chemical industry. There is a shift from gas to diesel, caused by passenger cars switching to diesel. I could not find a statistic for passenger miles driven, but I think they have been largely stagnant in the last years. And yes the German economy has grown despite reducing oil consumption. My hunch is that once efficiency gains in roomheating have been maxed out, the next thing to go will be leisurely air travel.
(The original has a link, which I dropped to avoid moderation problems.)
Of the reduced oil consumption 0.7% is caused by the reduced demand for heatinmg oil. Oil heaters are in around 30% of the existing German houses, but only in 1% of the new buildings. In existing buildings, oil heating are often replaced with gas heating when replacement is due.
The demand for heating oil drops 3% per year, so we are running out of saving opportunities quite fast in this field when we use absolute amounts.
The sad part is, that only 0.3% of the reduced oil consumption comes from transport, there we see a stagnating demand (with more miles driven). As EVs in Germany still stink I do not expect a change as long is the economy is humming and people think they can afford oil.
Good data in German are found on this site: http://www.energycomment.de/
A nice picture for the German demand 1995-2012: http://www.energycomment.de/olverbrauch-deutschland-1995-2012/
As the inserted texts indicate, the consumption of heating oil was reduced by almost 50%, while the rest was only reduced by 5%.
Jet fuel -Flugturbinenkraftstoff in the pic- is in Germany not the real problem and has IMHO limited saving potential, car fuel is the corpse in (in front of) the closet. :-)
As a general observation I am becoming suspect of nationally based analysis of the effects of changing efficiency vs growth as being a truly independent data set that can be viewed in isolation. Especially in the eurozone. We do not understand the relationships between the various economies to be clear where and how growth or cost is playing out. Growth in the northern eurozone may actually be a symptom of shrinking EROI! in general and the asymmetry between the financial sectors based in the north vs the Mediterranean countries. It is very complicated. In the end debate does appear to be intuition based.
The analysis of effort in the Bakken and the various different forecasts strikes me as fairly robust piece of work and its conclusions somewhat unsurprising except maybe in timing.
I see some of your issues, too. However, the beauty of a developement, that spans 1995-2012, i.e. a time in which Germany operated in quite different economic modes and business environments, is that some factors are avaraged out and "true" trends should dominate. As we have good data on fuel consumption, heating systems etc. the task is not so complex in my opinion. In addition, Germany has a export surplus for industrial products and a positive trade balance in all these years. So where could we hide stuff?
Growth: Here I simply look at industrial production and workforce participation, number of housholds etc. I am not an econoimist and do not like the uncritical GDP approach.
Could you please elaborate your statement "Growth in the northern eurozone may actually be a symptom of shrinking EROI".
an example.
The tendency to promote growth with QE in the united kingdom has lead to some rather unusual correlations between economic markers. Unemployment has fallen with a usual correlation to [somewhat anemic] growth, however this has also come at a time when there is a measurable drop in productivity.
If anything falling unemployment is a bad thing to be happening from a BAU status.... I think this sort of thing lacks precedents in recent history. No one seems to have any answers
If the Bakken oil production is to grow by 1 million barrels per day then the railroad capacity to haul that oil must grow. Since Keystone pipeline will have capacity for mostly Canadian oil, this new production will have to move by rail. Lets look at the capex required:
1mm bbl per day will fill 1500 tank cars per day. Because the turn around time to an east coast or southeast refinery is about 10 days (including loading/unloading time) 15000 tank cars will be required. The cost for these new tank cars, built to the latest DOT standards, is about $200,000 each. So, the railcars cost about $3.1 billion. Each train of 100 cars requires 3 locomotives, including spares, so 455 new locomotives are required at a cost of $3,500,000 each totaling $1.6 billion. Now add in some infrastructure costs since some of the tracks in ND, MN, and IL are at capacity, figure $0.5 to $1.0 in track, signals, equipment maintenance facilities.
Thus the railroad's investment will need to be at least $5-6 billion in the next 3 years to handle this increase in oil production. AFAIK this capex is not in the US railroad's plans.
mbnewtrain,
Your comment is very perceptive and important.
A 30” diameter pipeline would have the capacity to carry 300+ kb/d. (back of the envelope estimate).
I have no data on how much it would cost to build such a pipeline that could serve/deliver at suitable refineries.
Is there any way to get hard (meaning good enough for the purpose) data on how much a tank car (700 - 750 bls capacity?) costs? And further prices for suitable locomotives and if possible rough estimates for other required additions to the system.
Adding OPEX data it would be a good demonstration about the cost differences for these transport alternatives (pipeline versus rail).
I have the data, but not at my fingertips.
New locos in 2015 will cost more to buy & operate with new pollution requirements.
An interesting cost is additional wear & tear on the track. North American axle loads are above the cold deformation limits of steel. AFAIK, not all of the rail lines out from the Dakotas have been "ruggedized" (CP was in the middle of this for DME railroad they bought). BNSF has been investing more than any other railroad.
The CN track south to New Orleans was in bad shape - which they are improving - but still not premier quality. Which is what is needed for high volume, high axle load trains.
Alan
Very good article, it covers a lot of ground and leaves Maugeri in the dust.
If the energy companies are unwilling to spend on pipelines they indicate by way of their actions the future of Bakken energy extraction.
Don't forget the US$1 billion in natural gas flared in North Dakota last year ...
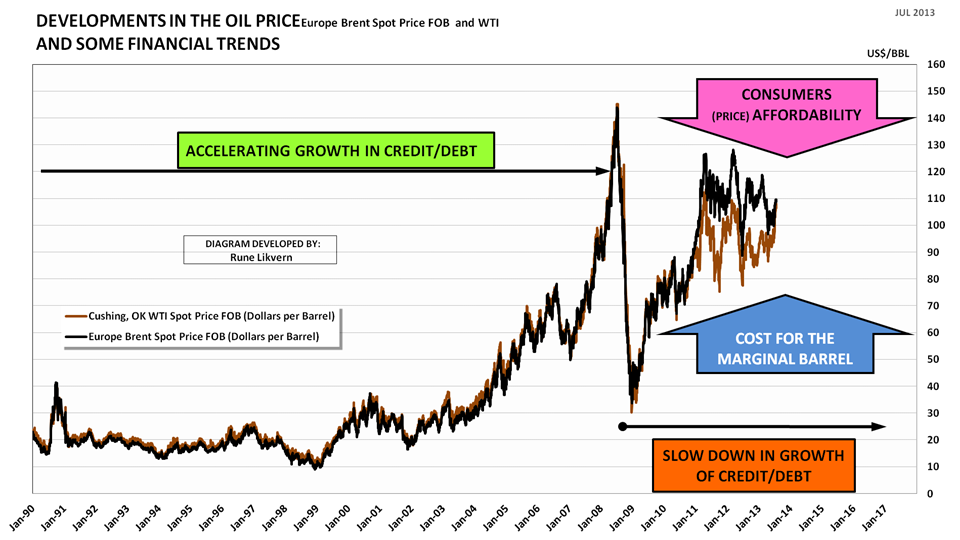
Meanwhile, it is good to see that Rune Likvern has discovered The Triangle of Doom:
The maximum price customers can afford to pay for fuel decreases while the price required to bring crude to market continuously increases. The current price at any given time is too high, firms fail and customers are left with diminished discretionary income. At the same time, the current price is too low to allow drillers to complete the increasing numbers of wells in difficult areas that are needed to keep pace with demand- plus depletion in older wells.
High prices strand consumption infrastructure. Low prices strand the drillers … When prices are ‘low’, the high priced reserves become unavailable. At some near point in the future both the too high- and the too low prices will be the same … then it’s game over. From the chart it looks to be about two years in the future …
Here is the updated chart:
(click on for big)
High prices are self-adjusting for the hapless customers, the outcome is 'conservation by other means'. Adjustments by customers de-funds drillers who rely on their being able to borrow against customer accounts. Keep in mind, shortages caused by unaffordability are permanent as customers reasonably cannot afford more goods in the future as they constantly become poorer.
Think, 'Detroit', a city bankrupted by $20/barrel crude. How will Detroiters now afford + $100 crude? USA = Detroit ... the country just won't admit it.
I'm really puzzled by this "triangle of doom" thing. It seems completely detached from reality.
Oil just isn't that essential: if the prices rises too much, freight can move to rail, then electric rail; personal transport can move to mass transit, carpooling, natural gas or hybrid electrics, then to PHEVs, then to EVs and rail; space heating can go to heat pumps; the *small* percentage of remaining applications can go to synthetic fuel and biofuel.
Germany, for example, has relatively few people who can't afford oil - it's more a matter of choosing not to use it because something else is a better value. Another example: the average Prius buyer in the US is more affluent than average: they buy something more efficient because they want to, not because they have to.
Oil doesn't become unaffordable at a certain price, it just becomes overpriced compared to the (often better) alternatives. Of course, if you price in pollution and security, oil is already way too expensive - we should transition away from it ASAP.
Oil is 35% of all primary energy used by industrial society. It's also the most energy dense, portable and convenient to use. Quite simply, all the other energy sources do not add up, we end up spending more and more energy and resources producing the energy and we have less left over for everything else. Most PHEVs and wind turbines and all the other high tech solutions require large capital and resource investment up front. That limits the rate that they can be built without crippling the rest of the economy, and makes them uneconomic whilst cheap oil is available. Once cheap oil is not available, they would be economically competitive, but the higher cost of oil drives up the real cost of building the alternatives. Receding horizons. Unless the alternatives are heavily subsidized, or oil is heavily taed, then the economy will hit a brick wall.
Well, no, not really. Let's take that one at a time:
Oil is 35% of all primary energy used by industrial society.
Sure, but that doesn't make it that hard to replace, partly because we use it very, very inefficiently. The US could replace all of it's personal transportation (50% of all oil consumption) by expanding electrical generation by less than 20%. Over 20 years, that's nothing.
the most energy dense, portable and convenient to use.
Well, not as energy dense as nuclear - look how popular nuclear is right now.
Density and portability are important for a *small* portion of use: aviation, seasonal ag, long distance water shipping. That can be replaced with synthetic and biofuel.
Or..not. If we have to use battery powered prop planes and ships, and swappable batteries in our combines, we will.
all the other energy sources do not add up
And, why do you think so? It's really not so.
we end up spending more and more energy and resources producing the energy and we have less left over for everything else.
No. Wind, especially, has an EROEI of 50:1. It's actually cheaper than new coal in most places. Solar is very often cheaper than peaking gas generators.
Most PHEVs and wind turbines and all the other high tech solutions require large capital and resource investment up front.
Nah. You should look at how much we spend on fossil fuel investments, maintenance, security, etc. Renewables are cheaper right now. A Prius (or a Leaf) is cheaper than the average new car.
the higher cost of oil drives up the real cost of building the alternatives. Receding horizons.
Wind, solar, PHEVs/EVs keep getting cheaper, even as oil gets more expensive. That's partly because wind and solar have high EROEIs, and partly because manufacturing really doesn't use much oil.
No, the only real barriers to transitioning away from oil are political: people whose investments and careers tied to FF are fighting alternatives desperately.
We really shouldn't help them by saying "drill, baby, drill". Right?
I think the notion oil isn't that essential is a bit of a reach even if it's true. We simply do not know how FF substitution is going to pan out. And it will simply through depletion. It has to. Essential for what? It gets to be a very soft debate because the definitional terms break down pretty fast. If I put my doomer goggles on the essential element is the nebulous relationship between energy density and the financial system underpinning economic and socio-political stability. A low energy per capita world is not that difficult to achieve [I can do it real fast just give me the button] the problem is as you point out is political. And there is the rub because the interconnectivity between political stances and the investment in rationality is not in any way a guaranteed smooth transition especially evident in the attitudes towards the return on resources such as shale.
Now if the idea it automatically shoehorns itself in through the power of the markets then I think you may be somewhat naive. mainly because the problem doesn't stop at the US boarder.
When you need to consider that a lot of things like aviation, maritime, and long-haul trucking are going to be oil-based not EVs. You just can't do that stuff with EVs.
And even with EVs building up market share, we will be stuck with the cars and trucks that we have purchased for their useful lives. If gasoline hits $8/gallon everyone is just not going to park their SUV and go buy an EV. They cannot afford to do so. Most of those vehicles are financed. They can't just walk away from them and buy something new. (Although many probably will try.)
a lot of things like aviation, maritime, and long-haul trucking are going to be oil-based not EVs
Sure. But aviation and maritime are a pretty small percentage of overall oil consumption, and they can be reduced further significantly with improved efficiency (and use of wind and solar, for maritime). Long haul trucking is also not nearly as big as personal transportation, and it can convert to rail and NG. Rail is less convenient for some things that now go by truck, but there's very little long-haul trucking that can't be containerized and go by rail. Local trucking, of course, can be EV pretty easily.
we will be stuck with the cars and trucks that we have purchased for their useful lives
Yeah, but oil production isn't going to decline overnight, and vehicles less than 6 years old account for 50% of VMT. Gasoline isn't going to hit $8 any time soon, unless the Persian Gulf goes up in major war.
And, don't forget, carpooling is bigger than mass transit in the US. With smart phones, carpooling could be expanded dramatically. How many highways don't have HOV lanes now, but could?
You have to ask - what timeframe are we talking about? The chart that started this discussion predicted that the world's economy would collapse by...wait for it...the end of 2012. Really, it will be at least 30 years before oil production falls by as much as 50% (if oil prices stay where they are now). That's a lot of time for adaptation.
Don't get me wrong - I think oil is way too expensive right now, what with the cost of oil wars and pollution - I think we should phase it out ASAP! But PO isn't going to cause TEOTWAWKI, as described by that chart.
People will find out soon enough how well they can do without oil ... Doing without even the smallest marginal amounts of oil has been very destructive, this has been illustrated over and over.
Germany is only one country in a world full of countries. Germany succeeded because it has been in the past been able to lodge claims against -- and shed inefficiencies to -- its overseas trading partners (as have the Americans). Now, Germany's trading partners, particularly in Europe, are bankrupt. What does Germany do next? It can sell luxury automobiles to the Martians, perhaps.
The world is not filled with rich people who can sit back and choose between the Ferrari and the Prius. When people are forced to choose it is usually too late -- they are in a position where there are no more choices. The vast majority of the human race is excluded from American-style automotive luxury, that is why there are wars and upheaval in Syria, Libya, Egypt and Yemen. The young people in these countries are desperate to drive, they face machine guns to be able to do so.
Why is Europe bankrupt? Because Germany's products -- luxury automobiles -- do not produce value -- or even worth -- for the overseas' customers. To buy and use the cars, the new owners must go deeply into debt, even while they pretend that they have some sort of elevated social status that is associated with the cars. Going into debt means customers are borrowing from London city banks or Wall Street, washed through German banks Without value return, the customers cannot repay the loans and the entire banking system teeters on the brink ...
That's the word that matters: jeopardy not efficiency. What is missing is the sense of urgency which is real.
Doing without even the smallest marginal amounts of oil has been very destructive, this has been illustrated over and over.
What are you thinking of? I'd say WWII is the best example of countries being suddenly deprived of oil - Germany would have done pretty well if the US hadn't bombed the **** out of it's CTL plants.
Japan, of course, didn't have time or resources to find substitutes, but that just tells us that sometimes major transitions need a little more time than a year or two.
Germany succeeded because it has been in the past been able to lodge claims against -- and shed inefficiencies to -- its overseas trading partners
Germany is still doing pretty well. Could you expand on this - I don't understand. I'd agree that the Euro hasn't worked out very well for some of Europe - history has shown pretty well that fixing exchanged rates (and you don't get more fixed than the Euro) is a recipe for disaster, if you don't integrate the countries far more closely than the EU has (financial and benefit policies have to be synchronized).
The world is not filled with rich people who can sit back and choose between the Ferrari and the Prius.
Well, actually, it kind've is. The average new car in the US is more expensive than a Prius.
Let me say it again: the Prius, and the Nissan Leaf, are both less expensive than the average new car.
Hybrids and EVs are very, very affordable.
Doing without the smallest marginal amount: the 1973 Arab Oil Embargo, The Iran-Iraq War, the Tanker War, the loss of oil subsidy in the Eastern Bloc and Cuba after the USSR government failed. Cuba lost only 20% of its supply and the country's economy collapsed, it was only saved by oil shipments from Chavez-Venezuela.
As for WWII, had the Germans held on another 3 months the first atomic bomb would have fallen on Berlin or Munich rather than Hiroshima. As it was, both the Axis powers were destroyed on the battlefield -- Germany in Africa, Russia and France and Japan in the Western Pacific -- supply substitutions would hot have helped them, only prolonged the agony.
Firms can borrow (and lodge costs) against their own accounts, against the accounts of their customers, against the accounts of the State (by way of currency, tax advantages and direct subsidy) and against foreign exchange. Exporters gain by the loss of their overseas' trading partners, that is, the costs associated with their goods is exported along with the goods themselves. If this was not so, there would be no point to exporting anything.
Exporters 'get rich' by way of customers' credit as well as by the gain in foreign exchange. That is how the Chinese can afford to build thousands of gigantic empty office- and apartment buildings, for Korea, Taiwan and Japan to industrialize without native resources. In 2013, there is nobody remaining to lodge costs against ... this is the 'success' of globalism, to gain the world's wealth and smear the exporters' costs. The US exports credit which allows manufacturers to borrow, which in turn gives US banks ascendency and allows this country to import fuel ... to trade 'empty promises' for it.
If you look at Europe this way -- the exchange of empty promises for fuel resources -- it makes sense what the EU bosses are doing to their own subjects in Greece, Portugal, Ireland and elsewhere: giving the empty promises (brutal) form and substance. Otherwise, the Europeans have nothing to export but fuel waste, which is what they export now ... which is also why Europe is bankrupt! It is a victim of its own success: waste is not a return nor does it earn one.
Substitution is not a panacea because what is being substituted is not materially different from what is being substituted for. A car is a car, with any of them only the smallest amount of fuel energy actually moves the car while the rest is lost to friction and transmission 'costs'. Electric cars the fuel is coal as opposed to petrol cars but there is always fuel and always associated costs. Any gain in the internal thermodynamics is lost by the gross increase of cars everywhere: a German car is as wasteful or more so than a Korean or Iranian car ... cars in China are not efficient at the same time there is massive increase in the number of Chinese cars.
There are two reason EV's appear cheaper: a) EV's are internally subsidized by makers by the sale of larger, more profitable vehicles such as SUVs and pickup trucks, b) there isn't much demand for EV's so the material requirements are very modest. To make 900 million EV's would require massively more battery materials, lead, tin, copper; much more motor making- and grid capacity, electric power stations, sub-stations, power transformers (which cost millions apiece and are made by hand one-at-a-time) plus maintenance for the new, expanded electric supply. There would need to be more coal mined, more reactors, more gas turbines and more construction and fuel transport infrastructure. Meanwhile, the old ICE vehicles would be operable until they fell apart continuing petroleum demand; not to mention the millions of miles of necessary new roads and machines to make and repair them, plus the factories to make all of the things listed above ... none of which run on batteries and solar panels.
For the world as a whole to 'enjoy' modest economic growth, the total of the world's car population must double to almost 2 billion in 20 years. Economies must grow b/c managers promise growth or nothing; they become discredited if the narrative falters. Where will the 2 billion vehicles operate? Every aspect of 'car world' would have to double as well unless 'car' becomes a word that means 'bicycle'.
At the bottom, driving in circles is a pointless exercise. Only the smallest fraction of driving is remunerative, it is a leisure time activity. The enterprise is entirely supported by unaffordable debt. Even if 2 billion is physically possible, there is no credit for it because there is no possible hope for return.
Rune Likvern's 'Figure 7' says much the same thing as the 'Triangle of Doom' which leaves out the credit component other than to observe that people in the world are getting poorer. Wealth is debt, when one cannot (or will not) borrow, they are poor (or effectively poor). The price/affordability convergence has been noted by Charles A.S. Hall, Steve Kopits, Chris Nelder, Gregor Macdonald and now Likvern. It's not hard to figure out, the conclusion offered by it is not pleasant as it indicates time to make fundamental changes has pretty much run out.
Have you seen a good description of the USSR subsidies of Cuba? As far as I can tell, the USSR provided almost all of Cuba's oil at very low subsidized prices, and bought it's sugar at greatly inflated prices.
Then they discontinued both subsidies, pretty much 100%, in a short time. Does that sound correct?
Firms can borrow (and lodge costs) against their own accounts, against the accounts of their customers, against the accounts of the State (by way of currency, tax advantages and direct subsidy) and against foreign exchange.
That doesn't make sense to me - why would anyone borrow against their own account? Wouldn'it borrowing against their customer's accounts be embezzlement? Are you talking about banks reinvsting deposits??
Exporters gain by the loss of their overseas' trading partners, that is, the costs associated with their goods is exported along with the goods themselves. If this was not so, there would be no point to exporting anything.
I'm not sure what you mean. Exporters gain by selling things of value to their customers. google "comparative advantage"
Exporters 'get rich' by way of customers' credit as well as by the gain in foreign exchange.
What the heck do you mean? Could you give more detail? Again, AFAIK exporters "add value" - they import raw materials or parts and turn them into something more valuable to their customers.
Electric cars the fuel is coal as opposed to petrol cars but there is always fuel and always associated costs.
No. The fuel is many things, and increasingly it's wind and solar power.
cars in China are not efficient at the same time there is massive increase in the number of Chinese cars.
There are more electric vehicles (e-bikes) sold in China than ICE vehicles.
There are two reason EV's appear cheaper:
This reverses the reality: as EVs are produced in greater numbers, economies of scale will reduce costs. As is common with new products, some manufacturers price their products at the price that will be profitable once those economies are realized.
factories to make all of the things listed above ... none of which run on batteries and solar panels.
Factories run just fine on wind and solar power.
For the world as a whole to 'enjoy' modest economic growth, the total of the world's car population must double to almost 2 billion in 20 years
No. US car sales have been stagnant since the 1970's, in a period in which US GDP rose by 2.5 times. Now, developing countries do indeed want more cars, but they could, in theory, choose better quality goods, and more services, as the OECD is doing. It's not likely, but the point is, there's nothing magical about car's contribution to GDP.
people in the world are getting poorer.
No, they're not. GDP and wealtha are growing everywhere.
Wealth is debt
??? Wealth is real: land, resources, intellectual property, human capital, productive capability for both goods and services.
The price/affordability convergence has been noted by Charles A.S. Hall, Steve Kopits, Chris Nelder, Gregor Macdonald and now Likvern.
Just because some PO writers like it doesn't make it real. It's largely misleading.
More later...
Have you seen a good description of the USSR subsidies of Cuba?
When the Soviet regime broke down Cubans had to sell their sugar, rum, tobacco products and brainpower on the world market. They also could count on remittances from Cubans overseas including in the US. This left them about 20% below what they needed, however fuel was cheap at the time .. -$20/barrel. Ultimately, Chavez began to sell the Cubans subsidized fuel. I've seen several films about Cuba during that period: the Cubans had to scramble to gain food for themselves: their large, ag complexes were useless without fuel and chemicals.
Firms can borrow (and lodge costs) against their own accounts, against the accounts of their customers, against the accounts of the State (by way of currency, tax advantages and direct subsidy) and against foreign exchange.
If you borrow from your bank you are borrowing against your own account. If you sell a house the buyer obtains a mortgage ... the loan proceeds are paid to you: you are borrowing against your customer's account. If your company sells a car or an iPad ... the customer borrows from the auto lender or credit card company. The proceeds are paid to your company ... which is borrowing against your customers' accounts.
When you are paid at work it is your boss' company borrowing from its customers ... you are borrowing against your company's customers' accounts ... so are the customers against their bosses' customers. All payment regimes are daisy-chains of loans, billions of them. This is why the world is in debt in the amounts of hundreds of trillions US dollars.
Governments can borrow at will, the proceeds are sent to you by way of any number of transmission channels, for any number of purposes; you are borrowing against the account of the state.
If you are a Chinese manufacturer who sells a billion US dollars worth of poisoned dog food you can swap the billion you have gained to the PBoC which will lend back -- out of thin air -- one billion dollars worth of Chinese currency. China now has doubled its money, it or its citizens (you) hold both the original billion and the additional Chinese billion: you have just borrowed against foreign exchange (this is how China and other mercantile state become rich literally overnight).
Exporters gain by the loss of their overseas' trading partners, that is, the costs associated with their goods is exported along with the goods themselves. If this was not so, there would be no point to exporting anything.
Every item, every good carries costs: A person buying the car has to pay for the expenses of making the car (as well as all those associated with operating it). If the car maker couldn't 'sell' its costs, it would go out of business. If costs could not be shifted to others the economy would not function ... which is the big reason why the current economy does not function: difficulties in shifting rapidly ballooning energy-related costs.
As for the gains in customer credit and foreign exchange, see above. Debt -- unsecured debt -- is how economies expand, there is no other reason.
Electric cars the fuel is coal ... The fuel is many things, and increasingly it's wind and solar power.
About 3% and that is for low-hanging fruit. BTW: e-bikes are not cars. Market for EVs has been and is marginal. Economies of scale cannot take root when demand for the vehicles is marginal, there is no solution to the resource problem associated with batteries, grid, fuel supply, infrastructure, etc. The problem with ALL industries is that they are loss-making and require constant debt subsidy. Even if materials for batteries can be had, the credit to make use of them cannot.
There's nothing magical about car's contribution to GDP ...
... other than the fact that it is the world's largest industry. That leaves out the auto dependencies such as FIRE, military, fuel supply and distribution, advertising, heavy construction, house-building, chain retail, etc all of which altogether make up 70%+ of world GDP.
Because driving a car does not earn, the costs must be met with debts x hundreds of millions of cars. Electric or powered with rubber bands, cars are loss-makers. Without debt there can be no cars or car business.
Wealth is a surplus of money, having other surpluses is fine but modern wealth is having lots of money ... not having a lot of land. Money = debt. It is a manufactured good like paint or toilet paper. Non-renewable resources are capital: money is the residue of destroyed capital. As such, money has no value, it is anti-value.. Money capital is laundered debts (retained earnings is a form of fraud). All industries are debt-dependencies: the greater the scale, the greater the debt subsidy. This is why all industries fail: necessary subsidies cost too much. Tycoons become rich by borrowing immense amounts and forcing others like yourself to repay the loans.
People in the world are indeed getting poorer otherwise there would be no ongoing economic crisis! How can there be a crisis if there is increasing wealth? This is basic observational logic -- common sense, Anything else is Forbes' propaganda or some other such nonsense.
For the same reason -- increasing poverty -- the convergence is real. It is obvious to anyone paying attention. Every day there is more crisis in all kinds of countries even resource exporters (Brazil), mercantile powerhouses (China and Japan), OECD (Spain, Italy, Greece) ... crisis in every part of the world especially, the US. People in these countries have access to less in the way of goods and services and the access diminishes steadily every day.
Don't listen to me ... just watch. Just don't get run over ... :)
Actually, after the tax-credit is considered, the Prius, plug-in Prius, Nissan Leaf, Chevy Volt, Chevy Spark EV, Fiat 500e, Smart ED, Honda Fit EV, Mitsubishi-i EV, and Ford Focus EV are ALL less than the price of an average new car (around $30K). People can get off gasoline if they want to now. Yes, if you get pure EV there are range issues but keeping your old gasser or rent/borrow/carshare a gasser for longer trips can handle that. Or buy the Volt PHEV.
EVs are now available for reasonable prices. People that whine about high gas prices will no longer get any sympathy from me. They should take some personal responsibility for the issue.
Well . . . you are assuming rational American consumers. I think a lot of people are going to stick with their F-150s and Escalades until they are repossessed. Just read some comments on Yahoo! news stories about cars. You'll have lots of lugheads saying that they'd rather be dead than drive a Prius or that only women and 'homos' drive a Prius.
Some bad decisions will snowball into repossessions, bankruptcies, foreclosures, etc.
Let's assume that Texas + North Dakota averages about 3.3 mbpd for 2013 (C+C). And let's also assume that, because of the very high percentage of Texas + North Dakota production coming from tight/shale plays that the overall decline rate from existing oil wells in these two states is about 20%/year (I'm guessing about 10%/year overall for total US).
Based on the above assumptions, in order to maintain a constant production rate of 3.3 mbpd for six years, through 2019, Texas & North Dakota would have to put on line new production of about 4 mbpd over the next six years. Or, over a period of six years, in round numbers the industry would have to replace the current productive equivalent of every oil field in Texas and put on line the current productive equivalent of about two North Dakotas.
Incidentally, I estimate that the 2008 to 2013 rate of increase in Texas + North Dakota's C+C production is about 20%/year. This is actually below the rate of increase that Alaska showed from 1976 to 1985 (26%/year). But because Peaks Happen, the inevitable happened and the rate of increase in Alaskan production slowed, and then they started declining in 1989, resulting in the "Undulating Decline" pattern that we have (so far at least) seen in US crude oil production since 1970.