Horizontal and Vertical Well Production
Posted by Heading Out on January 18, 2007 - 10:15am
This post, in a way, is in homage to Connections, which I have just started to watch. I noted today that Leanan had posted that Matt Simmons is giving a talk at UCSB tonight, and I suggested to the Engineer that he might go downstairs and listen. (His report – among other things that the room was too small, but also that Matt did say that we at TOD do “an excellent job” – why thank you, kind sir).
And then I got a bit more curious about the program and found that there is a Conference coming up there on February 9-10 dealing with the need to transition from carbon fuels to renewables. While the current program looks fairly interesting, it is the second in the series. And so I went back to see what they had on the program last year. And there I found a paper on Natural Gas by Chris McGill, from which I took the following graph.
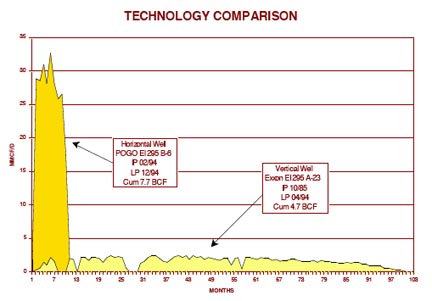
This is the first time that I have seen a comparison of relative production rates between horizontal and vertical wells that were relatively close, so I thought I would pass it on. More under the fold.
One of the topics that has been a matter of some considerable debate on these pages, is the relative changes in well performance when the more advanced technology of horizontal well drilling is used, rather than more conventional extraction using vertical wells. Aramco have noted the considerable increase in relative production rates, which, as they showed in the presentation to CSIS can be raised from perhaps 600 bd from a single vertical well, through 3,000 bd for a normal horizontal well, to some 10,000 bd with the newer maximum reservoir contact wells. To borrow one of their pictures, that shows this:
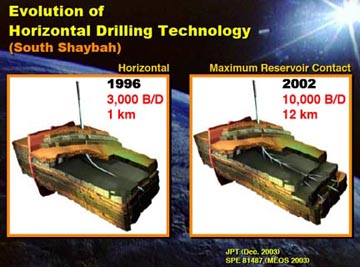
Now this is the positive side of the coin. By using an increased distribution of well laterals out from the main flow (and subsequently adding valves along the line) Aramco have been able to considerably increase the short-term production from a field, using a limited number of wells.
However, the question has to be, for how long can that production be sustained, given that there is only a limited quantity of fuel down there? And do you get the same amount of oil out in both cases? The plot from Chris McGill would seem to suggest that it might be possible to double the amount of oil coming from an individual well (though it might beg the question as to whether the company might otherwise have sunk two wells rather than one). But it also shows the dramatically shorter life at the higher production rate, in this case (bearing in mind it is a gas well) from almost 100 months of production down to 10.
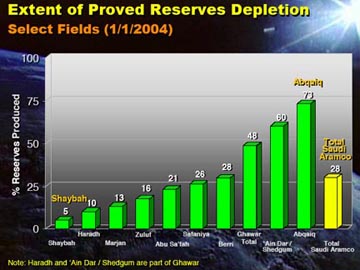
This would probably be a good place to stop, except that there continues to be debate as to the amount of recoverable oil in the different fields within Saudi Arabia, so I thought I would also post the figures that Aramco gave at the CSIS presentation, since a number of you may not have seen them.
And the Connections twist? Well James Burke always seemed to start with one thing, wander around a whole host of related topics that all led back, in the end to the same thing. And so, if Matt Simmons had not challenged Saudi Aramco, then they would not have produced the above graphs, which would not have led me to wonder about the change in well lifetimes, which would not have got me interested in the UCSB site and the fact that Matt happened to be talking there tonight.
(Yeah, I know - I should probably go back to reading books!)
Contact
- Content: editors at theoildrum dot com
- Tech support: support at theoildrum dot com
License

This work is licensed under a Creative Commons Attribution-Share Alike 3.0 United States License.
The graph near the end supports Westexas's contention that the Ghawar bottle could be half empty by now (or more).
But it doesn't support his contention that that is a very big deal. As Ghawar goes, so goes Saudi, so goes the world, we are continuously told.
The Saudis obviously have big expectations for those other fields if they are in fact claiming with a straight face only 28% reserve produced for all their fields.
So, the real question might not be the status of Ghawar.
Maybe the learned among us should be holding forth on those other fields.
And the unlearned.
They usually don't need to be asked. :-)
And maybe the learned among us can explain why the price of a barrel of oil is dropping into the 40s. Did the Peak Oil theory peak?
It bounced off of 50 pretty hard today. Today was options expiration so it had every chance to break 50 and it didnt.
Remember, there is no FUNDAMENTAL reason for oil at $50, or $80 or $20 or $1000. It all has to do with immediate supply and demand. Recently, due to warm weather, there has been plenty of current supply. And as PG pointed out in a post last week - Goldman Sachs reweighted their GSCI index which many pension funds are linked to so there was a spate of futures selling. Personally I think its overdone and we are due for a pretty quick $5-$10 rally. But the only thing Im VERY confident in (barring a world war or bird flu) is that we will be significantly higher in price 5 years hence.
By the way - the back months (2012 is what I watch) did not break the lows of two months ago whereas the front months are more than $10 below those levels.
By the way - the back months (2012 is what I watch) did not break the lows of two months ago whereas the front months are more than $10 below those levels.
I'm glad you pointed that out. For quite a while there, those back months exhibited backwardation. Contango for the front months.
Now we have contango all along the curve.
If prices rise with that contango intact, chaulk one up for peak oil.
A.
There are thousands (millions) of traders who try to explain price every day. Its the same for currencies, stocks, bonds and commodities. Explanations are most always poor.
During the oil price rises since 2003, the biggest "fundamental" reason for price rise had nothing to do with peak oil. Demand was increasing. Supply was also increasing, but capacity was not. What does Peak Oil have to do with it?
Once supply really begins to FALL more than one year in a row at ca. 4% will price be a "result" of Peak Oil. This could be next year. This could be 2012.
Peak: As WT advises, world exports are more important, fundamentally, to the oil price than supply. A lot of countries (e.g. KSA, Venezeula) are subsidizing internal consumption.
Right, at least at the moment that's true. But why not just call internal consumtion demand, even if it is subsidized (Iran, too btw.)? Again, it's still not "peak" right now which "dictating" prices. Right now we can still blame China...
Peak: Interesting enough, in light of the crash in oil prices is that if you look at the eia website their Saudi analysis as of August 2005 projects Saudi exports for 2007 approximately 40% higher than current. As of August 2005 they projected current (2007) Saudi production to be 11.5.
Why is it that we resent "our factories" which make "our products" paid for with "our debt" using "our oil?" Is it because some of the people who work in our factories would like to drive to work? Are they forgetting their place and getting too uppity?
If we don't want China to work for us all we have to do is boycott WalMark, KMart, Target, Best Buy, Home Depot, et al. Then China will stop using "our oil."
But since China is way more cost efficient using "our oil" (despite rumors claiming the opposite, the Chinese factory worker still does not drive an SUV), the Walmarts of this world are the cheapest source of high quality goods (oh, well... medium quality goods). Joe Average can not afford to buy the same products from American or European manufacturers.
Their labor costs are lower. In terms of efficiency using energy that is a totally different issue, and I suspect on the whole their energy efficiency is generally worse.
Higher energy use per unit of GDP *but*
that is normal. Poorer countries have lower GDP but also do more things with that GDP that require relatively more energy.
(example: Healthcare is 1/6th of the US economy, and relatively low energy intensity. It is a much smaller proportion of the Chinese or the Indian economy).
The question is whether the Chinese use 'best practice' on technology ie where the 2 economies are comparable, are they using as modern technology as the US?
In the typical exporting factory I would say yes. In terms of technology and productivity, the Chinese are up there with the best of them.
In the economy as a whole (including transport, power generation, domestic manufacturing, farming etc.) I would say no. For example their typical design of passenger car seems to be about 10 years behind the US.
One complication in the Chinese economy is that because they don't have a full market economy, the prices of energy may be distortedly low. This would seem to be particularly the case with electric power, but to a lesser extent with gasoline.
"And maybe the learned among us can explain why the price of a barrel of oil is dropping into the 40s. Did the Peak Oil theory peak?"
I have suspicions that it is like the mid-80's when they conspired (Bush I/Reagan/KSA) to "Pump like mad" to drop the price to the floor and bankrupt Russia. (that and getting Canada and others to drop the price of gold by selling bullion) Those two things were the ways that Russia at the time got it's hard currency. Their production price I heard was more than the market price for Oil, and I believe it went a long way to bankrupt them.
Now too, we hear that the current price drop is hurting Iran finanically. Hmm.
History might rhyme with the present tune.
Or
I could be totally wrong.
John
That would be nice!
"I could be totally wrong."
At least you have the learning to admit that yourself being wrong is a very likely possibility. I draw my hat before you, Sir.
It is far more likely that the US would never ask KSA to manipulate prices any other way than they decide to themselves because the diplomatic response to such a request would simply be roaring laughter. And even Condi Rice has limits to how much humiliation she can take (albeit they must be very, very low these days). I do understand, though, that Americans have to develop all kinds of conspiracy theories to make themselves believe that not they but someone else gets taken to the cleaners by OPEC and the rest of the oil producing countries. It is, after all, quite devastating to realize that one is the laughing stock of most of the world...
:-)
Well, you can't know anything with 100% certainty (in a philosophical sense) but we are getting into the 70% or so certainty range.
The NY Times reported on 12.23.06:
"A member of the Saudi royal family with knowledge of the discussions between Mr. Cheney and King Abdullah said the king had presented Mr. Cheney with a plan to raise oil production to force down the price, in hopes of causing economic turmoil for Iran without becoming directly involved in a confrontation."
http://www.nytimes.com/2006/12/22/world/middleeast/22saudi.html?pagewant...
... or "history might rhyme with present time".
(double post)
I don't buy the whole KSA wanting to bankrupt Iran. That's basically somewhere between speculation and a rumor and probably closer to a rumor (least credibility). KSA needs the money nearly as much as Iran does. Saudi Arabia is facing a massive population explosion, and massive unemployment among the younger generation. They really can't afford to forego money that would better be spent on development for short term political grandstanding. That isn't to say their leadership won't make mistakes, but if they are smart in the long run they should fear their own populace a lot more than they fear Iran.
Nagorak writes - "I don't buy the whole KSA wanting to bankrupt Iran. That's basically somewhere between speculation and a rumor and probably closer to a rumor (least credibility)."
It's pretty much accepted that KSA (Sunni) and Iran (Shia) both want to diminish each other's prominence in the world. We should remember that the more fervent adherents of these two parties hate each other more than they hate America.
There have been numerous other media articles on this subject. Web search around for them.
I was surprised to learn that about 80% of Shia are known as "Twelevers". Essentially they are messianic and awaiting the 12th Imām to return.
See - http://en.wikipedia.org/wiki/Twelvers
"Ithnāˤashariyya) are those Shiˤa Muslims who believe there were twelve Imāms, as distinct from Ismaili & Zaidi Shi'ite Muslims, who believe in a different number of Imams or in a different path of succession. Approximately 80% of Shi'a are Twelvers and they are the largest Shi'a school of thought, predominant in Azerbaijan, Iran, Iraq, Lebanon and Bahrain."
"The concept of Imāms and the Mahdi
The Shi'a Imams, the first of which is ˤAlī ibn Abī Tālib, are viewed to be infallible. It is an important aspect of Shīˤa theology that they are, however, not prophets (nabī) nor messengers (rasūl) but instead carry out Muhammad's message. They are considered as superior as all prophets and messengers except the last one. Shīˤa Muslims view all religions and groups that accept prophets or messengers after Muħammad to be heathen or heretical. ***They believe the last (who also is the twelfth and current) Imām, the Mahdī, is in hiding by the order of God and will reappear by God's command.***"
Shia messianic madmen want nukes just to be equal to our own messianic madmen with nukes. Go figure. And while you are figuring move that Doomsday clock several ticks forward.
Well you have a good point. Maybe I am under estimating human stupidity at work.
The graph is misleading, in that it appears to give equal weighting to all of the principal Saudi oil fields.
In reality, Ghawar accounts, or accounted, for more than half of Saudi production.
So, the sum of the production of all other Saudi oil fields did not equal the recent production from Ghawar.
The HL method gives Saudi Arabia remaining URR of about 75 Gb, and it estimates that Saudi Arabia as a whole is 60% depleted (from conventional sources).
Insofar as I know, there is no example of a large producing region showing steadily rising production beyond the 60% of Qt mark, and Saudi Arabia, as predicted by the HL model, is showing declining production, with projected First Quarter 2007 production down by over 11% from its 2005 high.
The graph is misleading, in that it appears to give equal weighting to all of the principal Saudi oil field.
Possibly. I certainly wasn't misled. I don't think a careful reader of graphs would be.
As far back as 2004, the Saudis were to a large extent agreeing with you about Ghawar. But they were claiming back then that other fields will take up the slack.
Your case rests on HL plots and current production data.
However the Saudi's have a long history of being disciplined about production, and have used their ability to be a "swing producer" to great effect.
How can Hubbert Linearization have predictive value for a country that has restrained production for political reasons, like Saudi Arabia?
(Before I get slammed for repetitive posts, note that I am responding to a question.)
There have only been two swing producers of consequence, Texas and Saudi Arabia. Saudi Arabia, like Texas, produced for long periods of time at less than capacity.
The Texas HL plot is very noisy, up until the peak, but we can get a solid Qt estimate, and we know when it peaked, at a higher percentage of depletion than did the overall Lower 48. Consequently, Texas has had a sharper post-peak decline rate, about 4%, than the overall Lower 48, about 2%.
Saudi Arabia, in 2006, was at the same stage of depletion at which Texas started declining in 1973. See related article: http://www.energybulletin.net/16459.html
Unlike Texas, Saudi Arabia has had a very stable HL plot, with a small change in inflection in the past three years or so, reflecting a ramp up in production, which we also saw in Texas, right before it peaked.
Hubbert predicted that the Lower 48, inclusive of Texas, would peak between 1966 and 1971 (it peaked in 1970). Khebab demonstrated that the post-peak Lower 48 cumulative production was basically exactly what the HL model predicted it would be.
Deffeyes predicted that world crude oil production, inclusive of Saudi Arabia, was most likely to start declining in 2006, which is what it has done.
"Unlike Texas, Saudi Arabia has had a very stable HL plot, with a small change in inflection in the past three years or so, reflecting a ramp up in production, which we also saw in Texas, right before it peaked."
Only if you count what you know, or know what you can count. There's the rub. No one knows.
By the way, what did the HL method say about say about that "stable" plot line in 1978 to 1985? Do stable plots often go wonky like that?
Roger Conner known to you as ThatsItImout
The model is HL.
My problem is I can't find an article that rigorously tests the model.
The sample of large producing regions includes: Texas, Saudia Arabia, North Sea, Russia, GOM. n=6 (others?)
Is there an article that rigorously applies HL to the sample and analyses goodness of fit etc?
Is there a piece the applies HL rigorously across all large oil-producing regions?
Thanks, Asebius.
Asebius, that is a point I have been trying to convey forever here on TOD, but mostly ignored......
Saudi offshore: how much is there, and why are they paying the highest rates for rigs in history to go offshore if they have plenty onshore?
Khaurais, how much? Is it the replacement super giant? Why are they spending billions on it if it is no good?
The empty quarter, how much? They claim potential riches beyond compare (by the projectionions the Saudi's give, we must have only seen the tip of the iceberg at Ghawar) How much?
Can anyone really do an HL on all this mystery oil? If so, what is the HL calculation for URR in and offshore Saudi Arabia?
Remember, these are things you would like to have some info about before you call your broker and sink your retirement fund into oil futures! :-)
Roger Conner known to you as ThatsItImout
Agreed.
Hubbert's curve is a mathematical model that it's proponents claim fits all large oil producing regions.
If the sample size is small (as it is) and if the goodness of fit when rigorously applied to all members of the sample is not the best, then much rests on acquiring new data and analyzing it. (And developing better models).
Small sample size is a problem in and of itself.
In the climate change world, the sample is unfortunately one. So there has been a huge effort in data acquisition and a proliferation of models before the grand picture gets clearer.
My (previously posted) "Coincidences" Post:
Heaven help us if this is considered rigorous analysis.
I agree that having to limit ourselves to the earth is a problem, but if you could provide us with case histories of oil production on other planets, perhaps we could broaden the sample.
The regions that I have referenced account for about 40% of all oil produced to date.
Perhaps you could provide us with a list of producing regions showing rising production where all of their top 10 producing oil fields are in decline?
In any case, as I predicted, Saudi oil production is declining. Let me know when Saudi oil production exceeds 9.55 mbpd on an annual basis.
Thank you. I enjoy your posts immensely and appreciate the necessary repetitions. Folks can be slow learners when their mental baggage drags them down.
pete
The only "information" which would change the analysis of the Saudi HL is the changing of the size of the "field". Comparison would be the widening of the US "field" to include Alaska and/or Offshore production.
Now the Saudi "field" is being widened to include offshore. How much can this really change the HL-Analysis? Well, if another Gawar is out there, then a lot. If it's anything the size of a normal superfield, not enough to change peak date, I would imagine. Post Peak decline would simply be dampened, less steep...
Let us not be absurd. Saudi has been producing from offshore for half a century. Safaniya was brought on line in 1957, the other offshore fields soon after.
Ron Patterson
Frankly, this is the best we can get. SA is not providing any verifiable data at all, just unlimited claims.
Imo, just look at what they are doing with rigs. Their number of rigs looking for oil is up 3x in 2 years, along with a constantly moving target of how many rigs they really want - last year the target was 80, now 130, maybe they will be targeting 180 by fall, and when they actually reach this number their count will be up 10x. Does anybody think the production/well is stable? btw, some of these rigs are going for 500k/d, 4-year contracts, plus transport costs from our gulf to theirs...
SOme people think sa is floating on oil, just dig anywhere. They already went to the bottom of the empty quarter to develop shayhah, their only young field, now the focus is expensive off shore. All others are very old, c1950; horizontals are watering out... even the use of horizontals is a sign the end is near, whether in the north sea, off mexico, or the sands of arabia. We're into the second half of this game, maybe well in.
Another way to look at the situation is, what is the lifetime of a giant? Ghawar is unique, but the others are not... they are all due for retirement. Repeat after me: there are no new fields, only reworks of old fields, some abandoned long ago. And, iran/iraq/q8 are all in the same boat. Not running out, but running down. Tanker rates are down sharply...
ThatsItIMout...
Billions is not that much money anymore. At these oil prices 80 million barrels of oil has a market price of 4 billion USD. That is how much money the world spends on oil EVERY DAY. The US itself spend a billion on oil EVERY DAY - that is only a few dollars per person.
The way I see it is the model is just a model and so it depends crucially on the assumptions you put in. But if you accept that the peak occurs at around the point where half the worlds oil is produced and you look at the estimates of URR to estimate when we will reach the peak, you find that the range of outcomes spans only a small number of years (less than 10). In other words the difference in the GLOBAL peak whether you make really pessimistic URR or really optimistic URR assumptions is not that much. You might estimate peak is 2009 with an error of 4 years or so. So the mystery about the actual URR doesn't really affect the reality in front of us - peak is soon (or is now) and we are not and will not be ready.
Bearing that in mind, the micro questions of exactly how much oil Saudi has or if there is an new giant offshore is largely irrelevant. The problem is we are consuming way to rapidly for it to materially change the outcome.
does that plot from the horizontal wells production go to zero? if so that looks like a 100% falloff in 3 months, as compared to the few % per month decline from vertical wells.
Does a similar production profile follow for oil, or is the suddenness of this falloff just associated w/ gas?
that would depend on the artificial lift method and reservoir mechanics. horizontal wells do present challenges and limts on installing and operating pumping or other "lift" equipment. as long as the well has sufficient pressure and flow rate (velocity) the well, whether gas or oil will continue to flow. when the flow rate drops the well may "load-up" ( ie the well pressure is not sufficient to "lift" the liquids accumulating in the tubing).
so dry* gas wells not producing any water will generally produce to an economic limit. gas wells producing liquids(condensate or water) will generally crash(in some cases after a shut-in period the well can be opened up again to production)and there is no law against pumping liquids from a gas well .
oil wells not being artificially lifted (pumping or gas lift) will generally crash. artificially lifted wells will generally decline to an economic limit.
* dry gas refers to a gas well not producing condensate and may or may not produce water (sort of like dry, not sweet, wine)
"does that plot from the horizontal wells production go to zero"
I'm wondering the same thing. We may be underestimating how long a tail can go on with vertical wells. Maybe the graph doesn't follow it out on the X axis long enough. My state (Ohio) peaked in Oil production in 1896. There had been some drilling and production as early as the 1820's (I know this is before Colonel Drake but it's true). Anyway the first "commercial" well was drilled one year after Drake in 1860. Peak was in 1896. Now we are 110 years passed a peak that took 36 years to reach. Shouldn't we expect that Ohio would be producing virtually nothing? In fact it still produces 25% of the peak production, virtually all of it from stripper wells. There are wells here that produced heavily for a few years but have been producing about 1 barrel a day for decades. I know that's not much but if our vertical wells have a second life as stripper wells for another 30 years producing 1% or so of their peak, it does add measurably to the total extracted- it just takes a very long time.
Hi Phineas,
From Ohio too. At least until a couple years ago, we had wells from the teens and twenties, producing maybe a barrel every 3-4 days..
Do you got evidence/quotes about the 1820s? That would interest the hell out of me!
Greetings from Munich (yes, Germany), Dom
Dom,
congratulations on your escape from the midwest doldrums.
There are plenty of reports of "non-commercial oil wells in the Macksburg area (SE Ohio) back in the 1820's. Don't know what "non-commercial" means. Drake is credited with the first "commercial" well. This Ohio DNR webpage had information on it but for some reason the link isn't working for me right now:
http://www.ohiodnr.com/mineral/oil/o1.html
Ah, here's the plaque commemerating a well in SE Ohio dating to 1814.
http://www.noblecountyohio.com/wellmarker.html
And here's an article describing local oil production history. Ohio was the SA of the 1890's!
http://www.energybulletin.net/7376.html
Wow, thanks.
Yup, where do you think the rockefellers came from! Not NY.
"o.k." comes from Ohio too.
Our area boomed around 1909-1912. Damn, those '70s sure were good too, don't you think? The drop in price in the mid '80s not only put Russia etc.. out of pumping business. Why do you think I wanted to "escape" the Ohio back woods? Not too get rid of my (almost) Appalatian accent!
Peak production in Ohio was 23.9 million barrels. Per Year, mind you.
"O.K.", or "okay", originated in Massachusetts in the 1840s.
check your sources.
Ohio, 1840 elections between William Henry Harrison and (?)...
Prove me wrong!
o.k. you're right.
Boston newspaper, 1840, in connection with the election between Harrison and Van Burren.
Hello Heading Out,
Thxs for this report. BTW, did you see the DOE report on Microhole drilling at the bottom of today's Drumbeat? Is this something that is worth your time to do a keypost writeup; to further explain this concept to those of us with no oilfield experience?
Some of the questions I would like answered are listed below:
I would be interested in reading if this is a breakthrough in upfront energy costs that will increase ERoEI. If most of the small reservoirs are in fields with existing infrastructure-- cheap and easy to connect to the spiderwebs. But if most of the deposits potentially exploitable are actually isolated or stranded, then the transport costs may cost-benefit outweigh the micro-wellhead's small production.
Is microhole drilling economically transferable to offshore production? For example: a combo drill rig + FSPO moving along punching quick straws, extracting the FFs, then moving to the next mini-deposit?
Environmental cost and effects--does this tech really screw up the onshore habitats if a microhole is drilled at densities of 1 well/fifty acres? Can it approach 1 well/acre? Any applicability to landfill-gas extraction, tundra-gas extraction, undersea methane clathrate extraction?
Can micro-hole be effective enough to delay us from further enviro-wrecking of the Athabasca tarsands because we will be after the easier liquids, or does this tech when applied to the tarsands actually increase the chance of further habitat destruction? Can this tech cause a meaningful delay in the shift to higher burn-rates for coal and/or CTL until CO2 sesquestration is perfected? If this tech is applied to coal bed methane mining: can we now get the energy without bulldozing the entire mountain?
Are these companies excellent investments, or just another Scam as we get desperate heading into the postPeak Era?
Thxs for any reply HO!
Bob Shaw in Phx,Az Are Humans Smarter than Yeast?
One more set of questions: can micro-hole drilling do horizontal wells, maximum reservoir contact wells [bottlebrush and/or Xmas tree-wells]? Thxs!
There is a story in the December E&P Magazine (page 45,46) written by the head of Xtreme Coil Drilling that talks about the new technology.
Note: You must click "Read the current issue online" and then the "Previous Issues" tab (cannot go directly to previous issues for some reason). Then select the December issue, then click to the next page, then click "Coiled tubing drilling goes deeper" to get to page 45.
Here is the Conclusion of the article
From the company's website there was a release about a recent joint venture with Shell (49% owner). The Xtreme Coil Drilling company has about a $300 million market cap (Canadian?).
I wonder how quickly this new technology can be ramped up. There are thousands of rigs out there.
Xtreme Coil's info says that they have 6 rigs under construction and 4 on order.
Separately, the E&P magazine article said that the prototype rig drilled 200 wells in it's first year of operation. And, that by yr 2000 coiled tubing rigs were drilling "thousands" of wells per year (using how many rigs?). Further in the article, it says that coil drilling rigs are capable of drilling two 2000ft wells in one day.
I think microhole drilling gives more questions than answers at this point. How do they deal with pressure control in the wellbore during drilling? How would you ever get production casing run in a hole this small? Forget about getting wireline tools in there also. Downhole pumps impossible. I think there is a whole lot of handwaving dismissal of these problems in the articles so far.
On Xtreme's website is the following...
Anadarko Vice President Jim Kleckner, in his presentation entitled Rocky Mountain Powerhouse, mentions Anadarko's use of coil drilling when discussing the Greater Wattenberg Area – slide 24.
Here is a transcript of his comments:
"We’re in the process of testing an exciting new drilling technology as pictured in this inset. This is a coil tubing drilling rig that has been successfully utilized in shallower fields throughout Canada. Anadarko has one coil rig operating in the Powder and another rig, commissioned just last week, in the DJ Basin. So we’ll be testing the new technology to determine the effectiveness of drilling with coil at deeper depths ... and subject to the results of the tests are in position to contract more of these type of rigs to further accelerate the program ...
Boby,
Why would a 4" diameter hole exclude wireline tools? We are running casing, wireline tools and survey instruments down a (NX) 1 5/8 inch i.d. hole right now. Granted, I know very little about downhole pumps, but dosen't NaviTool have NX-sized equipment?
Please help a hard-rock geo understand softrock drill tech.
A 4" diameter hole would present no problems at all. In Texas and Louisiana, where I have my experience, you have to isolate surface water from any zones which
would possibly contain salt water. This involves setting a string of surface casing(sometimes several progressively smaller diameter sets depending on location). This takes big equipment and would push costs up substantially.
Are you open hole logging a hole this small? What kind of casing are you running?
How deep and what is the production? Just
for my education(and others)
Microhole would be interesting for "disposable" exploration wellbores in shallow areas.
HO - the comparative chart is an interesting one though need to note that one well was drilled by POGO and the other by Standard Oil of New Jersey. Its not clear that the two wells are drilled in the same field / reservoir.
Nevertheless, the principle is clear. Horizontals get your production faster than verticals. Note that the horizontal produced 7.7 BCF in around one tenth the time it took the vertical to produce 4.7 BCF. This works wonders for the short term economics of assets and companies - but little for longer term energy security.
One of the points I made in my post on UK north Sea production is that a general feature of field development practice since 1980 has been to get oil / gas out as fast as possible. This results in short-term accelerated production rates, which combined with the reduction in field sizes results in new fields having very short life spans - 2 to 5 years - all part of the slippery pole called depletion.
http://www.theoildrum.com/story/2006/11/19/135819/75
Very funny: In the Aramco's Slide, they get a mean 28% depletion: the arithmetic mean over the ten bars give 30%, so we have to conclude that ALL the fields weights are more or less the same.
They have 10 Gawar-sized fields from the beginning, and said nothing! :D :D :D
Cheers
I was wondering the same thing. Is the 28% the average of all fields when all fields are given the same weight? Of course, Ghawar should be given far more weight when considering overal depletion than the smaller fields.
On that slide Ghawar is listed as 48% depleted so it must be a simple arithmetic average -- otherwise a weighted average would have yielded a result above 30%.
By the way, isn't/wasn't Westexas looking for depletion data for Ghawar? Well, here it is, straight from Aramco itself, slide 11 of this presentation (2004 data) Ghawar is 48% depleted: http://www.csis.org/media/csis/events/040224_baqiandsaleri.pdf
I think the 28 percent depletion figure they give for Saudi is based on the belief that they still have 260 billion barrels of reserves. Of course no one knows exactly where these hidden billions are, but if the Saudi's say they are there, then by Allah, they are there!
Hell, does anyone in the oil industry doubt that?
Ron Patterson
Dec 11th issue of the Oil & Gas Journal has an article ("Billions of Barrels in Bakken Recovery Seen in Williston") that cites an EIA report that the mean OOIP of the entire Bakken formation may be 413 billion barrels. The USGS will (allegedly) have a new report out on Bakken "in about a year." The operator of the Elm Coulee field in Mont. assumes a recovery factor of 10%. Ten percent of 413 billion bbls is sort of an interesting number. Any thoughts?
I saw the article too. I thought it was awfully casual, given the numbers bandied about. I'd love to know more about the area, especially given how little (per day) is produced there now.
Thanks or the Connections link. I saw thyem when I was a kid, and tried to find them in the PBS store, but they only had the later series, which IMO weren't as good.
The graph "Proved reserves depletion" cutely shows a "Total Aramco Depletion" of 28%. Very comforting.
A group of people have the following Net Worths:
$6k,4k,5k,1k,2k and 1,000,000k.
So the average net worth is $166k. Since the average is comfortably above the poverty line, there is no immedine concern.
Wow that's right. Am I reading this right? Slide 11 on the CSIS link above, 10 oil fields, with an arithmetic average of 300%, and divided by 10 is 30% (about 28%). Ghawar is shown as 48% percent depleted. They didn't use a weighted average?
Ugh.
there have been many comments in the past that what we need is a "Manhattan Project" or man on the moon type national focus for oil. here is an indicator of the sense of urgency
U.S. Oil Industry Urge Canadian Oilsands Execs to Step It Up
By The Canadian Press
18 Jan 2007 at 12:11 PM EST
TORONTO (CP) -- Canadian executives were urged to massively step up oilsands production to five million barrels of oil per day in a relatively short period of time by their counterparts in the U.S., according to documents obtained by the CBC.
Executives from U.S. oil multinationals and Canadian oilsands producers met for two days in Houston, Texas, in the days following the election of Conservative Prime Minister Stephen Harper's government last year, the broadcaster reported Wednesday.
They recommended a five-fold increase in oilsands production fairly quickly, according to minutes of the meeting obtained by CBC.
Oilsands production output was 1.1 million barrels per day in 2005, according to the National Energy Board. It is currently projected to provide between three million and 3.5 million barrels per day by 2015.
Canada exports much of its oil to the United States. However, increasing production to five million barrels per day would be enough to satisfy a quarter of U.S. consumption and almost half its total imports.
However, such a massive production increase would require new refineries and pipelines to transport the crude from the Alberta oilsands as far as California and Texas, according to the document.
With a half-dozen new or expanded oilsands plants coming on stream in the next 10 years, there has been a push for increased pipeline capacity.
Two major energy companies that ship bitumen to the U.S. have recently announced plans for increasing the flow.
BP PLC [NYSE:BP] announced in September it will spend US$3 billion to retrofit its Whiting refinery near Chicago to become a primary processor of heavy Canadian oilsands crude.
EnCana Corp. [TSX:ECA; NYSE:ECA] also announced a C$15-billion deal last fall with ConocoPhillips [NYSE:COP] to ship Alberta bitumen to the U.S. ConocoPhillips is preparing to retrofit its refinery in Billings, Mont., to process it.
In addition, TransCanada Corp.'s [TSX:TRP; NYSE:TRP] plans to spend more than US$2 billion to convert some of its main natural gas pipeline to handle 435,000 barrels of bitumen per day, and Enbridge Inc. [TSX:ENB; NYSE:ENB] is planning to spend US$140 million to expand one of its Alberta pipelines to ship 450,000 barrels of bitumen per day.
However, Alberta's government appears to be conflicted on the issue of shipping raw bitumen into the United States for upgrading and refining.
Energy Minister Mel Knight says he's not uncomfortable with large volumes of bitumen - the tarry product mined from the northern oilsands - being exported, even though it means considerable value is being added to the product outside the province.
Bitumen is first upgraded into synthetic crude oil, which can then be piped to refineries for transforming into gasoline, lubricants or other petroleum products.
Knight said recently that Alberta should have enough capacity to upgrade about 80% of its bitumen within about a decade.
The message seems to differ somewhat from what Ed Stelmach said last month after he won the Alberta Tory leadership race.
The new premier told reporters then that he wants more of the oilsands production to be processed within Alberta instead of being transported as a crude resource to the United States.
© The Canadian Press 2007
Hello Polytropos,
Thxs for this info. If the 15 favored detritovore States, as outlined by the Hirsch Report, plus the SuperNafta trends, is the actual plan moving forward: I would expect the discussion for Canadian tarsands being pipelined to California to get no further. Texas--yes, California--no.
Furthermore, from a Canadian national security standpoint: Canada would be foolish to ship the raw product south versus upgrading it as far as possible into finished products before sending south. I would think that Canada's export power would be sufficient to economically make this true going forward, but I maybe wrong.
I agree with your sentiment that the overall article tone is most alarming: US urging Canada to go whole hog on expansion to ramp prod. fast. Perhaps our leaders are starting to run scared? IMO, it is long overdue.
Bob Shaw in Phx,Az Are Humans Smarter than Yeast?
That's going to be a significant increase from the current rate of growth -- (I calculate) approximately 11.6% compounded annual growth to 2015.
From Statistics Canada last year (2005) tar sands output growth was 5.8% (while domestic Canadian oil conventional production declined 2-3%).
So the rate of growth is supposed to approximately double while oil prices are lower. Going to be difficult to incentivize co's to invest in these tar sand projects when steel costs are still high -- and other costs are moving up rapidly.
The decline rate for horosintal wells is very fast and i found this http://www.csis.org/media/csis/events/040224_baqiandsaleri.pdf page 21 could this really be realistic? I immidetly got the feeling that some of the pictures and some of the information is from a manufacturer that manufactures this cind of equipment.