A Life Cycle Assessment of Energy Products: Environmental Impact Assessment of Biofuels
Posted by Prof. Goose on September 23, 2007 - 10:00am
The authors of this study are: Rainer Zah, Empa; Heinz Böni, Empa; Marcel Gauch, Empa; Roland Hischier, Empa; Martin Lehmann, Empa; Patrick Wäger, Empa
Empa, Swiss Federal Institute for Materials Science and Technology, Technology and Society Lab, Lerchenfeldstrasse 5, CH-9014 St. Gallen, Switzerland, www.empa.ch/tsl
Executive Summary
In connection with the worsening scarcity of fossil fuels and climate change the idea of using renewable energy is attracting interest both in the Swiss public eye and in industry. Fuels made from biomass - so-called biofuels - are currently the most important form of renewable energy in road transportation and could at least over the short to medium term take on a role in reducing greenhouse gases and our dependency on fossil fuels.
In Switzerland therefore important political decisions have to be made against a background of giving a tax break for renewable fuels as opposed to diesel and petrol.
Although biofuels from renewable resources exist, a wider range of environmental impacts may result from their cultivation and processing than those from fossil fuels. These range from excessive fertilizer use and acidification of soil to a loss of biodiversity caused by clear cutting rainforest. Besides that, one should not forget that expanding agricultural energy production may lead to land use conflicts with other land uses such as food production or the conservation of natural areas. Therefore energetic efficiency and the attainable reduction in greenhouse gases should not be taken as the sole criteria for a holistic environmental evaluation of these alternative fuels.
The objective of this study is to evaluate the environmental impacts in the whole life cycle of biofuels used in Switzerland. Firstly an action-oriented analysis of the environmental impacts of renewable energy carriers was to be developed. Secondly the objective was to draw up a "comprehensive environmental analysis" of the various biofuels, which could serve as a basis for enforcing the exemption of renewable fuels from the excise duty on diesel and petrol. In addition, the effects of using the fuel were to be compared with other ways to use bioenergy, such as heat and power generation.
Editorial note: there is a comprehensive glossary at the end of the piece, as are the references denoted [X] throughout.
Abstract
The objective of this study is to evaluate the environmental impact of the entire production chain of fuels made from biomass and used in Switzerland. Firstly the study supplies an analysis of the possible environmental impacts of biofuels suitable as a basis for political decisions. Secondly an environmental life cycle assessment (LCA) of the various biofuels is done, which can be used as a basis for granting an exemption from the excise duty on fossil fuels. In addition, the impacts of fuel use are compared with other uses for bioenergy such as the generation of electricity and heat. The study based on the Swiss life cycle inventory database "ecoinvent" gives a holistic comparison of the environmental impacts of biofuels; however neither the costs of biofuels nor the social consequences of their production are evaluated. The results refer to average values from the year 2004 in the respective production countries and are to be taken as a snapshot of factors relevant to the fuels' use in Switzerland. Thus the study cannot provide any answers to questions concerning future impacts - for instance, on food prices.
In principle, each of the fuels examined (bioethanol, biomethanol, biodiesel and biogas) can be produced in an environmentally friendly way - it depends on what raw materials and production technologies are used. Most of the environmental impacts can be attributed to the agricultural cultivation of the respective raw materials (feedstocks). The environmental impact from fuel processing is usually much lower. The environmental impact from the transport from the production site to Swiss filling stations is even less, even when the biofuels are produced overseas. The present study shows that with most biofuels there is a trade-off between minimizing greenhouse gases (GHG emissions) and lower total environmental impacts. It is true that GHG emissions can be reduced by more than 30% with a number of biofuels. However most of these supply paths show greater impacts than petrol for various other environmental indicators.
The environmental LCA was done using two different methods: one was the Swiss method of ecological scarcity (Environmental Impact Points, UBP 06), which evaluates the difference between environmental impacts and legal limits. The other one is the European Eco-indicator 99 method, which quantifies the damage done to human health and ecosystems. Both methods show the same results: in the case of tropical agriculture it is primarily the clear-cutting and burning of rainforests that releases the largest quantities of CO2, causes an in-crease in air pollution and has massive impacts on biodiversity. In the moderate latitudes it is partly the lower crop yields, partly the intensive fertilizer use and mechanical tilling of the soil that are the causes of a bad environmental evaluation. However unlike the case of fossil fuels, the environmental impacts of biofuels can be reduced by specific measures. The study shows in sensitivity analysis how, for instance, a reduction in methane leakage can improve the LCA of biogas production or what effect a prohibition of clear-cutting would have on the LCA of biodiesel made from palm oil.
Overall, the results of the study show that any promoting of biofuels by a tax break, for instance, must be done so as to target the best production paths. Not all biofuels per se can reduce environmental impacts as compared to fossil fuels. Currently, of all the production paths investigated, it is especially the use of biogenic wastes and grass to wood that brings a reduction in environmental impact as compared with petrol. Since the potential of domestic bioenergy today is limited - and will be so in future - bioenergy will not solve our energy problems. However it if the available biomass is transformed into energy in an efficient and environmentally friendly manner, while at the same time consumption is reduced and energy efficiency in-creased, these alternative energy carriers can together with other forms of renewable energy play a role in our future energy supply that should not be neglected.
Methodology
In order to determine the effects of biofuels on the environment as exactly as possible, the methodology of life cycle assessment (LCA) was chosen. That entails evaluating the energy and resource consumption and all pollutant emissions over the entire life cycle needed to satisfy a defined function (e.g. filling up a car tank with 1 MJ of energy at a Swiss filling station).
All necessary inventory data for biofuels were collected in the first part of this project [1] and complemented by additional data from the Swiss life cycle inventory database (ecoinvent 1.3)[2]. The impacts on the environment were then first determined with the aid of action-oriented indicators, which described the direct environmental impacts and suggested to us ways to deal with them. Secondly an environmental overall assessment was done, during which the individual damaging effects were weighted and aggregated, so that all environmental impacts could be assessed (see Figure 1). It was important to remember that the aggregated evaluation methods (in this study Environmental Impact Points, UBP 06 [3], and eco-indicator 99 [4]) included their own relative weighting factors for the various environmental impacts (e.g. the greenhouse effect versus excessive fertilizer use). For political discussion it is therefore important not to rely solely on the overall evaluation, but rather on a case-by-case basis to include the individual action-oriented indicators it is based on.
The study covered renewable energy forms both from Switzerland and foreign production; however Switzerland was always taken the place of utilization. The assessment was done on a cradle-to-grave basis; i.e. all relevant environmental impacts from biomass cultivation, from the occurrence of a biogenic waste substance to its energetic utilization. The year 2004 was chosen as the main observation period, although in some cases the authors responsible for the life cycle inventories had to rely on older or newer data.
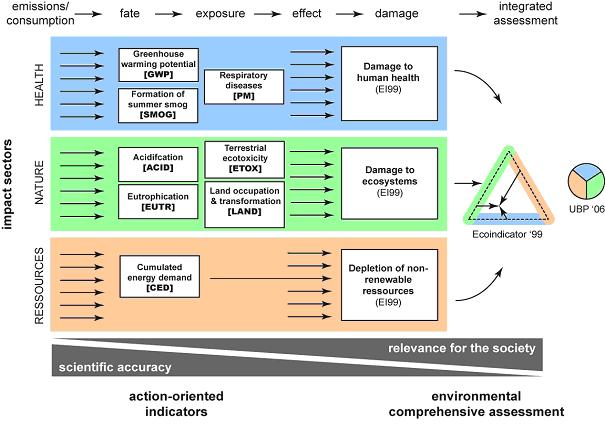
Figure 1: Schematic diagram of the environmental indicators used in the study along the path of proliferation and causation. Click to enlarge to full size.
One important aspect in analysing renewable resources is the inclusion of co-products. During the production of the products examined in this study there are co-products on various production stages, which required to allocate the environmental impacts onto multiple products according to the ecoinvent guidelines. Thus it was necessary e.g. to distribute the raw material inputs and environmental impacts from the pressing of rapeseed grains over the two resulting products rapeseed oil and rapeseed cake. This allocation was done during the preceding data collection according to economic criteria in most cases, i.e. environmental emissions were distributed in the same proportion as the revenue obtained from each of the products.
Limitations of the study
The methodology does provide a holistic comparison of bioenergy forms considering the whole production chain. However the approach suffers from the following limitations as regards the interpretation of results:
-
The methodology of life cycle assessment (LCA) analyses the environmental impacts of material and energy flows. That does not include any results pertaining to economic factors such as e.g. costs or social factors such as e.g. child labour.
-
Although the LCA approach used here is very comprehensive, certain environmental impacts are covered only incompletely or not at all. For example, the effects of water utilization are not covered because they differ a lot depending on local conditions (the quantity of precipitation, groundwater level, etc.). Biodiversity losses are also incomplete because the data basis is lacking on tropical ecosystems.
-
On the basis of the data from existing Life Cycle Inventory Analysis (LCIA) most of the results refer to existing process chains, and thus cover Reference Year 2004; future developments are not judged. However a glimpse of future developments is provided by the sensitivity analyses and possible optimization potentials.
-
Since many allocations have been calculated from sales revenue, and revenue depends on market dynamics, the results of this study are not "chiseled in stone" and may have to be verified at some later point in time.
-
The process chains investigated represent only a subset of all production processes; many more production paths are conceivable. The paths chosen, however, are considered especially relevant for the current situation in Switzerland.
-
The data from existing LCIA represent average condition in the respective production countries (Switzerland, Europe, Brazil, USA, etc.) and apply as an integral whole as regards use in Switzerland. Therefore the results may not be applied without qualification to decision situations in partial regions or individual plants, because the environmental impacts in individual cases may differ radically from the average situation.
-
The study gives no answers the question as to the future consequences of a shift to renewable fuels, e.g. the consequences for the environment if agricultural products were to be grown on such a large scale for energetic utilization that agricultural production as a whole had to be intensified, or as to any possible rebound effects [5]; in case an increase in fuel consumption should result from the introduction of biofuels because biofuels were regarded in the eyes of consumers as "environmentally friendly", and thus as unproblematic.
How are environmental impacts distributed along the value chain?
Figure 2 provides a chart of how greenhouse gas emissions (GHG emissions) are distributed along various production chains for bioethanol, biodiesel, methanol and methane [6]. The figure shows that savings of up to 80% are possible as compared with fossil fuels depending on the biofuel and production path. However large differences arise along the production chain:
-
The largest percentage of GHG emissions comes from agricultural cultivation (Figure 2, green) through the use of machines, fertilizer and or pesticides, and also in the form of direct emissions (such as nitrous oxide). By the same token however, this percentage can be varied a lot. The most important factors for agricultural GHG emissions are yield per area (high in the cases of Swiss sugar beets or Brazilian sugar cane, but low in the case of Swiss potatoes or rye RER), emission of nitrous oxide (comprising 30% in the case of US maize) and the clear-cutting of rainforest (relevant with Malaysian palm oil and Brazilian soy oil). The regional differences in the intensity of deforestation can have a relevant effect on the overall result. The main factor is the way in which energy plants are cultivated. This applies not only to GHG emissions but also to the most of the other environmental impacts of biofuels as well. Unlike agricultural products, waste and leftover materials require no energy to be reused; this has a very positive effect on their overall environmental performance. Thus the lowest overall GHG emissions are attainable when using biodiesel made from waste cooking oil or methane from liquid manure.
-
The fuel production itself (Figure 2, yellow) causes on average much lower GHG emissions than agricultural cultivation. Biodiesel requires only low emissions during extraction and esterification. During the fermentation of bioethanol the emissions can be varied a lot because either fossil energy carriers have been used (bioethanol from American maize) or waste from agricultural production is used as process energy (bagasse in the case of Brazilian sugar cane). The highest GHG emissions in the production process are set free during the production of biogenic methane. The causes for this are the methane and nitrous oxide emissions during the secondary fermentation of the residue and the methane leakage during the processing step from biogas to methane 96% by volume. Figure 2 shows, though, that for instance in the case of liquid manure much of these emissions can be reduced by taking care to cover the secondary fermentation container.[7]; This covering up has already become state-of-the-art as of 2007.
-
Fuel transport per se (Figure 2, orange) from the production regions to the Swiss filling station usually comprises much less than 10 % of overall emissions and plays only a secondary role from an environmental standpoint - as long as the intercontinental transport is done with tank ships or in pipelines.
-
The actual vehicle operation (Figure 2, dark grey) is CO2-neutral in the case of the pure biofuels compared here because all the CO2 set free then was shortly before absorbed during plant growth.
-
The production and maintenance of vehicles and construction and maintenance of roads (Figure 2, light grey) has also been dealt with in this study. However an identical vehicle and the same annual mileage were assumed for all cases considered, yielding the same increment for all variations. In the case of very efficient alternative fuels such as bioethanol from sugar cane or methane from liquid manure this increment may comprise much more than half of all GGH emissions.
Figure 2: Comparison of the greenhouse gases emitted by biofuels in comparison to those emitted by fossil fuels (petrol and diesel, EURO3). The emissions are broken down into the individual process of the value chain. Click to enlarge to full size.
Figure 3 shows a different picture in which the whole environmental impact has been calculated using the method of ecological scarcity (UBP 06). It is true that the environmental impacts of vehicle operation (dark grey) are much higher when fossil fuel is used in comparison to biofuels; however this is overcompensated by the many very high environmental impacts in agricultural production. The causes of this are soil acidification and excessive fertilizer use in European and Swiss agriculture. In the case of tropical agriculture it is biodiversity loss, air pollution caused by clear-cutting and the toxicity of pesticides some of which are forbidden in Switzerland that comprise the essential causes of the severe environmental impacts. The very high impact in the utilization of Swiss potatoes can be explained by the great importance placed on nutrient leaching. The very high values for rye taken from European production, on the other hand, can be explained by the low harvest yield of rye on an overall European average.
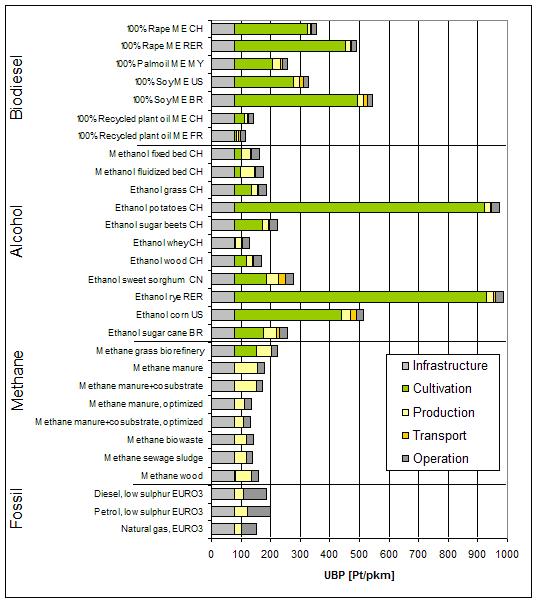
Figure 3: Comparison of aggregated environmental impact (method of ecological scarcity, UBP 06) of bio fuels in comparison with fossil fuels (petrol, diesel and natural gas). The environmental impact is broken down by individual processes of value chain. Click to enlarge to full size.
Should biofuels be imported from abroad?
Transporting biofuels from abroad to a Swiss filling station causes only a low percentage of the GHG emissions (Figure 2), and individual imported biofuels such as bioethanol from Brazilian sugar cane get a good environmental evaluation similar to that for the best domestic biofuels. The reason for this is that transportation modes such as oceangoing tankers or pipelines are used that require relatively small amounts of energy and cause only low pollutant emissions.
It is still questionable whether the import of biofuels on a large scale makes sense in the long run. Firstly, the biofuels could be used in the countries of production, in order to lessen the dependence on oil imports there; secondly, the great demand for biofuels has caused a rapid expansion of production areas and thus also rising food prices and increased pressure on rainforest areas. As soon as clear-cutting takes place, GHG emissions and environmental impacts substantially increase, thus making importation questionable.
Which biofuels are the most environmentally friendly?
An integrated environmental assessment begins with summarizing many environmental indicators in an appropriate way. That requires value judgments. The primary motivation for granting a tax exemption for biofuels comes from their potential to reduce GHG. Therefore the first environmental requirement for a fuel tax reduction is the quantity of GHG saved. This study has been based on the following threshold values:
-
A GHG reduction of at least 30% as compared with the fossil reference (petrol, EURO3 [8]).
However these GHG reductions should not be had at the expense of some other form of environmental impact, which may take various forms with biofuels. Therefore another important requirement for an integrated environmental evaluation is the criterion:
-
No increasing impacts in other relevant environmental impacts as compared with the fossil reference (petrol, EURO3)
These two criteria were applied to the LCA of this study, as evident in Figure 4 (see the page after next). It became apparent that 13 other various biofuels had GHG reductions of more than 50% and 5 of them were produced from waste materials. The largest reductions were attained with biofuels made from liquid manure. The other fuels that had GHG reductions of more than 50% were: biodiesel made from waste cooking oil, methanol and methane from wood and bioethanol from domestic biomass (grass, wood, sugar beets or whey), Brazilian sugar cane and Chinese sorghum. 9 fuels (four of which were from waste materials) still had a GHG reduction of more than 30%, one of them produced from biodiesel made from various agricultural products (soy oil US, palm oil MY, rapeseed oil CH) and the fermentation of various waste material to biogenic methane. The worst case was 5 alternative fuels attaining less than 30% GHG reductions; an extreme one being Brazilian soy biodiesel, the emissions of which turned out to even a little higher than those from petrol.
Whereas the Cumulated non-renewable Energy Demand (CED)[9] correlates with the GHG emissions, the situation is different with the other environmental indicators. With the summer smog potential (SMOG) it is especially the tropical alternatives that have high values because the cultivation areas are often accessed by means of colear-cutting or - in the case of bioethanol from sugar cane - the dry leaves are burned off before the harvest. Excessive fertilizer use (EUTR) was higher, as had been expected, by several factors in the cases of agricultural processes than in those of fossil fuels. In the case of Brazilian sugar cane and with Malaysian palm oil it became apparent, however, that even these factors can be kept low by using less fertilizer, and high crop yields can still be attained. Ecotoxicity (ETOX) on the other hand shows peaks with cultures that are grown on clear-cut areas that are due to the high toxicological evaluation of acetone emissions. The only biofuels investigated that stayed below the level of petrol in all environmental impacts tested here were methyl ester made from waste cooking oil and methane from sewage and biowaste.
Because of the environmental impacts caused by agricultural cultivation the overall evaluation (Figure 5) of Swiss bioethanol production from whey shows an overall impact that is reduced by up to 30% (UBP 06) or 50% (Eco-indicator 99) depending on the test method. The other domestic supply paths for bioethanol show the same or even better values than petrol in the overall evaluation. An overall evaluation reduced by up to 30% (UBP 06) or 50% (Eco-indicator 99) can also be obtained with the production and use of biogenic methane, although in some cases the GHG emissions are increased due to methane leakage. Figure 5 shows the confidence interval in which 95% of all values lie. This confidence interval covers only the uncertainty in the gathering of the inventory data (for instance, when estimating energy consumption) and the risks inherent in the evaluation methodology (e.g. the probability that cancer would develop given the emission of a certain quantity of carcinogenic substances). The risks are relative small, especially when using the UBP methodology, but also with the estimation of GHG emissions, and cause a change in the evaluation (from green to red or vice versa) only in special cases. On the other hand the risk is very high with all agricultural processes in the Eco-indicator 99-evaluation. The cause of that is the evaluation of land use, which - primarily for methodological reasons - bears a high risk.
Figure 6 and Figure 7 summarize the GHG emissions and overall environmental evaluation of all fuels studied. The green area means a better evaluation than the fossil reference both as regards GHG emissions and in the overall environmental evaluation. The figures show on the one hand that there are production paths for all fuels in the green area; on the other hand, most of those "green" production paths are based on waste materials and residue. Bioethanol from Brazilian sugar cane shows very different evaluations depending on whether UBP 06 or Eco-indicator 99 was used. The cause of this is the pesticide Daconate, which contains a lot of arsenic, a chemical in this study only to be found in the inventory of sugar cane cultivation and that causes high ecotoxicology readings when evaluated using Eco-indicator 99. The great differences in bioethanol from potatoes can be explained, on the other hand, through the great importance attached to nutrient leaching in the UBP 06 method.
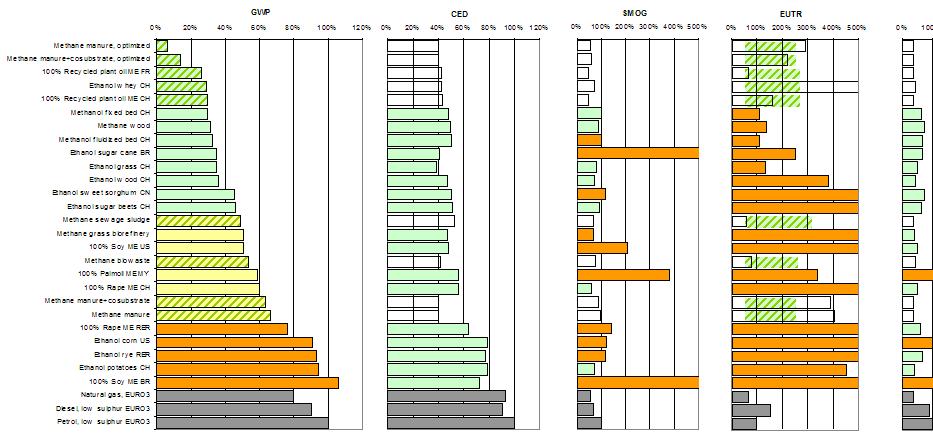
Figure 4: Overall environmental Life Cycle Assessment of all unblended biofuels studied in comparison to fossil reference. GWP = greenhouse warming potential, CED = cumulated non-renewable energy demand, SMOG = summer smog potential, EUTR = excessive fertilizer use, ETOX = ecotoxicity. Reference ( = 100%) is petrol EURO3 in each case. Biofuels are shown in diagram at left ranked by their respective GHG emission reductions. Fuels that have a total GHG emission reduction of more than 50% as versus petrol are shown in green, those with GHG emissions reductions of more than 30% are yellow, those with GHG emissions reductions of less than 30% are red. In other diagrams green = better than reference; red = worse than reference. Cross-hatched fields = production paths from waste materials or residue. Click to enlarge to full size.
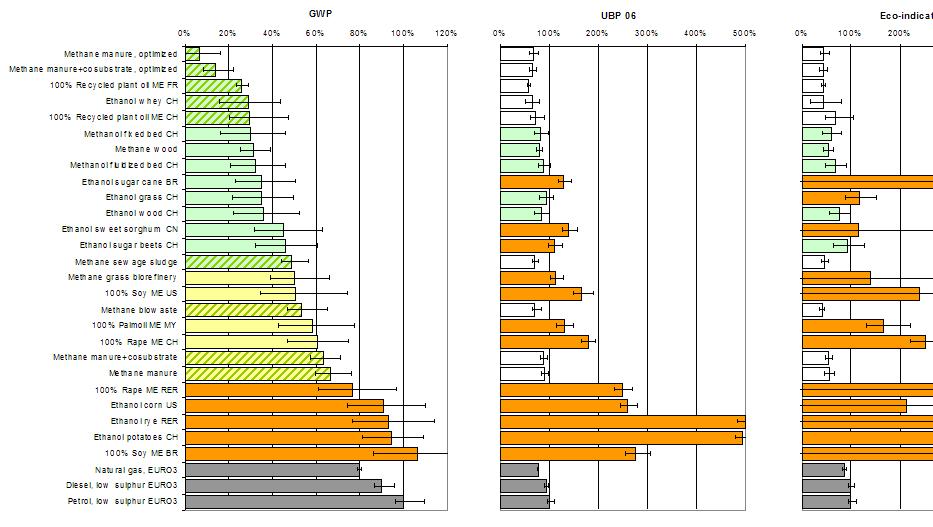
Figure 5: Overall environmental Life Cycle Assessment of all unblended biofuels studied in comparison to fossil reference. GHG emissions reductions of more than 30% are yellow, GHG emissions reductions of less than 30% are red. In other diagrams green = better than reference; red = worse than reference. Cross-hatched fields = production paths from waste materials or residue. Error bar = 2.5 % / 97.5 % percentiles calculated using Monte Carlo simulation. Click to enlarge to full size.
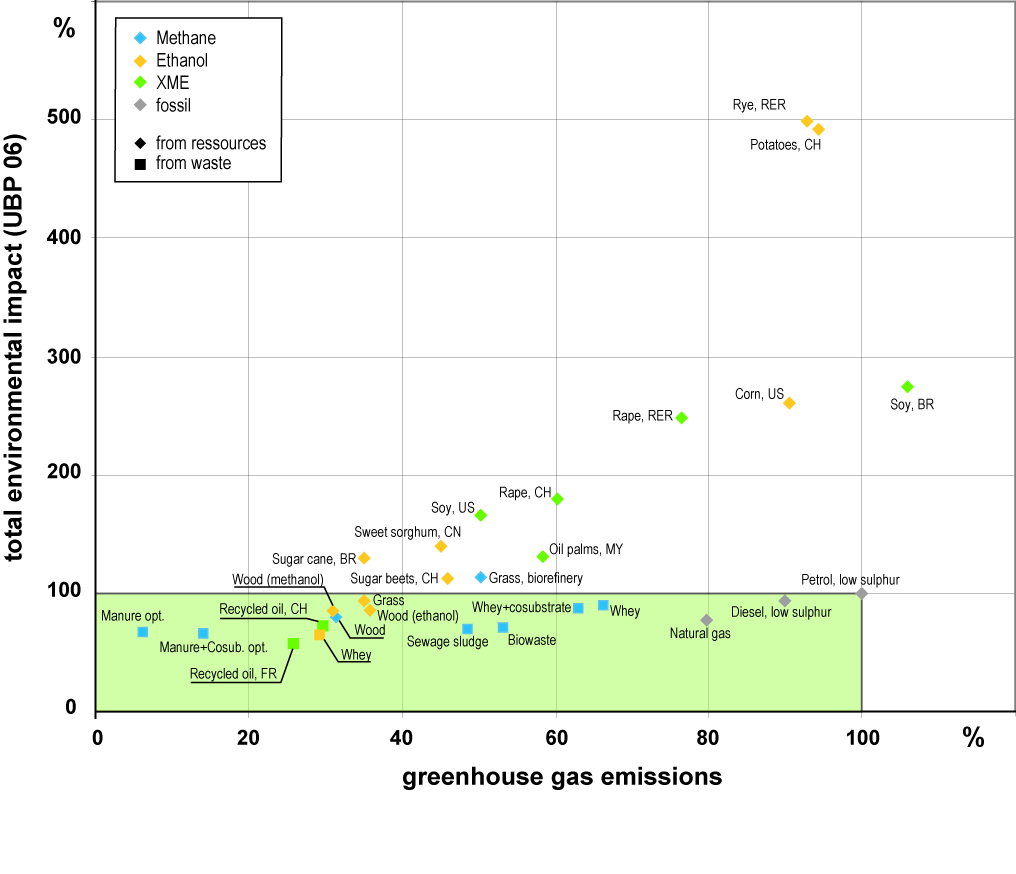
Figure 6: Two-dimensional representation of GHG emissions and overall environmental impact (UBP 06). Values are relative to fossil reference petrol. Green area means both lower GHG emissions and lower overall environmental impact than petrol. Click to enlarge to full size.

Figure 7: Two-dimensional representation of GHG emissions and overall environmental impact (Eco-indicator 99). Values are relative to fossil reference petrol. Green area means both lower GHG emissions and lower overall environmental impact than petrol. Click to enlarge to full size.
How high are the environmental impacts of fuel production per land unit?
Figure 8 shows the GHG emissions per hectare and year in comparison to the mileage that can be attained with the biomass grown on that hectare. The figure reveals great differences in agricultural cultivation, both as regards energy yield and GHG emissions.
The highest mileage can be attained with bioethanol from domestic sugar beets. The sugar beets give about the same hectare yield as Brazilian sugar cane (approx. 70 t/a), but have a slightly higher saccharose content than sugar cane because of the much lower fiber content. If one compares the mileage / ha with the GHG potential/ha, Brazilian bioethanol shows the greatest distance from the correlation line and thus the best ratio.
When one takes the cultivation forms "IP", "extenso" and "bio" among domestic agricultural products, there are lower GHG emissions obtainable with potatoes, rye, grass and rapeseed in extensive cultivation; however the mileage declines in a similar way, so no clear preferences can be seen.
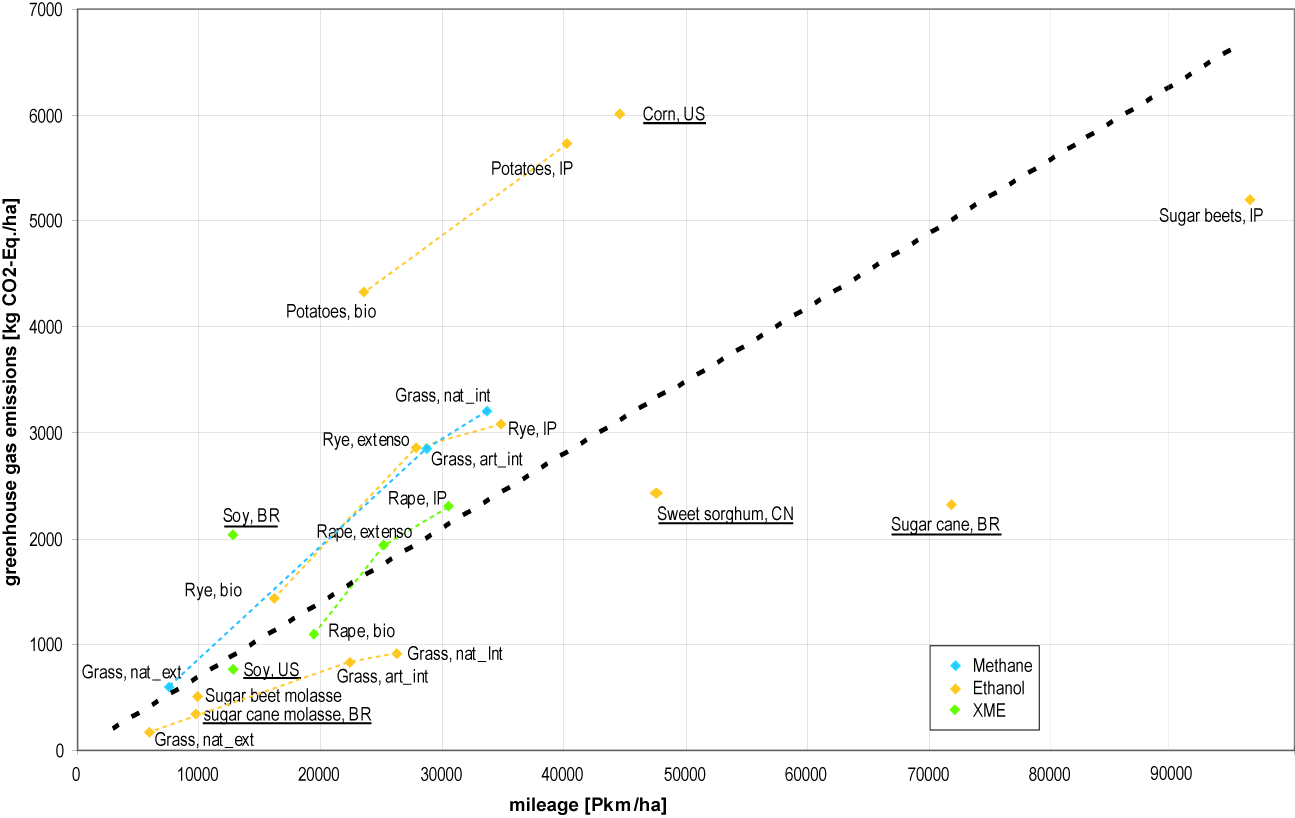
Figure 8: Two-dimensional representation of mileage and GHG impact per hectare for various energy plants. Black dotted line represents mean value (linear regression). Colored dotted lines connect various cultivation forms of respective products. Underlined = foreign product. Click to enlarge to full size.
Which energetic utilization is the most environmentally friendly?
Biogenic energy carriers such as wood, biogas or ethanol can be used for purposes other than fuel; they can also be used for heat and / or electric power, for instance. Not all these utilization possibilities are equally advantageous when seen from an environmental perspective because they involve different percentages of conventional energy carriers, many of them fossil. Therefore in this study we asked in a second stage what energetic utilization is the most environmentally friendly? This entailed calculating the resulting net utility for various biogenic energy carriers using the following formula:
Net utility = environmental impact avoided by using substitutes for fossil energy carriers - environmental impact (produced) by using biogenic energy carrier XY
The functional unit for these tests was a certain quantity of biogenic energy carrier (for instance, 1 kg of whey). This quantity yielded a certain quantity of energy to be used as heat, electric power or transportation. The environmental impacts of this quantity of energy and the quantity of fossil energy it is substituted for were calculated using the above formula, and then the net utility.
It was not possible within the scope of the present study to analyse all the ways that biogenic energy carriers can be used; instead this study has been limited to those cases for which specific data were gathered in the first part of the project including the utilization possibilities contained in the database ecoinvent. The study was limited to a comparison with those energy carriers that are common today, i.e. primarily fossil energy carriers.
Below you will find the results of the utility comparison for the stages Global Warming Potential (GWP) and the overall evaluation (using Eco-indicator '99 and the method of ecological scarcity, Version 2006) of all energy carriers tested. The following color scheme has been used to represent this summary:

This scale shows how high the utility of a biogenic secondary energy carrier is in comparison to its environmental impact. Since the primary interest is on a positive net utility, a scale has been used that is 25% asymmetrical. (Calculation example: 1 kg of biowaste as fuel yields a net utility given a GWP of 0.13 kg CO2-Eq. The requirement for fermenting biowaste to methane is 0.39 kg CO2-Eq. Thus the calculation follows: 0.13 kg/0.39 kg, corresponding to 33% and thus yielding a result according to the scale above of ~ for the range "-25% to +50%").
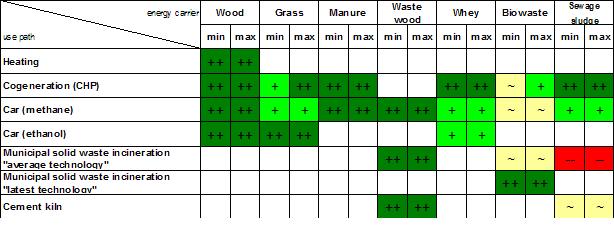
Figure 9: Net utility in relation to Global Warming Potential. Table shows all variations investigated in Chapter 4, where utility is plotted relative to environmental impact of biogenic secondary energy carrier (see text for explanations). Chapter 4 investigated two scenarios for production of conventional electrical power and heat respectively - causing net utility to fall somewhere between a minimal ("Min" column) and maximal value ("Max" column). White fields indicate variations not investigated. Click to enlarge to full size.
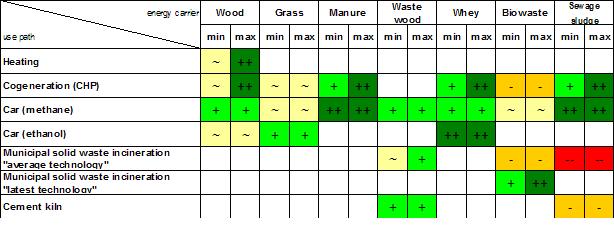
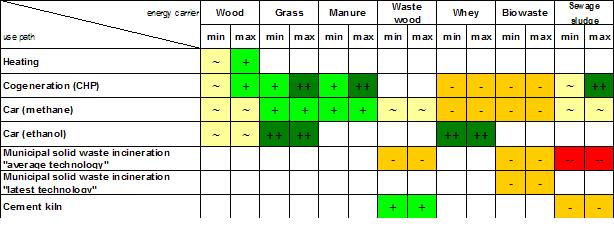
Figure 10: Net utility in relation to overall evaluation on basis of Eco-Indicator 99 (at top) and on basis of UBP 06 (at bottom). Table shows all variations investigated in Chapter 4, where utility is plotted relative to environmental impact of biogenic secondary energy carrier (see text for explanations). Chapter 4 investigated two scenarios for production of conventional electrical power and heat respectively - causing net utility to fall somewhere between a minimal ("min" column) and maximal value ("max" column). White fields indicate variations not investigated. Click to enlarge to full size.
The result for the GHG emissions in Figure 9 correlates with that for the cumulated non-renewable energy requirement (KEA). In most cases the utility is 50 and more % greater than the impact that using he biogenic energy carrier entails. However the situation does not look as positive only for the two secondary energy carriers biowaste and sewage with their high water content because using them often entails a whole series of drying steps connected with fossil energy consumption.
If one does an overall LCA using the methodologies Eco-Indicator 99 and UBP 06, one gets a somewhat more optimistic picture, as shown in Figure 10. However here too it becomes apparent that it is not so simple to find a biogenic energy carrier that gives positive results both as regards GHG emissions and environmental LCA. Utilization of liquid manure (from farms) brings the best results - as it shows up as good to very good in the two methods used. The use of biowaste, however, shows a much less positive picture. The main reason for that is the heavy-metal emissions that are released when the fermentation mass is used in agricultural crops.
A horizontal perspective that compares the various utilization possibilities (use in a CHP plant, as fuel, etc.) show positive and less positive sometimes even negative cases everywhere. Current-day incinerators do not appear to be very efficient in using biogenic secondary energy carriers.
All in all, it can be concluded from the comparisons done that using the biogenic variations tested here as substitutes for traditional fossil energy carriers will bring positive results as regards GHG emissions - i.e. less environmental impact. However many of the variations tested display clear disadvantages when compared with the fossil variations used today in other environmentally relevant aspects, so that an environmental LCA certainly does not produce positive results for using biogenic energy carriers in all cases.
Conclusion
The present study shows that with most biofuels a trade-off exists between minimizing GHG emission and a positive environmental effect. It is true that reductions in GHG emissions of more than 30% can be obtained with many biofuels; however the most of the production paths display higher impacts than petrol in various other environmental indicators. The transport of foreign biofuels into Switzerland is of only secondary importance. Instead, the manner in which the biofuel is produced is much more important.
The central finding of this study is that most of the environmental impacts of biofuels are caused by agricultural cultivation. In the case of tropical agriculture this is primarily the clear-cutting of rainforests, which sets great quantities of CO2 free, causes air pollution and has severe impacts on biodiversity. Concrete certification guidelines for biofuels that counteract these problems, for instance, like the guidelines of the Forest Stewardship Council (FSC) are urgently needed. In the moderate latitudes it is partially the low crop yields, partially the intensive fertilizer use and mechanized tilling that cause the unfavorable environmental impacts. Then one should search for an optimal ratio of energetic yield and low environmental impact through variety and crop rotation. A favorable environmental profile could also be achieved with the energetic utilization of agricultural co-products such as molasses or sorghum straw.
It is the energetic utilization of waste materials and residues that shows the lowest environmental impacts in this study because firstly the high impacts from the supply of raw materials are avoided, and secondly the environmental emissions can be reduced that otherwise would come from waste treatment such as waste water degradation with whey or the methane emissions that result from fertilizing with unfermented liquid manure. One critical factor is the high methane emission that at times comes from the production and processing of biogas. In this area as well, the overall LCA could be much improved by taking appropriate measures. On the one hand, these are already being done with new plants, whereas on the other hand, research work needs to be devoted to the separation of CO2.
The energetic utilization of wood also brings good results because the environmental impacts of supply of the raw material are very low. One possible technology for the future is the gasification of wood, if ever GHG-active methane emissions can be minimized through closed processing. However even if such processes are to be regarded as future perspectives, an evaluation of their future significance must still be left open due to the limited availability of the raw material and the many competing alternative forms of utilization.
The results of this study show on the whole that promoting biofuels, for instance, through a tax break, must be done in a differentiated way. Not all biofuels are per se suitable to reduce environmental impact as compared to fossil fuels. Of all the production paths tested, at present it is primarily the utilization of biogenic waste material and wood and the utilization of grass for ethanol production that bring a reduction in environmental impact as versus the fossil reference. Nonetheless the environmental impact of biofuels - unlike that of fossil fuels - can be reduced a lot by appropriate measures. Because of this optimization potential, one may expect that in future it will be possible to achieve better results for a number of production paths. In addition to this, innovative processes such as Biomass-To-Liquid (BTL) will become more important, although it has not been possible to include them in this study.
The potential of domestic bioenergy is limited today - and will remain so in future. If energy plants were cultivated in Switzerland on a large scale, it would have a negative influence on the food self-sufficiency of the country, or would cause added environmental impact by requiring the intensification of food production. Therefore our energy problems will not be solved by biofuels alone. Only if the biomass is transformed into energy efficiently and in an environmentally friendly way, while consumption is reduced and energy efficiency increased, could these alternative energy carriers play a role in our future energy supply that should not be neglected in conjunction with other renewable energy forms.
Glossary
allocation: Distribution of resource consumption and emissions to the co-products of a process. Allocation can applied according to various criteria: mass allocation, energetic allocation or economic allocation (according to the price of the co-products).
bagasse: Biomass remaining after sugarcane stalks are crushed to extract their juice. The cellulose rich bagasse is often used as a renewable feedstock for power generation and for the production of bio-based materials.
CHP: Combined Heat and Power: Cogeneration of electricity and heat.
BR: Ecoinvent country code for Brasil.
BTL: Biomass To Liquid is a (multi step) process to produce liquid biofuels from biomass. The Fischer Tropsch process is used to produce synfuels from gasified biomass. While biodiesel and bio-ethanol production so far only use parts of a plant, i.e. oil, sugar, starch or cellulose, BTL production uses the whole plant which is gasified by gasification.
CML: Environmental Impact Assessment method from the Netherlands based on → Midpoint indicators.
CN: Ecoinvent country code for China.
cogeneration: The use of a heat engine or a power station to simultaneously generate both electricity and useful heat (→ CHP).
cradle-to-gate: Cradle-to-gate is the → LCA of the efficiency of a product or service until it is produced or delivered.
cradle-to-grave: Cradle-to-grave is the → LCA of the materials used in making a product, from the extraction of materials and energy to the return of the materials to earth when the product is finally discarded.
DE: Ecoinvent country code for Germany.
Eco-indicator 99: Fully aggregating environmental impact assessment method based on damage data for various emissions.
ecoinvent: Swiss Environmental inventory database (www.ecoinvent.org).
ecospold: Data format for environmental inventory data based on XML, used by → Ecoinvent.
EDIP: Environmental Design of Industrial Products: fully aggregating Danish environmental impact assessment method.
EI99: Eco-indicator 99.
EURO 3/4/5: European emission standards defining the acceptable limits for exhaust emissions of new vehicles sold in EU member states. The emission standards are defined in a series of European Union directives staging the progressive introduction of increasingly stringent standards. Currently, emissions of NOX, HC, carbon monoxide (CO), and particulate matter are regulated Petrol and diesel cars have different limits. Date of introduction: EURO 3 -> Jan 2000, EURO 4 -> Jan 2005, EURO 5 -> Sep 2009 (planned).
FR: Ecoinvent country code for France.
functional unit: Quantified performance of a product system for use as a reference unit in a life cycle assessment study (→ LCA). Examples: "to fuel 1 MJ energy at a Swiss gauging station" or "to drive 1 km with an average Swiss car".
GLO: Ecoinvent country code for global average.
IMPACT 2002+: Environmental impact assessment method developed at EPFL Lausanne combining characteristics of → CML and → Eco-indicator.
CED: Cumulated Energy Demand: total amount of energy, that is consumed over the full life cycle of a product or service. In this study, only the non-renewable cumulated energy demand has been assessed.
LCA: Compilation and evaluation of the inputs, outputs and the potential environmental impacts of a product system throughout its life cycle.
Life Cycle Assessment: reg. → LCA.
molasses: A thick syrup by-product from the processing of the sugarcane or sugar beet into sugar. Can be used as feedstock for the production of bioethanol.
midpoint: Indicators that assess the environmental impact close to the source of emission (in contrast to endpoint indicators), e.g. global warming potential (→ GWP), eutrophication or ozone formation..
whey: The liquid remaining after milk has been curdled and strained; it is a by-product of the manufacture of cheese and can be used as feedstock for the production of methane or bioethanol.
MY: Ecoinvent country code for Malaysia.
Polygeneration: A plant producing three or more different forms of energy, e.g. electricity, heat, fuels and cold.
RER: Ecoinvent country code for Europe.
RME: Rape-Methylester. biodiesel from rape seed oil.
tank-to-wheel: From the (gasoline) tank to the (car) wheel. Desription of the energetic efficiency of the car..
GWP: Global warming potential is a measure of how much a given mass of greenhouse gas is estimated to contribute to global warming. GWP is usually indicated as CO2-equivalents. (CO2-eq.).
UBP: Umweltbelastungspunkte = environmental impact points: Swiss indicator for the aggregated environmental impact.
US: Ecoinvent country code for US.
well-to-tank: From the (oil) well to the (gasoline) tank. Life cycle efficiency of fuels from the source to the gauging of the car. Reg. → cradle-to-gate.
well-to-wheel: LCA of the efficiency of fuels used for transportation. The analysis is often broken down into stages such as → well-to-tank and → tank-to-wheel. Reg. → cradle-to-grave.
XME: X-Methylester: methylester ( = biodiesel) from any oil-containing biomass feedstock..
_________________
[1]; Jungbluth N., Chudacoff M., Dauriat A., Dinkel F., Doka G., Faist Emmenegger M., Gnansounou E., Kljun N., Spielmann M., Stettler C. and Sutter J. (2007) Life Cycle Inventories of Bioenergy. Final report ecoinvent No. xx (draft). www.ecoinvent.org.
[2]; www.ecoinvent.org.
[3]; The method of ecological scarcity (UBP 06). The mass unit consists of environmental impact points. This Swiss method estimates the total environmental impact from the difference between emission values and the legal limits.
[4]; A fully aggregated environmental evaluation method based on the proliferation and damaging effects of emissions.
[5]; A rebound effect occurs whenever an efficiency gain causes an increase in consumption, and the latter destroys the advantages of the efficiency gain.
[6]; Biogenic ETBE was also looked at in this study. However because it is similar to ethanol as regards its environmental impacts, the main difference being that it has a lower CO2 reduction effect because only about half of ETBE is based on biomass, it has not been represented separately in this Executive Summary.
[7]; The GHG emissions in the case of methane from liquid manure, optimized are negative because this case is based on the difference between them and the emissions during agricultural output of the unfermented liquid manure.
[8]; EURO 3 is the European pollutant standard for passenger cars that has been in force since Jan.2000. Since emissions are compared with reference to mileage, it is necessary to define a pollutant standard.
[9]; Total quantity of non renewable energy needed for the production and supply of a product (in our case a biofuel).
__________________Publication data:
Rainer Zah, Heinz Böni, Marcel Gauch, Roland Hischier, Martin Lehmann & Patrick Wäger (Empa): Life Cycle Assessment of Energy Products: Environmental Assessment of Biofuels, Berne, 22nd May 2007
Written under a contract from the Federal Office for Energy (BFE), the Federal Office for the Environment (BAFU) and the Federal Office for Agriculture (BLW):
Bruno Guggisberg (BFE), Daniel Binggeli (BFE), Lukas Gutzwiler (BFE), Norbert Egli (BAFU), Daniel Zürcher (BAFU), Amira Ellenberger (BAFU), Anton Candinas (BLW), Reto Burkard (BLW)
Project Management:
Niels Jungbluth, ESU-services Ltd., Uster
Critical Reviewer:
Fredy Dinkel, Carbotech, Basel
English translation:
Thomas Ruddy
The authors are exclusively responsible for the conclusions of this report.
A Life Cycle Assessment of Energy Products: Environmental Impact Assessment of Biofuels
PDF version
41 comments
A Life Cycle Assessment of Energy Products: Environmental Impact Assessment of Biofuels
PDF version
41 comments
Contact
- Content: editors at theoildrum dot com
- Tech support: support at theoildrum dot com
License

This work is licensed under a Creative Commons Attribution-Share Alike 3.0 United States License.
Impressive study indeed. It also shows what we all know. Biofuels can NEVER fill up the role of fossil fuels for transportation.
But it can be a part of the solution. With fossil fuels mostly gone, I guess that the biofuels should be used for important functions in the society.
For private transportation needs, what is viable seems to be electrical vehicles (with now known techniques that is). Then there comes the question if it is possible to manufacture all the cars with batteries that would be needed, if the private motoring should continue as today?
Probably not.
People will be forced to drive less, take the buses, the trains, the bikes, whatever. It'll be a long time until private cars can become a reality again, I bet.
"It will be a long time until private cars ..."
You imply that there will be some sort of nice, orderly powering down.
I don't believe that - at least not for those that matter (the rich).
In all honest only a tiny fraction of worlds population ever had a private car - and it's not possible to ever extend such a luxary to the world.
We have a lot of rich people who don't give a damm;
not about other peoples lives - in their own country or
others. They are currently fueling the destruction of China and, in essence, the planet. American delusions of grandure and printing cotton candy money are allowing the destruction to continue.
We will see the destruction of any welfare and social supports as those who have money keep on keeping on regardless of the destruction around them.
The military will go to biofuels as will Walmart and others and it will take food from the mouths of those who are helpless (read cashless).
Remember the carbon footprint of China and India and Indonesia is that of the CONSUMING FIRST WORLD - mostly the USA!
We have cleaned our air by moving all of the dirty mfg work offshore.
The capitalist economic system is utterly without morals or regard for anyone or even the health of the planet. The proof surrounds us and the whirlwind will not stop.
Cars are just one symptom of living an unsustainable life. I personally like the motto of "suppersize me". Ie my car, my body, my house, my possessions, my ego, ...
I see it every day with the god forsaken SUVs delivery obese parents and soon to be obese preschoolers and they're living in homes 2x larger than they need to be ... Often they're within walking distance of the place they are driving too...
http://science.reddit.com/info/2qsw4/comments
please help us spread this around. the authors appreciate it.
Talk about an indepth study ..
But if fossil fuels are necessary to produce biofuels with a real return of less than 1, what is the point other than experiments.
I would like to see a biofuel produced using biofuels as the energy source in the real world.
Your statement that "fossil fuels are necessary to produce biofuels with a real return of less than 1" is either an intentional falsification, or displays ignorance inconsistent with the time you have spent at TOD.
While US corn-based ethanol is a farce and clearly the worst of all options for producing ethanol, most studies give even it an energy balance of slightly higher than 1:1.
All efforts to investigate sugar cane-based ethanol production have shown a much higher yield. While these are not as comprehensive as the studies done for corn, they do indicate EROEI ratios between 8:1 and 10:1.
Had you read the study, rather than rushing to post your preconceptions, you would have seen that it treats various biofuel differently. Sugar cane-based ethanol is among the 13 biofuels that had GHG reductions of more than 50%. That alone should answer the question of "What is the point?". The study further points out that efficiencies in sugar cane could be improved by reducing fertilizer use without suffering significant crop yield losses.
Figure 8 is the most instructive in showing all of this. Sugar cane provides the best mileage per acre, while corn is about the worst.
Perhaps you don't want to bother reading the study, although it is quite short. Then how about just applying a bit of logic: How do you think sugar cane-based ethanol can reduce GHGs by over 50% if it has a "real return" of less than one?
This TOD story provides much of the background:
Report: Brazilian Ethanol is Sustainable
http://www.theoildrum.com/story/2006/10/10/171011/86
If that is not enough, here are five studies that all cite figures of positive 8-10 EROEI for ethanol from sugar cane.
1) FO Licht presentation to METI,
http://www.meti.go.jp/report/downloadfiles/g30819b40j.pdf
2) IEA Automotive Fuels for the Future
http://www.iea.org/textbase/nppdf/free/1990/autofuel99.pdf
3) IEA: Biofuels for Transport
http://www.iea.org/textbase/nppdf/free/2004/biofuels2004.pdf
4) Worldwatch Institute & Government of Germany: Biofuels for Transport (Link to register – study is free)
http://www.worldwatch.org/node/4078
5) Potential for Biofuels for Transport in Developing Countries
http://www-wds.worldbank.org/external/default/WDSContentServer/IW3P/IB/2...
I am all for tough debates on the many good and bad points of biofuels. However, we do need to move beyond intellectual dishonesty and propaganda.
No, all these studies show an EROFEI--Energy Returned on Fossil Energy Input--of 8 to 10. The steam and electricity in the refinery is raised from burning bagasse--which is energy--but this is not included as in input energy. Moreover, the surplus electricity is all credited back to the ethanol production. Think logically--ALL ethanol is produced by fermentation and distillation--and the bulk of the energy used in the process is simply raising the beer to the point of vaporization--1 BTU per pound of water per degree Fahrenheit. When you start with a dilute 15% beer mix and need to achieve 99.8% purity through distillation and dehydration, physical laws set the limits. So even if no other energy were used in the process from planting, harvesting, and transport, then the most sugarcane ethanol could achieve is 2.7:1 return. The CO2 consequences of using bagasse over fossil fuels of course is much better (which is the main focus of this analysis), but it shouldn't cloud the understanding of the energy consequences of sugarcane ethanol.
The issue of crediting is disputatious, but asserting you get an energy return of 10:1 on sugarcane ethanol is ludicrous. That would mean that only 8,000 BTUs would be required to produce a gallon of ethanol. Try offering a sugarcane ethanol producer 8,000 BTUs of energy per gallon and see what he could produce, when the absolute minimum distillation energy requirement is on the order of 15,000 BTUs per gallon, not to mention dehydration and other processes in the chain.
I'm all for moving beyond intellectual dishonesty as well.
Doesn't seem like it. I didn't claim an EROEI of 10 for sugar cane. I pointed to a set of reports that document how they reached that conclusion. I did say that the studies were not equal to US corn studies. I have cited reports from the Worldwatch Institute, German governmnet, and the World Bank. You have just offered opinion.
We can discuss EROFEI. Fine. That is more accurate, but the distinction is small. Sugar cane does produce bagasse and it is used to provide the heat for distillation. So, there is no theoretic reason why you couldn't distill ethanol at far less than 8000 BTUs of fossil inputs if 100% of the energy that goes toward providing the heat comes from bagasse.
Almost all of the energy input to sugar cane production comes from fertilizer. I don't need to offer sugar cane producers any BTUs. They already have a similar deal and have been producing in Brazil since before I was born.
So, Mr. Logic, how then does sugar cane based ethanol reduce GHGs by 50% and why is that not a good reason to use it as a fuel?
The promotion of sugarcane ethanol based solely on its lower fossil fuel needs is intellectually dishonest. I don't know you or your orientation, so I can't comment on that.
I didn't offer an opinion. I offered basic science facts, since I'm a scientist and that's what I do.
What I said is that you couldn't produce a gallon of sugar-cane ethanol with 8000 BTUs of energy of any form, including bagasse. These studies make the energy return of sugarcane ethanol look so high because they both omit the non-fossil fuel inputs as energy (which they are) and because of co-production credits. From a CO2 point of view, this is fine, but not from an energy point of view.
Sugarcane ethanol reduces CO2 emissions over petroleum gasoline because of the non-fossil fuel inputs to its production, but it doesn't take any less energy to produce it than if you only used fossil fuels.
CO2 isn't the only thing to be concerned about.
Sparaxis
You’re not doing too well here. If you are not being dishonest then you are very confused.
1. "The promotion of sugarcane ethanol based solely on its lower fossil fuel needs is intellectually dishonest."
I don't see where Jack is doing this. He started out with this:
“Your statement that "fossil fuels are necessary to produce biofuels with a real return of less than 1" is either an intentional falsification, or displays ignorance inconsistent with the time you have spent at TOD.”
This relates to the EROEI, nowhere did he say that he was doing an exhaustive comparative study.
2. “I don't know you or your orientation, so I can't comment on that.”
What does this even mean? What are you talking about? What orientation? North-South, East West, sexual, does it matter?
3. “I didn't offer an opinion. I offered basic science facts, since I'm a scientist and that's what I do.”
Anyone can cite facts, but not everyone understands their relevancy.
“These studies make the energy return of sugarcane ethanol look so high because they both omit the non-fossil fuel inputs as energy (which they are) and because of co-production credits.”
Uh, but the EROEI calculation for oil doesn’t? Try including the oil energy as an input and see what kind of EROEI you get. Are the oil co-products given credits?
4. “CO2 isn't the only thing to be concerned about.”
Earlier you accused him of being concerned only about EROEI.
Yikes!
I'm not accusing Jack of anything. I don't know him. I'm sure he's a fine upstanding person. I'm accusing studies and reports that promote sugarcane ethanol based solely on its lower fossil fuel needs as being intellectual dishonest, in part because they tend to conflate fossil fuel energy with just "energy". Perhaps my pronouns were vague? Should have I used "one" instead of "you"?
The relevancy of the facts I cited is that it is thermodynamically impossible to get a 10:1 ENERGY return on sugarcane ethanol. It is possible to get a 10:1 FOSSIL energy return on sugarcane ethanol. Further, I distinguished that the focus on FOSSIL energy is fine if you are concerned about CO2.
I don't understand your point about "oil" EROEI. Are you talking about crude oil, in which case there are no coproduction credits involved? Or an oil product, which is the combination of a crude oil EROEI and a conversion efficiency?
I didn't accuse anyone about anything. I'm not the ad hominem type.
Ok, maybe I was too harsh, but here is my point: Do we really care about the EROEI of "ethanol" or do we care about the EROEI of sugar cane?
Wouldn't a lot depend on how the EROEI is defined?
Jack attacks a statement that fossil fuels were required to get an EROEI of greater than one. You respond by saying: No, it's EROFEI.
I really haven’t looked at the studies too much yet, but I don’t need to because your argument doesn’t make sense.
You can’t just say that EROEI can’t be 10 because it takes more than 8000 btu to distill it. If the energy to distill the ethanol comes from bagasse, then you do not count it as an input.
Please show why the studies are wrong, i.e. show that energy in the ethanol is less than ten times the energy that was invested. Use a starting point of a bare field and an endpoint of ethanol. Lets say I had a field, with an ethanol plant on it. The EROEI is the energy out of the field divided by the energy into the field.
Thank you for keeping this going while I was asleep here in Thailand.
It seems clear that the original comment tacked on to Prof Goose's call to promote the story was an uneducated hit piece that doesn't show any evidence that the author even read the study.
However, Sparaxis does have a point, although it doesn't directly contradict mine. Yes, sugar cane-based ethanol looks very different on EROEI and EROFEI metrics, largely because of the use of bagasse to provide heat and sell power externally (which provides an offset).
If there were a perfect regulatory environment and significant use of energy in transport, things could be quite different. In that case, demand for electricity for bagasse could compete directly with demand for ethanol as a transportation fuel. Then, maybe the energy is bagasse would not belong to the sugar cane alone, but would be already a part of the energy system. Then, it would not be included in the ethanol EROEI calculations.
I am not a huge advocate of liquid biofuels. Over time, it seems to be crop acreage will be a base resource that goes into fuel production, like it or not. In that case, I think electricity is a far better pathway. But we are not there yet.
It seems that for developing countries in tropical regions, sugar-cane based ethanol makes sense economically and environmentally in the meantime. I don't have any problem with diverting sugar from the food chain. I do not think tropical forests are being impacted much by ethanol (although they may be for soy and palm oil) and do think that sugar cane for fuel will be largely unirrigated.
Corn-based ethanol seems to be completely bankrupt and would not even be looked at without subsidies in the forms for cash, free water and externalization of environmental damage. I don't think all ethanol sources combined will ever provide much more than 5% of liquid fuels.
But in the right environment and until transportation moves to electricity as a fuel source, I do think some ethanol can make sense.
Good remarks Jack, I share your opinions (electricity, Brasil-EtOH, USA-EtOH) as one of the authors of the study. Biofuels may be ok under very specific conditions, but for the future we have to look at alternatives with much higher efficiencies (yes, sunlight-to-electricity!). Biofuels produced out of organic wastes look very promising, but produced out of food it's not only problematic from an ethical point of view.
Thank you. I do think we are on the same page. I tend to agree that there are disturbing potential ethical issues related to competition between fuel and food. However, it is not as clear cut as some make it out to be.
One could make an argument that the poor benefit more from fuel than from sugar, tobacco, alcoholic beverages, etc. So, we would have to infer that there could be ethical issues involved in using so much land for these products. Likewise there is so much waste in processed foods and meat consumption.
Why do some people consider diverting sugar to ethanol as evil, when diverting corn to livestock feed is just fine?
"ALL ethanol is produced by fermentation and distillation"
Nice try. I'll give you a 'E' for effort though. Even make it scratch and sniff just for you Spar =]
Wouldn't it be possible to use a heat engine to suck heat energy out of the condenser to pre-heat the beer? Under these circumstances, I would expect you could reduce energy requirements by at least the 3:1 typical efficiency you get from an air conditioner. Its not like you need to keep the de-alcoholized beer hot. All you need to do is move the heat around some.
Besides, simple heat is easy to get. Locate the place next to a generating facility, or use concentrated solar power.
Why not use a counter-flow heat exchanger to recapture the heat of vaporization from the distillery and use it to evaporate incoming beer? The necessary heat input could probably be reduced a lot, since you want the output to be cool eventually, anyway.
Zowie.
I was surprised to see a report about soils in my neck of the woods (Ontario Canada) posted on http://www.NewFarm.org (Rodale Institute):
http://www.newfarm.org/features/2007/0907/biofuels/button.shtml
Some snippets:
It can take as little as three years to effectively burn your way through most of the 50 to 100 tonnes of humified organic matter in a typical acre of Ontario's corn producing soil. Once you burn through that organic matter, however, it may realistically take three lifetimes to build it back up.
...
Ontario could only afford to divert 2.7 percent of its corn stover to off-farm processing, assuming that the spent stover isn't returned to the field after processing. Even in years with growthy crops, such as 2005, the province could only export 9.5 percent of its stover.
...
there's essentially no room to export soybean top growth, since soybeans produce so little organic material. More surprising, though, is the team's conclusion that Ontario also cannot afford to export wheat straw off-farm for energy processing. That's because 450,000 tonnes are taken off for straw, and that's already stretching the limits.
"We need to look at the soil as a finite resource," McKague says. "We haven't got a lot of organic matter to spare."
** Are we smarter than yeast? Will we foul our nest to
** consume and continue to supersize our vehicles homes
** and people to destruction?
I didn't see any mention of the nitrogen cycle and sulfur emissions. Did I miss it? The nitrogen imbalance has a major impact on the environment yet rarely gets considered. Di-nitrogen from the air gets combusted to form NO2 and NO3 which is biologically available. In order to mitigate environmental impacts perhaps we should convert it to fertilizer in our cars.
Better yet, move to rail based personal electric vehicles.
By focusing on specific niche solutions we can solve Global Warming and Peak Oil, mitigate is a better word.
The need is for mobility. Yet most efforts are focused on filling a gas tank. Why do we assume it is necessary to move a ton to move a person?
There are the numbers for solar powered mobility networks. Their niche is highly repetitive congested travel; kids to and from school, commuters to and from work, shoppers to and from retail centers. This is carbon-zero mobility:
Thomas Edison, 1910:
"Sunshine is spread out thin and so is electricity. Perhaps they are the same, Sunshine is a form of energy, and the winds and the tides are manifestations of energy.”
“Do we use them? Oh, no! We burn up wood and coal, as renters burn up the front fence for fuel. We live like squatters, not as if we owned the property."
“There must surely come a time when heat and power will be stored in unlimited quantities in every community, all gathered by natural forces. Electricity ought to be as cheap as oxygen...."
If we focus on mobility, we have a lot more options. There is a synergy between transports need for distributed power and sunshines ability to deliver that power along routes.
It costs less to move less.
Some folks here might be interested in a recent project that members of assorted San Francisco Bay Area peak oil groups have put together. We have created a DVD entitled "The Myths of Biofuels," which features a presentation by David Fridley of Lawrence Berkeley Lab (and active member of our local peak oil "community").
http://www.sfbayoil.org/sfoa/myths/
It's possible to get a copy of the DVD at the cost of materials by following the links on that URL. The site information gives one a pretty good idea of the content.
David Findley’s “The Myths of Biofuels” debunked in 5 moves...
Findley: Grain ethanol has 0 energy return (he actually graphs grain ethanol as less than ‘0’)
Reality: Utter nonsense.
Findley: Cellulosic ethanol is not much closer to being brought out now then we were 20 years ago.
Reality: 6 commercial-size cellulosic ethanol plants have been commissioned for the U.S., while Dedini S.A. of Brazil has made the US$1/gallon breakthrough on bagasse-derived ethanol and have commissioned a US$53 million pilot plant as a next step towards commercial capacity.
Findley: The amount of fossil energy that we consume every year exceeds the amount of energy that is captured from the sun in every plant in America.
Reality: Although Mr. Findley correctly frames the peak oil – liquid transportation fuel dilemma, he fails (intentionally/unintentionally) to address the crux of the issue which is –as I have pointed out on this forum for what seems like forever- that biofuels are a response to declining petroleum supply, not fossil fuel supply.
Findley: Biofuels create a market linkage between food & the world oil price.
Reality: Wow. I mean WOW. This assertion, especially from someone who is peak aware and promotes ELP, is simply mind numbing. The food we eat has a fossil fuel/caloric input ratio of 10/1. Ergo the doubling, tripling or quadrupling cost of the corn in your corn flakes is nothing, repeat NOTHING compared to the cost effect that $100/bbl or $200/bbl will have on that same box of cornflakes.
Findley: The media (re: biofuels) is biased and full of inaccuracies
Reality: Starving Mexicans comes to mind; rainforest cleared for ethanol production is another; crazy biofuel proponents who claim that existing LTF usage levels can be maintained presto-changeo.
Yes… bias and inaccuracies indeed.
I need to re-read this later but a couple of quick points on criteria that seem to be missing on first reading. Firstly nothing that I know of beats the energy density (10 kwh per litre) of liquid fuels that will be needed to extend the range of plugin hybrid cars.
Second I agree the focus should be on forestry waste and garbage, minus nonferrous metal and chlorinated plastic. However the study doesn't seem to address high startup costs for full cycle gasification plant which could be part of the reason we have corn ethanol instead. Moreover another citerion, resilience, works in favour of forestry waste rather than food crops. The study could also have looked at how vulnerable we are to events such as crop failure.
As someone who was driving sugarcane derived ethanol powered cars in Brazil back in the 80's I have more than a few reasons not to be overly enamored of the concept. In my opinion it is but a stop gag measure to derive biofuels from crops that may have to compete for scarce land resources that could be better used for food production. However I noted one apparently glaring omission from the list of possible sources for the production of Biofuels, algae. http://www.oilgae.com/
Pen, conductor on the Santa Fe Southern, reports that biodiesel apparently get less miles/gallon [gallons/mile] than regular diesel.
LET's abandon these bio-stunts once and for all - shall we ?
FIRSTLY – absolutely an impressive analysis, but why make it hard when you can make the case obvious and easy – I’m not getting these insane bio-stunts anymore – to me this case is so very closed … and here is why ..
…. its time to sober up and do some REVERSE ENGINEERING on these bio-stunts happening “all over the place”
– this bio-fuel future is incredible easy to scrap (!)
How ? .. First we take two eggs, a fist of flour and some yeast… joke aside
In having a fast peek at World Grain Production – from that link containing this chart
In reading this essay we learn that 2000 million tons of various grains are produced annualy in resent few years ….
This amounts to 2 000 000 000 000 kilograms (or about 300 kg pr capita/person/world)
Now … anyone remember “That Cubic Mile …?” , heavily discussed here at TOD in February this year.
Short : this post revealed that world annual crude extraction was totally round and about ONE cubic mile.
And that ONE Cubic Mile (1 mile = 1609 m), converted into metrics renders (1600m * 1600m * 1600m) = 4 096 000 000 m^3 ……. (And for ease I’ll keep 1 liter of crude ~ 1 kg, spawning m^3 = 1000 kg)
One Cubic Mile of crude oil then comes to: 4 096 000 000 000 kg
ALREADY here we see clearly without doing any advanced thinking to the issues in question that –
Any more to add here (?)
-I mean those 2 Giga tons of of grains ( wheat, corn , rice, sorghum ..) ARE Eaten Every Year these Years – as the World Grain Reserves ARE GOING DOWN - FAR DOWN, they are in the vicinity of 50-60 days only, and going further down.... chill
Keep in mind – my fast calculator-trick here never even addressed the realities of EROEI or any other ifs or buts . In a future of dwindling fossils THE wrooooom ICE is dead – buried and not missed, hey its only converting 15 % of its contained energy into propulsion ..
How slim will you accept to become, I mean before you give up your car ?
A bio-jezz, thats what we have
Have you also quick calculated how many Giga tons of Phytoplankton you might be able to harvest from the world's oceans. About 330 million sq km of surface area and let's say roughly 100 m. depth. Also let's not forget zooplankton rich in protein and oils, which doesn't depend on light penetration for photosynthesis and can be harvested from much deeper waters. My guess is that biofuels will be harvested from the oceans at some time in the not too distant future.
yeah FMagyar , and twinkling in the sky there is a diamond star of 10 billion trillion trillion carats ... go for it FMagyar ... go , go fetch, its there
http://news.bbc.co.uk/2/hi/science/nature/3492919.stm
You see the pace for calculations doesn't make em' wrong (!) mine are all fine.But as I read you - you didn't get my gist to the challenge ...
That plankton counting and "juice'fication" I'll leave for you FMagyar
Paal, Maybe you missed my post up thread where I mention my less than complete endorsement of the one biofuel that I am personally familiar with. Namely, Brazilian sugarcane derived ethanol. Just for the record I was driving a 100% ethanol powered car back in the 80's so I actually have an idea that it is a somewhat feasible concept. I also had opportunity to visit the sugarcane plantations and saw first hand the pollution and deplorable social conditions that some of their workers had to endure. BTW I wasn't criticizing the accuracy of your calculations nor was I disputing your conclusions based on those numbers. I'm just suggesting that those may not be the *only* options available. Biodiesel from algae (phytoplankton)is most certainly not in it's present state of development a viable alternative. However there are a few venture capitalist and scientist teams out there that have been exploring these possibilities. There is nothing that I have read that indicates that this is utterly nonsense as your previous post seems to imply. One of those teams might actually find that diamond yet.
Hey hey paal myrtvedt,
That is the single most disturbing post I have yet seen on this site.
Tim
yep, disturbing is the only word covering this utterly insane behaviour (!)
The Central Valley of California is the world's leading producer of Vitis vinifera (Common Grape Vine) which contains 25% sugar and thus is the ideal biofuel crop. Why wait for the rest when you can grow the best? The ancient romans may have powered their chariots with this perfect biofuel. Later studies have suggested that grape sugar outperforms cane sugar by a factor of 2 to 1.
what are you talking about?
romans powering chariots with ethanol?
joke?
--
All these memories will be lost in time
like tears in rain
I've re-read the article and I still don't have a
grand theory, just a couple more observations.
1) N2O from corn fields
I suggest upstream carbon taxation. The synthetic nitrogen factory should be taxed both on current CO2 factory emissions and N2O (based on CO2 equivalence) that will be released later by farmers.
2) the 'efficiency' of cow poo methane
No way. The beasts use large acreages of irrigation water and fertiliser from off-farm sources, overwhelming the on-farm capture of rain and sunlight. The digester has to be cleaned out and the muck spread back on the field with machinery, also needed to aerate the compacted soil. The world would be better off with a few billion less hoofed animals.
Re: Life Cycle Assessment
Honestly one of the best and most balanced pieces of work I've seen to date. My 2 cents worth:
1) Increased SMOG levels of biofuel usage are more than offset by other carcinogenic reductions vs. gasoline(benzene for instance) that were not investigated in this study.
2) One can hope that the next report will take into account the GHGs produced from exploration/extrapolation/expedition of oil, much the same as biofuels are forced to account for the GHGs produced from cultivation.
And for those TODers who have followed my work...
The conclusion highlighted below, might just as well have been pulled from my TOD commentary -proving yet again- that TODers sit squarely in the front seat of the roller coaster we ride.
"Because of this optimization potential, one may expect that in future it will be possible to achieve better results for a number of production paths. In addition to this, innovative processes such as Biomass-To-Liquid (BTL) will become more important, although it has not been possible to include them in this study."
ThanX for the flowers Syntec.
To your 2nd point: Of course we analysed fossil fuels the same way as biofuels, accounting all the LCA-chain. But the fossil data is older than the biofuels data, which means that it's not reflecting the actual exploration schemes including oil sands, heavy tars etc. This would worsen a bit the result for gasoline/dieses and show better results for biofuels (in relation to gasoline as reference). So for the future (next study if somebody pays for it...), technological progress for biofuels will improve the results and more efforts to process oil will worsen the fossil results.
Wonderfully thorough, real scholarship ; thx to the authors.
Does Moritz read this stuff?
- Moritz Leunberger is the Swiss Minister of Energy.
Err. between signing gas deals with Iran. ;)
merci for the compliment, Noizette. I assume Moritz Leuenberger reads it, maybe not all 200 pages but the executive summary (which we published here). After all he is one of several ordering the study (not personally of course but via his federal offices). I find it an important move that a country wants to base fuel taxing decisions on environmental impacts, that's rather extraordinary even for Switzerland! I am really anxious to know which conclusion our political system and the administration will draw from the results of our study.
rolf_w
cool people ride electric
Corn and Rapeseed Biofuels Release More Greenhouse Gases Than Petroleum
Shockingly, a new scientific study finds that two prominent biofuels release more total greenhouse gases (GHG) [more] than burning comparable amounts of oil and petroleum. Corn based biofuel [search], prevelant in the United States, was found to release up to 50% more GHGs than oil; and rapeseed based biofuel [search] which is the norm in Europe was found to release as much as 70% more GHGs. This finding highlights the fact that carbon is not the only GHG to be considered in fuel.
http://www.climateark.org/shared/reader/welcome.aspx?linkid=84545
Yes one can suppose that, and Moritz. L. is knowledgeable, diligent and thorough, no fool.
Still, the energy policy is ‘growth’ - or ‘security’ as some would put it.
ALL avenues to be explored... so Switz. invests massively in the TAP, trans-atlantic pipe line, to obtain some x amount of natural gas.
The Pres. of Switz. Micheline Calmy-Rey, and the aforementioned Moritz, Energy Minister, met with Nozari (interim Minister. of Petrol, Iran)... I imagine cheese fondue by candlelight, cosy helicopter rides to melting glaciers..and the inevitable white wine... but perhaps Nozari ordered Pepsi Cola...
So the Iranians say it is a milestone accord (CH - IRAN) which can inspire other European countries, and Washington has expressed its extreme displeasure. The Swiss ignored the US.
Meanwhile, France has its nickers in a twist, with its FM, Kouchner, the french doctorr spouting out about war with Iran - even Sarkozy saw fit to dampen him, or deny that particular formulation, as energy accords etc will, must be, signed.