US Petroleum Supply: Some Overview Graphs
Posted by Gail the Actuary on November 14, 2007 - 11:00am
The US Energy Information Administration (EIA) puts out a lot of data. Even for the United States, the amount of data is overwhelming. To get an overview, I have prepared some graphs showing information I find interesting, and occasionally somewhat alarming. I include links to the underlying data, so those who are good with Excel can find data to make their own graphs.
1. EIA reports show oil production on a "total liquids" basis. What does this include for the United States?
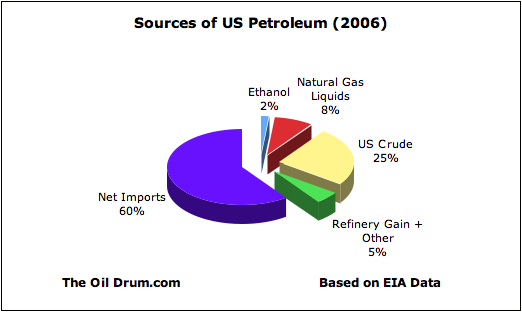
Figure 1
Discussion follows below the fold.
Figure 1 indicates that only 25% of US "total liquids" fuel production comes from US crude oil. Approximately 60% comes from net imports. We actually export a small amount of petroleum products (for example, fuel in airplanes leaving the country), so 60% is the net contribution when exports are considered.
The remaining 15% is from lower BTU contribution items:
• Ethanol - Ethanol accounted for 2% of 2006 "total liquids" oil production. Its BTU contribution is about 70% of that of gasoline, so the sliver would be even smaller, if it were on a BTU content basis. To produce this tiny sliver of ethanol required 20% of the US corn crop, plus a large amount of fossil fuels and fresh water. This is a link to an article I wrote about corn-based ethanol.
• Natural gas liquids - These are the liquids that separate out when natural gas is produced. Like ethanol, they are of lower BTU content than gasoline. Since the US is a major producer of natural gas, we have quite a bit of these.
• Refinery processing gains - When petroleum is refined, the volume of the finished product is greater than that of the components that entered the refinery. The BTUs are not correspondingly higher, however. In 2006, approximately 70% of the refinery gain related to oil which the US had imported; 30% related to our own production. Oil production accounting gives the US credit for the entire gain, including that relating to the processing of imported oil.
Data for Figure 1 is from here (Table 1.1c or 4.1c for crude; Tables 1.3 or 4.3 for natural gas liquids, and Table 1.4 or 4.4 for "all liquids"); here for ethanol (click on monthly to get 2007 ethanol data); and here for net imports. I used "total product supplied" from here as my base. It differs by a small inventory change amount from what one gets by adding US total liquids to net imports.
2. How does US petroleum break down by product produced?
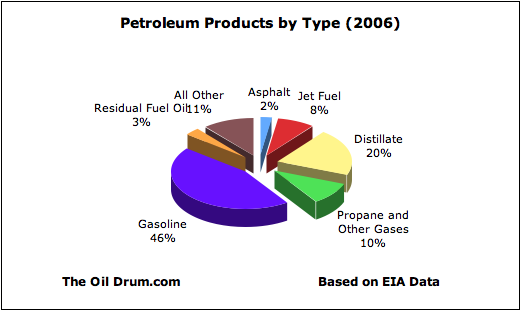
Figure 2
Figure 2 shows that the largest component of petroleum products is gasoline, amounting to 46% of the total. The second-largest component is "distillate." This is really a combination of diesel fuel (the majority of this category) and home heating oil. The sliver designated a "residual fuel oil" is a less-refined piece. It is used as "bunker fuel" in boats, and for various industrial uses.
The All Other category, amounting to 11% of the total, consists mainly of oil used as a raw material for the manufacturing of products such as plastics, textiles, building materials, pharmaceuticals, dyes, and a huge number of other items. Many people are surprised to learn that many manufactured products have oil as a raw material.
In the United States, almost no oil is used for the production of electricity. Instead, coal, nuclear, natural gas, hydroelectric, and (recently) wind are used for that purpose. Oil can be use to produce electricity, but it tends to be expensive compared to other fuels. Backup generators often are powered by diesel.
It might be noted that it would be virtually impossible to convert to, say, 100% gasoline produced from petroleum. When petroleum is refined, the chemical structure of the output varies, with part of the output being best-suited for gasoline, part best-suited for diesel, and so on. With additional processing it is possible to "tweak" the percentages a bit, but to a significant extent, the output is determined by the petroleum used as input.
The supply percentages shown in Figure 1 reflect a combination of products the US produces by refining petroleum, together with the finished petroleum products the US imports. We are able to import extra gasoline, because Europeans tend to use diesel for their cars, so there is some left-over gasoline from the product mix refined for use in Europe.
Data for Figure 2 is from here.
3. What is the trend is US petroleum production?
To look at trends in US production, I have developed some graphs that are unusual in two respects:
• To give an idea of what kind of production we might expect for 2005 through 2007, I fitted an exponential trend line to data preceding these years, and extrapolated it to 2005 to 2007. The fitted trend line gives us an indication of the annual percentage change in production we would expect based on 2004 and prior data. By comparing how the fitted trend line compares to recent data, we can see how recent production deviates from what we might have expected, based on earlier information.
(For the more technically inclined) The selected data points used for determining the trend line vary somewhat from graph to graph. The latest point for the fitted data is always 2004. Enough points are used prior to 2004 to give what appears to me to be a representative recent trend line. Generally, the entire 1991 to 2004 period is used for the fit; if there appears to be a change in trend, I use a shorter, more recent period - say 1996 to 2004. This is admittedly a bit subjective, but the result is not expected to be exact.
• In the graphs I show annual data. Since I do not yet have an "actual" data point for 2007, I instead show the latest available year to date value (August 2007 YTD, from the November report). Using the August 2007 year to date value gives a general idea of where production is headed in 2007. Since these are average daily production amounts, they are not distorted by the shortened time period in the same way that total production amounts would be. One would generally expect the full year averages to be a little lower, if amounts are trending downward; or a little higher, if amounts are trending upward.
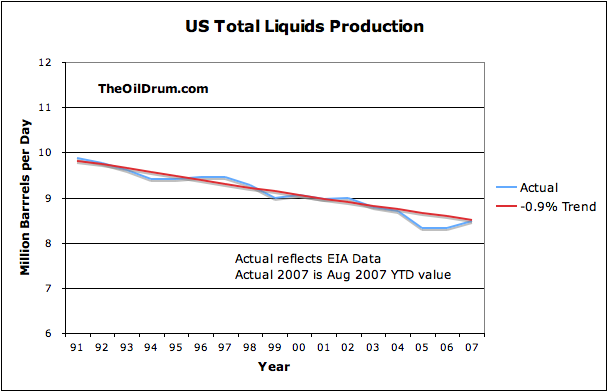
Figure 3
Figure 3 shows that prior to 2005, US "All Liquids" oil production was trending downward at -0.9% per year (slightly under 1% per year decline). There was a dip in production in 2005 and 2006, but by 2007 production seems to be approximately back to where we might have expected, based on the prior trend line. Data for Figure 3 is from here Table 1.4 for recent years; Table 4.4 for older years.
We can't know precisely the cause of the dip in production, be we do know that 2005 was a very bad year for hurricanes in the Gulf of Mexico, including hurricanes Dennis, Katrina, and Rita. The timing of the outages, and the rapid drop in the monthly production amounts at the time of the hurricanes, suggests that hurricane damage played a major role in the production decline.
Total Liquids shown in Figure 3 can be divided into US Crude (Figure 4) and US Other Liquids (Figure 5).
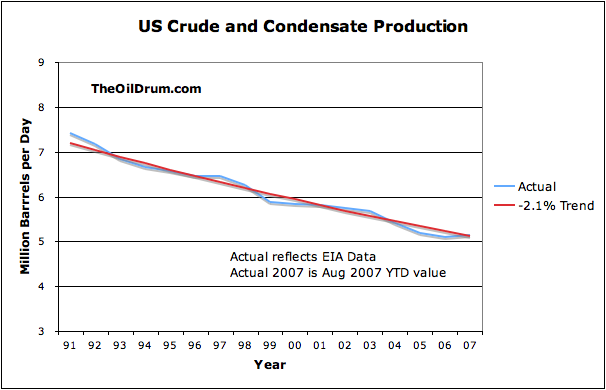
Figure 4
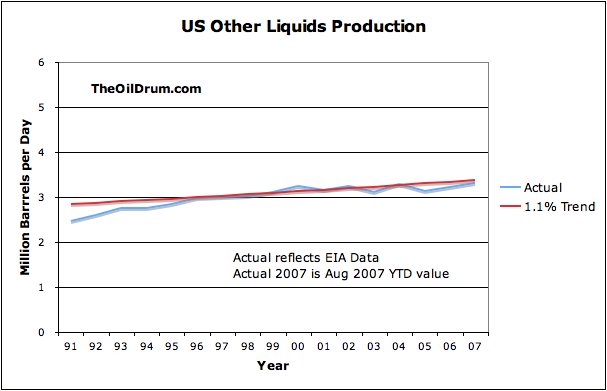
Figure 5
If we look at these separately, we find that US Crude (Figure 4) is trending downward at about -2.1% per year, while Other Liquids (figure 5) is slightly increasing, with an indicated trend of 1.1% per year. Both show dips during the 2005 and 2006 period. These dips are not unexpected, since both crude oil production and natural gas liquids can be disrupted by hurricanes.
The data for Figure 4 is from here (Table 1.1c and 4.1c). "Actual" data for Figure 5 is obtained by subtracting actual data for Figure 4 from actual data for Figure 3.
Note that ethanol is included as part of "other liquids." Ethanol production is growing rapidly, but is of such small volume that it hardly makes a difference on the graph. Ethanol volumes (from here) amounted to the following amounts for recent years:
2004 0.2 million b/d
2005 0.3 million b/d
2006 0.3 million b/d
2007 0.4 million b/d
4. How about imports? The production trend data we have looked at so for relates to US produced oil.
Figure 6 shows that imports in 2006 and 2007 have dropped below the trend line.
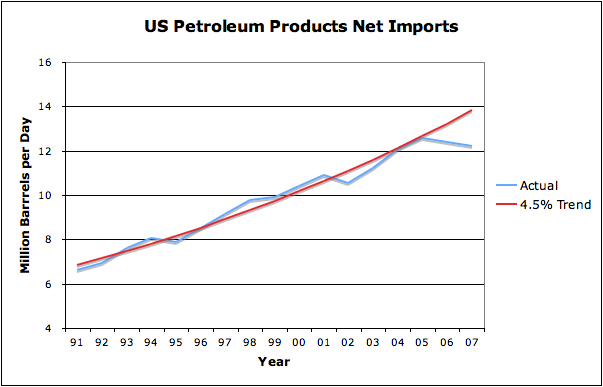
Figure 6
Prior to 2005, imports were increasing by about 4.5% a year. This has recently changed, and imports are actually declining. The shortfall between expected imports and actual imports is 0.9 million barrels per day for 2006 and 1.7 million barrels per day for 2007 (using August YTD data for 2007). If imports continue to decline in 2007, the shortfall could be even greater by the end of the year. Data for Figure 6 is from here.
5. What does the trend in Total Product Supplied look like?
Total product supplied represents the combination of US production and imports, adjusted for inventory changes. It can be thought of as all of the gasoline, diesel, and other fuels shown in Figure 1. The trend in Total Product Supplied was about 1.6% per year prior to 2005, but actual production in 2006 and 2007 has dropped below this trend line.
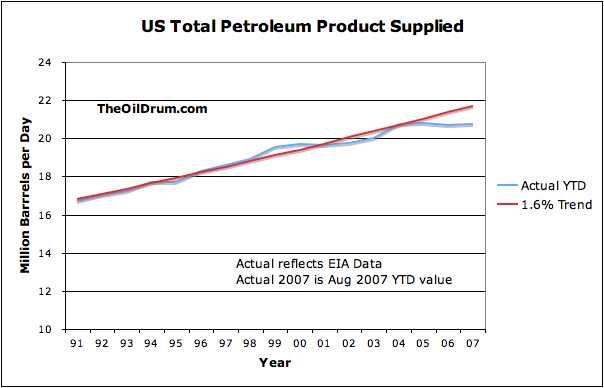
Figure 7
Data for Figure 7 is from here.
6. Gasoline is the biggest component of Total Product Supplied. What does its production trend look like?
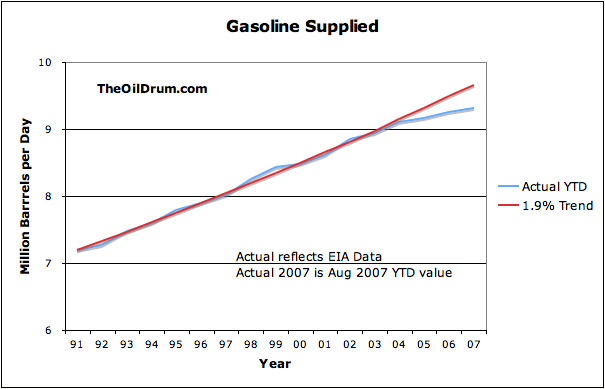
Figure 8
Until recently, gasoline production was increasing at 1.9% per year. This is higher than the increase of 1.6% per year increase in Total Product Supplied. Gasoline production started dropping below the 1.9% trend line in 2005. The amount of the shortfall between the trend line in the actual is
approximately:
2005 150,000 barrels per day
2006 230,000 barrels per day
2007 (through August) 350,000 barrels per day
Data for Figure 8 is from here.
7. If gasoline has been increasing faster than Total Product Supplied, I would expect that products other than gasoline have been increasing more slowly than Total Product Supplied. Is this the case?
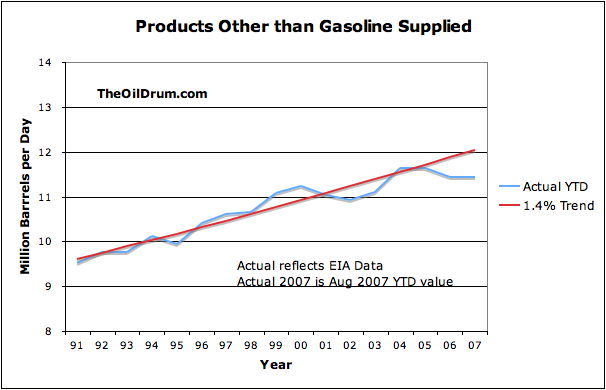
Figure 9
Non-gasoline products supplied have only been growing by about 1.4% per year. The amount supplied in any year seems to be more variable than the gasoline supply. In 2006 and 2007, production of non-gasoline items seems to have dropped off to a greater extent than gasoline production. The amount of the drop below the trend line is 450,000 barrels per day in 2006, and 620,000 barrels per day in 2007 (using year to date data).
Actual data for Figure 9 is obtained by subtracting "actual" data for Figure 8 from "actual" data for Figure 7.
8. How about refinery capacity and use? What kinds of trends do you see there?
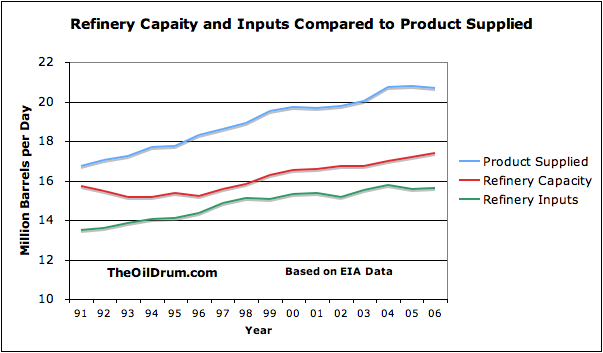
Figure 10
Figure 10 shows that refinery capacity has been growing less rapidly than total product supplied, especially in the early 1990s. Refinery use was very close to capacity in the 1997 and 1998 period, but has been dropping back in recent years. I have not tried to fit trend lines to the data, since I am not certain this type of analysis makes sense. Refinery capacity and use is from here.
9. How about inventories?
It seems to me that far too much emphasis is placed on inventories. Robert Rapier has observed that if a refinery sees a problem with supply, it is likely to cut back production, before it allows inventories to drop too low, because the company cannot stop its refinery quickly if supply proves to be inadequate. Thus, a problem with inadequate supply seems more likely to be apparent through high price, lower refinery use, and lower final product, than through declining inventories.
I sometimes think the emphasis on inventories is a little like the Bush administration's emphasis on terrorism. It keeps analysts busy, thinking about something which is not terribly important (except if the pipelines get so empty that there are actual outages). If analysts were not thinking about inventories, they might look more closely at more important information, like what is happening to imports, and what longer-term trends are like.
10. Where does this analysis suggest that future US petroleum product supply is headed?
If US produced petroleum products continue to decline, as indicated in Figure 3, and imports continue to decline as in Figure 6, it would seem like Total Product Supplied would begin to decline as well.
Contact
- Content: editors at theoildrum dot com
- Tech support: support at theoildrum dot com
License

This work is licensed under a Creative Commons Attribution-Share Alike 3.0 United States License.
http://science.reddit.com/info/60kjk/comments/
thanks for your support...
Gail, thanks for this.
I really like your writing style - load of info yet very easy to follow.
A question on 'Inventories'. Would you apply what you say above to the 'Total stocks of crude AND product' headline inventory figure as well as the individual product and crude inventory numbers?
It's always seemed to me that this doesn't get enough attention - as you say, refineries can easily affect the inventory numbers upstream-vs-downstream according to pricing and supply by managing their production according to the market. But I still feel that the TOTAL inventory of all petroleum resources is somewhat under-emphasized. In the example you give, if a refinery cuts back on production, while that might preserve crude inventories, product inventories are likely to decline.
What might be an interesting picture is a total-inventories chart stretching back a few years, with all the product AND crude volumes stacked.
--
Jaymax (cornucomer-doomopian)
Yes, Gail's style is clear, precise and easy to read, gettin to the point without unecessary "crowing". There's probably a simple reason for this which I won't bother to go into. Maybe more of us could take a leaf out of Gail's book?
LOL. Could it be the lack of a....y-chromosome? ;-)
Agree that Gail does have a great knack for communicating. I always figured it was because, unlike the rest of us, she's not an engineer, scientist, or computer geek. ("Four years ago, I couldn't even spell 'engineer.' Now I are one!")
I would agree that total inventories would probably be more worthwhile to look at than the crude inventories that seem to be agonized over weekly. I haven't done any analysis of this type, so don't really understand the pitfalls.
As an actuary, I spend my life analyzing noisy data, making forecasts, and writing reports about what I see. So it isn't a whole lot different from looking at the oil data, and analyzing what I see, and writing a TOD story. Since our audiences to do not understand actuarial-ese, we have to try to explain things relatively simply.
I like to think of myself as a "big picture" person. The fact that one has a huge amount of detail doesn't mean that one has to break the data into its finest components for every analysis. Very often, the noisiness of monthly data gets in the way of making sensible interpretation of the data.
Having said it might be interesting, I thought why be lazy, and produced these - my flatmates might rightly observe that they were actually produced out of laziness, as a way to avoid what I should have been doing.
All from EIA data, averaged Jan-Dec or Jan-Aug for 2007, including days supply, which is from barrels of product supplied, so ignores any refinery processing gains on the crude and SPR portions.
My first time attempting this kinda thing, so apologies for formatting issues etc. Click on for bigger (hopefully, if I did it right).
--
Jaymax (cornucomer-doomopian)
You did a good job on your graphs. They display fine.
Total inventory is trending down, in terms of days supply, as we expected, except for perhaps SPR. I suppose a person would have to look at shorter term fluctuations in product inventories.
Gail, this is actually good news in that there does appear to be some demand distruction.
I'd also like to add that I appreciate your writing style too. Its not only easy to understand, but non-inflamitory even while delivering alarming information like our level of imports. These charts make it very clear how vulnerable the US is to an import cut-off when about 99% of our transportation comes from oil and that transportation is 70% of our liquids useage in the USA. Bob Ebersole
Four years ago I couldn't spell distruction.
RobertInTucson
I haven't escaped from reality. I have a daypass.
your really funny but i do here you
Now, don't be inflamitory...
(Just ribbing you, oilmanbob)
Ethanol production is 0.4 million barrels per day compared to about 9.3 million barrels per day gasoline consumption. To get the same energy for our cars to all run on ethanol the US would have to produce 13.3 million barrels, after accounting for the lower energy content of ethanol. This is a 33 fold increase in ethanol production for all cars to be E-85 and run on this alcohol fuel. Even a doubling of ethanol production would't help much. Switching all diesel us to bio diesel has similar scale up problem but without the lower BTU per gallon problem.
Only real solution to curbing gasoline and diesel consumption in transport is conservation. But conservation has diminishing returns unless the economy shrinks as it did in 1981 to 1983 period.
I predict long term economic downturn for US that will follow world oil production decline of 2 or 3% per year. The US will not fall off a cliff but be on a long slide downhill. Decreasing personal wealth (for most) will translate into lower per capita energy consumption through fewer jobs, fewer road trips/vacations, fewer people owning cars, fewer people taking airline flights, fewer products bought/imported and in general less money changing hands.
Mark in St Louis, USA
I think that an analysis that only looks at the impact of a small decline in oil misses some of the major effects. I see two major compounding issues - financial impacts, and impacts relating to the knowledge that world oil supply is likely to decline in the future.
1. I have said before that I think the immediate impact of a downturn in oil supply is likely to be financial. For example, see my series on the Economic Impact of Peak oil (Part 1, Part 2, and Part 3).
What happens is that the price of petroleum products increases, so the price of food and other products using petroleum increase as well. Soon competing energy products start increasing as well. People have less money available for non-essentials, so they cut back, resulting in a recession. More people default on their mortgages.
With our huge balance of payments problems, there is a significant chance that there will be pressure to get this back in line, probably through declining value of the dollar and fewer imports of all kinds. The whole situation may evolve into hyperinflation or massive deflation.
2. The knowledge of peak oil, and its likely long-term impact, is in some ways as important as peak oil itself. Once people understand peak oil, they can be expected to act differently.
For example, oil exporting countries start to understand that they have more power than they did previously. They are likely to exert more and more of their power - raising required royalties, getting rid of oil partners they no longer want, and even holding back production.
Oil importing nations are likely to act differently, as well - trying to secure supplies in any way they can.
There can be financial impacts as well from the knowledge of peak oil. The value of stocks and bonds is likely to be lower, once people realize that the future is likely to be less rosy than the past. The whole long-term growth paradigm will at some point have to go away. This feeds back into the other financial impacts noted above.
I'm a member of a small non-profit organisation here in Sweden that modifies ordinary cars to run on ethanol. Usually the owners modifies their own cars, the org serves as a knowledgebase. We call ourselves etanol.nu (etanol is swedish for ethanol) and have a small homepage at that adress. Swedish ofcourse, but there is an international section in our forum: http://etanol.nu/forumrecover/viewforum.php?f=42
Now to my point after my shamless plug ;)
We have found that an ordinary gasoline powered car can pretty easily be converted to E85. It is possible to do it at home with inexpensive tools and inexpensive parts. With more home experimenting we have found that a properly modified car does not consume much more E85 than it dit gasoline prior to the modification. Increasing the compression ratio of the engine seems to be the key here. Admittedly, not so easy to do at home, but not that expensive at an engine shop either. A properly modifed mid sized car have a consumption well below a litre per ten kilometers, or about 33 mpg. Not too bad on a fuel that has less energy per unit. The key seems to be the higher octane number and the cooling effect. Gear heads that want performance and power have successfully used E85 as fuel to improve their engines well beyond what was possible with gasoline.
I would say that it is very much possible for ethanol to replace gasoline on an almost one to one ratio. Despite the lower energy content due to other adwantages.
I do agree that conservation is important, but I do think that we miss a large part oif the picture if we dissmiss ethanol on the lower energy content alone. There is distict adwantages that can be used for much higer efficiency.
Here in Sweden it is easy to find E85 filling station, over a thosand in the country now. Cheaper than ordinary gasoline too. In the city next to mine there is a wheat based ethanol plant. No goverment subsidies, it makes money on its own. In tandem is a biogas plant built, it runs on the waste from the ethanol plant. They get high efficiency that way. Most ethanol that is sold here is imported form Brazil, though. Many hopes on cellulosic ethanol and biodiesel.
Yes, it's very important to feed cars not people. It helps with the overpopulation program.
I know that cars can be "tuned" to use E85, but with the tiny amount available, this doesn't make sense. Most of the ethanol we have is used as a substitute for MTBE. Even if a person could find a local station selling E85, they would never be able to find E85 stations while on a trip.
Right now, scaling up ethanol doesn't make sense because of the food issue. Even if we could do cellulosic ethanol on a fairly wide scale basis, I wonder whether we would have enough to provide E85 everywhere. Some numbers I saw yesterday said that one group was hoping that technology would allow Georgia to eventually get 22% of its transportation fuel from cellulosic ethanol, using pine trees as a source. I suppose if this level of cellulosic ethanol were available, it might make sense to tune some cars to use E85.
Another question is how much arable land do we intend to sacrifice to fuel, and what are the unintended or intended consequences if we do.
If we used all the arable land we have (US), it still wouldn't make enough alcohol (or diesel) to do what we do now with FF.
Myths of Biofuels
Corn based ethanol does not make sense. You would be hard pressed to find anyone around here who think it is a good idea. Most people just shakes their heads.
Food production and biofuel production do not really compete here in Sweden. Most ethanol sold is sucarcane, from Brazil. Waste from the forest industry have the biggest potential for liquid fuels (or solid fuel) produced here in Sweden. The forest industry here is good at conservation. There never has been more forest available for lumbering and the like than it is today here in Sweden. There are critics going on about how we are losing money by too much conservation...
I do understand that it is quite a diffrent picture for you people over in the USA than it is here in Sweden. And I don't think we will make it without conservation either.
And speaking about food, we have more arable land lying fallow than we use for biofuels. Biofuels does not compete with food production in any sense. Biogas production uses waste primarily, not stuff grown on land that could be used for food production. So it is essentially a non issue here in Sweden.
Later today I will go on a longer trip, about 600 km (~370 miles). I will find filling stations on the way, there are plenty of them.
Well, I suppose it's good for you that any problems associated with it are exported to another country. Consider that Brazilian ethanol production doesn't directly, though definitely indirectly, forces cutting down of more rain forest lands for their other food production as the demand for sugar cane grows in order to fuel the demand for ethanol.
No, because that competition is exported to other countries and your climate may not grow any crops that would make economic sense to use for ethanol (I don't know this, am just posturing, uh, postulating).
Use oil as a metaphor. What if Brazil is forced to raise prices dramatically on ethanol, or chose to, in order to "profit."
Would Sweden then need to create a large standing army to invade Brazil to guarantee their supply of ethanol?
Or would the EU need an army to go to Indonesia and Malaysia, if biodiesel supplies produced "efficiently" from what used to be rainforest, now used to grow palm, were to be interrupted?
This is not a local "solution" in any sense of the word. It is just another way to make sure automobile culture continues as long as is humanly, not naturally, possible.
That's why we want to make fuels form our forests, waste from the paper industry and so on. We allready have plants that produces fuels from wood, albeit mostly expreminetal ones. Full producion plants are planned though. Biodiesel form the waste of the paper industry have a very large potential, it could replace all fossil diesel we use today.
Importing ethanol from Brazil is a stop gap measure. Soon we will have our own fuels. Ethanol will probably be one of many. Transportation will probably mostly be powered by electric (we have plenty of hydro power and nuclear), biodisels, biogas, alcohols and solid fuels.
Most of the ethanol produced in Sweden today is made from wheat grown localy. The plant in Norrköping produces about 55000 cubic meters of ehtanol. An expansion is in process of expanding the output to 210000 cubic meters per year. Not mutch yet, but it's getting there. Wheat based ethanol production is a positive EROEI process. Corn based ethanol is not.
A recent problem is that our right wing goverment have abolished the import duties on Brazillian ethanol. This is stupid, it does not motivate local production.
And I don't think cellulosic ethanol is a dream only.
http://www.ethanolstatistics.com/Industry_News/Exclusive/Novozymes_Expec...
And I'm back from my weekend trip. 1100 km (~683 miles) on E85 in total.
Thanks for the report. It's good to have all that information put together in a way that is easy to read and understand.
Regarding inventories, it seems to me that the long-term changes in inventories are too small to tell us anything useful about the supply/demand situation. If memory serves me right, crude inventories are now about 20 million barrels below what they were at this time last year, which is about what the US uses in a single day. Hence the argument that the US market stayed afloat by drawing down inventories is an exaggeration of the reality. Does that sound reasonable?
Also, it seems nearly dishonest to me that the EIA reports data by volume rather than by BTU's. The term "refinery gain" makes it sound that something magical is happening. Hey, why not refine it again and get even more gain!
For some reason, I get the image in my mind of someone taking whipping cream, incorporating air into it by whipping it, and comparing the new volume to the old. The change in volume is measured, and the person whipping the cream gets credit.
I don't think that it is quite as bad as this with refining oil, but it may come close.
I am not an expert on refineries or petro chemical processes, but I do know this: To take a hydro carbon that has long chain molecules like crude oil and produce shorter chain molecules like heptane or octane one needs to break down the long chain of C-H (carbon and hydrogen)and make it into a shorter chain of C-H bonds with a higher ratio of H to C. Methane (natural gas) is a source of H because it has four H to one C.
When a refinery uses natural gas in the catalytic process it will use the H and cast off most of the C as CO2. But because the resultant mix is a shorter hydrocarbon molecules and more of them, the refinery has more liquid volume coming out. So the extra liquids volume partly comes from adding methane and partly from the products having more short chain C-H molecules.
Mark in St Louis, USA
This was my 9/14/07 take on the inventory question:
http://www.theoildrum.com/node/2975?nocomments
Declining Net Oil Exports Versus “Near Record High” Crude Oil Inventories: What is going on?
Posted by Prof. Goose on September 14, 2007 - 8:18am
This is a guest post by Friend of TOD Jeffrey J. Brown, an independent petroleum geologist in the Dallas, Texas area
I had read your comments about inventory levels before, but I don't think I understood until today why refiners would not allow inventories to go below a certain level. Thanks.
Russia cut crude oil exports to Germany without prior notice, I believe in January of this year (there was an additional reduction later this year), and one German refinery suffered damage because of the unplanned reduction in crude oil input.
Yeah, when I read that news story, I immediately thought of you.
Interesting numbers, Gail. Also, your projection of financial impact seems to me spot on.
Thanks for posting this.
I think there may also be some issues regarding where the inventories are actually located. If we are dealing with only a few dozen hours of inventories, it is easy to get shortages in one part of the country (North Dakota recently), while other areas have sufficient supply.
If I may, while you're here let me ask you a question that arose for me lately: what do you think of the potential for Bakken?
I think that oil companies will make a lot of money finding smaller conventional oil fields and producing nonconventional reservoirs like the Bakken, but I think that we will just be able to slow the rate of decline in total production.
hhmmm. There was an article in a TOD comment the other day, in which (IIRC) an S. Dakota official cited an estimated 400B bbls Oil in Place, and 1M bbl/day in his state alone from the Bakken. Is he being realistic? If not, what's your wild guess?
They are guessing the recovery factor right now, which could be quite low, and the wells are very expensive, but companies would not be drilling if they did not think the play was viable. We just need to differentiate between energy companies ability to make money in a post-peak environment and making a real difference.
It will take decades to fully deplete the Prudhoe Bay Field, the largest conventional oil field in North America. From fossil fuel + nuclear sources, the world burns through the energy equivalent of Prudhoe Bay about every 60 days.
Is the "Gasoline Supplied" graph Fig 8 before or after blending with ethanol?
SolarHouse
The gasoline includes the blended ethanol in it, in computing the volume.
In the quantities that ethanol is used today, ethanol is mostly a substitute for MTBE. MTBE was added in somewhat higher concentrations than ethanol. So substituting ethanol for MTBE in gasoline tended to slightly reduce the gasoline volume.
Note that the technical overshoot hypothesis if applied to the US points out that we will probably be the first ones to show and accelerated decline rate in production. Effectively any day now. Given the decline in well lifetimes our ability to manage the decline rate by drilling more wells should be coming to a end and we should have a increasing percentage of well shut in that where drilled in the 1990's that effectively cannot be replaced. The overall result is a accelerating decline rate.
So if I'm right then their is a good chance that the US will be the first region to show this technical overshoot decline.
From the political level you would think that this is something that might be well known in certain circles and thus would underpin adventures like the Iraq war without requiring the leaders to be fully peak oil aware. Knowing we may face a loss of say 1mbpd over a year or two in US production in enough information.
US production numbers are well reported and fairly transparent at least to date so we should be able to detect this.
The US URR is estimated to be between 150GB and 200GB the them of the approach is to take the lower number and assume technical progress leading to increased extraction and shorter well lifes is responsible for the higher estimates.
http://www.eia.doe.gov/emeu/aer/txt/ptb0402.html
Give 192.3 GB of production. Before I'm shown as being obviously wrong a lot of this production is from stripper wells which are ignored when considering easily producible oil. My understanding is that 2mbpd of production in the US is from stripper wells since we have a 10bpd average for wells. So a real URR of readily extractable of of 150 GB makes sense. The focus is on the 2mbd or so of production from primary/secondary extraction and this is what is in danger of falling off dramatically effectively any day now.
Back to the stripper wells assume 0.5-1 GB a year from stripper wells then 10-20 GB of oil has probably been recovered at low extraction rates over the decades and we probably have another 20 GB or so to recover via tertiary recovery. Ithink I'm low on this number it should be higher but it depends on when you cut off a resonable producing well from a stripper well. I'd say 100 barrels a day is a reasonable lower end number of easy extraction.
So the US should find itself down to 2-3 mbpd range within the next few years if I'm right. Maybe someone can find the data that shows the per field URR and wells with high production rates in the US I think you will find they probably represent close to 1mbpd of US production and this production is probably close to declining with only a few GB of high quality reserves left. So given a extraction rate of .3GB a year for the good stuff if we had the number this has got to be effectively done.
So the bottom line is that the US actually has a shark fin production model and the fin will finally show up. Overlayed on top has been a massive investment in marginal recovery which provided a low but steady base production rate of around 2-3 mpd that will extend for some time to come.
Time will tell.
My reading indicates that most US production (i.e., prior to 1970) was relatively inefficient, with low recoveries and lots of waste - in contrast to that in the North Sea, for example. Doesn't that imply a very long tail for the US, rather than the "shark fin" pattern that might apply to later, more modern production?
Yes thats why you should model the US as really two producing zones new fields primarly in the Gulf of Mexico and older production using EOR methods. Thes secondary recovery methods are more profitable in the US since the original extraction methods were poor so a lot of oil was left behind. In general even with our advanced technology we cannot get this oil out at a high flow rate but the US is in a sense probably a lot better than the rest of the world for these methods.
Understand that once primary and secondary recovery are finished you generally have 60% or the oil still in the ground so you have a pretty big crumb left to extract at low flow rates.
I've read that half the oil wells in the world are in the US so given almost half of the worlds oil wells we are able to squeeze about 2mbp or so out of old tired fields and pockets. Impressive and generally marginally profitable but its not going to save the world.
The other about half of our production is from offshore wells drilled into new fields in generally in the Gulf and its exploited using high flow rate horizontal drilling etc.
This 2mbd or so is produced with wells that have a short lifetime 15-3 years with a lot of this production brought on in the 1990's its this half that should suffer a sharkfin like production profile and should start declining any day now since we only recently have really run out of prospects in the gulf and no longer coming close to replacing reserves.
Indeed shallow water gulf resources are projects to start into decline I'm saying shark fin not exponential.
http://www.gomr.mms.gov/PDFs/2007/2007-020.pdf
From
http://home.entouch.net/dmd/gulf.htm
The assertion is that this down tick will not be a exponential decline of 3-4% but under go a accelerated decline rate resulting in a shark fin like decline for production in the shallow gulf region.
I believe for technical reasons the deep water production will flatten soon and then undergo the same pattern.
He is giving 3GB of reserves for the Gulf most of this is deep water so you can see at least for the shallow gulf production if I'm right the trend will be accelerating decline rate or constant or increasing loss of production.
Lets see where its at at the end of 2008 if its a shark fin pattern once it comes of the top then decline steepens rapidly. If true then the shallow gulf production is predicted to be a precursor to the decline patterns we will see around the world in shallow offshore developments generally started in the late 1980's early 1990's.
Outside of the decline of the super giant fields this effective collapse of shallow offshore production over the next few years will represent the biggest source of decline.
I think most of this production is not OPEC.
In any case I think we have a early test of the theory before we see the same happening on a global scale.
Thanks for the information. I was just down in the Gulf of Mexico, visiting Shell's Brutus platform. Production on Brutus began in 2001, but is now down substantially from its high point.
It was my understanding that Shell is in the process installing enhanced recovery methods on its deep sea projects, to try to get production up. Depending on the site, these could be gas or water injection methods.
It would seem like these would be helpful in getting production up for a relatively short time. Then these fields will likely go into permanent decline.
While very little oil is used generating electricity are there figures on how much diesel fuel is used mining and transporting coal?
I keep raising this question, because I still haven't gotten a complete answer. Perhaps someone can chime in with the answer this time.
WRT the propane fraction on the Figure 2 pie chart: To what extent is there room to "tweak" the percentage of the propane fraction? What are the tradeoffs between the propane and other fractions (especially gasoline)?
My concern is with future propane supplies, for I am quite dependent upon propane. Because so many more people use gasoline (just about everyone, really) than propane, I can see a lot of political and economic pressure in the future to pull every possible drop of gasoline out of the refining process. If there is a risk that propane customers CAN get shortchanged above and beyond the general downward post-peak suppy trends, I'd like to know about that sooner rather than later.
The thing that's striking about the figure 1 pie chart at the top of this thread is that each major piece is either shrinking or on the verge of decline. The one major global liquid fuel that's not in this condition is left out of the pie - LNG. That's been the policy in the U.S., not the rest of the world.


Compare this chart to the precarious plateau unable to keep up with demand growth that crude is on. Many nations around the world have been building more dependence on global LNG tankers and less on crude. Japan, for example, uses it for a full 12% of their energy demand. The one nation with the most dangerous reliance on a peaking domestic natural gas supply has been building their use of this robust global LNG trade thusly:
The LNG is in red (you can barely see it). Pathetic. LNG isn't some technological breakthrough we must patiently wait for or a low EROEI source that's ineffective in replacing oil. Nor must we wait years for it to ramp to a scale that can make a difference as this chart from Stoneleigh's Nov. 10 post shows:
Global gas will shortly peak, of course, but it, along with coal, gives us the 30 years to scramble for effective crude replacement that we wasted from the '70s to now. The other oil alternatives will simply be too slow to ramp as the projections show. Most developing nations around the world are very active in tapping the burgeoning global LNG business. America hasn't exactly been dipping its hat in the trough. The U.S. shuns it because a bungled forerunner of today's LNG plants blew up in 1944 - the Cleveland disaster. Since then, the global LNG industry has built one of the best safety records of any industry including the oil-to-gasoline refineries that blow up often and would be unnecessary in using LNG as a motor fuel. There is a legal, parliamentary name for this approach to energy policy. It's called "stupid". Coal is going to have environmental problems for some time untill they can do the C02 storage or removal economically. LNG is cleaner than what we're doing now! A fortunate side effect of the liquefaction process that's needed to make it a liquid is that it condenses out sulfur compounds and most all of the usual fossil pollutants. Not only is it cleaner, it is better fuel for the engines our industry already produces. Dirt is the major reason engines wear out. LNG is regasified and used in vehicles as CNG (compressed natural gas) and is so clean and high octane that engines run better and last much longer. Driving on gas is common in a lot of nations already, and hopefully the U.S. won't always be the global village idiot in energy policy and continue a build out of LNG motor use.
Thank you for this!
I can see some merit in LNG, but let me point out that the growth curves for wind, solar & nuclear are based on "business as usual", i.e., the assumption that there will be no public policy response to very high energy prices.
This, I think, is highly unrealistic. Given the price premium for LNG, I suspect wind is a much better alternative for new generation.
The issue with LNG is that there is not nearly enough of it to make a dent in what the US would need. As I understand it, the five LNG terminals in North America are very much under-utilized. If we could purchase it, it would be quite expensive, and add to our balance of trade problem.
Natural gas in North America is expected to decline sometime in the not too distant future - perhaps 2020, or before. Before then, it will be difficult to maintain the current level, even with LNG imports. I don't think LNG/CNG cars have a chance in this country. People are trying very hard to figure out what to do about all of the electrical supply that is currently powered by natural gas, but is expected to be lost in not too many years, as natural gas supplies here decline.
It's true that there's not nearly enough LNG traded now to supply the U.S. motoring need. We are approaching around 4 million barrels of oil equivalent/day of LNG trade. Considering that U.S. motoring uses about 70% of our 20 million barrels/day of oil use, that means if we were able to hog all the global market, it currently would only supply about 28% of our vehicle need. Placing anywhere near that much added demand on LNG would drive up the price to unworkable levels, of course. But also consider that most of the countries that have plenty of excess supply are not only much more geopolitically stable but are rapidly building capacity far faster than crude production is going to be increasing (or decreasing) in the geopolitical tinderboxes. This may make the price climb in LNG much more attractive than the price climb in oil. It surely justifies use of LNG somewhere between 0% and 28%. As oil supply troubles come, it may be surprising how fast LNG capacity grows in the future. Consider that most of the brisk growth in LNG trade shown in the chart above occurred while the inflation adjusted price of oil was fairly stagnant. What other oil alternative is cleaner than oil, is probably peaking 30 years from now, is already ramped to about 5% of the globe's oil use, and is not waiting on some technological breakthrough? None that I can think of. LNG's current 5% of global oil production level may seem small now. But for a fair comparison to oil, you should compare global LNG trade to global oil trade meaning net exports. If, heaven forbid, we were to have a 10% per annum net export decline rate from here (assuming this has peaked) compared to where the extended smooth curve of the LNG trade chart takes you, you have global LNG trade at about 50% of global oil trade in just 10 short years.
I didn't mean to slight CTL (coal-to-liquids) in the above post. We are the Saudi Arabia of coal in America. But for motor fuel use, it either has to be used in electric power generation with electric cars and the big C02 problem, or used directly as CTL gas tank fuel with a lot of uncertainty about it's EROEI. I've seen figures published all over the map. If you take the number of some good authorities for low grade coal as being around 12 and apply what most estimate to be about a 50% CTL process loss, you get an EROEI around 6. But other sources give figures as low as a worthless 1. We seem to have a better handle right now on the LNG EROEI, and it compares favorably with oil refined gasoline. At any rate, the massive focus on corn ethanol would probably do a lot more good focused on CTL and/or imported sugarcane ethanol with a vastly better EROEI than the corn variety. We're pretty certain E85 is a worthless oil replacement fuel.