| Nate Hagens on "The Reality Report" with Jason Bradford at Noon EST | The Oil Drum | DrumBeat: December 25, 2007 |
Are We Missing Russian Megaprojects?
Posted by Stuart Staniford on December 24, 2007 - 2:00pm
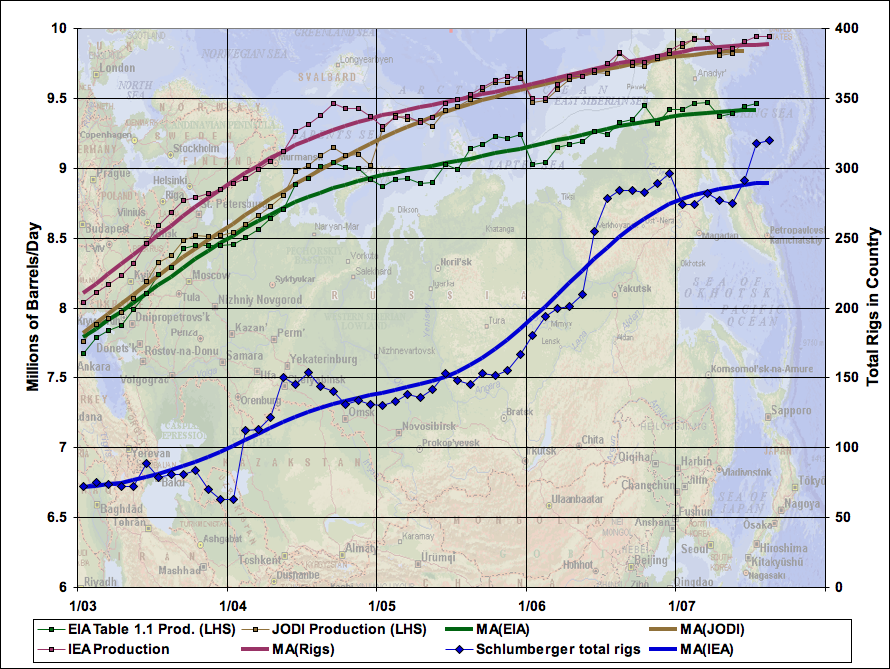
Monthly Russian oil production according to three data sources, Jan 2003 - Aug 2007 (left scale), and oil and gas rigs in country (right scale). Sources: EIA Table 1.1c, IEA Table 3, and JODI. Solid smooth lines are 13 month centered moving averages, recursed once (note last 13 months rely on an incomplete window). Production graph is not zero-scaled. Rig data are from Schlumberger data and include both oil and gas rigs.
Instead, it appears that Russian production increases are in large part due to revival of mature Soviet era fields as the Russian economy recovered and as now-private Russian companies applied Western techniques of oil production (and Western contractors) to their fields.
Firstly, let's review the main facts of the situation. A graph of Russian oil production is shown above at the start of this piece. From the beginning of 2003 to now, Russian production increased by about 2mbd. This is the later stages of a longer increase, commonly called the "Russian Revival", that began in the late 1990s. By contrast there are only about 630kbd of currently known Russian megaprojects in 2003-2007. Here they are, tabulated
| Field | Company | First oil | Peak date | Peak flow (kbd) |
|---|---|---|---|---|
| Salym group | Shell/Sibir | 6/2003 | 2009 | 160 |
| South Priobskoye | Gazprom Neft | 2003 | 2005 | 220 |
| Sakhalin-I | ExxonMobil | 10/2005 | 3/2006 | 250 | Total | 630 |
That 630kbd slightly overstates the amount of the new capacity available so far, since at least one of these projects will not hit peak for several more years. If you thought the 8mbd (or so) of Jan 2003 production would have had a base production decline of something like 5% a year, then you'd expect to have lost about 1.5mbd of the 8mbd by now due to declines. That would imply the 630kbd of megaprojects would have been nowhere near enough to hold the country's production steady, let alone increase it by 2mbd.
Two kinds of explanation seem possible:
- Production at existing fields actually increased, rather than declining
- Megaprojects have been missed.
For context, let's take a look at Russian production by company:

Monthly Russian oil production by company, Jan 2003-Sep 2007. Source: Rembrandt Koppelaar. Click to enlarge.
Here's the same data, only not stacked so that it's easier to see the trends in individual companies:
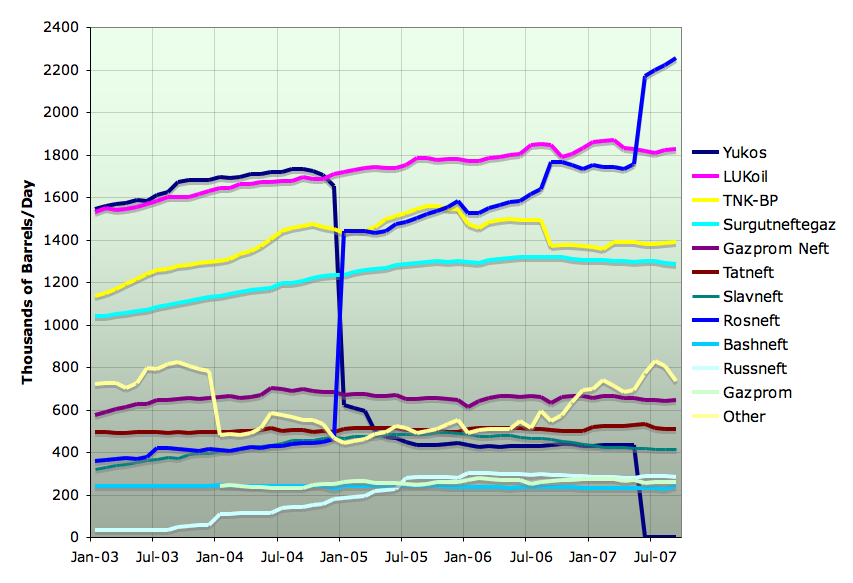
Monthly oil production of top Russian companies, Jan 2003-Sep 2007. Source: Rembrandt Koppelaar. Click to enlarge.
This graph comes from the Lukoil annual report for 2003, and I think serves as a good orientation to the situation:

Lukoil average water cut, Q1 2002-Q4 2003. Source: Lukoil annual report for 2003. Click to enlarge. NB: graph is not zero-scaled and involves a very small range of water-cuts.
It's worth reviewing some history here. In the Soviet era, fields were produced in a fairly brute-force manner with no nuances. To quote John Grace's outstanding book Russian Oil Supply,
On the basis of [maps from the Ministry of Geology], and the results of tests run on the the delineation wells, the producing association designed the first-round of drilling targetd at the largest reservoir in the field. Crews built drilling pads in the West Siberian swamp. From these higher and dryer locations, several dozen wells were drilled in all directions. Drilling multiple wells directionally from centralized pads minimized the costs and logistic difficulty of operating in a wetland.So you should picture Lukoil's main assets as a set of large West Siberian fields that were developed in this manner during the Soviet era, and peaked and started to decline while under a poorly designed and monitored waterflood. Here is Lukoil's oil production by region:The intersection of these wells with the reservoir formed a geometric grid. In the first round of drilling, the grid was fairly loose. Pattern drilling (locally called the 'Siberian box') carried the advantage of easy planning, but did not respect the geologic heterogeneity of reservoirs. Mixed in the grid of producing wells were water injectors. Under Soviet practice, water flood usually commenced at the beginning of field development and continued to the field's abandonment...
Engineers put pumps on every well they could. Nonetheless, they quickly met the limit of improvements that could be won with sucker-rod pumps. Without the option to upgrade to ESPs, sucker-rod pumps would only soften the wells' decline rates. Moreover, installing pumps meant incurring the cost and management requirements of maintaining them...
The second line of attack was infill drilling. As the bump in output from mechanization declined, a second geometric grid of wells was planned for the spaces in between the first grid in a reservoir. In theory, infill wells increase the total volume of oil recovered from a reservoir. When drilled in the West or the USSR, however, most infill drilling is for production rate acceleration - not increased recovery. When drilled on a pattern, particularly with the reservoir under water flood, infill drilling can actually reduce the amount of oil ultimately recovered. As meeting the current quarter's planned production goal overhwelmed all other considerations, infill drilling became the brute-force instrument of choice.
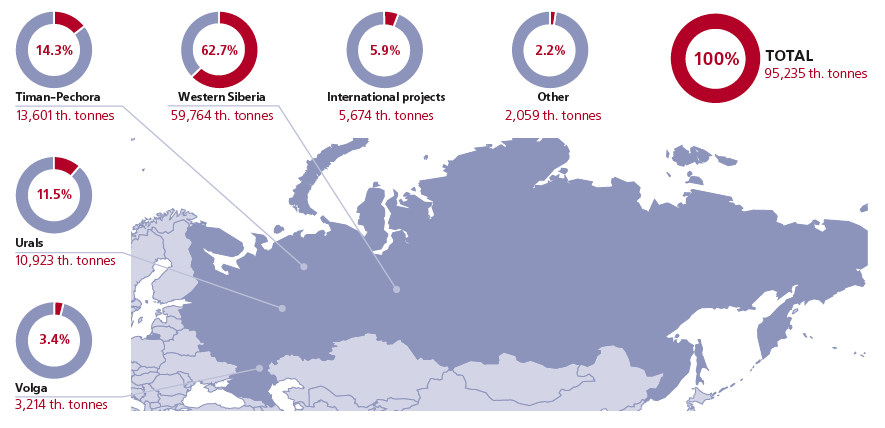
Lukoil oil production by region in 2006. Source: Lukoil annual report for 2006. Click to enlarge.
The idle well 'crisis', as it became known, began immediately after the massive 1986-88 recovery campaing wilted. State budgets for field operations dove in every year thereafter, falling by half as of 1992. Well repair took the hardest hit. By 1991, the number of wells going off line exceeded the number of new wells drilled. In 1992, the number of producing wells in the newly independent Russian Federation was lower than during its last year as part of the USSR.The situation began to turn around in the late 1990s. First Russia defaulted on its debts, and the rouble was devalued, which dramatically increased the profitability of Russian oil companies (since their costs were mainly in roubles, but they could sell oil in dollars). Then oil prices started to go up.As budgets shrank, producers deferred maintenance; the backlog of wells awaiting repairs quickly and inexorably accumulated. Whereas idle wells ran at around 3,000 during the eighties, by 1993 there were 29,101. This cost the nation 1.6 million b/d of production, or 23 percent of national output. A seemingly incredible number of wells remained offline for want of small repairs or lack of routine attention.
By the beginning of 2000, the surge in export prices and a significant increase in domestic prices substantially raised the volume of income heading back to producers. They, in turn, began to plough back into the fields much of the net income received at the wellhead (over $9/bbl in 2000). The number of idle wells fell, and for the first time in a decade, the number of new wells rose. Output went up a bracing 6%.(Emphasis added). By the time we start tracking megaprojects in 2003, however, most basic "fix the wells" work that was worth doing was done. What has been going on in recent years has a lot more to do with the application of a variety of western technologies to the old Soviet fields. For example, here's Lukoil's 2006 annual report:The same trend continued through 2002. The increases not only fueled drilling in general, they supported the initial development of a a handful of major new fields.
By the end of 2006 a total of 196 fields were included in a multi level system of field development monitoring by use of geological hydrodynamic models. Modelling of 47 fields was carried out in the course of the year. Geological hydrodynamic models are helpful in selecting optimal technical solutions for field development, matching solutions to specific geology and structure of reserves. Modelling raises the oil recovery ratio and lowers field development costs. The Company makes intensive use of models for drilling over fields and for application of enhanced recovery techniques. LUKOIL plans to inсrease the number of geological hydrodynamic field models to 261 by 2009, so that 75% of Company fields will have such models (compared with 55% of fields at present). Geological hydro dynamic modelling will be extended to all fields in such regions as Western Siberia, Timan Pechora and Kaliningrad Region.Rather than the oil Soviet system of just drilling a geometric grid into the reservoir, Lukoil is now striving to build actual geophysical models of their reservoirs, so they can optimize the placement of wells into the remaining oil, and study the likely flow of the oil in the face of the various faults, fractures, and variations in reservoir permeability that pervade oil reservoirs.
Other techniques include the application of horizontal wells, and horizontal sidetracks (where a vertical or mostly vertical well which is now producing too much water is redrilled horizontally into the remaining oil layer to lower the water cut and increase oil production.) This next graph shows the trends in these activities:
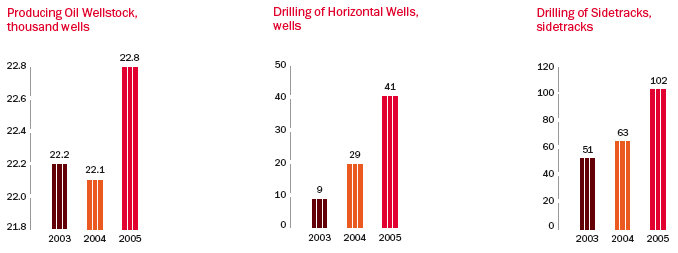
Lukoil use of horizontal drilling and sidetracks, 2003-2005. Source: Lukoil annual report for 2005. Click to enlarge.
Another technique of importance is hydrofracturing ("fraccing" - putting the well under enough pressure to cause fractures in the reservoir rock, which can enhance production in certain situations). From the 2004 report:
A large part of LUKOIL Group's fields are in the last stages of exploitation, marked by increase of the water cut and falling flow rate of oil wells. This deterioration of reserve structure calls for application of scientific and production know-how, which can find, test and implement the most suitable technologies for oil extraction at declining fields.20.8 million tonnes/year is about 400 kbd.The Company carried out 4,909 enhanced oil recovery (EOR) operations in 2004. Additional production thanks to EOR was 20.8 million tonnes last year, which is 5% more than in 2003.
Most of the EOR oil (13.2 million tonnes or 63.5% of the total) was extracted using physical EOR, and 92.6% of oil produced by physical EOR was obtained by hydrofracturing techniques.
Finally, a brief discussion of new fields brought on by Lukoil. The only new field during 2003-2006 for which production figures are mentioned is the Kratsovskoye platform in the Baltic sea. This came on in 2004, and
- was mentioned prominently in the initial letter to shareholders in the 2004 annual report
- has merited at least a paragraph and production statistics in every annual report 2003-2006,
- had its picture fill most of the front cover of the 2004 report.

Lukoil annual report cover for 2004, featuring the Kratsovskoye platform in the Baltic sea which started up production in that year. Source: Lukoil annual report for 2004. Click to enlarge.
A variety of other new fields are mentioned by name in the reports, but have no production figures, and Google produces no information about them. They are probably small. For background, Grace reports that 400 small fields have been found in Western Siberia alone, and as of late 2004, only 160 of them were on line (the rest being too small or too far from infrastructure to be worth it. Collectively, the 400 small fields only hold 15% of the basin's remaining reserves. It's likely Lukoil is bringing some such fields on stream. For example, in 2005, of 9 new fields brought on line, the largest, East Sarutayuskoye and Perevoznoye had 3P reserves of 0.624 gb. So probably 2P reserves might be 0.15gb each. Given the slow rate at which Russian projects generally progress, they probably are not of megaproject size.
Similarly, of 11 new fields brought on in Russia in 2006, the only ones large enough to get mention were as follows. First in Western Siberia:
Major new commissionings included the West Pokamasovskoye and West Kotukhtinskoye fields with proved, probable and possible oil reserves in excess of 280 million barrels.so that's probably less than 0.1gb each of 2P reserves.
And in the Timan-Pechora region:
Three fields were commissioned in 2006: West Lekkeyaginskoye (commissioned by Naryanmarneftegaz, the joint venture between LUKOIL and ConocoPhillips), Verkhnegrubeshorskoye and South Sedmesskoye, with overall proved, probable and possible reserves of about 230 million barrels of oil.Three fields with 3P reserves of 0.23gb between them is very small fish to fry indeed.
So in summary, I don't think we are missing any megaprojects of any great consequence in recent years from Lukoil. Although my research is incomplete, this seems to be the pattern at other companies also. Production increases have been coming from better management of the very large but significantly depleted Soviet-era fields, along with commissioning of very small new fields. Only a handful of megaprojects have occurred.
Other selected Oil Drum pieces on Russia:
- Stuart Staniford, When Will Russia (and the World) Decline?
- Dave Cohen, Uncertainties About Russian Reserves and Future Production
Contact
- Content: editors at theoildrum dot com
- Tech support: support at theoildrum dot com
License

This work is licensed under a Creative Commons Attribution-Share Alike 3.0 United States License.
http://science.reddit.com/info/63sdd/comments/
thanks for your support...
From the working draft of the Khebab/Brown net exports paper, building on our January, 2006 work warning of problems with Saudi and Russian production and net exports:
Hi,
I was messing about the other day with a simple % production/consumption increase/decrease Excel spreadsheet. Just about the only scenarios I could get that did not point to a bleak outcome was an exponential increase in production -impossible- or a massive drop in consumption (bombing campaign?!)
Whenever your ready to publish I'm still chomping at the bit...
Nick.
Net export declines tend to approximate a linear decline, approximately a fixed volume per year, which is an accelerating annual decline rate. I estimate that the top five are going to show a drop of about one mbpd per year in net exports for both 2006 and 2007, which what I expect to more or less see going forward.
Nice work Stuart. Sorry we had a server reboot this am, though WT seemed to be immune to it....;)
When you say 'improving', do you mean the water cut is getting less for mature wells, or ALL wells (new and old) on average use less of a water cut?
It's an average across all their currently operating wells, so the changes include both new wells (which probably have a significantly lower water cut than the average well), and various kinds of work on old wells.
There is no way to lower the percentage of actual water that is in a reservoir, it can only rise. Therefore the only way to lower the water cut in an individual reservoir is to stop taking oil from lower in the reservoir and limit the withdrawals to the very upper portion of the reservoir. That is what Saudi has done in North Ghawar.
This works great but it creates no new oil and it really does not change the amount of water in the reservoir. What it does do is change the decline rate. It lowers it considerably for a few years. Then when the water finally hits those horizontal wells at the very top of the reservoir, the reservoir collapses....catastrophically.
It leads us into a fool's paradise. There seems to be plenty of oil in the reservoir...then suddenly.... suddenly.... there is almost nothing left.
Those who are counting on a "gradual" decline in Saudi Arabia and Russia, I believe, are sadly mistaken. The collapse will be sudden and catastrophic.
Ron Patterson
Water cut is not defined as a property of the reservoir (that's the water saturation), but rather as a property of what flows out of the well. You are correct that the water saturation pretty much always rises.
However, I don't think it's 100% correct that no EOR operations ever increase recovery, only cause flow to rise in the short term. Some things (eg fraccing, horizontal wells into not-very-permeable fascies, etc, may reach oil that otherwise would have taken millenia to get to a well. For all practical purposes, such things do raise the recovery rate. Russian recovery rates have been on the low side, so I do thing there is some prospect that they will be raised somewhat.
Do you have any data/evidence to show that catastrophic reservoir collapse is a frequent occurrence?
Frequent occourence? JD, look at the graph above. Horizontal wells and horizontal sidetracks only hit Russia's wells in force in 2005 and in Saudi a few years before that. There has been no time for anything to happen.
When water begins to rize on a vertical well, the water to oil ratio gradually rises a little bit each year. So they plugged the vertical wells and ran horizontal sidetracks. Plus they drilled some new MRC wells.
Water will not rise gradually from a horizontal well, it will hit suddenly. And the petroleum engineers know this. The only debate is when it will happen.
Ron Patterson
So, at this point in time, you can't point to any actual examples of catastrophic reservoir collapse for the reason you give? Is that correct?
Do you have any cites from petroleum engineers stating that Saudi/Russian oil production is likely to catastrophically collapse for the reason you give?
Here's one cite from a highly regarded petroleum engineer who says exactly the opposite:
Jim Jarrell, Another Day in the Desert (pdf)
From that same October 2005 issue of CERI:
Ha ha ha ha ha! CERI, a Candadian version of CERA. Go back under your rock troll!
"actual examples of catastrophic reservoir collapse"
you could look here http://www.energybulletin.net/1474.html
a brief discussion of the yibal field, oman.
i read the referenced article, "another day in the desert". the author doesnt seem to be a real experienced reservoir engineer(although he seems to hold himself out as an expert), the article is at best a superficial look at "twilight in the desert". the article you cite seems more interested in discrediting simmons than providing any real data or analysis.
And Shell was gearing up their surface facilities to handle an expected flood of new oil when they were hit with a flood of new water.
Yet a lot of peak oil experts take the reserve estimates from these companies as truth.
Yibal is a single field, which collapsed ten years ago in 1997. Pointing to a single field does not constitute evidence that MRC wells are going to cause a sudden catastrophic collapse of production in Russia and Saudi Arabia.
The industry has been drilling thousands of MRC wells per year since the mid 90s. If MRC causes catastrophic field collapse, there should be dozens of fields undergoing catastrophic collapse all over the world. So where are they?
the author doesnt seem to be a real experienced reservoir engineer
Matt Simmons has only positive things to say about him (from Barron's "Personal Wealth: Twilight for oil", Jan. 30, 2006):
As you can see, even Simmons has distanced himself from the sudden collapse rhetoric.
Still waiting for cites of petroleum engineers making the case that MRC will cause catastrophic collapse of Russia and Saudi Arabia...
Well if you read this paper you will see that widespread deployment really started in 1997-1998.
http://netherlands.spe.org/images/netherlands/articles/26/spsalamy.pdf
http://postcarbon.org/files/JD_CV/CitesJulian/2004%20Petro%20Review%20-%...
We should know soon if MRC wells in Shaybah act as super straws. I believe the field had a URR estimate of 14GB.
Its production rate is fairly low. I'm having a hard time finding historical production but its less than 1mbd I blieve its around 700 bkd right now. To put this in perspective Purdhoe with 12 GB of reserves produced above this touching 1+mpd for ten years.
Shaybah has a estimated URR range of 5.71GB to 19GB.
http://europe.theoildrum.com/node/3100
Its being produced at about 0.18GB a year so even with the low end estimate it seems that it will produce for a long time. So its not a good candidate to watch for near term collapse. I was unable to find another good example searching the web right now at least at the field level Shaybah and Yibal seem to be the main examples. Most reports mention Saudia Arabia is being the pioneer for MRC wells.
However they are not the only ones and its now ten years since 1998 so some MRC wells should be watering out soon.
Its a matter of finding the data. Regular horizontal well are far more common and production profiles are easy to find for them. MRC wells should since they are a variant of the standard horizontal well exhibit the same production curves.
http://gswindell.com/horizogj.htm
So at least a cursory review of the use of horizontal wells in the US indicates that the super straw concept seems viable.
"yibal is a single field". yes, you asked for "any".
he said, she said. if you are really interested in why i say jim jarrell appears to not have a lot of experience as a reservoir engineer, i would be glad to explain it.
i don't know who is claiming that mrc wells will "cause" a collapse. what will cause a collapse is injecting water and depleting oil. it's as simple as that. think of a tank, fill the tank from the bottom with water and take oil out the top. when the tank gets full of water, there isnt any more oil to be had. the claim of jarrell seems to be that mrc wells will prevent the tank from going empty.
To clarify they don't cause a collapse your correct but the wells can just like horizontal well maintain a high production rate and low water cut right to the end of the wells lifetime.
The production profiles tends towards a square wave.
Its not clear at all that reserve estimates developed using production data from these types of wells both horizontal and the more advanced MRC wells are correct.
At least in my reading it seems abundantly clear that advances in extraction technology including new well completions, horizontal and MRC wells etc are capable of maintaining production rates and keeping water cut low until a field is highly depleted.
Whats not clear is if these technology significantly enhance overall recovery or if the reserve estimates which use well logs or production data as part of the estimation process are correct.
http://estudantedaenginhariadopetroleo.nireblog.com/post/2007/12/21/oil-...
In particular the well log data can be incorrectly interpreted because of the differences between horizontal and vertical production. The nature of horizontal wells makes it fairly easy to overestimate reserves.
"the production profiles tend toward a square wave".
yes, i agree. and that would be ideal from a profit standpoint. production at gravity stable rates would do the same. i dont doubt the saudi's, they are more or less producing at gravity stable rates. "more or less" because if they were producing at strictly gravity stable rates, there would be no water production until the day the oil runs out. they can say they produce at "gravity stable" rates and have water production because the reservoir is not completely homogeneous. so on "average" i suppose they are. but whether they use horizontal wells, vertical wells, inclined wells or a combination thereof, a gravity stable rate is determined by the reservoir geometry and rock and fluid properties at the oil/water contact.
and incidentally the article cited by jd talks a lot about water coning. well, if the saudi's are experiencing widespread water coning, we had better run for the hills.
horizontal wells can enhance recovery by keeping the economic limit at bay for a while. they can also make an otherwise uneconmical field profitable. however, horizontal wells present a challenge after the wells cease to flow (artificial lift is at least more challenging in a horizontal well).
In general from my reading horizontal wells tend to allow extraction to the point that additional EOR methods are probably not going to a whole lot of additional oil. The combination of early water flood, horizontal wells tends to extract 90% or more of the easily extractable oil at a low water cut and high production volume until they water out.
MRC wells can be treated as a number of horizontal wells with the potential for interaction. As far as gravity stable goes generally true but I'm not sure what it means given the large amount of producing area exposed its like discussing a underground river vs a spring. Even coning is different also of course fractures are a lot more important for horizontal wells. Combined with modern imaging methods its a technical revolution.
My point is that in attempting to come up with a correction factor for technical progress I've concluded that modern extraction methods result in much higher flow rates for longer and thus higher depletion rates. Certainly in the case of tight formations that where not producible without horizontal wells we have increased overall URR however I've not found convincing evidence that horizontal wells actually result in real increases in URR in general. The economics are great but the total recovery situation is murky at best.
In general once your done extracting with horizontal wells very little can be done to extract additional oil. At best you may have some bypassed oil that can be extracted with a few horizontal wells or a workover of the existing horizontal well. Your basically left with a field thats at 90% plus water cut and most of the remaining oil pretty much immobile. In my opinion running vertical wells and washing the rock in a sense at a high water cut probably results in higher URR.
The bottom line is advanced methods have a large impact on both production rates and depletion rates in old and new fields. This factor has not been adequately included in any of the peak oil proposals I've seen.
If you take into account technical progress and take the 1970's vertical well with water flood as a sort of baseline "standard" in my opinion 50% of the current production can be directly attributed to technical advances. So if we had stayed at the same technical levels as in the 70's oil production today would have been around 40mbd not 80mbd.
Sure some of this production would simply not be viable using the older technology but still its a big factor and in my opinion or URR estimates especially the estimates of the amount of oil remaining that can be extracted at a high production rate may be off by a large margin.
The amount of "fast" oil left to extract seems to be effectively the same as what M King Hubbert predicted for the work 1250 GB. We have extracted about 1100 GB+. And extract at about 30GB a year. A worldwide watercut of 80% plus indicates that this argument could be valid.
Thus if I'm right we will see global production effectively crash in the 2008-2009 time frame.
I could easily be wrong for example we could have 2500 GB of easily extractable oil that would give is 4-5 more years of production at our current rates but then I'd expect global water cut to be lower say 60-70%.
Certainly we have additional production from 90% plus watered out fields this stripper well production accounts for 2 mbpd in production from the US maybe 20-30mbpd of overall world production this is limited by water handling facilitates and declines at a slow rate. So we have a sort of base stripper well production level that can last for decades.
This leaves almost 50mbd of production that potentially has a short life span 10 years or less this comes from work overs of older fields and new generally offshore fields extracted at high depletion rates. I don't see us replacing this level of production in a ten year time frame. Also of course all the more traditional production thats mixed in continues to deplete. This is the super giant problem thats been well studied on the Oildrum. Production from the old super giants is distributed in both this 50% and the baseline stripper well level. A lot of the super giants are now stripper well production and some like Canterell and Ghawar seem to be benefiting from advanced extraction methods.
Taking 1990 as year zero for the introduction of horizontal drilling and other advanced practices and assuming the peak return on the use of the methods was around 2000 says we should start dropping off about now out to 2010-2012 or so.
The drop is eventually limited by water handling issues.
Better methods such as MRC wells where added later but they generally resulted in ever higher depletion rates so the overall technical boom if you will seems to stay centered around 2000. So although we continued to get higher production from methods developed later the depletion rates continued to increase.
I'm keen to see the mega-projects extended back past 2000 since it seems to me that most of the 10mbpd increase since then is purely from increased technical capabilities.
Time will tell of course but so far I've not figured out a way to discount a large technical effect and resulting asymmetric global production profile since I just don't see a lot of additional URR at high flow rates given the nature of our technology.
I'd love to see real experts comment on the various technologies and recoveries at the well and field level. I'd love to be proven wrong but more importantly I feel I've looked at the problem enough to hopefully convince people its something worthy of further deeper analysis. If its not pursued then time will tell I just can't see us making it all the way through 2008-2009 at the current production rates so we will know soon enough.
for the ghawar field at least, the remaining reserves are probably less than 40 gb. ace, stuart, and euan means did a lot of work on this a few months ago. with an initial rate of 5 million bpd, that implies a decline rate of 4 to 5% (assuming the decline starts about now), a decline of 225k bpd for the 1st year. if the decline phase is pushed back a few yrs , the decline rate is higher. if there are less than 40gb remaining, the decline is higher yet.
ksa claims to have 260 gb reserves, with ghawar at 40 gb remaining, that leaves 220 gb , or about two ghawars, for everything else. seems a little far fetched.
I share your view that Saudi reserves are likely somewhat overstated due to overambitious recovery factor claims - In our detailed modeling of north Ghawar, our estimates were not compatible with the official ones. That said, there's almost certainly a lot of oil left in the country. A rough, lower-bound estimate would be to take the 1979 OOIP figure of 530gb (from the 1979 Senate subcommittee report), and apply a global average 40% recovery factor for giant fields (from Laherrere's paper) to get a URR of about 210gb. With 120gb gone (cumulative production), that would leave about 90gb. I can't see it being much less than that. I found myself obliged to accept the Saudi statements on OOIP growth in 'Ain Dar/Shedgum while analyzing the situation there - I just couldn't make all the numbers balance without doing so. Therefore, I'm inclined to believe the OOIP numbers elsewhere also, which would mean a URR of something like 0.4*700 = 280, which would imply about 160gb left. At 9mbd, or thereabouts, that's a depletion rate of about 4% in the former case, and 2% in the latter case. So a precipitous decline is very unlikely to be sustained at those kind of low depletion rates. I think the decline last year probably reflects having failed to make the necessary investments in time to offset declines in some of the mature areas, rather than an absence of any investments to make. (I speculate that they ended up believing their own overstated recovery claims, and thus misplanned, but that is just speculation).
thank you for your response. and yes, i think the saudi's were caught with their pants down, so to speak. and the big question is: can their efforts compensate for the decline in ghawar ? it seems like the advancing oil/water contact has chased them to the very top of the reservoir. at some point, they will need to figure out how to handle large volumes of water, including the possibility of artificial lift.
and i doubt the decline in ghawar will follow a nice smooth curve.
"i'd love to see real experts comment"
that would be good, however being an "expert", imo, doesnt mean you know what is going on.
this jarrell guy makes reference to the jay field in florida, via an spe paper (discussing the recovery factors for 250 mature carbonate fields worldwide). anyhow, if you read the abstract of the spe paper (spe 84459), there is apparently some discussion of the effect of horizontal drilling on recovery factors. the price from spe is $6 for members or $20 for non members. i am no longer a member.
The issue at hand is Ron's claim that: "Those who are counting on a "gradual" decline in Saudi Arabia and Russia, I believe, are sadly mistaken. The collapse will be sudden and catastrophic."
I want to see the evidence/argument to support that claim. Give it to me full-strength, if you've got it. Convince me. So far, you're just playing word games.
we havent discusse my consulting fee arrangement yet.
Watch US production this year in fact take a hard look at it right now. As the US goes so goes KSA. All the technical factors that are a concern are a large part of the US's current production and they in general where deployed here first. If they are primarily causing faster depletion then US production should have already begun to fall quickly.
I don't know what the noise is in US production numbers but I'd guess until we see at least a 2-4% change or so or about 200-300 kbpd we won't know which way its going. The prediction is for a 4% increase.
But the US should lead KSA going down if the technology argument is valid. Timing could easily be off but the relative differences should be right. We will see.
So if I'm reading the first graph correctly, Russia multiplied its rigs by 3 between 2004 and 2007 but only managed to increase production by a mere 15%! What possible economic motivation is there for such a poor investment?
I mean, if they are honest to themselves about the prospects for their depleted fields in their annual reports, then why not make huge profits in the long run by moderating production now and conserving capacity for when the oil really hits high prices?
EDIT: ok, now that my other braincell woke up: of course they are having to drastically increase the number of rigs to make up for the depletion of existing production - and really its the greed of the investors which is driving these insane economics now...
To your first point, most people including most people involved in the production of oil do not see a near term peak [I do.] Not producing is not really an option unless you are a national oil company. You have leases which lapse if not active. You have equipment which rusts and decays. You have no revenue, but you still have bills.
To your "edit": Nothing in the postings indicates that the economics are bad let alone "insane" in the usual sense. Drilling wells that initial for 50 barrels per day onshore in the U.S. or Canada can be very profitable if the well is not too deep, the initial decline is not too steep, it doesn't make a lot of water and is not in a remote location. I suspect the Russians are doing a lot better than that.
Thanks Stuart !!!!
Russia is probably the primary example of how application of modern EOR methods can slow or stop decline at the expense of increasing depletion. I suspected that a lot of our new production over the last few years is simply a result of better field management at least as far as extraction goes. But until proven otherwise we can assume that in general all they have done is accelerate their depletion rate to maintain the production rate.
I think that you will find that to a lesser extent but still significant the entire oil industry underwent a similar decline and lack of investment as oil prices fell in the 1990's and that a lot of the production boost once prices increased was for the same reasons in Russia. Modern extraction methods where applied to the older fields.
Do you have any idea what the current depletion rates could be for Russian fields. I'd guess that it went from around 5% up to the range common for modern methods of 10-20%.
I found this its for gas wells but oil wells have a similar technical profile.
http://www.merrimacog.com/index-1.html
More on gas wells but the concepts are useful.
http://gswindell.com/tx-depl.htm
So going from 20 years to 3 years gives a 600% increase in depletion rate from 5% to 30%.
This is a good paper on MRC wells and modern methods.
http://www.spe.org/spe-site/spe/spe/jpt/2007/11/jpt_2007Nov_64_114.pdf
A good reason to suspect that real depletion rates are high
is simply to look at how the government is handling the issue from a tax basis.
http://inhofe.senate.gov/public/index.cfm?FuseAction=PressRoom.Speeches&...
It seems that the previous method does not work anymore.
If anyone finds data on oil well depletion rates for various types of well/reservoir types that would be great.
Lukoil is more than replacing its reserves each year, and their reserves are audited by western reserve auditors. So I think it's pretty unlikely the depletion rates are anywhere near as high as you suggest.
Stuart I question the reserve estimates made by the western countries to be honest. The methodology they use is effectively as opaque as Saudi Arabia. I do know that in deep water GOM for example they are not getting the production rates for the length of time the expected thus I'd assume this means the actual reserves where less than they had projected.
The problem is if reserve estimates are highly inflated and we are also capable of maintaining high production rates right to 80% plus depletion you don't know the real answer till right at the bitter end. Look at the North Sea and "western" estimates and reality. How can you maintain that western companies have accurate reserve estimates when in almost all cases the peak and decline of their fields has taken them by surprise. Consistently they have mixed increased production rates from EOR with increased recovery.
For example
http://en.wikipedia.org/wiki/Enhanced_oil_recovery#Examples_of_current_E...
This link has the claim that EOR methods could increase reserves in the US by 240 GB of oil. I'm sorry but I find this hard to believe.
http://www.fossil.energy.gov/programs/oilgas/publications/eor_co2/G_-_Up...
http://www.fossil.energy.gov/programs/oilgas/eor/Undeveloped_Domestic_Oi...
This is DOE reporting but prove that commercial reserve estimates don't have similar wishful thinking.
Finally no one disputes that the world is at greater than 75% water cut in general not even Lynch.
Given this level of water cut and our current extraction rate one has to conclude that depletion rates are now much higher then they where in the past.
Now to focus on Russia. One thing thats not been brought up is once they frac these wells they only get high production rates for a year or two in some cases.
http://www.oilandgaseurasia.com/articles/p/34/article/276/
So fracing does work to stabilize and often increase production over the short term and its a valid method also it can be repeatedly applied however it does not mean you have in general made any longer term gains in productivity.
Where is Russia at as far as depletion rates who knows. Given the methods they are using I can't see why it would not be in the 10-20% depletion regime.
Right now Russia is undergoing a boom in applying various fracturing methods and this certainly results in short term production gains in most cases i.e over say 1-3 years vs previous production levels. However over the longer term its no uncommon for production to go into ever steeper declines. This indicates that fracture treatments almost always result in high depletion rates but not always in higher recovery rates.
This is a pretty nice paper on refacturing and problems with fracturing.
http://www.halliburton.com/public/news/source_files/Newsletters/KCNews/2...
It in my opinion highlight that fracturing is primarily designed to increase flow rates not increase recovery.
In any case a detailed discussion of fracturing treatments by a expert would be welcome on the TOD. My own reading has obviously left me unconvinced that most of the current advanced methods have resulted in any significant increases in recovery percentage. Obfuscating this is it seems obvious to me that modern extraction methods can easily keep production high even in older mature fields well past 70% depletion and often till the fields are 90% depletion. Thus inflated reserve estimates cannot be verified by production rates until near the end of life of a field.
Consider two similar fields developed 5 years apart and assume both have inflated URR estimates of 50% and assume that the project production is sustained at some level for 10 years. Instead field one begins to decline in 5 years instead of ten. The decline in the first field is attributed to technical problems not a over estimation of reserves and the second fields reserve estimates are not revised. Overall production remains constant as long and new fields or redevelopment can ensure production levels are maintained.
In general since overall production levels are high the accounting errors from over estimated reserves are simply rolled forward every few years via inflated reserve increases for redeveloped old fields and new ones. Its like a consumer using new credit cards to pay off old credit card debt. It works like a charm till it fails. The truth only comes out when your out of fields that can be reworked and out of new fields to develop. At that point real reserves and real depletion rates quickly become obvious. Just like toe consumer playing the credit card game eventually the truth comes out. We shall see but at this point I don't find western reserve estimates credible much less those from Russia or OPEC.
If everyone was lying to us, then we would not be in a position to infer anything at all, one way or or the other, having no valid data at all from which to reason. Thus the situation would become a Rorschasch test, onto which we would project our prejudices.
Personally, I accept the traditional view that SEC proved reserves tend, on the average, to be underestimates that grow over time.
Look you don't have to accept any numbers besides production number within reason. HL is a decent heuristic and we have the shock model which is far more realistic. The models are in rough agreement. But both do not include a correction factor for technology. The treat extraction of a barrel with 1970's technology as equal to production from a modern MRC well drilled in a thin layer of oil.
And you have a second widely accepted number which is the global water cut. Which right now should be over 80%. 75% was widely published several years ago and recently 80% was published for today.
Given the production data the models and knowing the water cut. One can estimate the available reserves. We also have a effectively pre technology estimate from M King Hubbert of 1250 GB of reserves. He is the only person who has successfully predicted peak oil in the past and I refuse to dismiss his prediction for the world of a peak in 1995 out of hand.
Next we know two additional fact the technology of oil extract made tremendous strides in the 1980 and afterwards.
This was driven by the earlier US peak. So in the 1990's we had a combination of two factors technical expertise had increased tremendously and the world should have been at peak extraction rates according to M King Hubbert.
The above ground situation was that the price of oil crashed and real production was curtailed. Next the Soviet Union collapsed in part certainly because of oil prices curtailing demand in the FSU. We where at that point swimming in oil. If you follow water cut it actually stayed constant for decades till about 2000.
http://www.touchbriefings.com/pdf/2590/Ferro.pdf
Next we know additional facts.
In 1963 a Hydrologist named Al Naimi studied at Stanford University. In 1963 a famous hydrologist named M King Hubbert to a faculty position at Standford University teaching Hydrology.
http://www.kaust.edu.sa/about/bio-al-naimi.aspx?nav=psc
http://en.wikipedia.org/wiki/M._King_Hubbert
Al Naimi was later fast tracked to take over Aramco after serving as VP of production. Interpret this information however you wish but don't dismiss it.
Finally in attempting to judge the correction factor to Hubberts methods to take into account technical advances the end result is they have been astounding. Our ability to extract oil vs the 1970's can be likened to the difference between the first airplanes and a modern jet liner or to the rise of the computer industry. In fact from a overall technical perspective the number one achievement of the oil age has been the ability to extract oil all other advances pale in comparison. I doubt that many readers of the OilDrum truly appreciate our technical prowess. To be honest I was floored. Just the offshore oil extraction platforms alone dwarf anything we have ever done at NASA. And on the computer side at best the financial markets might rival the capabilities of the oil industry and this is doubtful. Especially since they deal with a myriad of problems diffusing the advantage of computers while the oil industry is focused. I must admit I was humbled in my studies.
But I'm attempting to discern a correction factor for technology the problem is it tends to be huge. In fact it accounts for practically all of the production increases since 2000 and stable production since the 1980's. Putting peak at 1995 and discounting the fact we where swimming in oil at that point still leaves a huge wedge of production that can readily be assigned to technical progress. At the moment it seems to represent 30-50% of the world oil production. In other words if we still used 1970's technology then oil production would be up to half what it is today if not lower.
This is critical since to understand my argument simply extrapolate that oil technology is frozen at 1970's extraction abilities. It obvious we would be at far lower production rates. This is IMPORTANT.
Next of course we have increased URR not only extraction ability but unfortunately URR is limited by fractional flow. Any hydrologist understands that technology may change extraction rate but the basic problem is water. Only two hydrologists on this planet have successfully figured all this out.
Or three including FractionalFlow.
Since when is global water cut a "widely accepted number"? You give a link to a report which presents a "rough estimate" with no indication at all of how it was arrived at. And by what criterion do we decide to believe this report, but throw out the reserve numbers (which are at least audited)?
Michael Lynch accepted 75% a while back.
http://business.timesonline.co.uk/tol/business/columnists/article3055813...
As they say in poker readim and weep.
That isn't remotely more persuasive. Where does the data come from that is being averaged to get 75%? (I'm not saying it isn't so, just how could we, or anyone else, figure it out one way or the other?)
Here is Lynch's paper
http://www.gasresources.net/LynchM%2006%20(Crop%20Circles).pdf
In here is the water cuts for the USSR.
http://books.google.com/books?id=lgKjQr4MZTMC&pg=PA51&lpg=PA51&dq=oil+wa...
Here is a neat article on a well.
http://www.welldynamics.com/technology/case_studies/case_study_01.htm
And more
http://www.odac-info.org/assessments/documents/ponlreport.pdf
Water cut is published from reliable resources for most fields. In fact Simmons seized on this issue for Ghawar.
And here is the context of the original paoper.
http://www.touchoilandgas.com/global-onshore-offshore-water-a7137-1.html
Just spot checking other sources for water cut indicates to
me that the number are reliable its easy enough to find water cut numbers for a lot of the ME fields US North Sea China etc.
"Water cut is published from reliable resources for most fields".
Well, I sure don't know where to find it. For example, for OPEC, I have seen tolerably recent published data for the water cut in parts of Ghawar (North 'Ain Dar, North Uthmaniyah, and Haradh), but that's about it. I know of no systematic source. If I want to know the water cut for Safaniyah, or Burgan, say, where would I find it?
Again, I'm curious what in your mind makes the water cut numbers all from "reliable resources", while the reserve numbers are all unreliable?
Until Simmons book was published water cuts where not considered a political number and its difficult to discuss and part of the production of a field without bringing out the real water cut. And its something that can be reliably measured. Note given the noise in production data I also tend to think these numbers are fairly reliable.
Reserve estimates should in my opinion be treated as a unknown or at least filtered through a reliable proven model before the numbers are accepted. It seems clear from all the work done to date on the OilDrum that industry reserve estimates are overstated at least for the Middle East. I'm not aware of any work to review reserve estimates outside of the ME. In attempting to try and understand how to correct methods such as HL for advances in extraction technology over time my conclusion is that the correction is probably large i.e today we can extract oil 50% faster than we could in the 1970's and thus depletion rates have risen substantially over time. On a field basis they seem to have gone from around 5% to 10%-20% with a lot of offshore fields having productive lifetimes around 5 years. This is a combination of smaller fields and more advanced methods.
Given what seems to be a real increase in depletion rates over time corrections to HL or a depletion rate shock for the shock model indicate to me that reserve estimates from these models without the correction can be off by as much as 50%.
This is all back of the envelope style projects but I'm pretty comfortable with the concept that technical advances have had a significant impact on oil production and that the current models we use are not corrected for technical advances. Next they tend because they allow production rates to remain high for most of the lifetimes of a well to result in asymmetric production profiles square or shark fin curves with production dropping suddenly of plateau at the end of the life of the well or field. I contend that this asymmetry is probably large enough to effect the global production profile.
A simple way to think about it is consider that oil extraction technology was frozen at 1970's levels where would be we today ?
We need to correct our models and assumptions for technical advances the assumption that they have resulted in equal increases in extraction rate and increased reserves has no basis in fact.
In my reading its not clear to me that we even have accepted practices for using well log data from horizontal wells for reserve estimates.
Russia is kicking the liberal neo cons we have in office all over the playing field, and the new prospects (with the exception of Ron Paul) are much worse then what we have now.
LINK
Stuart,
I don't know if you saw my For Russia, An End To Growth is In Sight, but it may have information in it (also gleaned from Russian oil company annual reports) that you could integrate with what you already have. Here's a sample:
There are links to referenced projects (eg. Vankor above) in the original.
I have already referenced your Wikipedia Megaprojects in my column at ASPO-USA and will be using your data in the future. Many thanks for this great public resource.
Dave
Thanks Dave - I hadn't seen your piece, but it's interesting reading.
I fixed some of the links. Rosneft used to let you "drill down" to individual fields but they changed their website. So, they're offering less information now than they did before.
A recent update Russia says oil production growth to slow confirms the analysis I did last summer (November 19th).
At that time I said that 10.6 million b/d was the upper limit on Russian production, but I thought it would come in a few hundred thousand barrels below that. Now, they're saying 10.4 million b/d. The IEA assumption of a 3% decline rate for Russia turns out to be optimistic, as I said at the time.
As goes Russia, so goes non-OPEC.
Meanwhile; oil rises to $94/barrel on speculation that U.S. inventories fell for sixth straight week.
The word insanity is appropriate to describe the mental state of the market moving speculators when they respond to stock levels and not supplies. Stocks won't save the US and other consuming nations from sustained falls in supplies.
Stuart,
Thanks for doing all this research! I think it is very helpful.
Without looking into details, one can get the idea that the only two variables (or at least the major two variables)that determine world oil in production in a given year are:
1. Decline rates on existing production.
2. New megaprojects.
You have shown that in Russia, better technology either caused the oil to be produced faster, or caused a higher recovery percentage, or both. Thus, for Russia, there is a third factor that is important.
I think that factors other than 1 and 2 are important for several countries in the 2003 and 2004 period. When we look at the years 2003 and 2004, we find that total world production was increasing. The individual countries with the biggest year-to-year increases were Saudi Arabia, Russia, Algeria, Iran, UAE, and Iraq. (See my earlier comment.)
I haven't looked at the megaprojects list recently, but when I looked at it earlier, I didn't see megaprojects to explain the large increases in any of the countries listed above. It seems likely that most of the increases were caused by factors other than (1) and (2) above - such as use of previously idle capacity or improved use of technology.
If factors other than (1) and (2) were affecting 2003 and 2004, it doesn't seem to me that we can use megaprojects data for those years to test decline rates. Even if we knew the decline rates for 2003 and 2004, it is not clear they would be good predictors of future decline rates, if new technology is causing oil to be pulled out more quickly, as memmel suggests may be the case.
Intuitively, using megaprojects to predict future production seems like a good idea - I'm just not certain how helpful the older years are in predicting what is ahead.
Well, as always, it's going to be an extrapolation game. If indeed there is a fairly steady trend in the overall growth/decline rate in the pre-megaprojects production, then we can extrapolate that trend. Obviously, such extrapolations always come with some caveats, but it's probably more useful than just wringing our hands.
This is close to the line of the thought I was going to ask about..
What do you think the implications are of this for the interpretation of 'is decline rate of base production accelerating'?
Perhaps one of the main reasons why base production seems to be declining faster, is that these efforts to rehabilitate old fields and apply best practice in new areas reached their peak in the 2000-2005 window and that we are now seeing smaller gains in those areas?
If, hypothetically, the production increments from those activities were highest before 2004, and contributing less each year since then, we would expect to see the 'decline of base production' accelerating as you observed from the Megaprojects analysis?
cheers
Phil.
Phil - I really haven't reached any place of new clarity on the global issues yet - we are still in the weeds of establishing confidence that the lists are really complete and correct. Eg, investigating Russian stuff caused a 550kbd project in 2004 (Priobksoye) to turn into a 220kbd one in 2003 (South Priobskoye), once I understood the issue more clearly, and caused another to vanish from 2005 because it was (more correctly) duplicated in 2009 (Prirazlomnoye). When we are still finding errors of that magnitude in the lists, I hesitate to try to draw firmer conclusions. Hopefully we'll be able to keep plugging away and get to the point of confidence in the lists. Then I, and no doubt others, will publish more analysis of what it all really means.
Thank you.
But the mega projects list is critical fist as a report card for oil production in the future second if we collate the same list back in time to tease out the effects of new production vs other reasons for production increases.
So its our way to ferret out the truth. In time the megaproject report card if you will will eventually tell us the real situation and we can plug the info back into the shock model and I suspect you end up at the same place I'm at.
Ohhh Shit.
My humble two cents:
1. decline rates should be estimated from production capacity and not actual production which is affected by withheld capacity (Nigeria, Iraq and probably Saudi Arabia are not producing at full capacity) otherwise decline rate estimates will be higher. Another way to do it is to estimate decline rates on a subset of countries which have unconstrained production (Norway, US, Russia, etc.).
2 two years is not enough, we need to track projects over five years at least in order to get a good estimate. There is a probably a transition period where decline rates seem to accelerate because new fields that came online just before 2003 are still growing in 2003-2004. This transition period is observed on available field datasets (UK and Norway).
3. There is a flurry of small projects that are not in the megaproject list and their impact on the decline rate estimates is not clear. However, underestimating future new supply will probably result in more optimistic decline rates.
Hi Stuart, as usual you are bringing fabulous reports to TOD.
I have a hunch that a less ideological Kremlin -- one less obsessed than Putin in standing up for Russia and more pragmatic about what's needed, such as Medvedev for instance -- will aggressively invite in the oil services companies to see about arresting the decline rates both in the oil and natural gas fields.
If the stats are correct about decline and consumption trend lines, Medvedev will be almost forced to.
Thoughts?
Steve LeVine, author
The Oil and the Glory
http://www.oilandglory.com
Russia already got burned by Khodorkovsky who over-exploited oil fields and stashed the revenues of Yukos in offshore banks via assorted shady schemes. There is nothing desperate about Russia's current oil production situation and more importantly nothing that magical western "help" can do to make it better. Russia does not need to pump its oil faster.
That was an excellent book. Your website is a great resource for keeping track of events in the FSU.
Dave
Steve, off the subject, I heard part of an interview with you on National Public radio out of Champaign Urbana in which you cited the flawed USGS study for the proposition that 25% of the world's oil in in the arctic. Do you believe this? I'll have to get the transcript to read the whole thing.
In looking over some projections done awhile back by ASPO and here at TOD, the view then was a Russian peak less than 10 mbd in the 2008 to 2010 time frame at a "catching up" juncture from the Soviet mismanagement phase to the present better management phase. Does all this new information improve that view any?
Stuart, thank you.
I saw Viktor Khristenko Russian oil minister stand up at Opec on Sept 11 and state it was policy not to go much above 10mbpd.. They are in political plateau mode.
I'd like to add one chart that was left out proven reserves:

RIA Novosti: yesterday in a press conference, the emergency minister of Russia, Sergei Shoigu, said that the continuing melting of the permafrost in Russia's north is endangering oil and gas production. Service roads and pipelines are loosing their footing as the icy ground thaws.
It's possible, the same thing is happening in Canada.