Food to 2050
Posted by Stuart Staniford on March 10, 2008 - 8:40am
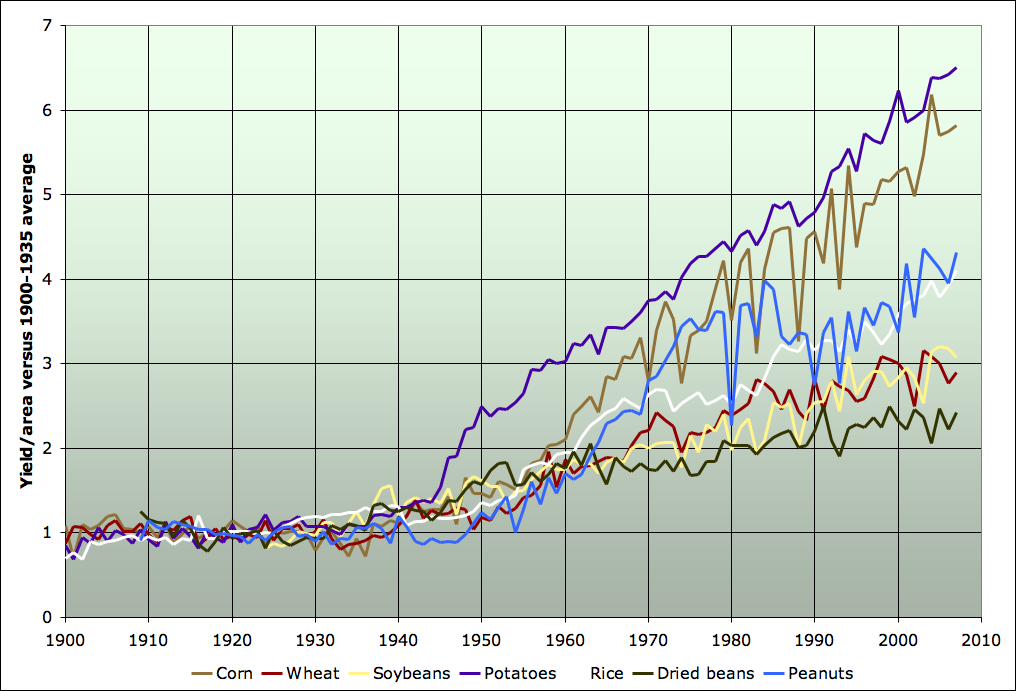
Average United States yields per unit area for various crops, 1900-2007. Yields are expressed as a multiplier of the 1900-1935 average. Source: National Agricultural Statistics Service.
In Powering Civilization to 2050 I argued it was potentially feasible to transition to power civilization with a mix of solar, wind, and nuclear energy, with the transition well on the way to completion by 2050. (Luis de Sousa made a broadly similar argument in Olduvai Revisited 2008). This would require a period of belt tightening and conservation in the next couple of decades, but once the transition had overcome the critical threshold (as solar energy in particular became cheap), I suggested energy in general would get cheap again. I adopted the UN medium population projection which has population at about 9 billion by 2050, with growth slowing sharply. Making plausible assumptions for economic growth between now and 2050 if energy was available, we got to a world GDP of about $350 trillion in 2050 (in 2006 purchasing power parity dollars), versus about $70 trillion in 2007
- Population: The global population is able to grow and go through its demographic transition with death rates continuing to go down. No die-offs.
- Economy: The world economy is able to grow on average over the period - modestly in developed countries, faster in developing countries.
- Carbon emissions: The global energy infrastructure will be mainly replaced with non-carbon-emitting energy sources by the end of the period, and residual emissions will be rapidly diminishing.
- Fossil fuels: I assume that peak oil is here about now but that declines will be governed by the Hubbert model (and thus will be gradual). I assume natural gas and coal are globally plentiful enough that climate policy is required to prevent their full use.
- Technology: I do not assume any massive breakthroughs - no technological miracles that solve problems in ways completely unknown or untested today. However, where technological sectors have long established rates of progress in key metrics, I extrapolate the metric to continue improving at the historic rate (eg the economics of solar power, or the yields/acre of agriculture are assumed to keep improving on the historical trajectory).
- Impact on wild ecosystems. Developed countries are assumed to maintain the protections they currently have in place (for national parks, wildernesses etc). Developing countries are assumed to exploit their unused land up to the point of best current practices for developed countries. Whatever impact on ecosystems arises from climate change due to past carbon emissions and the tail of emissions to 2050 is viewed as unavoidable.
- Conservatism Other than the above, I use the overarching principle of trying to assume as little change in the way the world works as possible - I assume it remains a more-or-less free market world, in which national governments regulate their own countries to temper the worst excesses of the free market and periodically enter into treaties on the more pressing global problems. I assume it remains full of highly imperfect humans mostly struggling to improve their own circumstances. I assume people are willing to come together and take collective action for the common good, but only when the need for that action has become so overwhelming and immediate as to be irrefutable.
If the average global citizen was significantly wealthier in 2050, they would undoubtedly want to drive more. The switch to primarily electrical energy sources for civilization would preclude doing this with all liquid fuels. In Four Billion Cars in 2050? I argued that, given that the average citizen will be living in a dense third world city by 2050, we can assume rates of ownership typical of the most car-free corners of western Europe at the moment (Holland), which gives rise to a few billion cars in 2050. I further argued that it seems feasible that this many plugin-hybrids could be built - there appears to be enough lithium for the batteries - and run on less than 10mbd of liquid fuels.
In this piece I want to look at another area that many people think is likely to be a critical bottleneck to civilization continuing - the area of food, agriculture, and soil. I am of course not an expert in these areas, but happily there is a lot of excellent scholarship and scenario building that I can lean on. My task is reduced to reporting of the existing science, with some modest adjustments to reflect where my assumptions differ from those of published scenarios (most especially the assumption of a near-term peak in oil supply, and a full-speed effort to convert society to carbon-free energy sources.)
Let's begin with two very helpful UN Food and Agriculture Organization reports: World agriculture: towards 2015/2030, and the sequel World Agriculture: Towards 2030/2050. What these reports do is basically look at projections for population and economic growth and then estimate how much food people would want in the future, and what quantity of agricultural commodities would be required to fulfill that demand. The first report focusses a lot more on the supply-side factors of how this could be done, while the second report extends the analysis out further in time but confines itself much more to demand side considerations.
The input assumptions about population and world GDP are slightly different than mine, but close enough that I am just going to adopt their food scenario wholesale, rather than trying to construct my own from first principles. The differences would be small - much smaller than the other uncertainties in the problem. Let me first summarize their scenario, and then we will start to explore the potential bottlenecks that might prevent achievement of this much food production. (However, I strongly encourage readers that care about where their food is going to be coming from in the future to take the time and read the FAO reports themselves.)
Let's start with a look at what the FAO scenario has for average nutrition. This next graph shows both history and projections to 2050 for daily dietary energy (in Kilocalories/day/person) in various regions of the world, as well as the global average.

Per capita food availability 1970-2050 for various regions, together with world average. Values for 2000 and before are data (left of the vertical red line), 2010 onwards are projections (right of vertical red line). Source: Table 2.1 of UN Food and Agriculture Organization, World Agriculture: Towards 2030/2050.
I could quibble with a few things here - I might guess that wealthier developing countries will get closer to current developed country averages by 2050, and I wonder about the sharp trend break between the past and the projections in the developed world. Still, these are minor issues - I think this has to be in the right ballpark for any scenario that assumes continued improvement of economic conditions in the developing world, and no major societal collapses (which is what we are trying to figure out how to avoid).
If we take the FAO's scenario breakout of food groups (which they give by weight on a per-capita basis) and multiply by population, we get the following for total food demand:
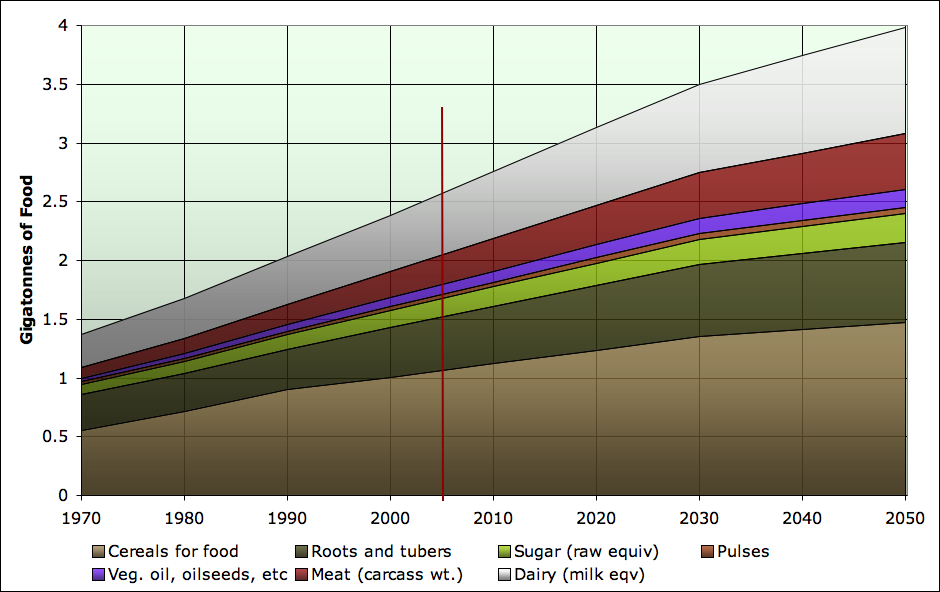
Total food requirement 1970-2050 by major food types. Values for 2000 and before are data (left of the vertical red line), 2010 onwards are projections (right of vertical red line). Source: Table 2.7 of UN Food and Agriculture Organization, World Agriculture: Towards 2030/2050 and UN Medium Population Scenario for population figures. Note that I did not include "Other food", which is only given in calorific terms in the table, and constitutes less than 10% of calories. Fruits and green vegetables would be included under that category.
Let's now consider a variety of potential bottlenecks to achieving this kind of increase in food production. One major area of concern (water) I will reserve for its own future piece, but I address the other big potential constraints that I am aware of.
Land Use and Crop Yields
The doubling of global food production since the 1960s has not come about because of expanding cropland. The world has about 14.8 billion hectares of land area, and the uses of it over the last few decades are as follows:

Major classes of global land use 1961-2003. Source: FAO.
I'm going to start with some yield data for the US, where we have long time series on yields for a number of crops. After that, we'll discuss the global situation. I have taken National Agricultural Statistics Service data on average US yields and reexpressed them on a common basis as a multiplier of the 1900-1935 average (or for those crops were the series doesn't start till after 1900, from whenever it does start until 1935).
Average United States yields per unit area for selected crops, 1900-2007. Yields are expressed as a multiplier of the 1900-1935 average. Source: National Agricultural Statistics Service.
Firstly, mechanization (and fossil-fuel powered machinery) are not the main cause of modern yields. Steam tractors were in widespread use in the late 1800s and early 1900s:

Steam Tractor in action in Ontario, 1916. Source: Ontario Govt Photo Archive.
The Green Revolution strategy emerged from a surprising confluence of different lines of agricultural research (Evans, 1998) – the development of cheap nitrogenous fertilizers, of dwarf varieties of major cereals, and of effective weed control. Nitrogenous fertilizers increase crop production substantially, but make plants top-heavy, causing them to fall over. The development of dwarf varieties solves this problem, but at the cost of making plants highly susceptible to weeds, which grow higher than the dwarf plants, depriving them of light. The development of effective herbicides removed this problem. Further Green Revolution development focused on crop breeding to increase the harvest index – the ratio of the mass of grain to total above-ground biomass.
Secondly, anyone who wants to suggest that the world can be fed other than through industrial agriculture has some explaining to do about this data. Every crop shows yields prior to the green revolution that were flat and a small fraction of modern yields. If we returned to yields like that, either a lot of us would be starving, or we'd be terracing and irrigating most of the currently forested hillsides on the planet for food. While shopping for locally grown produce at your nearest organic farmer's market, stop and give a moment of thanks for the massive productivity of the industrial enterprise that brings you, or at least your fellow citizens, almost all of your calorie input.
Which raises a third important point. Food = Area Cropped x Average Yield. If average yields had not increased like this, humanity's impact on natural ecosystems would be much greater. It's true that industrial agriculture has a lot of impacts (nitrogen runoff and the like). However, the alternative would probably have been worse, since it would have required us to intensively exploit enormous areas of fragile, and currently less intensively exploited, land.
Fourthly, the period of greatest global warming, since 1950, coincides with the explosion of yields. I do not suggest that global warming caused increased yields. But at any rate, it would be hard to argue that industrial agriculture yields cannot grow rapidly in the face of the kind of warming we have seen to date: they just did
Well, is the global situation the same, or is this US data unrepresentative? I don't have access to as much data, but roughly, yes, it's the same:
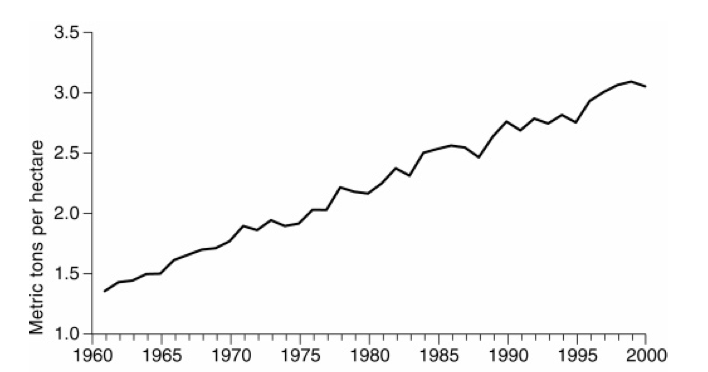
Average global cereal yields, 1961-2000. T. Dyson: World Food Trends: A Neo-Malthusian Prospect?, compiled from FAO data.
As you can see, global cereal yields are on the same roughly linear upward trajectory since 1961. Cereals are by far the most important food crop since not only do people eat a lot of them directly, but they also account for much of the input to the meat and dairy food groups that people eat, and thus are the base for the bulk of human calorie intake.
So obviously the critical question is whether or not yields can continue to increase in this manner? If we can just project out the linear increase than clearly a linearly increasing amount of food from a roughly constant amount of land is feasible, and humanity will be able to feed itself without having too much further impact on other ecosystems. On the other hand, if yields fail to increase, then we will be faced with unpleasant tradeoffs like trying to farm fairly unsuitable regions (think tropical rainforests, or the hilly parts of the western US), or not have enough food. So are we near some kind of theoretical yield limit?
Some people seem to think so. Lester Brown, who has been issuing alarming prognostications about food for several decades now, writes in Chapter 4 of his book Outgrowing the Earth
Although the investment level in agricultural research, public and private, has not changed materially in recent years, the backlog of unused agricultural technology to raise land productivity is shrinking. In every farming community where yields have been rising rapidly, there comes a time when the rise slows and eventually levels off. For wheat growers in the United States and rice growers in Japan, for example, most of the available yield-raising technologies are already in use. Farmers in these countries are looking over the shoulders of agricultural researchers in their quest for new technologies to raise yields further. Unfortunately, they are not finding much.The argument in the second paragraph doesn't hold water to me. Population has been increasing pretty much linearly in recent decades, and agricultural yields have also been increasing pretty much linearly - I don't see any break from that pattern in the 1990-2000 decade. Of course, a linear rise will look like a dropping exponential growth rate, but Brown is careful to only point out the slowing in the yield growth rate. What he doesn't tell you is that world population growth had also dropped to only 1.4% during 1990-2000. In general, food prices until very recently were in a multi-decade secular decline, indicating that food production was not under serious supply-side constraint until the last few years:From 1950 to 1990 the world’s grain farmers raised the productivity oftheir land by an unprecedented 2.1 percent a year, slightly faster than the 1.9 annual growth of world population during the same period. But from 1990 to 2000 this dropped to 1.2 percent per year, scarcely half as fast.
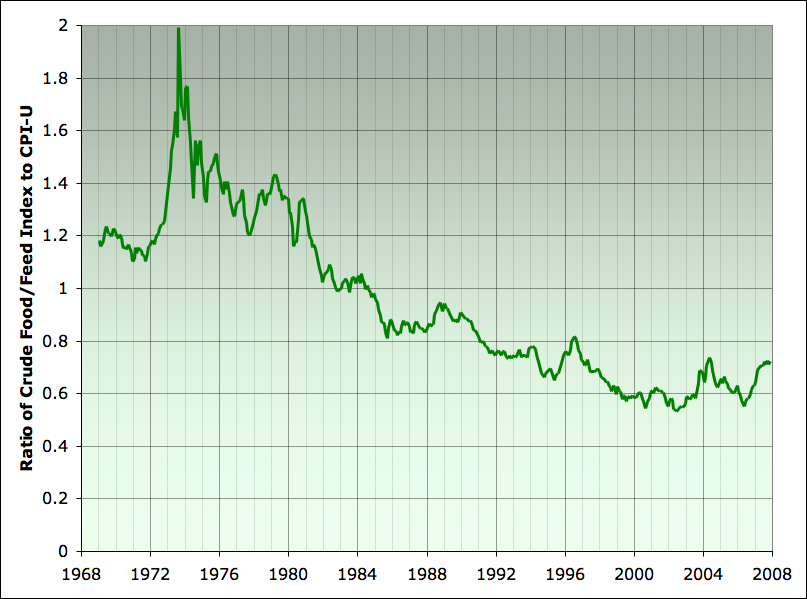
Ratio of crude food/feed producer price index to all US consumer prices, Jan 1969-Dec 2007. Source: St Louis Fed.
And the argument in the first Brown paragraph I quoted doesn't seem to be how the agricultural scientists themselves are feeling. For example, Science reported last week:
A decade ago, sequencing the maize genome was just too daunting. With 2.5 billion DNA bases, it rivaled the human genome in size and contained many repetitive regions that confounded the assembly of a final sequence. But last week, not one but three corn genomes, in various stages of completion, were introduced to the maize genetics community. In addition, researchers announced the availability of specially bred strains that will greatly speed tracking down genes involved in traits such as flowering time and disease resistance. These resources are ushering in a new era in maize genetics and should lead to tougher breeds, better yields, and biofuel alternatives. "We're sitting on very exciting times," says Geoff Graham, a plant breeder at Pioneer Hi-Bred International Inc.The geneticists are well on the way to having complete genome sequences for thousands of corn varietals from all over the world. If I was a corn geneticist, I'd be pretty excited too.
A more grounded attempt to estimate the issue seems to be the FAO's discussion in World agriculture: towards 2015/2030:
The slower growth in production projected for the next 30 years means that yields will not need to grow as rapidly as in the past. Growth in wheat yields is projected to slow to 1.1 percent a year in the next 30 years, while rice yields are expected to rise by only 0.9 percent per year.For example:Nevertheless, increased yields will be required - so is the projected increase feasible? One way of judging is to look at the difference in performance between groups of countries. Some developing countries have attained very high crop yields. In 1997-99, for example, the top performing 10 percent had average wheat yields more than six times higher that those of the worst performing 10 percent and twice as high as the average in the largest producers, China, India and Turkey. For rice the gaps were roughly similar.
National yield differences like these are due to two main sets of causes:
Some of the differences are due to differing conditions of soil, climate and slope. In Mexico, for example, much of the country is arid or semi-arid and less than a fifth of the land cultivated to maize is suitable for improved hybrid varieties. As a result, the country's maize yield of 2.4 tonnes per ha is not much more than a quarter of the United States average. Yield gaps of this kind, caused by agro-ecological differences, cannot be narrowed.
Other parts of the yield gap, however, are the result of differences in crop management practices, such as the amount of fertilizer used. These gaps can be narrowed, if it is economic for farmers to do so.
To find out what progress in yields is feasible, it is necessary to distinguish between the gaps that can be narrowed and those that cannot. A detailed FAO/IIASA study based on agro-ecological zones has taken stock of the amount of land in each country that is suitable, in varying degrees, for different crops. Using these data it is possible to work out a national maximum obtainable yield for each crop.
This maximum assumes that high levels of inputs and the best suited crop varieties are used for each area, and that each crop is grown on a range of land quality that reflects the national mix. It is a realistic figure because it is based on technologies already known and does not assume any major breakthroughs in plant breeding. If anything, it is likely to under-estimate maximum obtainable yields, because in practice crops will tend to be grown on the land best suited for them.
The maximum obtainable yield can then be compared with actual national average yield to give some idea of the yield gap that can be bridged. The study showed that even a technologically progressive country such as France is not yet close to reaching its maximum obtainable yield. France could obtain an average wheat yield of 8.7 tonnes per ha, rising to 11.6 tonnes per ha on her best wheat land, yet her actual average yield today is only 7.2 tonnes per ha.
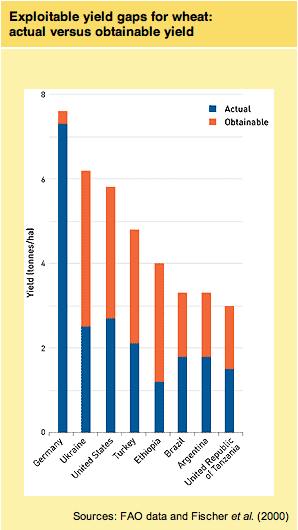
Gap between actual national yields and estimated yield with best currently known varietals and inputs. Source: FAO report, World agriculture: towards 2015/2030
And so,
Similar yield gaps exist for most countries studied in this way. Only a few countries are actually achieving their maximum obtainable yield. When real prices rise, there is every reason to believe that farmers will work to bridge yield gaps. In the past, farmers with good access to technologies, inputs and markets have responded very quickly to higher prices. Argentina, for example, increased her wheat production by no less than 68 percent in just one year (1996), following price rises, although this was done mainly be extending the area under wheat. Where land is scarcer, farmers respond by switching to higher-yielding varieties and increasing their use of other inputs to achieve higher yields.Another way to try to get at the issue is to look at how current yields compare to the theoretical potential of photosynthesis. This is generally expressed as net primary productivity (NPP) - the amount of carbon that plants can fix, exclusive of that used to power their own respiration. The net primary productivity is the photosynthetic product that is available to be eaten by people and other animals, rot into the soil, etc. Here is a map of the fraction of net primary productivity appropriated by humans published by Haberl et al last year in the Proceedings of the National Academy of Sciences, which I take to be a decent representative of the state-of-the-art in this kind of calculation:It seems clear that, even if no more new technologies become available, there is still scope for increasing crop yields in line with requirements. Indeed, if just 11 of the countries that produce wheat, accounting for less than two-fifths of world production, were to bridge only half the gap between their maximum obtainable and their actual yields, then the world's wheat output would increase by almost a quarter.
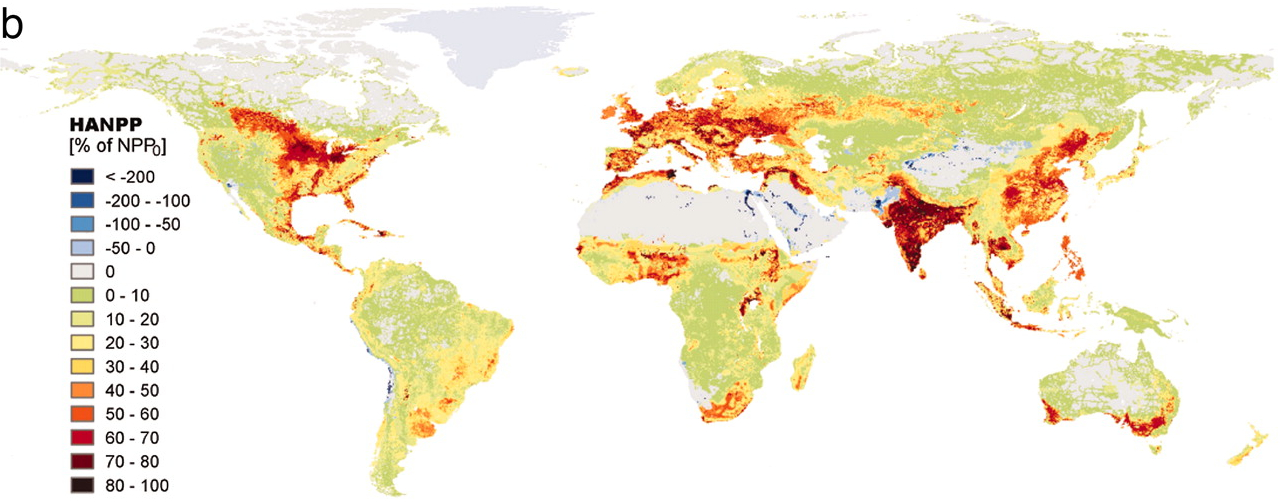
Global distribution of fraction of potential net primary productivity appropriated by humans. Source: Haberl et al: Quantifying and mapping the human appropriation of net primary production in earth’s terrestrial ecosystems
You might look at the red - 60%-80% appropriation of NPP in many of the world's key crop growing areas, and think there wasn't enough head room for another 50%+ increase in yield in those areas. However, it's important to understand exactly how the accounting in these calculations is done. Let's consider a piece of the US midwest that used to be tall-grass prairie and is now under corn. What Haberl et al would do is first use a vegetation model (specifically, this one) to establish that it would be a prairie there absent human intervention, and figure out how much carbon the prairie would have fixed as NPP. That quantity they call NPP0 (for that particular area - they compute NPP0 for every cell in a global grid). So this is an estimate of the theoretical carbon fixation in the absence of any human influence. In particular, this is with the rainfall that falls naturally - carbon fixation in actual use could potentially exceed this if the crop was irrigated.
Then they would run the model again, but constrained to have cornfields rather than prairies. The carbon fixed by the model in that scenario would be NPPact. Thus a model estimate of the actual carbon fixation in the actual human use of the area.
Next, they would figure out NPPh which would be basically the carbon in the harvested corn based on national agricultural statistics (and in agricultural residues if those were harvested and statistically tracked also, but not likely in the case of corn). So NPPh is the part that we humans really use (either by eating or feeding to our animals).
Given the actual NPPact, and the NPPh they would then compute the difference, NPPt - basically the carbon in the corn stover which gets returned to the ground, eaten by mice, or whatever happens to it.
So then the human appropriation of net primary productivity (HANPP) is defined as 1 - NPPt/NPP0. That is to say, if you look at the carbon that the prairie would have fixed, and then the carbon in the corn-stover, the difference is what is considered to be human appropriated. And that's the thing in the map that's 60-100% in the midwest (and other heavily utilized major cropland areas). However, this is not the same as the theoretical yield. In particular, a lot of the appropriated carbon comes about due to the difference between NPP0 and NPPact - the corn field doesn't fix as much carbon as the prairie, probably mainly because it starts the season out as bare soil and has to grow an annual crop from seed, instead of being a set of perennial grasses that can sprout from last year's roots and cover the available area in chlorophyll much faster.
Let's look at their Table 2 to make this clearer. This table shows the global breakdown of HANPP by food class. If we look at the "Cropping" category, we can see the different figures.

Summary of human appropriation of net primary productivity. NPP0 is modeled carbon fixation in wild condition. NPPact is carbon fixation in actual human usage. NPPh is carbon harvested or unfixed by harvest. NPPt is residual carbon flowing into ecosystem. Source: Haberl et al: Quantifying and mapping the human appropriation of net primary production in earth’s terrestrial ecosystems
As you can see, the average m2 of cropfield (worldwide) would fix 0.6kg of carbon if it wasn't actually a field, but instead was covered in whatever the climactic climax vegatation is in that location. As a square meter of a field instead, it fixed 0.4kg of carbon, and of that humans got, on average 0.3kg as food and straw etc, leaving 0.1kg to go to the ground. So the HANPP is considered to be 5/6 (1 - 0.1/0.6). (The authors insist on three significant figures (83.5%), but I'm skeptical that the calculations are really that accurate). However, hopefully it should be clear by now that that doesn't mean there's a theoretical limit of only increasing yield by a further 1/5. Instead, there are multiple targets for the agronomists and geneticists to go after. The gap between the 0.4kg of NPPact and the 0.6kg NPP0 could be addressed with plants that had a longer growing season, covered the ground earlier, etc. To the extent some cropland is water-limited, irrigation could potentially increase the total NPP feasible. To the extent the 0.3kg of NPPh is showing up as straw rather than food, then potentially that could be increased further.
A few decades down the road, one imagines heat-loving genetic mutant corn plants that pop up in the spring from perennial roots, promptly cover the ground with leaves that flatten themselves to the soil, and then start spitting out corn kernels, which can be harvested several times a year. It might not look much like a corn plant, but made into Doritos, people would probably still eat it (well, Americans would, anyway).
In short, another factor two of global cropland yields seems not to be ruled out on theoretical grounds. However, much more than that would appear to require the geneticists to come up with better photosynthesis (black plants basically - on which there has been no progress, as far as I understand).
Finally, it's worth mentioning that the FAO thinks there is considerable potential to use more land for agriculture:
There is still potential agricultural land that is as yet unused. At present some 1.5 billion ha of land is used for arable and permanent crops, around 11 percent of the world's surface area. A new assessment by FAO and the International Institute for Applied Systems Analysis (IIASA) of soils, terrains and climates compared with the needs of and for major crops suggests that a further 2.8 billion ha are to some degree suitable for rainfed production. This is almost twice as much as is currently farmed.Here's the breakdown for where the alleged potential cropland is:
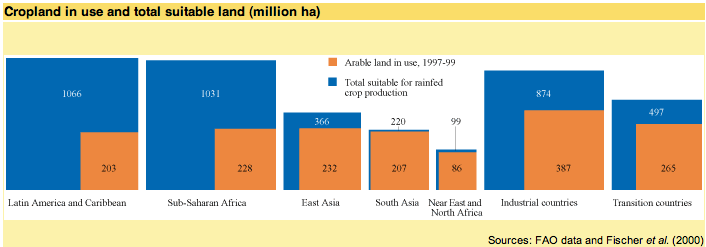
Regional breakdown of land considered available for cropping, compared to land in present use for that purpose. Source: FAO report World agriculture: towards 2015/2030
However, "much of the land reserve may have characteristics that make agriculture difficult, such as low soil fertility, high soil toxicity, high incidence of human and animal diseases, poor infrastructure, and hilly or otherwise difficult terrain." Caveat emptor!
If you look carefully at this figure - with the available land mainly in South America and Sub-saharan Africa, and the HANPP map above, you'll realize that much of what the FAO is talking about is cutting down the remaining tropical rainforests and using them for agriculture. I don't think that's a very good idea for a host of different reasons - better that we eat mutant corn, I think. The great bulk of the best land is almost certainly in production already.
Soil Loss
It appears to me that until recently, there has been a good deal of scientific confusion on the seriousness of soil erosion, estimates of the rate of erosion vary by more than an order of magnitude, and the overall data situation make global oil reserves look like a model of precision. As such, I don't think it's possible to make a clear evaluation of how near term the threat is globally. My best impression is that it's regionally quite severe, especially on fragile and marginal lands (dry, steep, or thin-soiled), but is probably not a near-term (next few decades) threat on the core agricultural regions from which most food comes (which tend to be flatter places with deep soils that don't erode quickly). It is certainly a major concern on the century timescale. However, there are many cultural practices that can help while still allowing good yields and, if I'm reading the literature correctly, erosion appears to be controllable, even within the context of fairly industrial styles of agriculture. Let me quickly sketch some of the debate.The last global evaluation appears to have been GLASOD done by Oldeman et al and published in 1990. They produced a map which looks like this:
Global map of soil degradation. Source: GLASOD map, as shown in FAO report World agriculture: towards 2015/2030
This looks really bad - everywhere humans are, the soil is degraded, and much of the world's core crop land is in the "severely degraded" category. However, that did not yet have much noticeable effect on global yields, which have continued to increase by leaps and bounds since then. Moreover, this map was produced by what amounts to a survey of soil scientists, who used their subjective judgement. The instructions for filling out the questionaire describe how to set up the map cells, and then say:
The next step involves evaluation of the degree, relative extent, recent past rate and causative factors for each type of human-induced soil degradation, as it may occur in the delineated physiographic unit. This evaluation process should be carried out in close cooperation with national and/or international experts with local knowledge of the region. The evaluation process results in a list of of human-induced soil degradation types per physiographic unit, ranking them in order of importance.So this doesn't sound like a precise, quantitative sort of estimate. And more quantitative estimates are dogged with problems. A central issue is that most soil eroded from place A (let's say a steep field on the side of a valley) isn't necessarily lost to cultivation. Instead, it may end up in place B (let's say the flood plain of the river in the bottom of the valley) where it may still be of use in cultivation.
The US is the best measured place, in that we at least have a national agency charged with regular quantitative assessments of soil erosion (a legacy of the dustbowl years). The last assessment was the 2003 National Resources Inventory.

NRCS maps of US soil erosion in 2003. Source: US National Resources Conservation Service 2003 National Resources Inventory
These estimates are made by applying models (the Universal Soil Loss Equation and the Wind Erosion Equation) to topographical and climate data. The model inputs are things like the rainfall data, the slope of the field, the erodibility of the particular soil, etc. The overall amounts of erosion are decreasing, and the amount is not imminently scary. The current national average of 4.7 tons/acre/year corresponds to a little more than 1 kg/m2/yr, which in turn is about 1mm/year, or an inch in twenty five years. That's not good, but doesn't sound like a likely disaster before 2050, particularly given that the rate of erosion is dropping quite rapidly.
However, these estimates in one way overstate the problem because the USLE and WEE are designed to assess how much soil is removed from its original location, but not where that soil goes. Most of it is unlikely to make it all the way out to the ocean, but instead end up somewhere else where it may be put to use. An extraordinary paper by Trimble in 1999 assessed the details of where soil went in a single valley in Wisconsin by doing detailed samples and cross sections of the alluvial plains. His estimates of the trends and disposition of soil is as follows:

Disposition of soil erosion in Coon Creek watershed, Wisconsin. Source: S. Trimble Decreased Rates of Alluvial Sediment Storage in the Coon Creek Basin, Wisconsin, 1975-93
Clearly, the soil erosion is decreasing, but also, most of it hasn't gone that far, and, therefore, could potentially be put back at some point in the future if that becomes economically desirable.
Still, in the long term, it seems that eroding an inch every few decades from upland areas is certainly not sustainable, though it's not an imminent crisis either. In an important meta-analysis last year, D. Montgomery compiled erosion rates for a wide variety of situations and plotted the following cumulative density function for the probability of different erosion rates:

Cumulative distribution function of soil erosion and formation rates from numerous studies around the world. Hollow circles represent rates of soil formation, solid line is geological erosion rates, triangles are soil erosion rates under native vegetation, while diamonds are soil erosion rates under various conservation tillage methods (terracing or no-till agriculture). Solid circles represent plough-based agriculture. Source: D. Montgomery, Soil erosion and agricultural sustainability
The key things to note are these:
- Rates of soil production and erosion under native vegetation are roughly similar, suggesting soil depths are naturally in equilibrium.
- Rates of "agricultural" erosion are a couple of orders of magnitude higher, suggesting that ploughing is not a long-term proposition.
- Rates of "Conservation" erosion are roughly comparable to to natural erosion rates under native vegetation. This covers more sustainable management regimes such as terracing and no-till agriculture.
Fertilizer
The three major fertilizer nutrients applied in industrial agriculture are Nitrogen (N), Phosphorus (P), and Potassium (K). None appear to be a critical constraint on agriculture to the 2050 timeframe, though there are significant issues with nitrogen in the short term.Nitrogen fertilizer is manufactured via the Haber-Bosch process in which nitrogen gas (which forms almost 80% of the atmosphere) is heated with hydrogen over an iron catalyst at high temperatures and pressures to form ammonia (NH3) which is subsequently reacted with other compounds to form urea, ammonium sulphate, and other compounds used as fertilizer. Presently, almost all the hydrogen input to this process is produced by steam reformation of natural gas, and this is the cause of the short term problem since natural gas supplies are problematic, and likely to worsen with both Europe and North America probably at or past peak natural gas. Fertilizer manufacture is exiting these regions and moving to the Middle East, Trinidad, and other places with more natural gas.
However, in the long term, there's no reason nitrogen fertilizer has to be made from natural gas. In my scenario in which energy production is dominated by renewable/nuclear electricity by 2050, the natural source of hydrogen for Haber-Bosch is by electrolyzing water. Producing nitrogen fertilizer is unproblematic as long as society has ample energy.
The reserves and reserve-base for phosphorus are enormous. According to the USGS, 2006 global production of phosphate rock was 145 million tons, while reserves were 18 billion tons, and the reserve base was 50 billion tons. For the 2050 timeframe, I consider reserve base to be the more appropriate number for the same reasons discussed under lithium. The reserve base for phosphate rock is 350 times larger than 2006 production, so there is no evidence of a problem at present.
Some bloggers are concerned that the Hubbert linearization suggests peak phosphorus has already past. However, Hubbert linearization is not very reliable if there is no independent evidence to suggest peak is at hand, due to the problem of dual peak structures giving rise to misleading linear regions (eg see the UK oil linearization). In this case, with enormous reserves, and stable phosphorus prices (they haven't varied outside the range of $27-$28/ton from 2002-2006), it seems very unlikely that phosphorus is in trouble. JD has made a similar point (snark warning).
Potassium comes from the mining of potash. The USGS estimates the global reserve base to be 550 times larger than current usage. So potassium is unlikely to limit civilization any time soon.
Fuel use in Farming and Food Transport
I don't have global statistics, but at least in the US, agriculture is a minor user of oil. In total, it only used 2.2% of oil in 2000. This contrasts with cars and light trucks, which used 40%, heavy trucks which used 12.7%, air travel at 6.7% etc. Since agriculture is such a critical industry, we can ensure it is preferred for oil usage.Furthermore, all shipping trade only uses 2.5% of US oil use. Most of that is shipping things other than food, but the bulk of food transportation is in there too. Amongst critics of globalism, the image of strawberries being flown from Chile is a popular thing to pick on. However, things like strawberries form a miniscule fraction of our diet. A more representative image of global food trade would be a grain ship like this one:

Grain ship docked in Australia.
Shipping is extremely energy efficient - two orders of magnitude better per ton-mile than air freight. Thus, long-haul shipping of food will be cost effective long after oil has peaked. Ships can also be run on nuclear power, as the US navy has been demonstrating for decades.
In Conclusion
There seems to be reason for cautious optimism that if other global problems can be solved, food production will not be a critical constraint on civilization to 2050. If industrial agricultural yields maintain their historical trajectory, there will be enough food without needing much more land. In case yields fail to continue increasing, more land is potentially available globally, though likely of poor quality. Soil erosion is an important problem, but not a critical emergency, and can seemingly be solved permanently with no-till farming methods. Fertilizer does not appear to be seriously constrained in the long-term, though nitrogen fertilizer needs to be transitioned away from reliance on natural gas. Agriculture only needs a tiny fraction of global liquid fuel use to operate, and this can be maintained for a long time, since food production is a critical infrastructure.However, if we were to keep growing the conversion of food into biofuels, all bets would be off.
Other sources
In addition to the sources linked directly above, I consulted the following references- Smil, V. The Earth's Biosphere: Evolution, Dynamics, and Change (book).
- Wild, A. Soils, Land and Food: Managing the Land during the Twenty-First Century (book)
- Brown, L. Plan B 2.0: Rescuing a Planet Under Stress and a Civilization in Trouble (book)
- McKibben, B. Deep Economy: The Wealth of Communities and the Durable Future (book)
- T. Dyson: World food trends and prospects to 2025
- Millenium Ecosystem Assessment, Ecosystems And Human Well-Being: Desertification Synthesis
- P. Waggoner and J. Ausubel: How Much Will Feeding More and Wealthier People Encroach on Forests?
- Great Transition: The Promise and Lure of The Times Ahead.
- IPCC Special Report on Emissions Scenarios, Chapter 4 (An Overview of Scenarios).
- Climate Change 2007: Impacts, Adaptation and Vulnerability, Chapter 5 (Food, fibre and forest products)
- J. Pretty et al. Resource-Conserving Agriculture Increases Yields in Developing Countries
- J. Pretty and R. Hine Reducing Food Poverty with Sustainable Agriculture: A Summary of New Evidence
- D. Pimentel et al Environmental and Economic Costs of Soil Erosion and Conservation Benefits
Contact
- Content: editors at theoildrum dot com
- Tech support: support at theoildrum dot com
License

This work is licensed under a Creative Commons Attribution-Share Alike 3.0 United States License.
Thank you Stuart. Enlightening and encouraging - though I'm very interested to know what you make of the water situation.
Water is indeed key. Transpiration of water from the soil and out through the leaves delivers the nutrients necessary for plant growth and seed formation. Given that many aquifers worldwide are being depleted for agriculture and that climate models suggest altered rainfall patterns (including more variability) in the future due to climate change, projecting continued crop yield increases decades out without considering where the water will come from is problematic. You need more water for higher yields, not less.
Global Food Security: Challenges and Policies
Science 302, 1917 (2003);
Mark W. Rosegrant, et al.
I read your reference. The sentence you quoted is isolated, and is not supported by any data or references. I'm not aware of data which supports the idea that yield growth has slowed in "much" of the world, unless you consider the steady continuation of a linear growth pattern to be a decline in growth rate, in which case both demand and supply growth have been declining at roughly comparable rates.
First, here's something for everybody:
http://www.ifpri.org/2020/focus/focus09/focus09_02.asp
Next, here are two from an entire issue of Nature which speaks to the broader question of increasing yields:
doi:10.1038/nature01015
Enhancing the crops to feed the poor
Jikun Huang*, Carl Pray† & Scott Rozelle‡
NATURE | VOL 418 | 8 AUGUST 2002
http://www.nature.com/nature/journal/v418/n6898/abs/nature01015.html
Specifically addressing the water problem:
Agricultural sustainability and intensive production practices
David Tilman*, Kenneth G. Cassman‡, Pamela A. Matson§ ||, Rosamond Naylor|| & Stephen Polasky†
NATURE | VOL 418 | 8 AUGUST 2002
http://www.nature.com/nature/journal/v418/n6898/abs/nature01014.html
I don't have convenient access to Nature papers, but the abstract of the paper you cited says:
which sounds about right. To repeat myself, my contention is that the only sense in which yields are slowing down, is that the growth has been pretty much a straight line for fifty years. Since food demand is also growing pretty much linearly, this is what has allowed the two to stay in fairly good equilibrium. I see no sign of departure from that straight-line. If you want to dispute that, you need some data. Quoting sentences out of context is not really advancing the discussion.
I will reserve my comments on water issues for a future occasion, as I indicated.
Figure 1 of the first Nature paper shows the following:
Cereal Yields (growth rate %)
Sown Area (growth rate %)
Figure 1 Annual growth rate of cereal yields and sown area in developing and
developed countries, 1977–2001. Data from Food and Agriculture Organization of
the United Nations.
I'm not arguing that yield increases will stop, but you seem to be saying that "if everything keeps getting better like it has it the past", then we should be fine. I definitely question the premise that climate change and peak oil will not seriously challenge your straight line hypothesis.
I believe the point at issue is that I am asserting that it has been a straight line for the last forty years, and that has not changed at present. I believe you have yet to present any evidence to the contrary.
I was just defending my original comment and quoted sentence, and it seems to me that the data I put in the table does that. But in the event that I am misguided and that past yield trends do portend a similar future, I guess I can start believing in graphs such as this:
I posted these numbers below earlier today, but this thread is touching on this subject;
From the FAO database, selecting global agricultural output, and dropping off minor countries that didn't report until later in the 1990s;
http://faostat.fao.org/site/601/DesktopDefault.aspx?PageID=601
1992 4022.14
1993 4200.31
1994 3998.06
1995 4027.96
1996 4072.65
1997 4109.69
1998 4056.5
1999 4025.72
2000 3980.68
2001 3993.63
2002 3981.28
2003 3857.04
2004 4139.75
2005 4057.07
2006 3957.06
We see that agricultural production is not growing, but actually slightly declining 2000-2006 when compared to 1993-1999. Yield/capita is in a much steeper decline. So any assumption of continuing yield growth, especially per capita, is not supported by the data.
Again you give no units. What do the numbers mean?
In 2003 the DG of the FAO said,
The units are Production Index Numbers, where the net production quantity of each commodity produced in the current year is weighted by the 1989-91 average per unit international commodity prices and summed for each year. To obtain the index, the aggregate for a given year is divided by the average for the base period 1989-91 where q0 is the net production quantity in the base period. Mathematical fonts don't seem to work here, so if you want a fuller description, see page 6 of http://ageconsearch.umn.edu/bitstream/123456789/3310/1/wp030002.pdf
Your 2003 quote is out-of-date and has no supporting data for current trends, which is the subject of this thread.
Ah, so when commodity prices go up, the index goes down. So for a decline in the index, we could be talking not about a decline in food production, but a rise in price.
Which everyone knows already - we're producing more food than ever, but it's getting more expensive, price pushed up by demand for livestock and biofuel feeds.
The 2003 quote, rather than being "out of date" is very relevant; 2003 is the year of the lowest index in your given series. So even when food was most scarce and/or most expensive, still the DG of the FAO was saying there was plenty.
Just take a look at the FAO's world food situation page. A glance down the reports and articles tells us that the issues are a shortage of fertiliser, and rising prices. Not a lack of food being produced. There's also a fear that some regions could lose production due to climate change. Could - not will.
A closer look at one of the articles gives us a few key quotes.
And so on. Nowhere do they mention "lower production" on a global scale. This or that country produces more or less, but the total production of grains, oils, sugar and so on continues to rise.
Nobody is going hungry because there's not enough food. They're going hungry because their area has trouble growing it (eg in the Sahel in West Africa) and because they're too poor to buy it.
> Ah, so when commodity prices go up, the index goes down.
No, let me try it again. Take a look at the reference to the Production Index Numbers I provided above, it's based on Laspeyres formula, which cannot be shown here due to mathematical font limitations.
Easier to understand information sources about how consumption is outstripping supply (even before the biofuels rush) include;
"In the agricultural year that ends with harvest season in 2008, the world will again consume more grain than it harvests. That will be the third year in a row and the seventh year out of the past eight when consumption has outstripped production." http://articles.moneycentral.msn.com/Investing/JubaksJournal/ProfitFromR...
> Which everyone knows already - we're producing more food than ever
which appears to be in conflict with
>weather-related production shortfalls [eg drought in Australia leading to lower production...]
I don't see any data that supports the former statement, though I have personally seen information on the latter.
So if more meat is being produced, are you counting the grains that are fed to the livestock as food available for human consumption?
> Nobody is going hungry because there's not enough food.
I don't see any data provided by you to support this assertion. Do you mean that drawing down grainstocks to make up for insufficient production is a sustainable trend?
More grain is produced each year than the last, on average. Grain is "food".
Now, we choose to give some of that grain to livestock, and some to biofuels. That given to biofuels no longer counts as "food." But the meat and milk does. The meat and milk have been rising from year to year.
If you take the total grain consumed directly by humans, add in all the meat and milk products, and the beans and oils, and the fruit and vegetables, then divide that by the population of the day, what you get more and more nutrition available year by year.
However, the food is not divided equally. There are 1,000 million overweight people in the West, and 800 million hungry people in the Third World. These numbers are probably not a coincidence.
The facts of ever-increasing grain, meat, milk product, beans and oils, and fruit and vegetable production are public information at the FAO site. However, they're separated into several different reports, especially "World Food Outlook". Go look.
That there's lower production of grain in this or that country does not mean there's lower production in the whole world. Don't be deliberately obtuse.
The issue of world grain stocks being lowered was already addressed in the paper I linked to. Look again, the word "stocks" is even bolded for you. It's too expensive to store them, and they don't really need to store as much, so they don't bother, they just sell them off. I don't see why I should go through that whole fucking site pulling out all the numbers when you don't even fully read a post here.
> If you take the total grain consumed directly by humans, add in all the meat and milk products, and the beans and oils, and the fruit and vegetables, then divide that by the population of the day, what you get more and more nutrition available year by year.
This is an assertion without data; how do you calculate the "total grain consumed directly by humans"? What total ag production figures are you referencing (be specific, please)? What population numbers are you using since 1990? With those answers, what trends do you see in this (21st) century?
The data's there at the FAO world food outlook. Go look it up. If you want a research assistant, I take paypal.
I've looked and seen nothing that substantiates your assertion. If you support your assertion, we can consider the data you present.
I will reserve my comments on water issues for a future occasion, as I indicated.
As someone who has tried to make a profit (or recover costs) with irrigated farming I have some thoughts. In the arid west, you do not purchase land for farming, you purchase water rights that happen to have some land attached. All food production is dependent on water, the soil is merely a structure to support the roots and plant structure and allow absorption of water and nutrients. No water = no food.
The production of food in the future should utilize a Hubbert analysis to determine the impact of peak irrigation water on food production. Much of the increased production is due to the mining of fossil water that is in decline. There is also the impact of the Export Land Model where irrigation water is diverted to other uses, power production, city consumption, recreation. The availability of water is probably a production limit reached before fertilizer or oil.
The earliest impact on food production may still be climate change. You have addressed the potential impact of global warming. There are also arguments that support global cooling. Global cooling may have larger impacts on food production than global warming, see the mini ice age approximately 1400 AD.
Here is a very good article (freely available) addressing the additional impact of climate change:
Implications of Atmospheric and Climatic Change for Crop Yield and Water Use Efficiency
Crop Science 42:131-140 (2002)
http://crop.scijournals.org/cgi/content/abstract/42/1/131
(click the PDF link at right)
Impact of climate change on food production:
The Day China Runs Dry
http://www.eeo.com.cn/ens/Observer/2008/02/29/92990.html
You have the same problem in the US southwest with snow pack. I'm trying to get my family to move out of that area. These are things I think Stuart should have included with this first version. No water, no food. Anything after than is just a mental exercise.
Cheers
I do not find Staniford's essays enlightening. He is the Oil Drum's own Dr Pangloss. His work is interesting only insofar as it is useful to keep up on the spin used by incorrigible Micawbers as the planet's crises deepen.
Stuart draws together multiple disciplines and threads into a single coherent view. It may not be your view - but at least it sparks thought. This is a valuable contribution, and one that I appreciate, as it certainly helps me with my own attempts to construct a single coherent picture.
Yeah, I mean it's not like anyone should appreciate an intelligent person using actual data and reasoned argument to contradict our quasi-religious faith-based doomer beliefs, is it? Jeez.
Exactly. Abandon all hope ye who enter here...
Yep, by 2050 the oil needed to plant, harvest, and transport will be in such short supply, that the power grid will have failed long ago and much of the U.S. will have frozen and starved to death. Solar power and electric gadgets will not do the trick. I am always amazed at the power of denial and self delusion, even among those who have some formal education.
cj- say we don't need oil to grow crops? suppose we use electric tractors or steam tractors?
what if we use hydroponics.
please tell us why the grid will fail?
Right, I can see that big combine that has a 400 hp engine being powered by batteries, for a kilometer or 2, and we can use cow pies to power the steam tractors. The power grid will fail when coal is not mined and transported, and as natural gas and oil are depleted. Sorry, John, but your solar toys will not be manufactured when oil goes so high that all oil will be used for survival. And the capital for implementation of the solar dream is just not there. So dream on, but it won't happen. Illusion is what we want to happen, reality is what actually happens, as Colin Campbell wrote -- about those who could not face the reality of Peak Oil.
What do you mean that the capital is not there? Are viable projects going unfunded now? It doesn't seem like it. The world appears to be awash in capital. The current economic problems could impact some of that temporarily. But, it does seem safe to say that availability of capital is not now, and does not seem likley to be, a barrier to overhauling our energy infrastructure.
With people like the folks behind shadowgovernmentstats saying an inflationary depression within two years, I think the question of capital is legit.
Cheers
Doomers saying there will be doom proves there will be doom?
That's pretty weak.
Doomers? Please don't just toss about silly comments. We aren't talkin about Peak Oil activists. Perhaps if you watched some videos and visited their website?
http://www.eurotrib.com/comments/2008/1/1/202944/4797/11
As to Depression, here's another possible bit of the picture from shadowgovernmentstatistics:
"In publishing its six-month and triennial survey of global outstanding derivatives, the Bank for International Settlements (BIS) showed the June 2007 balance at $516.4 trillion, up by 39.8% from June 2006. With the total notional amount of derivatives outstanding in the global markets now at $0.5 quadrillion, the risks of systemic liquidity implosion are well beyond anything ever seen before. Of course, these estimates are from before the onset of the financial-system solvency crisis."
http://www.youtube.com/watch?v=hwH7NHU_KkM An interview with Glenn Beck.
http://www.youtube.com/watch?v=dR7h8NBQU3E&feature=related CNN interview.
http://www.shadowstats.com/
Yeah. Real nutbags over there at shadowstats. Do yourself a favor: if you've nothing to say, don't post.
Cheers
First face reality, it was your comment that was lacking in fact or analysis. I said that there does not appear to be any lack of capital for NPV positive energy projects. You seem to have gotten quite upset and have called me silly, but haven't even tried to refute my point. I suggest a few deep breathes.
Shadow statistics may or not be doomers. They may or may not have a point. However just claiming that they say things are going to be bad (which I am sure they always say)is not a coherent counterpoint to my statement that there is ample capital for profitable projects.
I know that at any given time there are a huge amounts of people predicting that some form of bad thing is looming (see, I avoided using the word doom). I also know how easy it is to google up a whole pile of them. There are also an enorous number of people saying everything will be fine. For example, the Anderson Forecast at UCLA just said that they do not even expect a recession. I happen to be a bit more pessimistic. I do think there will be a pretty tough US recession, but we will see some recovery in 2009 and be back to normal by 2010. That puts me pretty much in line with consensus. I haven't heard anyone forecasting that global growth will slow down yoy or fall below 5% or so.
I know that you inflation guys and goldbugs treat this stuff like a religion. I didn't mean to insult you or set you off on your little fervor.
However, we are just months past a renewable energy boom market with capital pouring in from a wide range of sources. Massive funds from Asia and the Middle East are currently scouring the globe for investment opportunities. As I noted below, the investment that Robert Rapier estimates is required adds up to about 2% of US GDP for the next 20 years.
I find that when people get hysterical and then link to everything they can find to try to answer a simple question, it means they have a high level of conviction and a low level of knowledge. If you actually have an argument for why there will not be capital for future energy projects, see if you can walk me through it all by yourself.
There is a spiral cost problem where projects that looked cost effective keep rising in price as cost of energy drives up the cost of all materials. Although there may be a lot of money for many kinds of projects, most will not go, if people think that they will not be profitable after all.
.
Besides a few other factors, a major part of the problems on these examples below were costs.
.
.
DocScience
http://www.angelfire.com/in/Gilbert1/tt.html
I don't disagree with any of this. It is clear that almost all large projects have overun budgets and failed to meet planning timelines.
It does seem that in certain sectors, these factors can permanently slow or stop development. The refining sector was always the best example, although huge new capacity in India and China have changed that somewhat. LNG also has its own issues.
It may well be that there are no solutions, or that the ones that exist can not be done profitably. I am not claiming that everything looks rosy.
However, if there is a pathway to a future energy system that could be developed at a profit, I have seen no evidence that availability of capital would be a barrier.
I am bothered by this circular doom assumption that takes as a starting point that the world is ending, then uses that to prove that no solutions are possible.
"I have seen no evidence that availability of capital would be a barrier."
Upthread you dismissed the possibility of a depression and predicted a small US recession.
If such a depression/deep recession did come to fruition, how would that effect capital availability?
If there were to be a depression in the US, which to my knowledge no major economic forecaster is calling for, things would obviously change. Firstly energy use would plummet making a large-scale transition to another system far less urgent and probably less profitable. In this regard, I would expect it to delay both the need and the ability to finance energy projects.
I do expect the next year is going to be very painful for the US. I think financial institutions could fail, people will lose their homes and jobs, etc. I would not be surprised to see three quarters of GDP shrinkage and/or a full year of negative growth. This is a pretty serious recession (meaning not a "small recession") and worse than most forecasters with a significant track record are expecting. However, I would not be surprised if it were milder.
However, I do view this as cyclical and consistent with the historical record of credit getting too loose, then blowing up. But this is the nature of market economies. I feel sorry for the individuals involved, but don't think the US should have immunity from economic downturns. I was in Thailand during the 1997 crisis and know how bad it can be. I also know that it is temporary and unless policies prevent it, economies will recover.
It is possible that the problem spreads to Europe or even Asia. Anything can happen and it is very hard to assign probabilities to specific good or bad scenarios. Note credit markets in most of Asia do not seem to have been infected by the sub-prime crisis at all. At this point the global economy looks pretty sound and seems likely to grow at or near trend rates.
Unless there is a paradigm shifting crisis in the US, the economy will come back and energy projects will again become necessary. At the end of the day, capital is essentially infinite. As long as there are profitable projects (on a risk adjusted basis), there will be capital to fund them.
Interesting the difference in response to the same point made by different people.
One name: John Williams.
http://www.youtube.com/watch?v=dR7h8NBQU3E
Cheers
Maybe I just misunderstood your reply. But as far as I can tell you didn't reply to my question.
Would a depression dry up the capital needed for major energy infrastructure investment?
Of course it would, for the US.
In the 1930s, capital was available for the New Deal in the US, and in the 1940s for the Marshall Plan, simply because though lots of companies collapsed, still there was little public or private debt, and the US imported more than it exported, money was coming in. So in all there remained a fair bit of spare cash about.
But now the US has a $13.5 trillion GDP, $9 trillion of government debt, $11 trillion of private $500 trillion (no, not a typo, that's five hundred) of credit derivatives (ie, debt), a $1 trillion government deficit and approaching $1 trillion current account deficit.
Thus, not counting the $500 trillion in dodgy stuff that'll probably end up written off, there's a total debt of 150% of GDP, increasing at least 15% annually.
There's just not spare cash around for the US.
Now, the rest of the world, that's a different matter.
That's a pretty horrible debt situation in the US, and things aren't much better in the UK.
The Anglo-Saxon economies, and perhaps their financial systems, are certainly under severe stress at the present time.
Should Iraq be followed by further adventures into Iran, then it is difficult to see a good outcome.
The wheels are likely to come off in those two economies, I would have thought.
But as a British politician, I believe Walpole remarked when accused of ruining the country: 'There is a lot of ruin in a country!'
Italy, for instance, has staggered on for years with what everyone thought were clearly unsustainable levels of debt.
The UK is a bit better off than the US because it's cushioned by being part of the EU. If things went arse-up for the UK economy and currency you could just quickly change to the Euro ;)
Italy likewise is backed by the EU, just the indirect backing means it's unlikely to ever really go to shit.
The US's best hope at the moment is that the rest of the world want the US to keep buying their crap. China's spent the last decade funding US purchases of its goods. Their prosperity depends on part on this shell game of, China buys US Treasury bonds (or whatever), US uses that money to buy Chinese goods, China invests in more production, buys more US Treasury bonds, US buys yet more Chinese goods, etc. Multiply that across the world and you get the US staggering along.
So the US will see a significant drop, but not a collapse. The rise and fall of Great Powers is all about each country of X population trying to get more than X share of the world's resources. The US today is about where the UK was in 1946-8 - struggling along with huge debts and trade problems, reluctant to acknowledge that the Empire was going, going, gone.
Let's do. You were condscending. "So stop acting the fool," as granny would say.
I did nothing to refute your point? I posted several links that state quite clearly that serious, intelligent, well-respected people think a deep recession/depression is coming that will be of long duration. If you can't see how that extrapolates out to there being limited funds for investments, I can't help you.
Then you are cherry picking your data sources. Did you read/watch any of what I posted? Apparently not. For yet another baseless comment, I am neither a gold bug nor an inflation guy. Your assumptions pile up. Nor am I upset. I am educating. You.
Your cry that I am not "walking you through it myself" is a comment based in fear. There is no need to pretend I am an economist or investment expert or market expert when I am not. Your assumption that I cannot predict/plot out future events because I haven't provided the stats myself is ridiculous.
Your comments may or may not be right. There may be investment money available, but it is not a sure thing. Also, you should know it is not just a matter of whether there is money, but whether there is will, opportunity, etc.
I've posted the expert opinions. You show why they are wrong.
And see if you can do so in a slightly more adult manner.
Cheers
This has become pointless. I said that your argument was weak. Here at TOD it is considered acceptable to counter other people's arguments, but not to insult them by calling them silly or saying they are acting like a fool. Disagreement is not condescension.
It is also customary to actually present an argument if you have one. I do not have to chase down a bunch of links and watch videos to try to figure out what you would have said if you could have made a coherent statement.
I asked you to make an argument because I don't think you have one. Sending me to follow a bunch of links confirms it. It seems fairly obvious that you want to believe something in absence of an ability to provide an argument in support of it. That is faith and I can’t reason with it.
1. I said don't make a silly comment. There is a difference between being silly and making a silly comment. Again, if you don't know the difference, I don't know how to help you.
2. Acting the fool, like the above, does not actually mean to be a fool. It is a generally genial rebuke from grandmotherly types. Of course, all rests on delivery. Since you have only text, you are making assumptions again. (Perhaps English is not your native language or you are not familiar with some older US colloqiualisms?)
3. The phrase, "That's weak" is an insult where I come from. It drips in condescension. You created the argument here, not I. I simply posted some links that showed that the economy is headed for trouble from which you should be able to extrapolate investments might be harder to come by.
4. Underlying #2 is always the Perfect Storm of paying for energy transition, the economic collapse, Climate Change and the wars of opportunity currently underway. If this needs pointing out, so be it, but I don't know why it should, being self-evident.
5. Presenting an argument. Hmmm... In your world presenting an argument means writing an essay? In my world presenting evidence in any form is suitable. Nowhere on the oil drum does it say links to sources or others making the argument is unacceptable. I repeat, if stating the obvious is a requirement for you, I will try to keep it in mind.
6. You made assumptions about what I was directing you to. By doing so, you exposed yourself to ridicule. You did not check the links or the background(s) of those I linked to. That was you error.
To recap: my point was simple. I was responding to one point in your comments, that there will be sufficient investment/capital flowing. I do not accept this without caveat. With economies spiraling into severe recession or depression, all bets are off. It is a simple, straightforward, and logical argument. You may disagree with it, but you cannot refute it. Finally, it was you who was condescending. It is not logical to be rude, but demand politically correct responses in return. It is, however, arrogant. So, take a look in the mirror, then move on.
Those who agree with my doubt about the future strength and/or viability of the current system: Prechter, Schiff, Roubini...
You want more links to support the idea there just may not be enough to fund all the crap coming our way?
Cheers
Jack, I agree with your reference that we should keep arguments civil no mater how much we disagree.
This seams like the only place to ask this to anyone still reading.
When enough foreign holders of US securities finally decide that holding them is a continuous gradual loss, and decide to get rid of as much as possible, what choices are available ??
No one will want any more of that debt securities, and so all they can do is, cash out when they come due.
How can hyper inflation be avoided by any means possible ??
This will turn US money almost worthless , while at the same time reducing US debt with massive printing, as there are no other options.
Given the scenario you depict, then hyperinflation would occur, I would have thought.
However, your argument does not take into account that a less extreme outcome is still possible, with some devaluation of the dollar, and some move to other currencies, but without the dollar being totally dropped.
For instance, most times in the past when this sort of problem has happened then most other places have also taken a blow, and on reflection the US often seems not so bad a place to put some of your money.
In present circumstances with energy getting tight and food very expensive, the massive resources relative to everyone else of the US in these factors make it perhaps difficult to totally short the US economy.
Although oil sands may not be an ideal energy source the massive reserves of this in the US are something other nations just do not have, and wind resources in the States are enormously better than in Europe, as are the solar resources.
Even in security, whilst the US is indeed over extended, it is fundamentally more secure than Europe, with an irritable bear to the East and militant Islam to the south, and in the inner cities of Europe itself.
More fundamentally, not surprisingly in a continental economy like the US, many here confound to some degree US difficulties with world problems.
China, and to a degree India, show considerable strengths, and their input is in many ways more fundamental than that of the US.
None of this should be taken as minimising the severity of present problems, and it is clear that in many respects US concerns are greater than at any time since the Second World War, but it is relatively unclear at the moment what the outcomes will be - certainly recession, but perhaps not depression.
If you are referring to Alberta oil sands , they are in Canada, not US. They are also not Oil Sands, but more appropriately Tar sands. They have to be extensively refined to turn into any type of oil. They are very limited in the amount of oil that can be produced at any one time.
If you refer to the oil shale in the US, they do not have any good economic way to make use of that at this time.
Wind and solar may be good, but they are not being built even as much as a tenth of what will be needed, in each year. The last 4 years have been a total writeoff, and there is no change to be seen on the horizon.
There comes a point where there is just too much debt, and it looks exactly like that point has now been reached.
Numerous industries have been moved overseas leaving North America somewhat like a shell of its former.
In my area, a couple years ago, the whole steel plant, mills, iron works, and industry, was bought, disassembled and moved to China.
.
DocScience
http://www.angelfire.com/in/Gilbert1/tt.html
You are correct - apologies for the typo, I should have said North American oil sand reserves, which I have certainly heard them referred to as such.
I understand that you feel that the point of too much debt has now been reached, but have attempted to present some arguments for why although difficulties may be severe all may not be lost.
Your judgement may of course differ.
There are also important reasons why investment in renewables and nuclear energy, and also mineral resources, are going to be safer than in the 70's, as soon as the penny drops that Yergin et al are talking bunkum.
At that time there was a massive overhang of potential oil production from OPEC available, and limited demand from the West for minerals in recessions. A lot of people lost their shirts betting that oil would stay high, and in the commodities recession.
In the present circumstances, apart from some uncertainty about the levels of any carbon taxes and hence how much coal and NG will be allowed to play a part, the investment outlook will be much clearer as soon as Peak Oil is accepted, with demand underpinned massively by China and India.
There are a lot of negatives about, but that should not be exaggerated into universal negativity - there are some positives too.
Renewables proponents, for instance, would argue that wind power could be built up rapidly if a decision is made to do so, and when the realisation dawns that gas is not going to become cheap again, then a large build out is to be expected.
There is something that is niggling at my brain these days: is there any reason the rest of the world wouldn't be ready for a new regime, that is, leader of the "free" world? Much of the world, and a majority of Americans, now view the US as arrogant, overstepping its bounds, dangerous and impossible to work with as partners. Add to that vulnerable, and you have a recipe for a major comeuppance.
Since the US debt is beyond the ability of the nation to service it any longer, the military is overstretched and the economy is a hollow man built on 70% consumption, why not let it implode and give it a little push along its way?
The thinking may very well be that demand in Asia will make up for a drop in demand from the US. Rogers said in Seoul recently http://www.youtube.com/watch?v=h5ztR8eAHcg he expects the US to take the brunt of this fall. He expects Korea and Japan, via their location and trade with China to do relatively well. It should be noted he is expecting a severe economic downturn.
So... is the world ready to let the US be hung on its own petard? If so, it changes the complexion of things. It could result in the utter decimation of the US economy while the rest of the world wobbles but doesn't fall down via strengthening trade while bypassing the US, dumping its dollars and calling in its debts.
However, this does seem a path to war. Then the question becomes, is the US military as overstretched as it seems and can it wage a major war and survive?
The head spins...
Cheers
It looks like the typical divide between the optimists and pessimists, the doomers and the deniers
This short video explains that the highest standard of living was in the 60's - 70's and dropped ever since.
http://www.youtube.com/watch?v=hwH7NHU_KkM
Nowdays, many people find they need to work 2 jobs to make ends meet.
.
The optimists think things will turn around again and improve, against the trends, just like the typical economists.
.
We doomers believe the opposite. Our research tells us that trends will continue getting worse as the oil runs out. Although it could have been different if we converted to alternatives earlier, it is largely too late now. The worst still can be avoided, but no one will listen.
.
In 2004, as a doomer, I saw that no one would believe me when I told them that oil prices were going to rise. I was telling them to prepare for high prices and make appropriate plans. That is when I realized that I had to write my projections (predictions) in 2004. I really believe it will be too late when people realize what is happening.
.
As I said on my predictions “It looks like we will find out soon enough.”
.
DocScience
http://www.angelfire.com/in/Gilbert1/tt.html
Of course you are entitled to draw your own conclusions, but perhaps I may remark that I have not said that a crash will not occur, just that I don't know for sure.
Your remarks also appear to me to be too heavily weighted towards the US, as even a major recession/depression there might have relatively limited effects elsewhere.
Savings rates in China for instance are certainly adequate to finance a very major build of renewables or nuclear once the need becomes crystal clear.
Even without a major recession affecting the US a lot more than others, it is already clear that the greatest force in the world economy in 10 years time will be China, not the US.
Present difficulties and military overstretch will only hasten this somewhat.
CJ- you need imagination and economics. we use very little oil to produce food relative to what it gives us- life.
you don't take into account the transition because of higher prices that will happen BEFORE the coal runs out, the NG runs out and whatever else. the transition has already begun. you dismiss steam tractors and electric tractors.
all the capital for the solar dream isn't there? first, I am not just betting on solar. secondly, the capital will be there. someone will have money. I"m thinking the countries and companies who have oil. I am think of china's fund that will be 2 trillion dollars soon. the capital is already there as we've seen in the last few weeks they are started to build solar in the southwest.
here is a hint, solar and wind producers will have power BECAUSE THEY MAKE THE POWER!
Predicting the future is hard. maybe you should be seeing lots of smaller tractors? maybe you should see tractors being followed by electric trucks who switch the batteries. you don't even know how efficient the batteries will be.
It's amazing to me how many people seem to feel that a few lines of assertion and ad-hominem, with no supporting evidence, constitute an argument. And then they act like they are ones free from "denial and self delusion".
Well, we have another essay that is quite heavy on ifs and assumings but still manages to end with a "conclusion" that we're probably OK in this particular area, until 2050, at least. I almost get the impression, from this series of posts, that you have reached a conclusion in advance of the research and wonder if that research is guided by the conclusion, in any way, along with the assumptions you make?
A few points...
You stated that population has been growing linearly lately. I take linearly to mean the same quantitative growth each year. This is not the case. Even if the percentage increase was going down slightly, the growth would still be exponential unless the percentage decrease was enough to keep the absolute amount of growth the same each year. According to the CIA world fact book, the population growth rate was going down until 2003. But then it stalled at 1.14% until 2007, when it rose to 1.167%. So we currently have exponential growth in population, not the linear (and indeed linearly slowing) growth that you assume.
You think that no-till farming methods are needed to halt the erosion of soil but offer no statistics on the likely effect on yields. The Wikipedia article you link to suggests that yields may fall significantly until experience grows. I would assume, therefore, that yields may take a dive as each farmer switches to no-till. However, no-till alone won't arrest soil erosion, though it will slow it.
As the meat proportion of our food increases to 2050, how much of the extra non-meat products will go to producing the meat? As meat rearing is an inefficient use of land for food (compared to crops), wouldn't this have some effect on the food available at the end of the food chain?
Most of the yields shown on your composite graph show recent declining or highly variable yields, with at least 3 showing very little growth for the last decade or so. I realise that a moving average might show a constantly increasing yield but I don't think your optimism on yields is warranted by the graphs.
Your assumption that nitrogen fertilizer can be manufactured in the increasing amounts needed without natural gas appears to be unsubstantiated. Not that it won't turn out to be right but you assume that sufficient energy will be available for it (presumably at affordable prices), in a free-market world.
Finally, you skip over the possibility of peak phosphorous with an "it seems unlikely", citing the "enormous reserves" (though you don't say what they are). Is this like the enormous reserves of oil that Saleri has told us about?
Heh, I heard of your post by way of RR or Gav's bogs (I forget which now), and stopped by to see the reaction. It certainly reaffirms my impressions of the cultural beliefs at TOD (and I think Peak Oil).
FWIW, I'm much happier hanging with the mainstream. They may be in fractional denial, but obviously not completely as more and more of them acknowledge peak oil (in the practical and not ideological sense).
There is an energy transition building, over there in the mainstream. If Peak Oil moves their goalposts too far, they might miss being part of it.
Happy trails.
I sympathize with the impulse. I frequently feel torn between the "let's not even call a spade a spade" mainstream, and the "peak-oil-death-wish-cult" that tends to dominate discussion of peak oil.
Quite right Stuart, it is regarded as deeply unfashionable to do anything other than despair, and any action which might conceivably help or give some scope for effective action is frowned upon.
I really can't see the utility of that way of thinking, as it seems better to bet that your actions might make a difference, but in some quarters this is held to be missing the deeply intellectual nature of the assumptions of those who want to believe themselves irrevocably doomed.
I prefer to put up a fight, personally, even if the odds might not be as good as I'd like.
Call me unfashionable.
Doing something may or may not help. Doing nothing will definitely not help. I'll take possible failure over certain failure any day.
Excellent! What I find weird is that some congratulate themselves on their penetration, in having seen through the layers of delusion and surrendered hope, which seems to me a fundamentally stupid thing to do.
Yes, and defeatism can very easily become self-fulfilling.
What fascinates me is how preparation is called defeatism. Seeing a better possible future through building community and living in balance with nature is defeatist?
And DaveMart up there saying "all you hear is..."
You boys are tossing cow patties for sport. Not very impressive, mates.
It is fun to watch, though!
Cheers
Very comprehensive, kudos to Stuart.
There are a few points I would like to discuss;
1. Current trends: Grains are at the lowest stockpile levels since records were started in 1960 (53 days of supply), due to droughts and biofuel increases. http://www.bloomberg.com/apps/news?pid=newsarchive&sid=aGcGIiIwHQ1g
Prices reflect this shortage,with resultant demand destruction;
http://www.msnbc.msn.com/id/22902512/
Fig 1 - Making mud cookies to sell in Haiti
From the FAO database;
http://faostat.fao.org/site/601/DesktopDefault.aspx?PageID=601
1992 4022.14
1993 4200.31
1994 3998.06
1995 4027.96
1996 4072.65
1997 4109.69
1998 4056.5
1999 4025.72
2000 3980.68
2001 3993.63
2002 3981.28
2003 3857.04
2004 4139.75
2005 4057.07
2006 3957.06
We see that agricultural production is not growing, but actually slightly declining 2000-2006 when compared to 1993-1999. So your assumption of continuing yield growth is not supported by the data.
2. Fertilizer prices have skyrocketed in the last year. IFDC notes that from January 2007 to January 2008 diammonium phosphate (DAP) prices rose from $252 per ton in January 2007 to $752 (U.S. Gulf price); prilled urea rose from $272 to $415 per ton (Arab Gulf price); and muriate of potash (MOP) rose from $172 to $352 (Vancouver price). What confidence should we have in the reliability of the estimates of potash and potassium reserves, given that we don't really even know how much coal and oil we have?
http://news.mongabay.com/2008/0220-fertilizers.html
Note that coal in the US was once assumed to be able to supply coal demand for 250+ years based on the available data, though a hard look at the data showed that too many assumptions gave an vastly over-optimistic perception.
http://www8.nationalacademies.org/onpinews/newsitem.aspx?RecordID=11977
3. Many crops require a deep root structure for the current high yield rates, so we shouldn't assume that soil erosion won't be a problem until soil depth reaches 0 inches. Does anyone have any data on minimum topsoils for crops like corn and wheat, for example?
http://www.ag.ndsu.edu/pubs/plantsci/rowcrops/a1130-8.htm
Fig 2 - Corn root system 8 weeks
.

Fig 3 - Wheat root system
So as a 'what if' scenario, it helps frame the scope of the problem. However, crop temperature sensitivities along with minimum water and topsoil requirements should also be model factors, and one of the groundrules (starvation won't be a problem) may already be obviated.
Your "from the FAO database" figures lack a unit, mate. We don't know if you're talking about some kind of total food production, calories per capita, tonnes of caviar or what.
See explanation subthread above.
I would like to point out a couple of seemingly not stated variables -
1. Weather/climate. For example, this year's world grain harvest will be considerably lower than projected a couple of years ago. Whether a short term result of weather (as is always the case with farming) or of longer term shifts (was Australia especially wet for the last two centuries?), simply not considering weather/climate seems as mind boggling as writing about 4 billion cars without considering that the world likely doesn't currently possess four billion bicycles. This is separate from man-made climate change, though it would be just as unavoidable.
2. Farming practices. It is interesting to see that Germany seems close to its theoretical maximum yield - German farmers tend not to use large amounts of fertilizer or pesticides, do plant in small fields with crop rotation, and harvest a wide variety of crops from their land. All of these practices, though heavily reliant on machinery (German agriculture is massively over-mechanized in terms of tractor ownership, for example - it seems like anyone with a couple of hectares has a tractor), often appear to be the antithesis of those who advocate for modern farming techniques as being the only possible method - monoculture from sea to shining sea. Monoculture being one of the overlooked aspects of the Green Revolution, in my opinion, as insecticides allowed a temporary advantage in terms of massive harvests not being ravaged by insects feasting on the results of an unbalanced environment.
3. Organic farming (confusingly named 'bio' in German)/localization. Aldi is a large discount chain, and it seems as if they have decided that organic production can offer a profit when sold to a mass market whose customers are incredibly price sensitive (Walmart can only dream to approach Aldi's efficiency and pricing - which is a major reason Walmart left the German market). As noted in point 2, Germany is not only efficient, it tends to be regional - one reason for that efficiency. Aldi does not generally buy common produce from a single supplier, it often buys from regional suppliers for a regional market (leaving aside tropical produce). Over the last year or two, the amount of 'common' organic selections seems to be rising at Aldi, often giving a feeling of 10% or more of what is offered. Which is unlikely to be true - but the steady increase is noticeable. Aldi is likely planning for the future, by locking in a supply chain which Aldi can count on over the long term.
If current German practices were adopted, neither your scenario nor the more extreme localization scenarios would occur. Instead, a longer term perspective would be required, one that defines 'maximum' in a way that includes the future.
Nicely done. Two questions regarding industrial organic agriculture (interested to get your general take on this subject as well):
First, I have a vague understanding (from reading Omnivore's Dilemma) that industrial organic agriculture substitutes a lot of mechanical tilling for pesticide. Given that the ag use of fuel is low in total-percentage terms, is it possible that industrial organic is compatible with your vision?
Second, I've heard it's possible (by quantifying rare isotopes or something) to detect whether nitrogen in plant material comes from natural fixation (by legumes etc.) vs. Haber process - and that the majority of the protein in most of our bodies can be traced to natural gas. Are you aware of any data that indicates the degree to which industrial organic is actually fixing it's own nitrogen naturally, as opposed to "cheating" by importing a bunch of manure from (conventional) feedlots?
Impressive analysis as usual!
You're surprisingly quiet about the effects of climate change on agriculture. I think that rising CO2 may boost yields at first before negative effects become obvious.
If you look at the IPCC Fourth Assessment Report (Chapter 5: Food, Fibre, and Forest Products), there is a chart page 286 showing Sensitivity of cereal yield to climate change for maize, wheat and rice, against mean local temperature change. Rice, Wheat and Maize yields are immediately affected by rising temperature for low latitudes.
Higher CO2 may boost the mean, but I wonder about the standard deviation. In financial words, will the Sharpe Ratio of food/biofuel decline?
Not a direct answer to your question Nate...but a bit more on plant physiology could help.
Plants use pores in their leaves to "breathe" and exchange CO2 and O2 through these. With more CO2 in the air, the theory goes, it is easier to get what they need and the pores don't have to be open as much, which conserves water. A tricky part of this, however, is that water is used used to cool the plant too, and so stress thresholds can build where a plant wants to conserve water but doesn't want to fry in the sun. That's one reason there's an initial boost with higher CO2 but the effect tapers off and direct heat stress on plants are overwhelming at high temperatures. High temperatures begin depressing processes like pollination too, so a plant might grow but not form any seeds.
C3 photosynthesis pathway ("cool season") plants, like wheat, barley, rye, oats respond positively to higher CO2 concentrations, but negatively to temperature increase. Wheat, especially needs cool weather when it's "stooling," a vegetative state where it increases the number of shoots from the original rootstock. This has a very direct effect on yields.
C4 pathway ("warm season") plants like corn, sorghum, millet do not respond to higher CO2 levels, but they respond positively to higher temperatures (to a limit). When temperatures get too high and water uptake is reduced, plants will "fire," curling their leaves and reducing evaporative area. Pollination is reduced, resulting in irregularly filled seedheads and cobs.
Higher temperatures will result in the winter wheat belt moving farther north, and the spring wheat belt being reduced. This is problematic for durum (semolina) production, which is a spring seeded crop. Wheat is a native plant of the cool Mediterranean climate of the Fertile Crescent. It's natural state is to seed itself in the fall, get to at least four or five leaf stage before cold weather dormancy and then restart growth early in spring. On the northern plains, where wheat cultivation was made possible only after spring seeded varieties were first developed in the 19th Century, a problem enters with the rapid temperature transition from winter to summer, leaving a narrow time window for seeding and sufficient stooling time for wheat before serious heat hits. Reduced stooling results in reduced yields.
More possible bad news. This would seem to affect soil exhaustion:
http://www.sciencedaily.com/releases/2008/03/080311123413.htm
I found this after a very quick search (got to get to bed.) It mirrors everything I've read over the last six months or so, so went with it so I can get to bed.
Food is the deal-breaker here, Stuart. Upon your whole supposition it rests, yet it is treated almost as if a debate about the effects of Climate Change on food production doesn't exist. Since I can't recall any article or paper in the last six months or longer that doesn't see falling food production after the initial boost, I find your entire scenario above untenable.
Cheers
Here's more:
http://commentisfree.guardian.co.uk/javier_solana/2008/03/before_the_flo...
Let me highlight just three of the threats posed by climate change.
http://www.telegraph.co.uk/earth/main.jhtml?xml=/earth/2008/03/10/eaclim...
Here is the chart:
If these charts are similar to other ones I have seen, the green boxes are with models that include "adaptation" to changing climate, such as new breeds of plants, improved water management. The orange boxes would be with existing breeds and techniques.
The adaptation models set up some possibilities, but they eventually become a Red Queen scenario where climate is changing really fast and the whole agricultural system is in constant adaptation mode on an immense scale.
"You're surprisingly quiet about the effects of climate change on agriculture."
Mainly lack of time - every time I do one of these everyone complains that I didn't treat every factor under the sun in a single post. I did read the IPCC chapter (I cite it at the end of my piece), but the big picture conclusion is
(Emphasis mine). So the scientific consensus right now is that climate change is not a major first order effect on food production to 2050, and in so far as it has an effect, it's globally positive. They think its regionally negative in the developing world, but not with high confidence, and I'm a bit wary of relying heavily on extrapolating a trend that is not visible at all in the data at present, when the data is dominated by the strong first order effects of innovation on yields, and a more wealthy developing world will have increasing resources with which to innovate on it's own crops and agriculture (eg see Brazil).
I think climate change is likely to be a much bigger problem in terms of a) wild ecosystems which will be far slower to adapt than human crop agriculture, b) localized impacts of storms etc (more Katrinas), and c) setting in motion unmanageable ice sheet changes that wreck civilization later in the century. All this with the caveat that there is a possibility of triggering major non-linear climate changes which could cause massive problems that are, however, impossible to quantify.
"Unmanageable Ice sheet changes..."
It would be disastrous if a large area of Greenland or Antarctic continental glacier were to suddenly slide off into the ocean. The chain of tsunamis that would ensue would dwarf anything we saw earlier this decade and, depending on scope, could be a civilization impacting event on the scale of a moderate asteroid strike.
There is a lot of evidence of this kind of catastrophe in the geological record circa the end of the last ice age.
Robert - do you have links for that? I am aware of events of ice-damned lakes breaking loose, but not of massive chunks of ice sheet sliding into the ocean and causing a disaster. Maybe I'm confused, but that violates my physical intuition.
Your intuition is right.
Ice sheets sit on land, and the land is not a featureless plain, so that it acts as an obstacle to the ice simply sliding off.
Ice shelves sit on the seabed, and are connected to ice sheets. It's ice shelves that are most vulnerable. That's because warming water can get under them, between the shelf and the seabed, and melt that, so that the thing's not anchored anymore.
Both ice sheets and ice shelves aren't monolithic masses of ice, but lots of different chunks of ice mashed together. This actually makes them more vulnerable to melting than would be a big chunk. This is because some melts, the meltwater gets into the cracks between different chunks of ice, and this meltwater encourages further melting, and so on. Also, the tremendous weight of 100-3,000m thick ice puts enormous pressure on those cracks. A fluid under great pressure acts as a lubricant, which is how landslides happen.
So ice shelves and ice sheets don't slide off, they just sort of crumble, as for example the Larsen B ice shelf in 2002.
An ice shelf can crumble in this way, but an ice sheet can't. That's because the ice shelf is in water, so all the chunks of ice can float away from each-other; but an ice sheet is on land, so it's somewhat anchored. An ice shelf doesn't have to have all the ice melt to break up, but an ice sheet does. Just imagine that you have two brick walls, one standing up and the other lying on the ground. Now the mortar in the walls disappears; the wall standing up crumbles into a pile of bricks, the one lying down doesn't move much.
The collapse of an ice shelf will certainly speed up the melting of the ice sheet behind it, and the ice sheet will gradually move towards the sea since the ground isn't completely flat, but at no point will the ice sheet simply "slide off into the sea".
"Ice shelves sit on the seabed, and are connected to ice sheets."
Actually, ice shelves mostly float over the seabed, as noted in this definition quoted on NASA's Goddard Earth Sciences Data and Information Services Center web site. In particular note the final phrase of the final sentence: "limited areas may be aground."
"An ice shelf is defined as "a sheet of very thick ice, with a level or gently undulating surface, which is attached to the land along one side but most of which is afloat and bounded on the seaward side by a steep cliff (ice front) rising 2 to 50 m or more above sea level. Ice shelves have been formed along polar coasts (e.g., those of Antarctica, the Canadian Arctic islands, and Greenland), and they are generally of great breadth, some of them extending several hundreds of kilometers seaward from the coastline. They are nourished by annual snow accumulation and by seaward extension of land glaciers; limited areas may be aground." (Bates and Jackson, 1980)
The definition is from the widely used "Glossary of Geology, 2nd Edition" by R. L. Bates and J. A. Jackson, American Geological Institute, 1980.
Your point about ice sheets being unlikely to rapidly "slide" into the sea is well taken, as indeed they do have to move over underlying geological features that offer resistance to such motion. Certainly increased meltwater making its way to the base of the ice sheet will make this process easier, and thus likely somewhat faster, but it is unlikely to be fast enough to produce a tsunami.
I believe the process of tsunamis from ice sheets occurs when meltwater pools on ice sheets forming large lakes that eventually burst through ice dams and run downslope for hundreds of kilometers (potentially) hitting the ocean with great speed.
This seems to have happened on a number of occasions in the past and formed significant geologic features such as the Columbia gorge. Few think what happened globally when the forces that formed the Columbia gorge hit the Pacific Ocean.
Would be interesting to know if Greenland and Antarctic sheets have the same potential.
It has already started:
http://www.popsci.com/popsci/science/6661e3568cc83110vgnvcm1000004eecbcc...
Hansen, for one (see climate code red for a restatement of this), sees meters of sea level rise within the century as very possible. Personally, and non-scientifically, I guarantee a meter, but expect between 3 and 5. I think we're all aware that that one meter already is enough to impact virtually every coastal city.
We're not in Kansas anymore.
Time is short.
Cheers
Hansen referenced the last geologic era when temperatures were already this high and then rose the expected amount in a short time frame (less than a few centuries). The total sea level change was over 25 meters in that case. Thus Hansen states that likely equivalent worst case scenario would have to be between 15-35 meters, even the lowest of which would be catastrophic. A 15 meter sea level rise by, say 2100, doesn't mean 5 centimeters til 2099 then the rest all of a sudden. It means a steady increase across the entire century.
Lovelock believes that London will be able to detect the first serious rises in sea level by 2020 and be badly impaired as a city by 2040.
The thing that seems to have been narrowed down is how long it takes for ice sheets to melt in some circumstances which could be similar to our own. That timescale is centruries rather than millennia. So, if we are to get 25 meters in three centuries then that is an average of about 8 meters per century. The way in which the sea level rise is distributed over that kind of time period is unclear. Sea level rise is accelerating and a constant rate of acceleration projects on the order of a meter of sea level rise by the end of the century. That would be a quadratic equation fit. That seems low if the average is to be 8 meters per century. Hansen has proposed, as an example, that there might be a doubling every decade of a portion of the current rate of rise. So, if during this decade we get 1 mm/year of the current 3.5 mm/year that is behaving this way then after 9 doubling we get about 50 cm/year during the last decade of the century. But this is just an example. Another possibility is that regions that are subject to summer time surface melting presently disinegrate quickly and then are replaced more slowly by higher altitude ice. This lowers the altitude of that replacement ice and we get a repeat so that the sea level rise experiences pulses. Then you might get several meters in a particular decade with a slower rise at other times. I think that the steady component of sea level rise owing to thermal expansion of the oceans will be distributed over the century in an evenish way, but the potentially larger component owing to land ice melting may not be all that steady and may depend on the particulars of the terrain where the ice is located. The main thing we seem to know now is that estimating the rate of sea level rise just based on the energy available to melt ice at its present altitude gives a lower limit and models that account for accelerated ice motion owing to the effects of surface melt lubricating the base of an ice sheet need to be developed to have a better handle on the actual rate. The paleo-evidence suggests that the process happens quickly rather than slowly.
Chris
I am in total agreement about the risk of sea level rise from ice sheet melt, (I wrote about it back in 2005. However, the issue Robert Marston raised (ice sheets sliding into the ocean fast enough to cause tsunamis) I'm not aware of (and I suspect Robert is getting confused with other things that have caused tsunamis - eg subsea landslides).
This
http://www.extremescience.com/BiggestWave.htm
is a landslide-caused tidal wave, but the mechanism would be the same. Logically, we may conclude there may have been massive waves created by ice, but they are likely very rare. Certainly not worth a long sub-thread.
This, however, is caused by ice, but indirectly due to rebound as ice melts:
http://environment.about.com/od/globalwarming/a/earthquakes.htm
Cheers
Two problems I foresee, net oil export capacity (discussed below), and the price of food as the increasing cost of fuel and fertilizer forces the price of food up. I've compared industrial farms to oil refineries (especially in importing countries).
As importers compete against each other for crude oil exports, refiners have to balance the cost of crude oil against the volume of product that the consumers can and will buy.
As industrial farmers compete against each other for fuel and fertilizer, they have to balance the cost of fuel and fertilizer against the volume of food that consumers can and will buy.
Economists would argue that the refined petroleum product and food goes to the high bidder, foreign or domestic. However, in the real world, it tends not to work that way, as we have seen recently regarding Iranian natural gas exports and Chinese coal exports.
The EIA has released their 2007 crude oil production estimates, which gives us a pretty decent idea of net exports by the top five net exporters. The actual 2005 and 2006 top five net export data and estimated 2007 data are as follows (EIA, Total Liquids):
2005: 23.5 mbpd
2006: 22.7
2007: 21.7
This is an average decline of 900,000 bpd per year, which would put them in the vicinity of zero net exports around 2031, which is also the middle case in our (Khebab/Brown) net export study. Of course, some smaller exporters, like Angola, are showing export increases, but smaller exporters tend to peak and decline faster, e.g., Mexico, which is on track to approach zero net exports around 2014 (the key determinant is consumption as a percentage of production at peak).
In any case, I think that we are headed to a future where the primary international trade is bilateral trade between net food exporters and net energy exporters, i.e., food for energy and energy for food. It's not a good time to be both a net food and net energy importer.
It is strange to watch history unfold as predicted. It's like watching a train wreck while standing on the tracks not quite far enough away to avoid being hit by the debris, but maybe just enough to survive.
Cheers
While in handcuffs.
That scene with Harrison Ford from the Fugitive:
Best train wreck ever.
8D
To run the train metaphor into the ground, I feel it is like we are all sitting in the dinning car actively discussing the eminent wreak ahead with all of the possible mitigations and effects, ad nauseam.
But hey, there’s still several bottles of Veuve Clicquot on ice and we got a real nice head of steam up so party on!
In any case, I think that we are headed to a future where the primary international trade is bilateral trade between net food exporters and net energy exporters, i.e., food for energy and energy for food. It's not a good time to be both a net food and net energy importer.
The other implications of this statement are that any regard for sustainable soil or water practices which are already lacking would be completely disregarded under this type of scenario. And, especially when fertilizer is being exported from the middle east--fertilizer for food, food for fertilizer....
I remember reading in "The Omnivore's Dilemma," that Michael Pollan's example of a completely industrial farmer still did not use the highest yielding corn, settling for 180 bushels per acre instead of 240, because the highest yielding strain just wasn't that cost effective after the added seed costs and added chemical inputs required. It might be interesting to revisit that farmer now, but I suspect that we could have a case of the Law of Receding Horizons here. Crop prices are high. Fertilizer and pesticide prices are also way up. So I am going to take the graphs showing potential yield increases with a grain of salt.
After the train wreck that was the mid-1980s great farm shakeout, when large numbers of farmers went out of business (remember Willie Nelson, Farm Aid, and the Tractorcades to Washington?), land prices dropped in half, and it was clear that Washington was not going to help, the remaining farmers adopted a methodology called Maximum Economic Yield (MEY). They didn't shoot for the maximum yield, which was far up on the marginal rate of return curve, where it starts going negative as inputs are increased, but looked for the amount of input that returned maximum profit (or minimum loss, in years where profit was impossible).
Farmers began to track their expenses very closely; they determined the exact value of each cultural operation; they used new technologies, such as GPS, on-board data monitoring, computer and internet to aid in controlling costs and helping with marketing. Farm machinery became more sophisticated; combines could record the exact yield in any location, which was then entered into a data base; fertilizer spreaders were tied in to GPS and soils survey maps to regulate fertilizer application rates on the fly as the spreader went across a field.
From the graph "Ratio of crude food/feed producer price index to all US consumer prices" in the main body of this posting, it's clear that the primary food price subsidy flow has been from farmer to consumer. A small back flow subsidy from government to farmers, like the back eddies going counter to the main current of a river, does not equal the huge subsidy farmers have provided to consumers worldwide during most of the modern era (since 1700) through a nearly continual drop in the real price of food (see Fernand Braudel's THE STRUCTURES OF EVERY DAY LIFE).
Farmers do not grow food to feed the world. They grow food to support their own families. They have to make real world production decisions that will primarily benefit their own families. They're not in the food aid business. That's what governments and NGOs are for. With increased prices, there is more room for maneuverability in increasing yields, but farmers would be stupid to maximize yields at their own loss. We would not expect that of any other segment of the population.
That's the point I made up the thread, and it's why I compared refineries to conventional farms. I've previously put it this way. Let's assume that higher crude oil prices (Tapis is currently $111.11), a result of importers bidding for declining oil exports plus the weak dollar, causes a geometric progression in petroleum product prices per gallon:
$2, $4, $8, $16. . .
Refiners will not maximize their refinery utilization rate if they can't sell all of their refined product at a high enough price to justify buying expensive crude oil, and at each doubling in product price the volume of product that consumers can and will buy declines.
Conventional farmers are in a similar situation. They have to be able to sell enough food to justify buying expensive fuel and fertilizer.
Also, consider that the majority of Americans live off the discretionary income of other Americans. With deflation combined with rising food & energy prices, discretionary income is going to be squeezed very hard.
From one of my Wall Street correspondents (no link):
Pilgrim's Pride to Shut Chicken Plant, Cut 1,100 Jobs
By Choy Leng Yeong
IMO, this is the similar to the problems facing conventional farmers and refiners. They have to respectively balance the cost of fuel & fertilizer and crude against the volume of the finished product that consumers can and will buy.
I don't have global statistics, but at least in the US, agriculture is a minor user of oil. In total, it only used 2.2% of oil in 2000.
Just farming - what if distribution is taken into account?
http://www.resurgence.org/resurgence/issues/jones216.htm
EATING OIL
"THE CONTEMPORARY FOOD system is inherently unsustainable. Indicators of social, environmental and economic performance, such as food security, greenhouse-gas emissions, food miles, lower farm incomes and biodiversity loss highlight this fact."
-------------
" The journalist's rule says: follow the money. This rule, however, is not really axiomatic but derivative, in that money, as even our vice president will tell you, is really a way of tracking energy. We'll follow the energy.
We learn as children that there is no free lunch, that you don't get something from nothing, that what goes up must come down, and so on. The scientific version of these verities is only slightly more complex. As James Prescott Joule discovered in the nineteenth century, there is only so much energy. You can change it from motion to heat, from heat to light, but there will never be more of it and there will never be less of it. The conservation of energy is not an option, it is a fact. This is the first law of thermodynamics.
Special as we humans are, we get no exemptions from the rules.
The common assumption these days is that we muster our weapons to secure oil, not food. There's a little joke in this. Ever since we ran out of arable land, food is oil. Every single calorie we eat is backed by at least a calorie of oil, more like ten. In 1940 the average farm in the United States produced 2.3 calories of food energy for every calorie of fossil energy it used. By 1974 (the last year in which anyone looked closely at this issue), that ratio was 1:1. And this understates the problem, because at the same time that there is more oil in our food there is less oil in our oil."
http://www.harpers.org/TheOilWeEat.html
Does not include include endless indirect costs, water pumped, fertilizer production, use, pesticides, various electricity, processing, transport away from the farm, to the factories/stores, and massive Gvmt. subsidies all over the place.
OK it all depends how you count, and in a short post, it is hard... But if Americans are interested in how much energy is invested in bringing their food to the plate (without counting treatment in the home, such as cooking) they had better look beyond Gvmt. reports, which is where those kind of minuscule nos. come from.
The US does not like to admit how much tax payer money and hidden costs support agri. It is supposed to come magically out of the ground and be ‘safe,’ endlessly productive at low cost, because the US is so ‘efficient’, a star in that area, a food super power, etc. (Imho.)
Think of all those studies or speculations that show, or purport to show, that on average over all foods, between 10 and 3 calories of energy are used to produce one calorie of food, in the US. So that doesn’t compute....
One article from the die off site, just an example:
http://dieoff.org/page69.htm
Agriculture is most often not listed as a separate category, as it is in usually is other countries, see eg.
http://www.eia.doe.gov/emeu/aer/pdf/pages/sec1_3.pdf
The overall picture is hard to grasp, but does indeed show that **US GVMT** energy consumption for agriculture as compared to other ‘mega’ categories such as Defense / transport / NASA/ Veterans affairs, is minuscule.
For ex. in the linked chart, 75-06, only 6.8 trillion btu for agriculture, as compared to 843.7 for Defense. Indeed, that brings it down to tiny %, under 2 anyway, again depending how one counts.
http://www.eia.doe.gov/emeu/aer/pdf/pages/sec1_25.pdf
Impressive. This will take a while to digest, and I hope it stays on top for a few days.
Perhaps the key assumption in the piece is that the human population will continue to grow. In transferring from our current energy regime of using stored energy (fossil fuel and virgin forest) to a pay-as-you-go system based on current solar energy balance (and some nuclear and some, but probably decreasing, residual petroleum) it is quite clear that human beings will have to take an ever-larger proportion of the available energy, and the planet will eventually become a monoculture of people and whatever extremely efficient crops or industrial processes they use to feed themselves.
While this is theoretically possible -- Stuart's paper is a pretty good demonstration of that-- it doesn't seem very likely on a number of grounds. For example, the psychological health of masses of people with nothing to do but to consume industrial products is proving to be quite a challenge-- we seem to me to be reaching some of those limits even in the face of plenty of energy.
It doesn't seem like there won't be any room at all for a "natural" world -- and I am personally convinced that not everyone will want to live in a giant Manhattan -- the sort of arrangement that this model implies (to me, at least).
Hi Stuart,
I am hoping to release my next book on Sustainable Organic Farming soon.
The Human DNA unwound is about a foot long, most plants are about a meter long. I tell my friends we are just "stupid plants"
It frightens the hell out of me when these plant genetic engineers tell us they have produced a better yielding plant. The genetically engineered plants are mostly financed by the fertilizer and chemical companies and are bred as Industrial Plants to use Industrial Products to make them yield.
The only production figures we can use for future crop predictions are those Pre-1930. It is mooted that if every single person in the US went back onto the farm tomorrow they could not produce what the Mega-Farms are producing.
I have serious doubts if we could produce what the Mega-Farms are producing in a sustainable Organic way. When Oil and Gas and Fertilizers diminish it is game over, back to subsistance.
If we went "Closed Loop" and kept all the Human, Animal, urine, feces and waste organic matter on its home site we may get closer to sustainability.
With Bio-Fuels which have a negative "Energy-in to Energy-out" we are in terminal trouble.
The Plant too has a fundamental "Energy-in to Energy-out equation". If we don't get the potential-energy into the soil nothing will be coming out. Every kilo of organic material taken off the plot has to have a kilo of organic matter replacing it. Once the sacks of Chemicals diminish there is no other alternative.
Even worse, these Super Genetically Modified crops that we now have will probably not yield well without chemicals. I wonder how many pre-1930 seed varieties we can still get.
CO2 in the atmosphere can be a gift from the Gods. I have been in greenhouses that supplement the ambient CO2 of about 300 PPM and inject CO2 up to over 1000 PPM. Yields can be enormous.
We could solve the whole CO2 problem if we made sure that every square meter of vegetation which has been removed and replaced by blacktop or cement has vegetation on stilts placed on top of it. Every rooftop on every high-rise and house should be made into a fruit tree garden.
Unfortunately we are just very-stupid plants
Thought it a bit incongruous that you open with a caveat about relying on unproven tech breakthroughs, then include a section on the potential of modifying the corn genome in drastic ways.
I only assume continuation of the current yield trend. I included that quote to illustrate that Lester Brown seems to be incorrect that plant geneticists are out of ideas (which is a major part of his argument for why the yield trend won't continue).
I'm no expert on farming issues, but the numbers are right. However this is one of those issues where my gut feeling overrides my usually down-to-earth, analyzing mind. I have never in my life read a more optimistic view on anything. Ever. It even exceeds your optimism expressed in your 4-billion-cars piece. That I cannot believe at all. This is a lot easier to believe since eating is still more important than driving and I guess will also be taken more seriously... however, if I have ever read an overly optimistic view of anything this paper has to be #1.
I'll read it a few more times before any in-depth comments. There is a certain positive to it though: even if your whole scenario turns out to be wrong, it was worth reading it still - it made me feel less uneasy for like half an hour. :-)
Be back with more.
The main problem I have with your general approach is that for me it seems you lack farming experience, Stuart. Your numbers may work well in a spreadsheet but will most certainly fail in more areas of the world than not.
Even your main assumption - available energy and available machinery - works with averages. But we may conclude from experience that energy (and water for that matter) as well as machinery are not evenly distributed. Much less is population and money (available capital and buying force).
While you can soemwhat convince me that an industrialized country with the farm sizes of that of the US may work this way in the future, I have my doubts the same can be applied to a region I'm from: Eastern Europe. Farms tend to be a lot smaller here and almost all our fossil energy is imported. Gas from Russia, coal from Poland and Germany (though we have some, as of now, closed mines), and oil also mainly from Russia. Furthermore, people and even businesses don't have the capital required for such changes, and it is unlikely we are going to get richer in the foreseeable future.
I think it is a bit superficial to work with means and averages in this case and letting go of the general economic conditions. Had it not been so in the past, there wouldn't have been any famines anywhere ever.
You say, "If average yields had not increased like this, humanity's impact on natural ecosystems would be much greater."
You fail to say, "if average yields had not increased like this, we would have a lot less humanity to have an impact". Oil drives production drives population increases drives impact. Yield may be both a cause and an effect of population increase, and the impact on natural systems might very well have been less without the green revolution. We would be operating at a much lower level, in general, and freeing up people from agriculture is the primary cause of industrialization and what we call civilization.
Don't just look at average yields, look at the context in which average yields are possible. Lunches are cheaper, but not free.
The technology came first. Population would have risen anyway, perhaps more slowly, but with a lot more rape and pillage of remaining resources.
A well researched article but does it support your conclusion that biofuels will
damage an apparently healthy agriculture?
Based on the FAO arable land stats, most undeveloped arable land is in Latin America and Africa. Biofuels in those areas would greatly increase industrial agriculture production and the basic capacity of making food. One advantage of biofuels would be the greater amount of technology that could be brought to agriculture by high prices.
There is the problem of land use change increasing CO2 emissions but on balance biofuels use cancels out land use change.
As you mentioned, nitrogen fertilizers can be made from renewable electricity instead of natural gas.
The worse scenario would seem to be when biofuels and Third World agriculture are not developed and food surpluses are dependent on the US, Canada, Australia, Brazil and Argentina, who are running short of fuel.
While following a good logical series of mental steps, Stuart's post is, as usual, operating in a complete political vacuum. Dare I say Ivory Tower.
westexas nailed it as far as the coming RealPolitik:
"In any case, I think that we are headed to a future where the primary international trade is bilateral trade between net food exporters and net energy exporters, i.e., food for energy and energy for food."
It will be a variation on MAD, Mutually Assured Destruction.
I get no reasonably priced oil, you get no reasonably priced food.
World Currency will be Energy.
This is also against the back drop of a Global Financial Meltdown, something Stuart also failed to address.
And add to the resource war mix this little caveat:
Like the famous Milk Ad with a twist: Got Guns?
Food will be a Weapon. A very powerful one at that.
Add Climate Change, which Stuart Forgot, again, and you have a real barn burner.
What we've got here is a Blivot.
From the Urban Dictionary:
blivot
Twenty pounds of shit in a ten pound bag.
A situation or item that is foolishly perceived to be simple and easily manageable when in fact it is twice as complicated and unmanageable as first foolishly perceived.
I'm not a medical professional but I'd guess Stuart has a bad case of "spreadsheet psychosis." It's similar to what the guys at google have which is they think moving around massive amounts of energy and infrastructure is as easy as moving around pixels on a screen. Or, more accurately, I think it would be to say that there is no visceral understanding of the volume of energy and actual "stuff" has to be reworked even if an intellectual understanding exists.
To illustrate: Playing with spreadsheets, you can probably figure out how a city like Los Angeles can be made sustainable. It can have its cars, its electricity, and plenty of food even if the population goes up by 50%. "Hey look, if I plug in these numbers into this spreadsheet and assume away all political and financial problems we can make the numbers come out correctly!" But one look at the place from a more comprehensive view and it's you can understand viscerally the spreadsheets and reality are not the same thing:
http://www.lifeaftertheoilcrash.net/PostOilBulletin/MapofLosAngeles.html
Matt Simmons talked about this although he didn't call it spreadsheet psychosis. He said a lot of the young guys in his industry who play with computer models have this way of thinking where in their minds if it works on the computer screen then it must (or at least can) work in real life.
My guess is there were stone tablet equivalents of Stuart's latest series of "2050" manifestos published back during the last days of the Tower of Babel economy. Once it became obvious the sucker was coming down I'm sure some Babalonyian technocrat came up with extremely complicated explanations of why the Tower can keep building upwards, perhaps not "forever" as past technocrats had postulated, but certainly for another 2 generations or so.
Stuart, thanks for a great article. However I have a few quibbles.
Widespread use? That is a bit of a stretch. I am sure a few plantation owners had one but it was not until the 1930s and the early 40s before even gasoline powered tractors had what can truly be called “widespread” use. I can remember the mid and late 40s. (I was born in 38.) Even then horses powered hay bailers and sorghum mills. They were the norm. Tractors came first then came other mechanized farm equipment. My dad got his first one row tractor in about 42 but he kept a team of horses until the early 50’s. Two row tractors came into widespread use in the 40s and 50s but it was the late 50s before larger four row tractors came into widespread use.
Even through the 30s, horses and mules were what pulled most plows. As far as “yield per acre” is concerned, you are correct that fossil-fuel powered machinery was not the “primary” cause, but they helped. But what they were responsible for was allowing one farmer to produce a lot more farm products. With modern machinery a farmer could farm many times the acreage he could with livestock.
Well, that is certainly true. But that would not have been the primary effect of lower yields. The primary effect would have been a much lower population because not nearly as much food would have been produced. You seem to take it for granted that the same amount of food and other farm products would have been produced, that they would have just cleared and farmed a lot more land. Not likely! Very marginal land is already being farmed with the aid of irrigation. There is virtually no arable land, in developed countries, that is not already in use. And most the rest is used for timber and pulpwood forest.
The rest of your article is really great but I think you are looking at the trees and totally missing the forest. You have population continuing to increase and the economy continuing to grow despite the decline of fossil fuels. (You keep it gradual because everything falls apart if there are sudden drops in oil deliveries caused by hording or war.) All this will be possible because of:
That is an extremely tall order! It assumes a smooth transition to solar and nuclear power. It assumes that we are not close to the upper limit of bushels or pounds per acre of crop production. It assumes nuclear powered ships will plow the oceans and fertilizer will be produced, not with natural gas but from hydrogen from water with the aid of nuclear power.
And how soon will all these nuclear powered ships be build, or how long before all those nuclear power plants are producing electricity? How long before we see solar power contributing a huge percentage of our energy needs. Just how much time do we have to start on this smooth transition from oil and other fossil fuels?
It appears to me that time is running out and we have hardly even begun to do one damn thing. In fact, hardly anyone even believes that a crisis in fossil fuels is even on the horizon. And it is highly unlikely that they will until the crisis is actually happening. By then it will be way, way too late to prevent a catastrophe.
I am sorry to be so critical Stuart, for I do appreciate the great amount of work you have obviously put into this report. But I think your scenario is so unlikely that it borders on a fairy tale.
Ron Patterson
Re: Mechanization
Obviously you have to read this piece in the context of the earlier ones.
Interesting analysis...obviously a lot of work! I especially appreciate the assumed parameters defined up front. What's disheartening, is that while this provides a basis for adequate food production given the constraints up to 2050, the associated probability of occurrence must, imo, be negligible.
http://reddit.com/info/6bj6l/comments/
thanks for your support in helping us get new readers. it helps us keep growing.
growth
feed me seymor feed me
Factory farming
Warning! These are actual photographs and videos documenting the abuse found in "food animal" factories, stockyards, and slaughterhouses. Many people will find them unsettling.
Ocean ecosystems plagued by agricultural runoff
Genetically Modified Food - Panacea or p...
2050? WOW that's lofty. my boy will be fifty one.
At least I won't have to watch
TRY THIS AT HOME...
Stuart -A very positive article thanks for providing an alternative mid century outlook.
Myself, "just in case" I have been researching 'Aquaponics' since trying to find a way to feed myself post peak. I'll not go into it all now but this looks like a way to feed ourselves with local produce -plants, fish protein- all using very little water.
So I'm going to give you all a good laugh here at TOD as to how far I have got down the road of 'self sustainability'.
My balcony now has a prototype 'Balcony Aquaponic' setup which is located somewhere on the very small balcony of a block of flats nr. Wimbledon, London:
The Fish Tank -300W heater, Aerator, Pump with UV.
The complete setup -complete with grow bed, a bumper harvest is all but gauranteed:
Complete Setup.
Of course I don't expect to provide much food out of the above tiny setup but I do expect to grow lots of fresh herbs, chillies, tomatoes, etc.
There's no fish in it yet so its effectivley a Hydroponic setup -the fish are in my aquarium and are NOT for eating!
If any of you are interested in having a go at this highly productive local food system I recommend having a look at www.backyardaquaponics.com site... Good Luck!
Nick.
I have looked at large scale Hydroponic systems. One uses a large water fertilizer mix tank, that has to be regularly analyzed, and the appropriate fertilizers added on a regular basis.
The Hydroponic systems are very fertilizer dependent, and require the different fertilizers to be available in whatever quantities needed.
I have not researched into aquaponics but there are major differences compared to hydroponics. Your temporary hydroponics system will stop working without fertilizers. The plants may start to dye off. WIth hydroponics, You could consider stocking many years worth of the fertilizers, that you figure could be in short supply in the future.
A few remarks regarding yield increase.
New columnar apple trees (based on a chance find seedling) will increase the yield per hectar from somewhere between 50 to 100% with less work, are less susceptible towards various pests, have excellent taste and open a much broader climatic area for apple cultivation. (Suncats, starcats, redcats etc.)
http://www.campus-geisenheim.de/fileadmin/Forschungsanstalt/Gartenbau/Ob... (Heavily illustrated (simple)German infobrochure, c. 2.3mb)
I will buy above mentioned trees for my land this year .
The following link might also be of interest
"Their findings might make it possible to transfer the nitrogen fixing capacity of legumes to a wide range of crops that do not have this ability, including maize and rice. Ultimately, this could lead to a massive reduction of inorganic fertilizer consumption. The discovery is reported in the early edition of the Proceedings of the National Academy of Sciences."
http://biopact.com/2008/03/scientists-discover-genetics-of.html
This potential does not make the other problems we face go away though...
Stuart,
The navies use nuclear powered ships to avoid having to protect supply ships. There are thoughts on using reactors to produce fuel for smaller ships in situ and the russians are developing ship based reactors for anchored power supply but using nuclear power for cargo shipping does not seem very practical. Developments in this area tend towards wind power.
http://www.popsci.com/scitech/article/2008-03/kite-power
Chris
Chris, I have no experience whatsoever in this area but what about using a flow battery and electic propulsion to power long distance shipping? The battery could be recharged at port stops -either by providing electric current to the ship or exchanging discharged with pre-charged fluid...
I guess once more this might fall into the 'things we could do but probably won't because of huge infrastructure costs', etc.
Nick.
Hi Nick,
I think flow batteries are showing potential as stationary storage. I know that there is some movement to try to prototype ammonia as an alternative shipping fuel. This has about the right energy density to substitute, and, since emissions restrictions for shipping are low to non-existent, one can make a few mistakes on the NOX side while working out the kinks and potentially be ready to step right in with low emissions technology should restrictions come into place. Bunker fuel often contains a lot of sulfur. Ammonia can be produced renewably using wind or solar power. It will be interesting to see how this effort works out.
Chris
Very interesting post. Thanks for this analysis. I'm afraid however, that there is a major concern with respect to no alternative fuel available for shipping transportation and the increasing cost, in dollars, of food. I think that these two things, rather than soil productivity, will be centers of concern. Also, with respect to genetic engineering of crops, this technology also will obey the Law of Unintended Consequences, which could be bad.
Only if one doesn't know a damn thing about plants, farming, or genetic engineering. Its not MAGIC. There are tradeoffs. Every single advancement the Hybridized varieties of corn has made, had been at the expense of some other beneficial trait. To increase production, you reduce root growth, sending that energy into seed making..... but of course now you are more vulnerable to drought.
You note the issues with dwarf varieties vs weeds but fail to see how every other single change we make will cause similar issues.
You said, "Temperature has gone up and grain production increased so I don't see a problem".
Sure.... My sub just went from the surface to 400m down, nothing happened. I can go 400m for sure..... ooops the hull failed, we are all dead.
I don't even know where to begin on this..... its just so bad. Its a case of, "anything I don't understand must be simple, therefore I can handwave it away".
I don't claim for a moment that making such plants would be easy, or that it will necessarily occur. It's a (slightly tongue in cheek) thought experiment to illustrate that we are not hard up against theoretical constraints on the amount of photosynthate that can be captured per unit area. So to say, as some might, "the yield trend cannot continue because we are against the fundamental limits of photosynthesis" would not be correct.
Whether such plants in particular will actually be developed in thirty years is as hard for you to refute as it would be for me to prove, and was not my point in any case.
Things weren't so hunky-dory in the past. Dwarf plants were developed to reduce "lodging," the twisting together of stalks caused by wind. Competition from weeds in pre-dwarf varieties was no less than post-dwarf.
Cereal grains are annual grasses, and annual grasses are disturbance plants. They thrive under disturbed conditions and require soil disturbance to grow effectively. This can be done through the scarifying effects of large animal trampling pressure or it can be done through tillage. The soil conditions required for good crop growth are also the ones weeds thrive in, whether that disturbance is done by a mule-pulled implement or a modern air-seeder. Even no-till creates narrow bands of disturbance for the seed-row.
Pre-herbicide agriculture used greater amounts of tillage to control weed growth. One common method was summer-fallowing, that is, keeping a field bare for a full growing season with many tillage passes on a regular basis to kill weeds as they germinate throughout the season. This practice results in high soil erosion. Another practice is to grow rye, which is allelopathic and generates its own herbicide to kill competing plants. Perennial crops, like hay and alfalfa can be grown in rotation with annual crops to break the weed cycle. But all these methods will reduce total yield, as will going back to animal traction for farming, since those animals will require up to one-third of the acreage set aside to provide their fuel.
Good Analysis. There are some issues that may have some bearing on it however.
Niggle 1: You may be a bit far off the mark on the 50% increase in food production. A report here about global water made the assertion that demand will double by 2050 due to the increase in meat consumption by East Asia. The market has been slightly oversupplied hence the low prices in the 90's, but these rates of oversupply can't be so high over the demand as to think that global production only needs to rise by 50%. So if this report is closer to the mark - then it may be closer to 90-95% increase. The report quoted is a bit light on the data set side but the possibility should investigated because it could substantially change your conclusions.
Niggle 2: Water wasn't mentioned as a limiting factor. According to the report above, water for agriculture is broken into two categories, Green water (rain, dew) and blue water (rivers). 80% comes from green water and 20% from blue. From my reading of the water scarcity maps - it seems like blue water irrigation is at its limits in many of the big grain producers - big patches of physical water scarcity in US, AUS, China, India. That is where 75% of rivers are allocated to agriculture. Not much room for a lot of increase production in more marginal adjacent lands if there is limited irrigation. This leads into the third niggle.
Niggle3: Climate change. This is really the wildcard. Consider that 80% of crop water is green water. What happens if rainfalls are affected? The report gives a throwaway line that climate change will be most prominent at the equator when it comes to agriculture. If this lowers rainfall (or massively increases rainfall causing flooding and greater top soil loss) then very rain dependant areas such as Indonesia (250 million plus pop with a massive rice industry) and Latin American countries could be seriously affected. Australia is also near enough to have weather patterns changed. Not to mention what is will do to Africa - which is already in a water shambles.
Add in those points and it looks at bit less rosy. All in all I believe that all said and done - that the physical limits are uncomfortably close - but not close enough to cause major food problems. The social limits however may be the limiting factor in all of this. I can imagine developed nations dropping the developing countries like a hot rock when it comes to food exports. "Ethics be damned lets__a) make biofuels with them b) trade them to people with oil c) trade them to people with energy that we desperately need"__ a conservative will say and people will nod. We have largely ignored global poverty so far, a good old liquid fuels crises is unlikely to change it...expect in the negative direction.
Wow, what a lot of work Stuart, but what a big 'if' in the following:
Considering that we are using FF now at a given rate, what do you consider the added energy will be that is required to put in place the new energy infrastructure of 'alternate' energy?
About a change in climate policy, I find that so unrealistic as to mention my own terribly unrealistic idea of 'easing'. The idea I have is based not on efficiency of production or of mechanism but of the quality and usefulness. I think it would not take a great deal of extra energy to produce products that must have certain qualities of both durability and usefulness of function. For a simple example, take the hot water heater. At one time the home hot water heater had a standard warranty of 20 years. Recently while replacing a 7 year old gas range I was curious about how warranties seemed to have slipped badly and took a look at home water heaters. I chose water heaters to look at because they did not have the usual extended warranty provision that might skew the objective. The best warranty I could get was 8 years a 60% drop in assurance of quality. Granted that is more indicative than scientific (Heh!) but when one looks at products on the market where there is less necessity for them to be well constructed or expected to be designed for long life one need look no further than one's feet, at one's amazingly bio-degradeable shoes or going upstairs to the ears where you can examine the durability of your collection of listening devices. If not, you are welcome to come see my collection of non functioning radios, cd players, recording devices and telephones.
I think my idea of producing durable goods that are actually durable and useful to the day, has about as much a chance as expecting coal not being used because of government policy. But I guess I could be wrong about both and we might be able to maintain a sort of status quo until all resources are sufficiently diminished and the population of humans on earth is back at a level the planet is able to support. How about a figure there? I am going for a number under 100 thousand as being the number of hunter gatherers a much degraded future planet will support.
As far as food Stuart, remember as Dmitry Orlov might say: Man does not live by bread alone but needs potassium permanganate as well!:)
By 2050, in the US, the Department of Agriculture will have offically been divided in two and absorbed into the State Dept and the Defense Dept. Big Chemical Ag will be a carrot and a stick for US foreign policy.
(It always has been to some extent but this new reorganization will leave no doubt in anyone's mind which side their bread is buttered on)
Food production will be as integral a part of 'Homeland' (Fatherland/Motherland) Security as apple pie and the flag.
The 'little people' (most citizens) will have 'Little Ag' (backyard gardens, just like the former Soviet Union in it's hay-day) to survive on.
Let them eat the 'non-critical' food. Save the 'Real Food' for politicking.
Fueling and distributing food will be Mission One, next to securing enough energy to run a very basic, considerably down sized national/regional 'power grid', you know, for 'National Security' reasons.
The centralized 'power grid' will be for important 'Mission Critical' uses only (Fire, Police, Medical yah-da yah-da).
The 'little people' (most citizens) will have their very own 'local grid', i.e. backyard/neighborhood power generation for personal consumption. It will be a Big Step down for most people. I don't see too many 'solar salad shooters' in this future. Not for most citizens in their everyday life.
It will be skillfully and sucessfully marketed to the public like a kind of neo-feudal street creed chic. I'm confident the media can sell the public that this new lifestyle is cool and trendyand above all Green. You know, less is more, kinda thing.
It's your patriotic duty after all, comrade citizen.
There is very little difference between Stuart Staniford optomistic views and Daniel Yergin.
Will someone please tell me why Daniel Yergin has not been invited to post stories about the rosy future that everyone wishes. I am sure that he can make it just as convincing, being as more people already believe what Daniel Yergin says.
DocScience
http://www.angelfire.com/in/Gilbert1/tt.html
We would be delighted to accept a guest post from Professor Yergin if he were willing to explain and defend his views here.
The standard we aspire to in deciding to publish is well reasoned fact-based posts that are well sourced and scientifically credible. Whether a piece is optimistic or pessimistic is not per-se a criteria for whether we post it, as long as it's of good quality. (The actual execution of this is a bit uneven, but that's the idea, anyway...)
However, I would distinguish my views from those of cornucopians in general, in that I don't view it as inevitable that civilization will survive all catastrophes and problems based on technological prowess. Instead, I view it as desirable that civilization continue, and I view each threat as something that has to be analyzed empirically on its merits to see how serious it is, and what ways of coping with it might be developed. I'm open to the idea that there might be some threat civilization cannot adapt to, but I'm not yet persuaded that we've hit one with peak oil, or with climate change (very serious as those are). However, I've said quite clearly that the recent trend of food-based biofuel growth, for example, is going to be fatal to civilization in short order. However, this isn't inevitable - we (society) have to change public policy in order to slow biofuel growth to something more manageable.
If Stuart's so wrong--make your arguments and back them up with some empirics. That's the point of this scientific endeavor...an exchange of ideas.
This is why I see this series by SS as so engaging. Yes, there are assumptions here, as there are in any mode of science. The point is that Stuart is working hard to find ways that we can make things work--but he is also a scientist and understands that this is a probabilistic and conditional enterprise.
He's not saying this is how things are going to go. He's saying this is one way they could go. That's all.
Professor Goose,
I think there have been quite a few well placed arguments made above by others, but, if you wish to have real rebuttal or criticism, when you have an article as voluminous as this one, could it be be posted without allowing comment, then reposted for rebuttal some time later. It may then be possible to do more than throw up ones hands make some hastily formed remark or merely consider the article a load of (in this case chemical) manure and blow it a raspberry.
Stuart is here telling how facts can lead to a rosy future if everything goes just right.
Yergin has no interest on pesky litle things like "facts"
And I am here answering a troll...
Coincidentally, I just finished an analysis of African food security out to 2040. While not as detailed as Stuart's piece, it does try to account for a broad variety of factors, some of which are peculiar to Africa, some of which are more general.
The factors include: the decline in fossil fuels; changing energy intensity; GDP changes; population growth; climate change; HIV/AIDS; oil and fertilizer price changes; potential increases in agricultural productivity; Africa's current food supply; the costs of domestic food production; the cost of purchase and distribution of food imports; global food price inflation; the state of international food aid and agricultural development aid.
The article makes clear the dangers of aggregating too much of the world into a single set of numbers. No matter how I diddle the parameters the outcome for Africa is not a happy one.
Africa in 2040: The Darkened Continent
Africa starts from a huge impediment to food production: it hasn't been glaciated and has had very little volcanic activity, therefore, Africa's soils are old and tired. Ruanda, with its volcanic soils, supports the highest population density in Africa.
Another problem is that the Green Revolution bypassed Africa. The main indigenous food crops of Africa did not get the kind of breeding work done on them that was done for the world's primary food plants. That is starting to change now.
Rural income has been so low that the methodologies of yield increase, such as improved tools, seeds and fertilizer, have been slow in being adopted. Ironically, higher food prices will make it easier for rural areas to take on practices that increase yields. Well placed subsidies, as occurred in Malawi, can have a high benefit-cost ratio.
A major part of the world food price increase is a direct result of increased income in developing countries as a result of globalization. They may be still poor, compared to us, but they have much more income than they used to, and they're using that income to buy higher quality food. The benefits of globalization have largely skipped Africa, but even so, Nigeria has seen a fourfold increase in wheat consumption over the past decade. Wheat may not seem "high quality" to us who are used to it, but it is a high protein grain, having twice as much protein as corn or rice. In the Third World, that's high quality.
First off, thanks, Stuart, for putting pen to paper (or finger tips to keyboard?) and going through the substantial work required to put this together.
A few tidbits that might be worth considering;
1) Soil Quality. While you deal with the potential limitations of erosion, that is not the only soil issue we're confronting. Indeed, there are now concerns that the excess application of petro-chemical fertilizers has essentially burnt out the native microorganisms, resulting in the need for increasing amounts of fertilizers to compensate for the decreasing soil vitality.
2) Secondary impacts of the green revolution. Contrary to casual observations, we have never had a problem growing enough food to feed everyone. Even the dramatic famines of the 20th century were the result of regional problems, not global shortfalls. However, (and this was pointed out decades ago by the "Diet for a Small Planet" crowd), growing the food is not the same as feeding people. In fact, green revolution agriculture can exacerbate the problem of poverty (and income disparity). The cycle is relatively straight forward, the cost of entry into GR/industrial ag is significantly higher than traditional ag. This means that only a portion of traditional farmers can buy in. The increased yields of those who can buy in drives down the local ag prices, driving those poorer farmers out of the business. They sell their land to the bigger concerns who can further take advantage of scale and deal with the smaller margins.
When this happened in the U.S., industrial growth was able to provide meaningful employment for those who left the farm (except during the depression). When this happened in Thailand (and many other less developed nations), industrial growth was able to provide meaningful employment for some who left the farm, but many others were forced into shanty towns. As this is happening in southern India now, industrial growth has been able to provide meaningful employment for very few who left the farm. The result has been the disastrous slums of Mumbai and suicide rates in farming communities that top any other group in the world.
3)Secondary impacts of GMO. I won't be labor this as I've already gone to long. But the increased risk of the lack of genetic and crop diversity that is of concern with GR seed is even greater with projections for the future of GMO.
Oh, and one side note - before taking swipes at "organic" agriculture, consider that it post-dates industrial agriculture. Indeed, it is a response to the perceived deficiencies of industrial ag.
Stuart, there could be one fatal flaw even though yiels are steadily increasing. I remember reading an article (maybe in the new scientist) a year or so back stating that nutrient levels in fruits/veg/crops had dropped to all time lows and vitamin/mineral content was only 25-50% of what it had been some years ago.
I will try and find a source for this article.
Marco.
This was not my original source but you get the idea. Some levels declined 80% over the last 50 years.
http://www.nutraingredients.com/news/ng.asp?id=66440-nutrient-content-mi...
Marco.
Try The End of Food.
This was very informative Stuart. Thanks for all your hard work on it, and I do appreciate that you are looking to prevent die off, etc. and don't consider it inevitable like many others do. We share that same concern and to some extent the same attitude of non-fatalism.
I have much less confidence in the techno-industrial path than you do, but do agree that there are fewer limits to feeding everyone than is often assumed. But where I would differ is not in pushing to improve yields and potentially intensify inputs, but in reducing demand. Most of our calories come directly or indirectly from grains. Most in the developed world already eat too much grain fed meat. Seems to me just cutting way back on this and the grain crunch is solved.
But as you know from the biofuel fiasco and the fact that millions are without adequate food today, none of this happens in a market driven, pay me the money, system.
You are correct of course that if everyone would stop eating meat, we would have ample food for everyone. The problem with global hunger all these years has never been that the world doesn't produce enough food, but rather that some people can't afford enough of it. That idea has been around for a long time - when I was 19, I read "Diet for a Small Planet" and promptly became vegetarian (I later compromised on fish, but still don't eat meat). In the intervening decades, I have noted that very few people made the same choice. I'd prefer to plan on the basis that they will continue to behave in that way.
Also, I note that to stop the innovation/intensification process you're going to have to actively stop the agricultural research sector from continuing to develop new ideas - left to their own devices, they'll keep coming up with new stuff and trying to sell it to farmers, who will adopt it once they are persuaded it really works and isn't BS. Not sure how you'd go about stopping that process...
that's not smart considering that higher food costs would eventually reduce consumption of meat.
So, contrary to Jason's claim above, this transition can probably only happen in a market driven, pay me the money system.
Well, I don't actually think we should all stop eating meat, but feeding grains to ruminants is not so smart, and that's a huge chunk of where grains go.
With respect to research and development, my position is just the opposite of what you imply. Huge amounts of research and R&D need to be happening! But the questions should be who funds it and who benefits?
We have to feed them something. Is there sufficient pasture land to support current levels of meat production? Or can we simply feed ruminants from the 'waste' portion of food crops (e.g. corn straw, wheat straw, etc.)?
I believe there's plenty of meat to be had using high quality pasture. Steers weighing 900 lbs, fed entirely on grass, are sent to feedlots to be fed grain so they can bulk up to 1200 lbs for slaughter. In the process their Omega-3 fatty acids are converted to unhealthy Omega-6 and the poor animals suffer from eating a type of food they are not evolved to.
The average American eats about 140 lbs of beef per year, which is obscene. If we cut that down to a third, might be done using good pasture in a possibly sustainable manner with plenty of meat to go around. Sustainability requires accepting sufficiency not obscenity.
I was not promoting using grain to feed ruminants. I eat very little meat myself. I was just trying to understand if current levels of meat production are sustainable.
We need to do a better job of teaching livestock producers to be better botanists. We already do a good job teaching them to be vets.
When Gene Goven of Turtle Lake, ND, was given the rancher of the year award, he said: "My crop is grass. I use cattle to harvest it." He saw his primary role as managing his pastures, which he did through a system called "cell grazing," that allowed him to increase the carrying capacity of the pastures without overgrazing or damaging them.
Many producers look at grass as if its free. But the rule of thumb is "take half, leave half." If you leave half for the plant, the plant can produce more total forage. There are good, well developed techniques for increasing carrying capacity and thus the total number of ruminants which can be supported by the same quantity of land.
The bigger problem is getting Americans to accept grass-finished cattle. It means giving up highly marbled (fatty) meat and it means changing how Americans cook beef. I grew up in Europe, where beef was drier and stringier, so we used low temperature slow cooking. I was quite surprised to see Americans slapping huge slabs of beef on a barbeque and leaving them on only long enough to get warm.
Feeding grain to cattle is a poor use of resources. Feeding grain to poultry, however, is efficient. Pigs are problematic. They're really mast (acorn) eaters. When I was growing up in a refugee camp, we used pigs to recycle waste food into meat. That was efficient.
Actually, it isn't necessary that everyone stop eating meat - Lappe was simply wrong in that regard. But most people would have to eat less of it, and in somewhat different ways. Animal agriculture is a useful and perhaps necessary supplement to plant cropping - and it isn't necessary that they eat any human food at all.
Nor is it necessary to stop the agricultural research sector - agricultural research will always go on. The question is where we put the emphasis of our investigations - all scientific investigation is biased in a whole host of ways, some of which we are aware of and try and compensate for, and some of which many people simply can't see. For example, in medicine, we devote many, many, many more dollars to curing disease than to keeping people healthy. This is a cultural bias that shapes how we do our research in a whole host of ways. The same is true about scientific research into agriculture - the question is not a matter of stopping, but perhaps whether we could change the ways culture and economy shape and bias our choices (towards other biases ;-)). It is, I think, always a mistake to imply that we simply are making progress towards a particular goal, and the way we are "progressing" is in itself not a construct of what Foucault called "The Archaeology of Knowledge."
Sharon
Sharon:
One of the things that bothers me wrt the discussion about "meat" is the overgeneralization - the discussion is couched in terms of "all or nothing". The fact is that all meat is not equal in its impact, whether we are talking about land use or energy inputs.
We all know that feedlot beef tops the scale, being most demanding both in terms of land use and energy. Pasture-fed beef is a lot lower on the scale, as are sheep and pigs (especially free-range pigs fed garbage rather than corn). Poultry weigh in even lower, with free-range birds again having less impact than confined corn-fed poultry. Dairy ranks pretty low on the scale, too.
The point of this being that if meat eaters want to reduce their ecological impacts, and reduce the amount of land and energy that is going into the production of their food, they can achieve a lot simply by not eating corn-finished beef and instead eating almost any other type of meat. A general shift from confined-raised to free-range meat will achieve even greater gains. Limiting oneself mostly to poultry and dairy, with "red meats" (beef, lamb, pork) reserved for special occasions), would lower one's impacts substantially.
It is true that eating a vegan, or even an ovo-lacto-vegitarian, diet would bring one's impacts lower still. However, it is difficult for a person to go from being a hearty beef eater to a vegitarian in one step. The distance is pretty hard for all but the most convinced and committed person to bridge. On the other hand, the smaller steps I've outlined above are much easier. Suggesting to a person that eats red meat four nights a week that they start by substituting poultry for one or two of those nights is not suggesting something that they are going to find all that difficult. Switching to all free-range meats is a more difficult challenge, because they are more expensive; however, I've found that they do taste better, and are better nutritionally, and those are points that can be used to help sell the idea.
We could achieve a lot if we could simply persuade a lot of people to "downshift" in their consumption of meat. As a practical, tactical matter, we can probably achieve more than is being done with the absolutist, "all-or-nothing" approach.
The thing is that an entirely animal-free farm is not sustainable. Whenever you look up organic animal-free farming methods it's always, "add organic matter to the soil, and -" where does this "organic matter" come from? From other land; they're importing fertility. They have to, or it doesn't work. Their gain is another's loss. That's a snake eating its own tail for agriculture.
If you want a self-contained farm which is sustainable, doesn't need to import fertility, then you need animals. You can turn grass and vegetables into compost in six weeks in a compost heap, or into manure in about twelve hours by putting it through the guts of an animal. Chooks are wonderful for concentrating the phosphorous in things, chook shit in gardens helps the growth no end.
You can do it all with manure crops and so on, but it's a much slower process, and you have to leave a lot of your soil unproductive.
So, a more or less self-reliant and self-contained farm, to be very productive, needs animals. And if you have the animals, you may as well eat some of them. For example, to get milk from a cow it needs to occasionally get pregnant, what do you do with the calf? At some point you run out of land.
This then leads to our eating animals. But it leads to far less than the 100kg or so of meat eaten by the average Westerner annually, more like 6-12kg. And of course if you're only raising that much in the way of animals, you don't have to keep them in factory farms pumping them full of grain in feedlots, so they don't fart as much and you drop your contribution to global warming from livestock, which is good.
> You can do it all with manure crops and so on, but it's a much slower process, and you have to leave a lot of your soil unproductive.
As someone with a small sheep flock, I see fabulous gains in my garden with recycled biomass (manure). But there are many cover crop rotations that provide soil enrichment without additional land fallowing cycles. The list is long (including red clover, buckwheat, oats, etc) and the cover crops are started in the fall for spring crops, or in the spring for fall crops. The need for herbicides is greatly reduced or eliminated. And no-till organic methods are gaining popularity.
http://www.newfarm.org/depts/notill/index.shtml

One pass "roll-n-plant", where a soil-enriching cover crop is turned into mulch for the food crop.
> The thing is that an entirely animal-free farm is not sustainable.
This assertion is unsupported.
Stuart shows that the basis of the anti ethanol crowd (EROEI) is a total lie. I knew it. Thank you Stuart for proving it with this statement: "Agriculture is a minor user of oil. In total it used only 2.2% of oil in 2000."! In total!
Clearly corn is a fraction of the total, for sure way less than half. If agriculture in 2008 is using the same percentage of oil as in 2000 that means corn is using less than one percent of oil usage in the U.S.. At the moment corn ethanol is, if I'm not mistaken, supplying around 6 percent of liquid fuel for transport. That would mean on a rough basis leaving out some energy inputs that ethanol has a roughly equivalent energy increase to gasoline. And this does not take into a account that only a fraction of the corn crop is used for ethanol. In other words, less than one percent of oil usage yields liquid fuel usage of about six percent. This is in the area of gasoline. I know for a fact that the energy inputs attributed corn production are a lie from personal experience on my farm. Thank you Stuart for proving it.
X- it still doesn't mean though that ethanol can fuel any substantial portion of our transportation needs.
The energy inputs you left out are 75% of the total.
What a great idea! Simply leave out the majority of the calculation!
Do I need any other data to conclude you are a prize idiot?
In 2006, corn ethanol involved converting about 17% of the US corn crop into about 2% of the US gasoline supply (on an energetic basis, 3% on a volumetric basis). It's clear that scaling this much further is going to be disastrous, but the CAGR over the last five years was about 25% annually (doubling in three years).
Most of the energetic input to ethanol is natural gas in the distillery, not oil on the farm. I accept the view that ethanol has a very small but positive net energy. It also makes complete sense to me that farmers should make a good living in return for their extremely hard work and the great risks they take. But continuing our existing biofuel policy is going to be disastrous.
X Practical
So you are going to run with the agriculture uses 2.2% of oil available to the US market.........
Do you have any idea how much oil that is?
Do you understand that to feed an increasing population that 2.2% will increase as oil imports lessen?
Where will the increase come from from, or will other sections of the economy get less but still remain healthy?
What would happen to agriculture if the supply of oil happened to reduce by.1%?
"I know for a fact that the energy inputs attributed corn production are a lie from personal experience on my farm".........................Give us a break down, to show us how its done, the world will benefit with knowledge of your EROEI mastering techniques.
Farmers will be able to outbid all sectors for oil except for the government, because farmers' customers have no biologically-based choice but to pay more for the product. The government of course simply steals as much money as they want, so they have no possibility of losing customers
You hope...........
If it comes to the stage where farmers get the oil first and most, does that mean transport comes second, or mining, or public services, or plastics, or manufacturing or R & D, or you name it.
What are the farmers going to do, bake the bread and sell it over the fence?
Who will they sell to if unemployment escalates due to a collapsing economy.
Don't you think agriculture needs the economy functioning well........... and everything which goes with it?
The problem with peak oil is that it makes a mockery of those who expect BAU and it includes
all forms of agriculture.
Those who assist farmers in food distribution will also have profitable business and thus oil-buying power
Some businesses and wage expectations will become obsolete. There will be a wealth redistribution due to Peak Oil, until alternative energy picks up the slack, but it's not inherently disastrous, due to the safety net of energy we currently spend on goods and services not essential to our health
Thank you Stuart and everyone else for the best website on this planet and any other!
Regarding the water issue, an awful lot of grain comes from dryland farming. As continental land masses hold high pressure weather with summer heating, drought conditions intensify. Crops such as sorghum, and particularly pearl millet, produce a crop where others fail. Grains that do well in marginal conditions become the better options.
If we're discussing food out to 2050, we ought to be including a discussion of the role of seafood. Prospects for commercial fishing out to 2050 are not good. In addition to the pressure put on ocean habitats from an expanding human population, climate change may also have a significant impact on the global fish catch. In the Philippines, per capita fish consumption was 28.8 kilograms per year in 2003. Because of overfishing, this may drop to 10 kg as early as 2010.
Much of the world's population depends heavily on seafood for its diet. What will replace it if we actually succeed in emptying the oceans of commercially extractable numbers of fish? Aquaculture maybe eventually, but how fast can it be ramped up? Are we going to expand agriculture fast enough to feed the growing global population while also compensating for loss of ocean food sources?
Here is something about seafood futures Ocean Acidification, the Other Threat of Rising CO2 Emissions
This article contains forward looking statements.
Imagine Peak Food debunked by STEAM TRACTORS!
Oh, darn! There goes my day, another big Stuart Staniford article! ;-)
Although I understand that Stuart is reserving a discussion about water until a later piece, that presents some difficulty, because water really is the most critical input of them all. Photosynthesis, after all, simply produces carbohydrates from H2O + CO2 + sunlight. We can take the sunlight and CO2 as "givens", leaving H2O as the one big contingent factor.
Getting enough water to crops to get ANY yield, let alone a maximum one, has always been a challenge for many people in many parts of the world. Thus, if we are going to maintain, let alone increase, global crop production, then making sure that adequate moisture gets to the crops must be our first and most important concern. Given the changing precipitation patterns that are predicted to accompany AGC, plus the depletion of non-renewable (within a generational time horizon) aquifers, this is a particularly serious challenge.
I would argue that the best place to start is by making the best use of whatever precipitation does fall on a farmer's field. This means that capturing and holding rainfall in the soil and close to the root zone of the crop needs to be of primary importance. We know of two things that are particularly helpful toward this end. First, a soil that is rich in organic matter will hold more moisture relative to soils which are deficient in such. Second, covering the soil surface with some sort of mulch will retard evaporation than thus retain more moisture compared to bare soil surfaces. If supplemental irrigation is still needed (and matching crops to local precipitation levels, working WITH nature instead of against it, clearly makes more sense), then these same cultural practices will be even more important to assure that the amount of increasingly scarce and expensive irrigation water is minimized.
These two cultural practices -- soil amendment and mulching -- just happen to be at the very heart of the organic method. In fact, I would go so far to say that given a choice, I'd rather just use these two practices and forget about all the rest that goes with "organic agriculture", rather than have all the rest but not be able to amend the soil or mulch it.
Scale is a challenge; it is just a lot easier to amend soils and apply mulches in gardens and small-scale farms than it is to do so on large-scale mechanized crop farms. This need not be a permanent impediment, though. Stuart mentioned that he was not counting on much in the way of technological progress, yet this would seem to me to be one area that promised particularly great rewards. Thus, I cannot accept it as a given that the amendment of soils and mulching of crops is inherently or permanently impossible for large-scale farming operations.
Need I point out that if mulching is utilized on a large-scale, then the need for herbicides is considerably reduced, and could perhaps be eliminated altogether? Furthermore, if organic materials are used for the mulching, then these also serve as soil amendments. Thus, a program of intensive mulching with organic materials can also serve as a no-till cultural practice.
A program to intensively build up the soil through the yearly addition of organic matter in the form of mulches will also build up soil fertility naturally, and thus greatly reduce the amount of supplemental fertilization needed.
Much of the organic material which could be used for mulching and soil amendment is currently thrown away, where it pollutes streams and expands landfills. Adopting such organic cultural practices also has a benefit in terms of the reduction in the waste stream that this would cause.
Soils that have been amended with lots of organic matter and that are protected with mulches are far less vulnerable to erosion. Top soils are thus built up rather than depleted.
I don't know how the yields would compare between crops grown in amended soil with mulches and conventional fields; One would think that the yields would be higher - or at least no lower - for the organic method. I AM certain that crops raised on the organic method would do MUCH better under drought conditions. This is relevant and does need to be considered when discussing yields - how are the yields not just when everything is perfect, but also in the real world when things are going wrong?
I suspect that eventually, what I have just described will become the mainstream agricultural practice, because it just makes too much sense and will be too favorable in its economics to not do things this way.
On my small farm we grow the compost/cover crops necessary to apply finished compost at a rate of 5-10 tons (2000 lbs/ton) per acre. This may sound like a lot, but when spread out it is a thin layer of compost. When I think of mulch, I think of a thick layer of organic matter, say a few inches. I just don't see how to do that at a large scale, such as what is needed for grains.
Leaving crop residue on a field after harvest, such as grain stalks, is a kind of mulching, but means the business of exporting straw and cellulosic biomass can't happen big time. Cover crops planted immediately after harvest can provide a "living mulch."
I think fertility maintenance through timely cover cropping, and combining field straw with humanure will be very important.
"Leaving crop residue on a field after harvest, such as grain stalks, is a kind of mulching, but means the business of exporting straw and cellulosic biomass can't happen big time."
Yes, the Montgomery paper really gave me pause about the wisdom of assuming the crop residues can all be exported. However, it would seem there is many orders of magnitude variation for erosion potential based on the individual location. It seems likely that there's a fraction of flat floodplain land on which one could export all the residues, replace nutrients, and continue for millenia without problems from erosion - the soil probably keeps rising there on account of erosion from upslope. OTOH, there a steeper and more fragile fields where it's foolish to export residues at all (and of course still other places it's foolish to grow crops at all).
It would be interesting to see attempts to quantify attempts to harness agricultural residues that are based on detailed GIS information about the local effects on the sustainability of farming each particular place.
Natural flood regimes used to replenish lowlands every year, with the potential for disaster now and then. I can see the land supporting exports in places like that with the fertility replenishment happening in geologic time via vulcanism and mountain uplifting.
Even if the old flood regimes could be restarted or simulated, not sure how applicable it is to the huge acreage in grains grown in "uplands," which may be rolling hills of wheat in eastern Washington, etc.
Good question to ponder though.
Jason,
One thing to remember with cover crops is that it is unlikely to be sustainable locally because you are not producing your own seed. Further, if you do produce your own seed, you must allot land, irrigation water and have the equipment to harvest it - Yes, I know people can still do it by hand - and then thresh it.
I used to use a high build organic matter mix from Peaceful Valley Farm Supply (oats, vetch, fava beans and cow peas). I decided to grow my own one year and just left it all go to seed. What a mess. Among other things, it lodged.
Given the cost of the seed (including shipping) and effort, I switched to using alfalfa hay as a growing season mulch which was turned under and then re-mulching for winter protection. It was only slightly more expensive, provided as much organic material and was easier.
Todd
HI Todd,
I am emphasizing banner fava beans and grains for main cover crops because of the relative ease of harvest and processing of these compared to small seeded plants like clover, and plants that require huge areas to recoup the seed investment like peas and vetch.
I am also planting perennial sections of alfalfa and paths of perennial clovers.
In doing the math on the area required to produce the seed I need it isn't too bad, but does take some planning. The flowering fava beans are also great for the honey bees on the farm.
Coming up with the equipment to spread a mulch layer over huge fields is a technical challenge, but not an insurmountable one. The truth is that very few people have put their minds to the problem so far.
The bigger challenge would be coming up with all the organic matter required. We need to start by diverting the entire waste stream from all livestock feeding operations back on to the fields. These should first be run through anaerobic generators to extract the methane (with the double benefit of generating energy and eliminating a greenhouse gas 20X more potent than CO2); the remaining slurry might possibly be easier to handle and apply than solid organic matter.
We probably need to do the same with human wastes as well, but there are additional hygenic considerations involved to eliminate the transmission of parasites and pathogens. Probably the simple expedient of using CSP energy to heat the slurry to a temperature that would kill all parasites and pathogens prior to application would suffice. Contamination of municipal waste streams with heavy metals and other toxic substances is a more difficult problem. I suspect that solving it will require that we get away from the idea of a single municipal sewerage system serving all purposes, and putting industrial customers on a separate system. We are also going to have to eliminate the possibility of there being toxic materials that could enter into the waste stream in the first place. This has broad implications, one example of which would require the reformulation of household cleaning and maintenance substances so that nothing was available on the market that contained toxic materials. A "whole systems" approach is definitely needed.
These only scratch the surface, of course. There are all manner of other organic wastes that need to be diverted from the "trash disposal" stream and applied as mulches. Even all of these might not be enough to really do the job. Thus, we might want to even think about pairing land dedicated to raising annual crops with other land planted in forests or other permaculture crops that are sustainably harvested in part for the purpose of producing organic mulches for the crop fields. Rather than expanding grain production into marginal lands, it might make far more sense to use those marginal lands for this purpose, and through the additional mulch they can provide thus boost the productivity and yields of the prime farmland.
This is exactly the idea behind minimum tillage, or to use its other common name, "stubble mulching." Farmers in the US and Canada have drastically reduced tillage operations on their fields. Part of the reason is to control soil erosion and part is economic, since stubble mulching results in higher yields and lower costs. The idea is to leave as much "trash" (crop residue) as possible in the top 6 inches of soil. The moldboard plow is virtually dead. No till has been rising in use in row crops and air seeders (which combine tilling, seeding and fertilizing into one operation) have become the norm in small grains.
Nowdays, a trashy field is considered beautiful. This is also the reason that it's a bad idea to use crop residue, like corn stover, as feed stock for cellulosic ethanol. That organic matter needs to stay in the field and be mulched in. Perennial grasses, on the other hand, have between 50 and 80% of their biomass underground, so removing the above ground biomass, after the plant has gone through full senescence and has translocated nutrients into its root system before winter, has minimal effect on soil organic matter content.
Yes, I know that minimal tillage leaves a good layer of crop residue as a mulch, and that has definitely been a good step in the right direction. I think we need to take another step, though, and get back to spreading manure or other organic matter on the soil in addition to this. Even leaving a lot of the crop residues, there is still a net substraction of organic matter from the field when the crop is harvested. We need to be thinking in terms of annual net additions if we are going to really build the soil up to the point where it really soaks up and retains moisture like a sponge.
Cover crops are great, too, especially legumes. The problem is that you eventually have to till them in, and then you're back to exposed soil surfaces again, which means you're going to have to mulch even thicker. I suppose that some sort of rotation plan where you are not using cover crops every year but rather alternating with no-till would work out best.
Linear thinking is seductive and misleading. When looking at periods of 30 years or more, in any era since 1800, it is the discontinuities that jump out at us. Certainly, thast's the case with ag output. The major increase after 1940 would never have been predicted based upon the years just preceding. That there will be one or more discontinuities of at least comparable magnitude in the future seems unavoidable. This could be a significant drop in output due to water limits, soil degradation, less fertilizer availability or destructive climate change. Or, perhaps a major increase due to genetic manipulation. Either way, a smooth upward increase extending the gains of 1940- date into the future is probably the least likely outcome.
Another "wrinkle" in the global food scenario is the impact from the rising middle classes in India and China as they increase overall per capita consumption and shift toward increased per capita consumption of animal-origin proteins.
For a quick synopsis, see Can the World Afford a Middle Class? in Foreign Policy March/April 2008
Seems like the whole localization idea that global trade will come to a halt due to lack of transportable fuels is a bit misleading. The Roman Empire used to import huge amounts of grain from the Nile delta across the Mediterranean. Sailing ships did not require oil to operate and they did commerce quite well abet a bit slower and more expensive.
-Crews
Thanks Stuart for the thought provoking post. While not necessarily agreeing with all you say, I applaud your approach that humanity needed just roll over and quit. Lets look at what is within the realm of basic feasibility.
Good points.
Production per unit area has been rising.
Farming is low percent user of fossil fuels. May need allocation/rationing to keep current production fully going. If normal economics is allowed to progress then many of the projected 9 billion people may not be able to afford to eat.
Shows that it might be feasible. Need to assess range of yearly production as everyone needs to eat each year/day. Can't rely on just means. This would require an assessment of how much storage would be needed with 9 billion people and a say a 40 percent reduction in food production for a single year. What about back to back poor production years? This issue of a poor crop and low world wide reserves is currently having significant implications in food prices.
Have to better integrate latest assessments from IPCC and others on impacts of upcoming climate change. Might be able to make it work through 2050 but what about the next 50 years when climate change kicks in even more? Perhaps you can address this in your upcoming water for agriculture post?
Individual points in no particular order.
Using USGS as source for available Phosphorus may not be useful. USGS estimates for Oil and Coal have been shown to highly biased on the high side.
Nuclear reactors in commercial ships. Nice idea at first, but only if nuclear reactors were inherently safe and non-radioactive. Too much a security risk.
Would require a world wide concerted effort if for no other reason than management of all the needed capital. I don't believe it is likely as currently most people don't want to believe in PO as it might inconvenience them, and they are highly resistant to changing lifestyles. For it to be economically/politically feasible every country would need to coordinate their efforts. The classic tragedy-of-the-commons. Otherwise, the country that held out using low cost energy would have the short term advantage. Your solution requires abandoning near term economic advantages for long term benefits.
While I'm not sure I support the view that everything is going to work out nicely, your work does show that food production is not going to necessarily collapse everywhere all at once as fossil fuels become more expensive. Not sure the system will change soon enough to feed all 9 billion people every year. I guess I take more the view of westtexas. If you are not a food exporter you better have something significant to trade. Same if you are not an energy exporter.
There is also this prior work that suggests that we may be past "peak phosphorus"
http://www.theoildrum.com/node/2882
I think there are destabilising factors that could prevent this rosy scenario working out. One that is currently evident in Australia is regional boom and bust due to water availability. Some farmers did great out of La Nina rainfall others missed out such as irrigators on inland streams who got their water entitlement cut 80%. If this is the way of the future I don't see the system being flexible enough to keep all those farmers on standby/welfare in case water is available.
Another issue is food affordability in an era of nuclear nitrogen. The white collar employee who works in the city may find that with all other living expenses going off the dial then eating right becomes a luxury. There may be other problems for agriculture down the track; for example no-till depends on cheap safe herbicide which may not work so well as weeds adapt.
Hello SS,
Kudos for your hard work for this keypost! Wish TOD had 10,000 of you so we could really start to statistically nail down where the bottlenecks and blowbacks are likely to occur, and what we could do to mitigate them. But I find no evidence of Asimov's Foundations to ease your investigative workload. Maybe all the soon-to-be-unemployed Wall Street Hedge Fund Quant-Freaks can be skill-shifted to aid in your leading, bleeding edge postPeak research.
I hope in future installments that you can take a closer look at the fertilizer situation. Like FFs: it is not the size of the tank, but the quantity coming out of the tap.
Industrial agro-chems [I-NPK, and other minerals] are seeing rapid price increases because of the double-whammy effect of depleting FFs being used to mine, beneficiate, then globally distributed to hopefully be timely farmfield applied with optimal planting seasonality. Any biosolar mission-critical breakdown in this far-flung, multi-process supply chain has drastic implications for consequent harvest yields [even if the weather and other farm inputs is optimal].
I am certainly no data-freak [I sure wish I had your skills!], but I have been trying my best to document by multiple TOD postings the recent problems with I-NPK and sulphur, and its rippling effects through our food networks. My feeble attempts could be summed up as anecdotal, at best, but in aggregate: it seems to point to big problems ahead.
Bob Shaw in Phx,Az Are Humans Smarter than Yeast?
Has anyone factored in growing foods indoors using hydroponics. Has anyone thought of converting shuttered or half-empty malls, commercial real estate and anything else to grow food?
think of a 2 storey 5,000 square foot mcmansion with a basement in the suburbs(bought for back taxes when the suburbs become abandoned like kunstler says) converted to growing food and food might be more sustainable than previously thought.
John15,
I put this very idea to JimK in this response to one of his posts here at TOD last week:
http://www.theoildrum.com/node/3706#comment-313299
IMO Permaculture concepts can be rolled out in a new GreenTech revolution and probably will be at a pinch. People are not going to starve to death unless there is societal disconnect -i.e. mass anarchy.
Also see my Aquaponics post above. Couple this with fish/rabbits/Vermiculture/etc and you have the basis for a holistic approach that can be rolled out to regreen Kunstlers 'Necrotic Suburbs'...
Nick.
thanks noutram.
I am watching to see if they ever get that vertical farm built in Las Vegas, that is a story to watch.
http://www.nextenergynews.com/news1/next-energy-news-las-vegas-vertical-...
That's a good return to say the least.
This story says that the vertical farm was basically a hoax.
Can anyone find any other verification on this ??
http://blog.businessgreen.com/2008/01/so-is-las-vegas.html
Stuart - thank you for continuing to peck away at whats feasible, and what is not. I am much more concerned than you are, for reasons I've outline here for the past 3 years, but our views are not mutually exclusive.
Or are they?
(My friend Jay sent me this today - it's an excerpt from How Thinking Goes Wrong)
To me, TOD is a place where we are raising the level of discourse regionally, nationally and globally (?) When the shit really hits the fan, the more decisionmakers at all levels that understand the core issues (net energy, environmental externalities, human drives shaped by co-evolution of genes and culture, etc.) and don't have to reinvent the wheel in each conversation, the better off we (collectively) will be. But the moral above is that the smarter one is, the harder it is to change their minds....
Before I personally believe in 3 billion cars, or doubling our ag production by 2050, I will have to witness some change in the cultural carrot away from conspicuous consumption. Without that, all roads seem to lead to faster entropy.
Well spoken Nate, I only have one issue with this article and why does no one ever consider geothermal to be a viable power source for the future, It seems one of the best candidates to me, as much as the technology has progressed.
Nate,
Thanks for continuing to point out the obvious truth that so many people are resistant to acknowledging. We need to develop a cultural concept of economic maturity so that people understand that there is such a thing as 'enough' when it comes to material wealth. Without such maturity all of the technological briliance in the world is not going to save us from disaster.
Linear trends will continue in a linear fashion until they can't, then they won't.
Hello TODers,
http://www.expressindia.com/latest-news/Need-of-the-hour-is-to-save-soil...
-------------------------------------
Need of the hour is to save soil fertility, says IFFCO MD
IFFCO Managing Director Udai Shankar Awasthi on Saturday admitted that “continued fertiliser subsidy is killing the country’s soil”.
He was speaking to The Indian Express after inaugurating an international seminar on “Fertiliser Technology: 21st Century Challenges and Options”, at Banaras Hindu University (BHU). “Continued fertiliser subsidy by the government, resulting in cheap fertilisers, means greater use of fertilisers by farmers. This ultimately causes the soil to become infertile,” Awasthi said.
-----------------------------------
I found this interesting because I assumed [dangerous, I know] that India would have been a leader in organic fertilizer recycling [O-NPK], and because so many are poor: that policies would have long ago been instituted to further closing of the O-NPK loop, and the reduction of I-NPK subsidies. So, in essence, they are marching headlong into postPeak farming disaster when they are priced out of the I-NPK market by rising FF-depletion.
It would be fascinating [horrifying?] to know if this trend of decreasing soil fertility is occurring globally, and how fast countries are planning to move to massive O-NPK recycling to increase soil mulching, micro-organism growth, water-retention in topsoil, and reduce pollution.
Do I need to mention my speculative SpiderWebRiding as my solution to closing this O-NPK recycling loop?
Bob Shaw in Phx,Az Are Humans Smarter than Yeast?
I've heard this number is more like 10% (maybe that's all fossil fuels) somewhere on this site before.
Heinberg in Peak Everything claims that agriculture uses 17% of all energy in the US (p. 48) though it wasn't cited, so I'm not sure of the source.
2.2% just seems way too low to me. Does that include trucking, or is that covered under Trucks >8500 lbs? What percentage of all trucking is agricultural? How much air freight is food? How much shipping? How much for heat for food warehouses and stores? How much for refrigeration and air conditioning of the same? What is the percent of road wear caused by agricultural trucking thus requiring repavement and road maintenance (on JD's graph paving is it's own item)?
I don't think that percentage is a seed to mouth calculation.
"I don't think that percentage is a seed to mouth calculation".
Agreed, I believe that number to be just the actual operation of agriculture itself, and doesn't involve food processing or distribution. Distribution is going to be some non-trivial but not overwhelming fraction of the trucking number. Then there is the energetic cost of food processing, but very little of that will be coming from oil.
I wouldn't be surprised if people driving to restaurants and supermarkets is the largest single usage of oil in the entire setup.
It would make a good post sometime to track down how the energy use of the entire food system breaks down.
This pdf is a good source on energy use in the entire food system, and is likely the source of Heinberg's 17% figure, which seems reasonable and reflects the results of a number of studies conducted in the 70s and 80s. Although the breakdown varies greatly depending on the food product, the rough breakdown of food system energy use is:
Agricultural production: 17.5%
Processing: 28.1%
Wholesale/Retail: 9%
Transportation: 11%
Restaurants: 15.8%
Home prep: 25.0%
Edit: Also note that we are dealing with two different axes here -- energy and petroleum. The above figures and Heinberg's 17% figure pertain to *energy* use in the food system, which includes electricity derived from many non-oil sources. The 2.2% figure in the DOE table pertains to *petroleum* use for agricultural machinery. Petroleum use in the entire food system is definitely greater than 2.2%, as you suggest, but it is definitely substantially less than Heinberg's 17% figure, because that includes NG used for fertilizer, and hydropower used to make aluminum cans, and coal electricity used for refrigeration etc.
Stuart,
I tend to think of organic farming as a step forward rather than a step backward. Badgley et al. (2007)
http://journals.cambridge.org/action/displayAbstract?fromPage=online&aid...
find that organic agriculture is a step up from subsistance methods, doubling or tripling yields and is competitive with conventional industrial farming. I think the fundementals of the green revolution are not in the source of the nitrogen, but rather in the understanding of how it helps. Since organic methods control nitrogen runoff, they also have the effect of boosting ocean and estuary productivity. So, if Badgley et al. are correct that currently cultivated land can produce more with organic methods than with conventional methods and fisheries are also restored then the overall food production would be maximized via organic rather than conventional farming. I would note that organic and industrial are not mutually exclusive. Organic wheat is harvested with a combine, for example. Since pests can become resistant to petsicides, having smarter ways to deal with them is an improvement on conventional agriculture and may be required for sustainability.
The organic sector has been experiencing fairly robust 15 to 20% growth over the last decade or so and seems to be one of the things that is helping to preserve family farming. I only buy organic milk consistently myself but I notice that it's price has been stable so far against higher grain prices. It seems to me that when looking around at the farmer's market it would be better to be thankful that agriculture has room to improve and the market is showing the way. With a bit of luck, we'll see a fish market full of oysters, crabs and shad taking its place next door as "the river exceedeth with abundance of fish...lying so thick with their heads above the water...," as Captain John Smith put it, in a decade or so.
I wonder if maybe you have fallen into a reversalist trap in your thinking about organic agriculture?
Chris
Cheers Stuart and excellent post! For my part, it seemed to me that the whole mass starvation argument based on Peak Oil was a bit overblown. Seems we can't have a crisis without a large number of very loud people declaring the end of the world.
In summation in a post peak world likely scenarios include:
1. Use of natural gas/coal gas for chemical feedstocks shifts to a more diverse base of fossil fuels + non food crops as feedstocks.
2. Second green revolution occurs in genetically modified foods (beginning now) reducing the need for chemicals while further enhancing yields.
3. Exotic uses for land/soil/nutrients possible in a severe pinch (hydroponics, ocean agriculture, permaculture etc.)
4. Transportation of food shifts back to ships and trains (all more efficient).
5. Mechanized farming goes efficient, then hybrid, then electric.
Seems we have two groups of extreme types:
1. The Peak Oil deniers
2. The Peak Oil doomers
My 100,000 dollar bet (adjusted for inflation)? Human civilization will survive the next 30 years intact regardless of Peak Oil. Yes there will be strain, difficulty, and struggle as would be precipitated by any other period of crisis/transition. But we will pull through. Anyone want to take me up on it?
As for global warming? Well let's hope Peak Oil's silver lining helps us mitigate that problem as well. For my part, I feel global warming is a very real problem but I don't yet think the scientists have a firm handle on the rate of warming or the potential scope long term.
If intact means keeping 2,5 billion people using traditional biomass for cooking while we literally throw away energy with our overconsumption I guess "Intact" here shouldn't be viewed as a positive thing.
An excellent article by Stuart that does what it is supposed to do (ie show what is possible and dig up some solid data for us to all enjoy)
Given that populations have frequently starved during the green revolution due to economic and political factors I still think it is prudent to hedge your bets and find a situation including growing at least a portion of your own food if at all possible. In the first world many aging land owners have idle space that younger folk could bring into production. The most immediate threat (1-3 years hence) is coming from the economic system, and the likelihood that political weirdness will follow. The response to this is to get out of debt, be healthy, learn to cook cheaply from scratch, maybe learn to grow food. After that peak oil/natural gas will swing into place (5-10 years hence), though the current economic system has so much excess and waste there are ample opportunities to keep the basics running. In this phase you add in more major adjustments to energy use. And beyond that (and beyond our lifespans at 20-100 years hence) the worst effects of any global warming will become evident. The key to survival is to deal with the right threat at the right time. A person panic selling all their stocks in 1921 under the perfect foresight of the market in 1929 wouldnt achieve anything in particular. Timing is everything.
Another thing that is widely overlooked is that plants (as an aggregate of biomass) are not usually limited in their rate of growth by access to light (black corn wouldnt grow any faster). Plants contain all sorts of mechanisms to divert the flow of excess solar energy when they can't make use of it, and even under ideal conditions they only capture a small percentage of the total available energy (typically around 2%). The limiting factors are more often moisture, or if that is ample then the concentration of CO2 becomes limiting. In fact the only major advances in photosynthesis since it popped into existance have been better mechanisms for concentrating CO2 around the critical carbon fixing enzyme, which has the bonus effect of helping conserve moisture lost to transpiration (ie C4 metabolism, pushing conversion up to ~5%).
When you contrast this with the conversion efficiencies of solar photovoltaic cells, or heat engines of 10-40% you start to realise how hamstrung biofuels are by their history. All those losses and bottle necks to produce a carbon based fuel, only to burn it away. Biological energy should be reserved for biological consumption due to its unique nature. And renewable type heat and light based energy has the potential to produce over an order of magnitude more energy than we ever got from biological systems.
Cheers Void,
I've always been perplexed by people wanting to get energy from bio-fuels, whereas solar energy is straight from the source, why go from sun to plant to tractor to transport to ethanol/biodiesel/biomass/gasification plant back to transport to fueling station to car, when one has the ability to go from sun to car... the loss of energy efficiency is ridiculous..
A tractor with a ton of batteries will go a kilometer or 2 before needing a recharge. Unlimited amounts of electric power will not solve our problems in food production, transportation, and home heating. Guess what happens when people don't eat and don't have heat in cold climates? And then there is water, which can't be supplied without oil. Water for irrigation and drinking water is kind of a must. Solar and wind will consume lots of oil in their production and give us nothing that we need. It is strange that so many on this site argue for electric power. The power of ideologies learned in college is strong.
Source please.
Because you don't have the power to begin with, and can't get it in an era of emergencies that use all oil for survival.
higher prices will bring on the transition way before that's a problem.
Combines are always run at full power (throttle is pushed right to full stop); tractors are usually run at full power for field operations. A tractor pulling a 60 foot air seeder will need to put out about 200 Kilowatts of constant power. In a normal 12 hour day, that would be 2,400 Kilowatt-hours of storage needed. Actually more, because of losses. It's not like operating a car engine, which is lightly loaded 90% of the time. Batteries may be doable for cars, but for agricultural use, the weight and volume of batteries required would dwarf the tractor itself. Smaller tractors and equipment would use less, but the scale remains the same.
This might be an application where non-rechargeable zinc-air batteries would be useful, as the energy to weight is so high - you would physically swap the zinc out when it was oxidised, and send it off to be re-converted back to zinc with solar, wind or nuclear power.
http://www.meridian-int-res.com/Projects/The_Zinc_Air_Solution.pdf
The_Zinc_Air_Solution.pdf
As you can see, at 220/watt/kg the power density is very high.
That is still around 12.5 kilotonnes just for the zinc though, so something would have to give, so probably biofuels in this specific application would be used.
Reading Stuarts posts on food production and i am reminded of a time when I was one of the few arguing Peak oil was a real an imitate threat, Pre oil drum... "Experts" would display EIA, IEA, Shell, Etc data and demonstrate that all was well and there was nothing to worry about... Hmmmmm 7 years on..
Despite the fancy graphs and no energy supply issues http://www.washingtonpost.com/wp-dyn/content/article/2006/05/19/AR200605... Globle Wheat stocks and production continue to decline.. and price continue to rise....
Cheap energy = cheap food
Expensive energy = very little food.
Its that simple..
This was posted on ASPO site. A utube video only a few minutes long.
http://www.oilrelease.com/
Excellent article once again Stuart.
When talking about food, calories and yields non-nutritionists get confused and need some basic concepts.
SOME BASIC CONCEPTS FOR THE AMATEURS
(a) Physics tells us that energy is needed to perform all actions (work, play, sleep etc) and to grow.
(b) Unit of energy is joules, one joule is amount of energy needed to accelerate one kg of matter to one meter-square over a distance of one meter.
(c) Unit of energy used by nutritionists is Calories which is equal to 1000 calories and 4200 joules.
(d) For a healthy person the weight must be according to his/her height, more the height more should be the weight.
(e) For each kg body-weight a person would consume 20 to 80 calories with mean value 40. A person would need only 20 calories per kg of body-weight if he/she is not doing any work for example when a person is in comma. If a person do usual daily tasks like going to work, doing some walks he/she need 40 calories per day. People who make living doing heavy physical works like digging, loading etc need 50 calories per kg body weight. Athletes need 60 calories and in extreme cases a person might consume 80 calories per kg body weight but only for a few days.
(f) A balanced human diet must contain seven basic ingredients, carbohydrates, proteins, fats, vitamins, minerals, fiber and water. The first three and last two are in hundreds of grams per day and the other two are in miligrams.
(g) A person living only on grains need 200 kg of it per year to provide all energy needs of body for the mean 40 calories per kg body weight work. That is when taking 50 kg average weight of population including children and old and 3600 Calories per kg of grains.
(h) Since a person cannot live on grains only and other things especially milk, meat, oil consume more grains to be produced or more land that would be otherwise used for grains production therefore a person need as much land to have balanced diet as is needed to produce 400 kg grains per year. Details about it are here:
http://europe.theoildrum.com/node/3090
(i) Some of the land can be reused, for example land set aside for fruit production also produce some fodder for animals in form of leaves, grass between trees etc. Also some of the crop residues after taking out grains can be fed to animals. Therefore fertile land needed per capita is equal to land needed to produce 320 kg grains per year.
(j) To maintain a balance ecosystem in long term some land must be kept aside as forests, either that be at local level like each village having a surrounding forest or on global level where some continents like south america and africa are put aside mostly as forest lands to preserve climate and wild life and supported by kyoto. That forest land must be atleast 20% of all fertile lands. Therefore fertile land need per capita bounce back to land needed to grow 400 kg grains per year.
(k) The worst way of agriculture is three-way fields in medieval europe in which year on year average output was 100 kg of grains per acre. So, 4 acres of fertile land was needed per capita. Since typically 80% of land was fertile in every manor, the rest being rocky, swampy and water path therefore in a typical manor of 1500 acres the average population was 300. That is a way of sustainable living practised in medieval europe for over a thousand years in which land fertility was not only maintained but also slightly increased.
(l) Another way of sustainable living was practised in fertile lands of asia like egypt, iraq, india, china etc where the year on year average yield was 400 kg per acre per year. That is four times as high as in europe at same period. The reason was better ways of land use using better seed variety and using human and animal manure as fertilizer.
(m) In last two points the land discussed was one which has only rain as source of water and there is only one crop per year. If dams and canals are made and therefore water was available for regular winter crop as well then the production can double to 800 kg per acre per year.
(n) Modern agriculture in europe and america produce 6400 kg grains per acre per year. That is because of heavy use of fertilizers and pesticides and extensive dams, canals and tube wells usage to increase water supply. Also there is a serious loss of bio diversity and ecologicial damage because of run-off fertilizers.
Hello!
Talking about high production is meaningless in a heavy subsidized farmin system, without subventions - no production. It is also meaningless to talk about the direct fuel consumption omitting the consumption in the whole system. In that way you get the renewable part in ethanolmaking from corn to about 10 %. As we very soon seems to be falling to the bottom of the net energy fossil fuel cliff it will also be very little electricity even from nuclear plants as they need too much resources to keep going, and also windpower will be much more expensive to build. An emergy researcher of the Odum discipline here in Sweden newly made a calculation that the biospere can produce per living person a hamburger every third day or in money about three dolars per person and day for the amount of population we have now. There is no time left, we have to make plan B now! And by using the selforganization in living system we can get much done with little own effort.
Bo Falk
Odum? Den var ny för mig.
Subsidies is about how the work is paid and it is perfectly feasable to talk about production level but you have to move the ecomical system limits to include the subsidies.
It is basicaly the same as calculating the utility of corn etahnol by moving the system limits to include the energy ammount and quality going into fertilizer, tractor fuel and distillation heat.
stuart
i have not commented much on these posts as i think your parameters are horrifically far from being possible; particularly the economic one.
i laud your laying out the impossibility of using biofuels to motor.
i think your overall approach is not grounded. theory about what humans do w/o accounting for human nature is at best an internal mental exercise.
history argues against your method being helpful. we knew about peak oil in the 50's; total denial. we had the club of rome warning us in the 70's so limits/peak info was readily about & carter's sweater speech was an attempt to avert some of these problems.i read of mining on the moon in the 70's; throwing materials in space building solar collectors, etc. etc. our problems can be solved technically/sciencewise.
BTW industrial ag should probably be broken down into mechanized [tractor, etc.]& seed/plant. bed gardening is more productive than row per unit space due to the math. again this is a human problem as we will not work that hard unless forced to by ma nature or otherwise. one of the serious problems with the altered seeds[hybrid,gm] is the lack of a backup if there is a discontinuity of the seed production.i agree that centralized structures like industrial ag will be necessary to feed us in the near future.
i believe industrial ag , while it is much more likely to produce more quantity has been tremendously damaging to our social fabric & environment & psyche etc. in fact as i ponder this industrial ag may be the no. 1 suspect for the US when this gets looked at historically. we could have made much better decisions about using it's gifts w/o it's adverse consequences.
Something that has not been discussed yet is the possibility of getting our food from the vegetative parts of perennial plants, rather than the fruiting parts of annuals. Ironically, it is biofuels research that may show the way.
The Neolithic Revolution was a response to human population increase bumping up against the limits of the earth's carrying capacity for humans practicing a foraging lifestyle. By switching to agriculture, humans increased the human carrying capacity of the earth by several orders of magnitude.
However, humans chose the line of least resistance, which is all they could do at the time, by using annual plants to concentrate nutrients for them. Over time, we have been refining that system but we have not changed it in any significant way. As I mentioned in an earlier post on this discussion, annuals are disturbance plants. They rapidly colonize disturbed sites and mine the soil in order to create as much seed as possible, for that is how they carry on their DNA into the future.
Perennials have a very different philosophy of life and reproduction. Perennials place their survival hopes on biomass: aboveground for trees and underground for grasses. (A joke I like to tell is that perennials are like the ants storing food underground for winter; whereas, annuals are like teenagers: all they have on their minds is sex.) Seed production for perennials comes from surplus carbohydrate reserves. What for annuals is primary, is secondary for perennials. Perennials are low fertility plants. They don't mine the soil but actually create new soil.
Perennial grasses are very, very good at creating vegetative matter with low inputs. In general, they have high water utilization efficiency. But most of the carbohydrates they produce is locked up in tightly bound polymers: cellulose, hemicellulose and lignin. Perennial legumes are very efficient producers of protein. Alfalfa has an 18% crude protein content. But again, that resource is tied up, unless you happen to be a ruminant.
If we can untie the locked up nutrition in perennial vegetative matter, we could increase food production by possibly half an order of magnitude, while at the same time greatly reducing inputs, including fertilizer, chemicals and fuel usage.
The task is incredibly difficult. The money has not been there to even consider it in the past. If cellulose is unlocked as a feedstock for ethanol production, it becomes, at the same time, unlocked for human and animal food production. This is a paradigm shift the equal of the original agricultural revolution begun 10,000 years ago.
Somewhere out there is the next Norman Borlaug.
Thanks for the interesting analysis.
However, a couple of your points are weak enough to undermine your conclusion.
First of all, your statement that mechanization is not the main cause of the increase in yields is not supported by data. Steam tractors were in use in the early 1900s, but they were heavy and cumbersome and their use was not widespread. The real boom in tractor use came after WW II (see White, William. "Economic History of Tractors in the United States". EH.Net Encyclopedia, edited by Robert Whaples. August 15, 2001. http://eh.net/encyclopedia/article/white.tractors.history.us.
Secondly, the dramatic increase in use of nitrogen fertilizer must be a major factor in the increasing yields. Nitrogen is almost everywhere the limiting nutrient. Nitrogen fertilizer use grew linearly from around 10 million tons/y in 1960 to 80 million tons/y by the mid 80s.
If you are right that somehow the world will transition to non-fossil sources of cheap energy by 2050, then maybe the pattern of steadily increasing yields will continue. Otherwise, a continuation of this trend seems unlikely.
Two sites that people interested in sustainable ag should look at are:
The Sustainable Agriculture Research and Education Project http://www.sare.org Be sure to read their book The New American Farmer which was available as a free download.
Also check out: http://www.sarep.ucdavis.edu for more sustainable ag information.
Todd
There was an article published in The Australian newspaper today emphasising that we could face "dwindling supplies" of phosphate by 2040.
Since phosphorus is an essential ingredient in food production, this makes the challenge of feeding 9 billion people by 2050 a little daunting to say the least.
Article:
Warning of world phosphate shortage
http://www.theaustralian.news.com.au/story/0,25197,23360117-27703,00.html
Hi all:
Interesting and well thought out. I am impressed and thankful for the analysis, but not convinced. The main problem I have is that the social, economic, and political problems are not considered. A secondary problem is that it is not completely clear to me that industrial agriculture really is scalable, even if the social and economic problems were completely handled. There are a lot of moving parts, and everything needs to work properly for the system to work.
1. There are three basic aspects of food production that need to be addressed: scale (how much food), allocation (what kind of food), and distribution (who gets what food). The questions of distribution and allocation are not really dealt with in this post. Anyone who wants to make a prima facie case for adequate food supplies through 2015, much less 2050, needs to address this. Even if there's plenty of food, if it's too expensive, people will starve. Here are a few recent quotes from news reports cited in "Peak Oil News": "Rising prices threaten millions with starvation, despite bumper crops," "Record prices for grain from corn to rice have ignited food riots from Jakarta to Rome," "Vulnerable regions of the world face the risk of famine over the next three years." In short, scale is not sufficient in itself to make the case for adequate food supplies. You have to look at inequality.
2. It may be true that industrial agriculture is really scalable, but I don't think that case has been made here. David and Marcia Pimentel put the U. S. energy consumption at 17% of the total U. S. energy budget. (See Food, Energy, and Society, p. 8.) While this is not that large for the U. S., the total U. S. energy budget for food alone per capita is about TWICE the TOTAL energy consumption per capita in the less developed countries of the world. It's more than just a problem with people eating out too much, as the Pimentels show. To me this is a nontrivial amount and creates questions as to whether the U. S. agricultural system is really scalable.
It may be scalable given a world-wide integrated food system (under, say, a benevolent dictator), but I don't see the case that it can be done in all areas of the world. True, fossil fuels play a small role in total energy use in the food system, and in theory we could allocate away from SUVs and other high-energy items to farms. However, to bring this sort of allocation scheme about, through a benevolent dictator or any other way, we are talking about massive social changes that need to be discussed. After reading Daly and Farley ("Ecological Economics") I am convinced that this cannot happen as long as we are operating under current neo- classical economic assumptions. So we need to change the economic system, just for starters.
It is quite plausible that well before 2050 -- perhaps as soon as 2010 or 2015 -- that some people are going to be priced out of the market for food, because wealthier people in the U. S. (and increasingly in China and India) can pay more for grain for their livestock (or for their ethanol) than the entire salary of poorer people. (Thanks Stuart for being mostly vegetarian.) Sure there's plenty of food, but if the poor can't afford it, what difference does it make?
3. Absolute grain production has been increasing, though both the rate and absolute amount of the increase has lessened substantially. Here's my back of the envelope analysis. World grain production for selected sample years in millions of tons per year:
1961 805
1971 1194 increase of 389 or 48%
1981 1496 increase of 302 or 25%
1991 1717 increase of 221 or 15%
2001 1909 increase of 192 or 11%
2006 1994 (est.) half a decade, increase of 85 or 4%
(Source: WorldWatch, Vital Signs 2007-2008.)
This is back-of-the-envelope math but it doesn't look like a straight line to me. Are we looking at the same data? It looks like both the absolute increase per decade and the relative increase per decade are declining. It suggests an ultimate peak in food production, and probably well before 2050. It suggests that we need to further discuss the accuracy of the various data points I'm seeing thrown around.
4. Per capita grain production is actually less today than in the 1980's. Using Vital Signs again to give kilograms of grain per person:
1980 319
1985 344
1990 337
1995 302
2000 306
2005 305
You could argue that the data since 1995 indicates a leveling out or plateau, but I think the burden of proof would be on the person wanting to show that it would not decline further. This is not something I'd bet the future of humanity on.
5. Meat production has been soaring, both in absolute and per-person terms. Million tons, selected years, worldwide (again from Vital Signs):
1970 100
1980 136
1990 180
2000 234
2005 269
Since meat production directly impacts grain resources, that means the effective grain available for food per capita has been declining even further. It has the same effect as the corn ethanol scam, though not quite as bad: feeding grains to animals destroys only about 70 - 90% of the food energy, rather than 100% as with ethanol.
6. Relegating the impact of water on food production to a future post in a discussion of food supplies is a major lacuna. My reading of the evidence is that irrigated agriculture is where any future increases in food production are going to be. These tremendous increases in agricultural production that we are talking about have gone hand-in-hand with water consumption by agriculture. In 1950, North America used 287 cubic kilometers of water, in 1990 653 cubic kilometers of water (most of this going to agriculture). The increase in food yields in this period appears to be heavily dependent on irrigation.
http://webworld.unesco.org/water/ihp/db/shiklomanov/summary/html/sum_tab...
7. Soil erosion. A good article to read on this is "Soil loss tolerance: fact or myth?" in May-June 1987 issue of the Journal of Soil and Water Conservation. According to David Pimentel, soil is eroding about 10 to 20 times faster than it is being formed in the United States. It is almost certainly much worse in Africa and Asia.
We need more than a casual reference to "no till" agriculture here. Just running out the clock until 2050 will be a hollow victory if we have a massive die-off in 2060; I'm looking for "sustainable." No-till shows, I hope, that we can deal with soil erosion, but how are you going to implement this? It's possible no-till will cut costs and thus be adopted for economic reasons. But if true, how are you going to spread these techniques? And if not, how are you going to enforce this? Are we going to have soil erosion police going into Pakistan, or wherever? And won't going to no- till worldwide result in at least a temporary but dramatic dip in yields?
It may be possible, from a technical point of view, using something like the Vulcan mind-meld on all of the political leaders and farmers in the world, to feed the world to 2050. However, I think that there are major social upheavals required to implement this, and it's misleading to gloss over this point. (1) The absolutely incredible social inequality in the realm of food today -- where you have the U. S. per capita energy expenditures on food exceeding the total energy expenditures per capita of the poorest -- has to be largely eliminated. (2) Everyone in the world has to eat like Stuart -- maybe not strictly vegetarian, but pretty close to it. (3) Farming world-wide has to go to no-till agriculture, and we hope that the yields for no-till hold up and that it doesn't just slow down, but stops, net soil erosion. In my mind, this is like the entire world going through a "French Revolution" type of event.
Stuart,
Have you even considered the possibility that the rates of erosion might be slowing because we are reaching the end of what can be eroded away? Clearly the examples of the great plains and the massive erosion there over the last 150 years (over 18 inches total in some places) suggests that there must be some upper bound on how much soil can be eroded away before arable land becomes non-arable.
Further, clay and sand are not arable soils by themselves. They require much work (energy+time), introduction of biological materials, and establishment of typical soil ecosystems in order to become arable in the first place. Do your rates of erosion distinguish between productive soils versus underlying clays, sands, etc.?
Just to keep the doomers happy, realise what Staniford is saying.
In other words: Staniford is saying "we should be pretty much right until 2050" and also "the actions we take now are going to determine whether most of the children born in the world today end their days in misery and hunger".
Wishful thinking?
http://edro.wordpress.com/topsoil/
I'm not really sure what to make of this post.
You start by saying: “trying to figure out how civilization could be moved to a mostly sustainable footing by 2050 “, and that is a valid exercise.
My personal opinion is that we could save civilization as we know it. That it is physically possible to use coal to liquid, conservation, renewables, and nuclear to transition the economy.
The problem isn't the physical reality, it is the people inhabiting that reality. You have a population that was born into a golden age of prosperity and is unable to imagine that they need to change. Even $100+ oil prices fails to phase them. They have never know famine or poverty like those who lived through the great depression. (Heck, most on this board don't even remember the oil crisis of the 70's .) So they are simply unwilling to consider changing. Even once supplies start to run out, the population will still have to go through the 5 stages of grief.
If the federal budget was balanced, the dollar strong and the financial center were solvent, then once the crisis hits you MAY be able to limp along. But that's not the reality we are given to work with.
You obviously did a lot of work on this, but IMHO, it is just a fairytale based on Pollyanna assumptions.
You seem to be rather confounding the world with the US, and that is getting less and less valid as time passes and the dollar sinks, whilst China and India move up to take something like the place that their populations imply.
The EU too, whilst it has it's own problems, is not in the same condition as the US.
I can see the most dynamic responses to peak oil coming from China - nations on the rise typically have very large powers to overcome obstacles - they now project that they will produce around 60GW of power from nuclear stations by 2020, instead of the 40GW they had previously thought, for instance.
For a variety of causes, some actually strengths such as large coal reserves, the US is likely to be a laggard rather than a leader in climate change and adaption to post peak oil.
Difficulties will be very severe, but it is inappropriate to look solely to US problems in assessing how they will be tackled.
I would also like to thank Stuart for the research and work that went into this article, and all the comments that followed. I have many of the same reservations about the conclusions, all the while realizing that Stuart is not predicting that everything will be okay, just that we do have options.
I was surprised to see that no on made any comments on food wastage.
As this article states - http://www.foodproductiondaily.com/news/ng.asp?n=56340-half-of-us
half of the food in North America is not consumed. That is a rather startling statistic and indicates that much can be done to utilize all the excess food that is never used. If we also include overeating which is endemic here, there is probably more than 50% of the food that goes to waste. An interesting program on CBC Radio today dealt with the issue of food wastage. The reasons for the wastage is rooted in our society and would require some modification to change the way we eat, shop and cook food. If we could reduce food wastage to 10%, we could probably feed an additional 250 million people in North America alone. I don't expect that to happen anytime soon, and I personally don't want to see the population increase anymore. However, there is potential to rest some agricultural land and employ greater crop rotation to better sustain the soils if we just use our food resources more intelligently.
Within the defined parameters, another energetic examination by SS. It seems that nonlinearity is one of the things defined away, even in this most-complex interaction of the universe's most chaotic known systems. Still, I enjoyed reading it as science fiction, and like all good science fiction I took some real-world useful notes from what I consider to be a creative imaginary scenario.
Stuart said, above:
So since he has broached it, I'll mention why to me this post brings meaning to the phrase "death-wish-cult".
Of course, it's fully up to Stuart what assumptions he makes and rules he decides to follow, and where he takes it; and kudos to him for putting in the effort. He seems like a great guy with a good value system trying to make the best of the real world.
Yet I think there's a lot of baggage encoded in the premise itself. Why should "food to 2050" be considered salient? Clearly, it's because that's the rough period most readers care about. A human lifetime. The question being asked is "is it thermodynamically possible for human growth to continue without running out of food until 2050?" This is asked in the face of the logical impossibility of growth continuing indefinitely, and with abundant evidence that we're degrading the planet's biological resilience as well as wiping out millions of species, acidifying the oceans, turning the Amazon into savannah, and almost certainly buggering up the earth's carrying capacity for eons to come.
This "eating" is the philosophy of the cancer cell. It's a simply terrible idea. It's worse than immediate famine because it will probably drastically reduce the number of humans - let alone other species - who may exist in the coming hundred thousand years.
What? A hundred thousand years? How can I seriously be talking about a hundred thousand years?
Well, why shouldn't we all be? Other than suicidal gluttony and breeding like yeast or creepily wanting to see the "end times" personally, why the short focus? There is no reason at all a healthy planet with a billion humans on it couldn't last at least that long. At Least. Or a million years. Those of us who can't bear the thought of a bit of famine and system collapse here and there - with our Smokey-the-Bear ethic of "no forest fires - ever", are screwing with the very existence of trillions of real humans who should get to exist. Yes, let's hold that thought: trillions of humans, with smiles and names and lives and homes. Thousands of generations of a one-billion population. Who speaks for them, in this "food to 2050" thought experiment? It's their existence which is being erased, along with the species they might enjoy... or have enjoyed.... sharing the planet with.
When balancing a trillion lives against a few billion, perspective alters a bit. Or should. Why the heck should we accept, and plan out, an inevitable yeastlike growth of "food" which predictably takes us to a pilfered planet with melted glaciers and Gandhi's feared human locusts? I suppose it's because we deepdown aren't evolved to give a damn. Even our most scientific discussions, like this one, are basically clustered around planning horizons which wouldn't be out of place for a troup of monkeys.
If one took an overall look at the human race as a surgeon looks at a cancerous human - which would be an eminently sane response - the only salient question would be whether it was possible to stem growth, to restrict the nutrients and angiogenesis which feed the metastasis, and to make possible a healthy life for the system into the future.
I'd like that future of trillions of people and biodiversity to exist. That will seemingly be largely or entirely precluded if we have "Food to 2050" for the predicted billions. So I guess by the prevailing logic of this post, and Stuart's comment, that makes me part of the death-wish-cult.
So why does it feel the other way around?
Rhetorical question. I'll go away now.....
I see it this way. We can only reasonably plan 100 years ahead. Beyond that, we can't know what'll happen.
So we should avoid doing things which we know will screw people a century or more from now - say, just dumping old nuke sub reactor cores into the Arctic - but our definite plans of how to live should be for a century from now.
The Greens here Down Under have got a good motto, that their test of the worth of any policy is, "will our children and our grandchildren thank us for what we're doing now?"
So stuff like, should we tear up this forest and put in a parking lot - are our kids going to be grateful for that parking lot? Probably not. Should we pump out the oil faster and burn it all up, will our kids thank us for having no oil left to use? Probably not. Will my kid say, "gee Dad I'm so glad you built that glass and concrete tower, it really enriched everyone's lives." Not likely. We decide to invade and occupy another country and threaten its neighbours, will grandson be happy about that? Doubt it.
I don't think we can reasonably be expected to plan beyond that. But if people in each generation think that way, that gives much the same effect as you or me planning 10,000 years ahead. Because my children will ask themselves if their children will thank them, and so on. We have to give them the freedom to adjust to circumstances at the time.
There's good and no so good stuff there, greenish.
We should indeed be concerned with more than global warming, and many other inputs like acidification of the oceans are also of major importance.
However, the question of 'when?' to stopping growth is still critical.
If we can pull it off and get to the end of the century in reasonable shape having had good growth so that vast numbers of people are not living in dire poverty as they are today, then we can reasonably hope that birth rates will fall just as they have in all advanced economies, and a game-plan of gradually reducing environmental impact may become clear.
We would also be able to afford very expensive solutions.
A world where huge numbers of people are fighting desperately to survive is a very different place, and in fact standstill may be unlikely, regression might be more probable.
DM, I can tell you mean well, but you actually believe that human poverty will be less prevalent in 2050 than it is now? Or in 2100? You don't get "less poverty" by combining "lots more humans" with "less usable energy and fewer resources". And in the meanwhile, we'll acidify the oceans and turn the Amazon to dust, will no longer have much in the way of glacier-fed rivers, will have killed off a majority of earth's species and reduced much of the rest to unstable populations... yeesh. The time for gradually reducing environmental impact was probably 60 years ago. At some point ya just gotta ask "how many humans at one time are too many?" We have posed the question in physical terms and the universe will answer it for us in kind.
Stuart's next post which will deal with water will hedge the population numbers down I reckon, since he's a smart guy. But look around you: unless humans change the way they're stimulated and what they decide to value in a profound way, this is as good as it gets. EROEI on energy, affordability of fertilizers, biodiversity, predictable climate, and much else is on the way down. And it won't happen via a homogenized gradual slope, it'll be nonlinear and untidy as systems and infrastructure fail and smaller and smaller groups of people look first to their own self-interest. Geopolitical barter, bluff, and threat on the grand scale with some players desperate; terrorism, piracy and police states, and famine on a scale which will make previous famines statistical rounding errors. Not because it's thermodynamically inevitable, but because it's the way humans act.