| Energy For a Changing World: A Credible European Energy Strategy for the 21st Century | The Oil Drum: Europe | Olduvai 2008 movie |
Olduvai revisited 2008
Posted by Luis de Sousa on February 28, 2008 - 11:15am in The Oil Drum: Europe
Foreword My first post at TOD was published by Heading Out about 2 years ago on this same subject. Some rather naïve forecasts were made back then, without exactly addressing the main subject: can Mankind avoid the Road to the Olduvai Gorge? This is a first try in answering that question.
The work on this article started in the Spring of 2007, when Euan Mearns tried to show that Peak Oil does not necessarily imply an Energy crunch. Partly due to my critique, Euan's work would never see the light of day. Sometime later, Euan and I started working together on the work reported here, focusing on Conventional Fossil Fuels (FF). The fact that several studies on future Coal reserves and extraction rates were published in the interim, facilitated our work.
This work would end up being a collective post by TOD:E, Rembrandt kindly provided historical FF data and Chris Vernon would solve some issues with the conversion of primary energy to heat. An important leap towards the conclusion of this work was made during the weekend of the 1st of December, when the TOD:E staff gathered in Paris, kindly hosted by Jérôme.
Introduction The Olduvai Gorge Theory was first laid out by Richard Duncan in 1989, when he observed that world energy per capita had been declining for a decade. He developed the concept of Electrical Civilization, the way of life made possible by widespread and abundant electricity and set it to the period in which world energy per capita is above 30% of its all-time peak. The Theory was postulated it in the following way:
- Industrial Civilization can be described by a single pulse waveform of duration X, as measured by average energy-use per person per year.
- The life-expectancy of Industrial Civilization is less than one-hundred (100) years: i.e., X < 100 years.
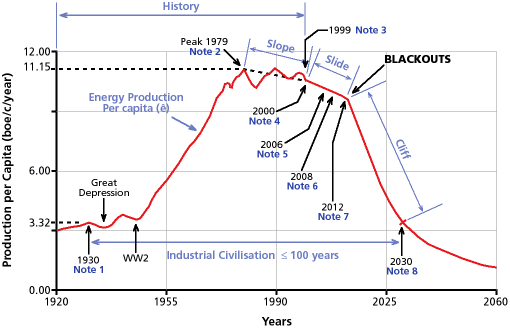
Figure 1 - The three phases of the Olduvai Decline. Source: WolfAtTheDoor.
The post-peak period develops in three phases:
- The Olduvai Slope – a period of slow decline;
- The Olduvai Slide – a period triggered by Peak Oil when decline would accelerate;
- The Olduvai Cliff – the collapse of Electrical Civilization with overwhelming decline of energy per capita.
As the years went by it became clear that world energy per capita was in a plateau, not a decline, and in 2005 the 1979 peak was surpassed. Still, almost ninety percent of the total energy used world wide comes from fossil fuels. If such dependence on finite resources remains, the Olduvai Theory may eventually unfold.
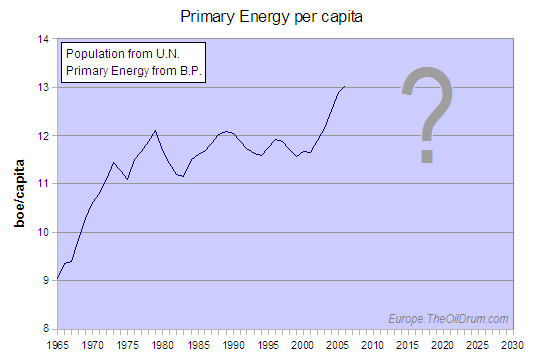
Figure 2 - World Primary Energy Per Capita. Population from UN, Energy from BP BOE - barrels oil equivalent.
This work tries to assess how the decline of Conventional Fossil Fuels may unfold and how can Mankind avoid the Road that may take us back to the Olduvai Gorge.
The Future of Conventional Fossil Fuels
In the context of this work, Conventional Fossil Fuels represents the kinds of these resources in production today. These may include fuels usually called Unconventional like the Tar Sands or Coal Bed Methane. It is assumed that none of the Unconventional Fuels Fossil will have a visible impact on the overall world energy production for two main reasons: the volumes produced are unlikely to be significant (e.g. Tar Sands) and the net energy balance of some is doubtfully positive (e.g. Ultra-deep Offshore). The one exception is Coal where in-situ gasification might turn important Resources into Reserves (this issue will be dealt with later).Our approach has been to use what we regard as the best researched and most reliable estimates for future global oil natural gas and coal production. Each fuel is re-based in "oil equivalent". And we use the UN population forecasts to derive a per capita FF forecast. However, the main objective of this work is to develop scenarios for alternative energies (nuclear and renewables) that may partially fill the energy gap left by declining FF. These scenarios are not forecasts but have been produced to illustrate the scale of the energy problem that now confronts Mankind.
Oil For Oil, the forecast made by Khebab using a Loglets Transform, was chosen. This scenario is in line with those of several other researchers: Jean Lahèrrere, Colin Campbell, Chris Skebrowski and Kenneth Deffeyes. Laid down this way, Oil Production peaks by 2012.
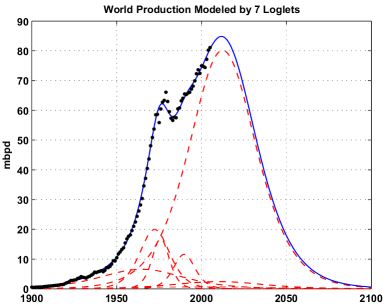
Figure 3 - Conventional Oil Forecast (including NGL) according to the Loglets Transform.
Natural Gas
The scenario chosen for Natural Gas is that produced by Jean Laherrère portraying a peak by 2030. This scenario can be considered optimistic to some extent, but takes into account the high degree of uncertainty on Natural Gas forecasting, among other reasons, due to poor data on past discovery and production. This forecast also includes Coal Bed Methane and other Unconventional gas sources.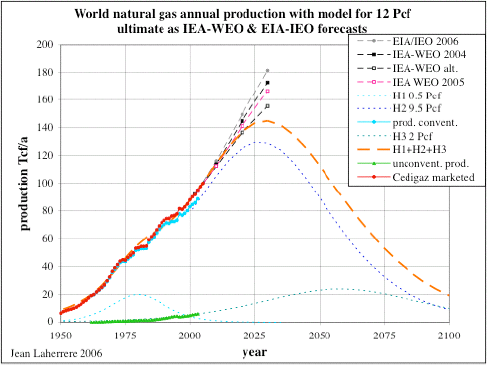
Figure 4 - Natural Gas Forecast (including Unconventional). Source: Jean Laherrère [pdf!].
Coal
Coal has been regarded as an infinite resource on a generation time scale, but recent assessments imply otherwise. The following graph shows three independent forecasts, by Jean Laherrère, the Energy Watch Group and David Rutledge, all peaking before mid-century. Of these the one made by the Energy Watch Group was chosen, for being at the midst of the three and for the thoroughness involved in its production. This scenario presents a plateau roughly from 2020 to 2040.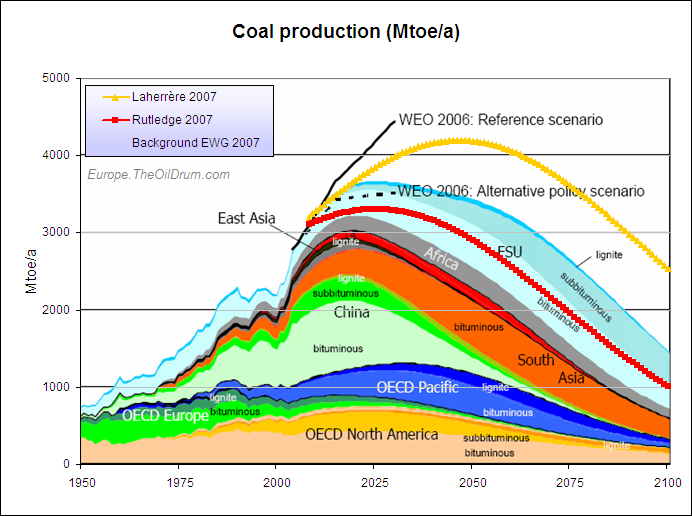
Figure 5 - Conventional Coal Forecasts. Sources: Jean Laherrère [pdf!], Energy Watch Group and David Rutledge. Click for large version.
Fossil Fuel Olduvai
When added together these three forecasts present an overall Conventional Fossil Fuels peak by 2018, forming a single cycle which by itself is a notable result. If for instance a higher Coal estimate is used, the peak hardly moves and the only visible effect is a slowdown of the decline.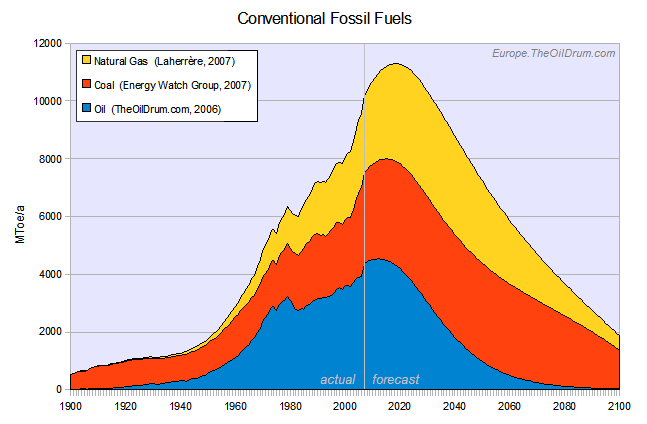
Figure 6 - Together the Conventional Fossil Fuels are set to peak before 2020 describing a single cycle.
Sources: Jean Laherrère [pdf!] for Natural Gas, Energy Watch Group for Coal and The Oil Drum for Oil. Click for large version.
A population model was developed using United Nations data, to which a single logistic cycle was adjusted. World Population tops 7 billion just after 2010, reaches 8 billion before 2030, 9 billion by 2050 and stabilizes after that to end up in 9.8 billion by the end of the century.
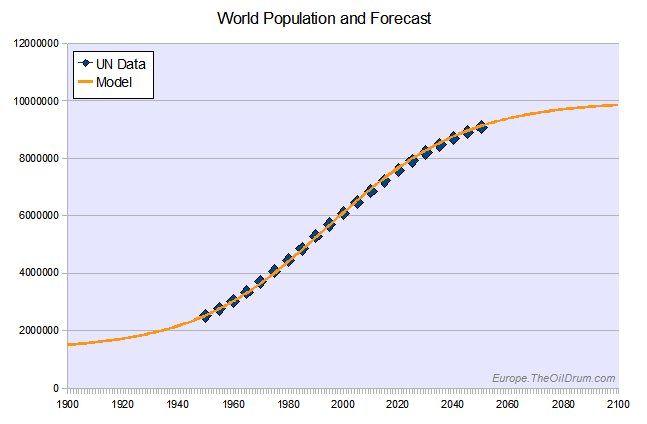
Figure 7 - Population growth model using a single logistic cycle.
Base data source: UN. Click for large version.
The outcome of these models is a Fossil Fuel per capita peak by 2012 in tandem with Peak Oil, although it is maintained above 10 barrels of oil equivalent from now up to 2020. By 2050 that number is below 6 barrels of oil equivalent per capita declining to just above 1 by the end of the century. Led by the Conventional Fossil Fuels, the Olduvai Pulse is interpreted to be much longer than anticipated by Duncan, extending its life for 160 years, from 1910 to 2070.

Figure 8 - Forecast for Conventional Fossil Fuels per Capita.
Sources: UN for Population model, Jean Laherrère [pdf!] for Natural Gas, Energy Watch Group for Coal and The Oil Drum for Oil. Click for large version.
The total useful energy drawn from Conventional Fossil Fuels equates today to more than 300 Twh every day, or the equivalent to 4250 Nuclear power plants working non-stop.
The Scenarios
Henceforth this article tries to assess what actions are required for the current standards of living to be sustained throughout the XXI century. Using again the United Nations population forecast the build up of alternative energy infrastructure is determined in order to compensate for the decline of Conventional Fossil Fuels.Four different scenarios are presented: two in which several alternative energy sources are used to cover the gap left by the Fossil Fuels. And two others where world energy use undergoes a significant efficiency improvement enabling living standards to be maintained on a much lower per capita energy consumption. A fifth scenario, where world population declines significantly is not presented here.
The alternative energy sources considered are the following:
The basic infrastructure unit used corresponds to a 1 Gw plant operating at full capacity.
The basic infrastructure unit used corresponds to a 600 Mw plant operating at full capacity.
The infrastructure units correspond to 3 Mw turbines operating at 30% load for Onshore Wind and to 5 Mw turbines at 40% load for Offshore.
The basic infrastructure unit reflects the average insulation at 40º latitude per Km2 captured with an efficiency of 15%.
These alternative energy sources were compared to the Fossil Fuels on the grounds of the electricity they produce. To generate useful energy, Fossil Fuels generally undergo a process in which they are transformed into heat that is then captured as motion, electricity, etc. With some of the alternative energy sources a similar process takes place (e.g. a Nuclear reactor that heats water into steam that turns a turbine generating electricity).
Figure 9 - Simple schematics of a Carnot heat engine.
Primary Energy refers to Qin, Useful Energy to work done (W). The engine's efficiency is given by W/Qin.
Click to know more.
Given that for most of the alternatives the nameplate generation capacity refers to electricity output, the numbers shown henceforth refer to this stage of energy generation. For the primary energy to heat transformation an efficiency of one third was used. This is a postulated round number that seems representative enough; a combined cycle Natural Gas power plant probably achieves a higher efficiency, while for a Daimler internal combustion engine it will likely be lower. As an example, using this efficiency number, a 1 Gw Nuclear power plant operating during an hour replaces 3 Gwh of primary energy from the Fossil Fuels (approximately 1800 boe).
Before moving on two important implicit assumptions of these scenarios should be made explicit:
- Net Energy – it is assumed that the overall Energy Return on Investment of these alternatives is exactly the same of the overall Conventional Fossil Fuels. That is hardly the case, but the difficulty in assessing Net Energy accurately impedes a sound analysis on this ground. Especially in the case of Coal, that likely has a return on investment much higher that the other sources, this issue could be determinant. Future work will have to address this problem.
- Energy Vectors – it is assumed that all energy vectors are substituted by electricity (the only exception being passive solar use: cooking, water heating, etc). The reasons why will be explained in future work, but it implies the build up of additional infrastructure that is not present in the numbers shown below.
The following curves will show the number of new plants or equipments needed each year to cover the lag left by the fossil fuel decline.
Scenario I – A single energy source.
In this first scenario it is shown how each of these energy sources can tackle the energy gap left by declining FF on its own. In this case, new infrastructure must be deployed starting in 2018 rising fast to a peak deployment rate before 2040 and then slowly easing down. At peak, more than 4 500 Thw must be generated from new infrastructure. By the end of the century this sums up to a 140 000 Twh of energy generated per year from alternative energy sources.
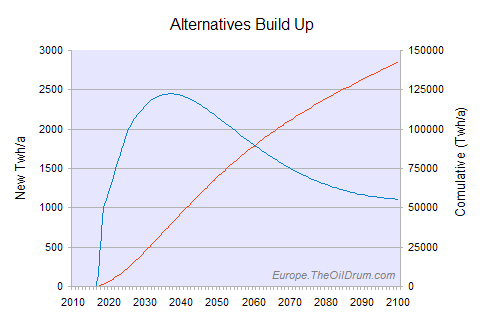
| Scenario I | New infrastructure per year at peak | Total infrastructure in 2100 |
| Nuclear | 90 | 5 400 |
| Coal | 155 | 9 000 |
| Offshore Wind | 46 000 | 2 700 000 |
| Onshore Wind | 100 000 | 6 000 000 |
| Solar (Km2) | 3 000 | 190 000 |
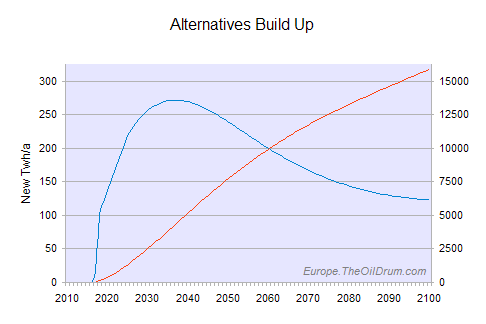
Scenario II – Three simultaneous energy sources.
The second scenario considers the case where three of these alternative energy sources are deployed simultaneously to fill the energy gap. This results in the previous numbers being divided by three, with the following curves assuming that two other alternative energy sources are being stepped up simultaneously. Peak is now at 1 500 Twh generated per year from each additional source, reaching more than 45 000 Twh generated per source per year by the end of the century.
| Scenario II | New infrastructure per year at peak | Total infrastructure in 2100 |
| Nuclear | 30 | 1 800 |
| Coal | 50 | 3 000 |
| Offshore Wind | 15 000 | 900 000 |
| Onshore Wind | 35 000 | 2 000 000 |
| Solar (Km2) | 1 000 | 60 000 |
The Efficiency Wedge
For the remaining scenarios a world wide improvement in energy efficiency is factored in. Presently the world's consumption of fossil fuels is close to 70 Gboe (just over 10 boe/cap/a), while the global GDP is just under 70 T$. This results in less than 1 000 dollars generated for each barrel of oil equivalent consumed. The following graph shows the relation between fossil fuel use and GDP per capita in several countries, both developed and developing nations, excluding the Middle East oil producers.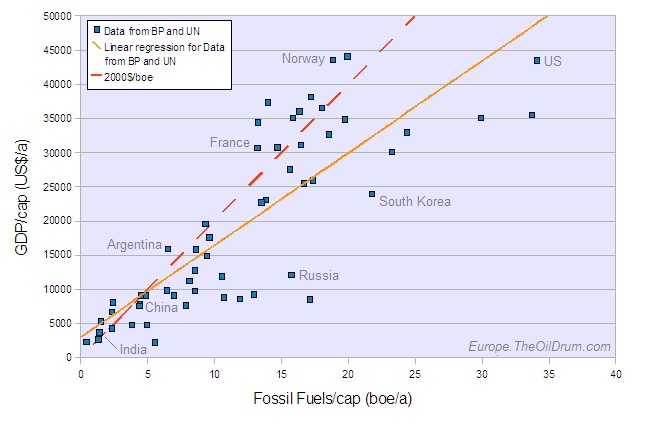
Figure 12 - GDP generated per barrel of oil equivalent consumed of Fossil Fuels. GDP from Wikipedia, Energy from BP.
World average GDP per capita was calculated with data from more than 180 countries resulting in 10 000 dollars per year. Using the trend in Figure 12 it becomes apparent that such average wealth standards should be sustained with just 5 barrels of oil equivalent per capita per year. This results in an efficiency of 2 000 dollars produced per barrel of oil equivalent, a number that is used as the target for global energy use efficiency.
The trend also shows that higher income countries are those that tend to have lower energy efficiency. So being, a global increase in energy efficiency use would be achieved mostly at the expense of developed nations. Some highly populated developing nations with lower energy use efficiency would likely also need some improvements.
No assumptions are made concerning wealth distribution, it is just set that, on average, each barrel of oil equivalent generates 2 000 dollars of GDP worldwide. Such is already the case in several countries, both developed and developing nations, as seen in the following table:
| Country | GDP(US$)/boe(FF) |
| Colombia | 3 348 |
| Peru | 2 897 |
| India | 2 698 |
| Switzerland | 2 673 |
| Sweden | 2 599 |
| Argentina | 2 451 |
| France | 2 326 |
| Norway | 2 312 |
| Republic of Ireland | 2 210 |
| United Kingdom | 2 207 |
| Austria | 2 204 |
| Hungary | 2 097 |
| Italy | 2 089 |
| Pakistan | 2 051 |
| Denmark | 2 028 |
| Brasil | 2 018 |
| Germany | 1 887 |
| China | 1 730 |
| USA | 1 274 |
| Canada | 1 052 |
| Saudi Arabia | 462 |
Reflecting this relation a model was thus developed in which the fraction of today's annual energy (derived from the fossil fuels) use per capita slowly declines throughout the XXI century to 5 barrels of oil equivalent (approximately 2.8 Mwh of useful energy).
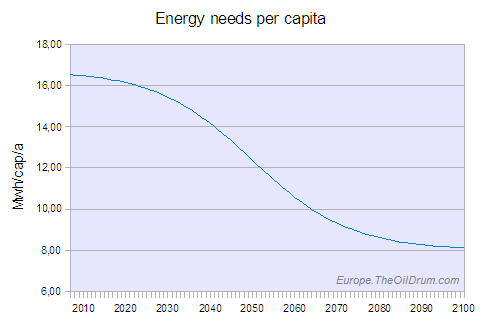
Figure 13 - The Efficiency Wedge model: primary energy needs per capita fall to 5 boe/a (8.5 Mwh/a) through the XXI century.
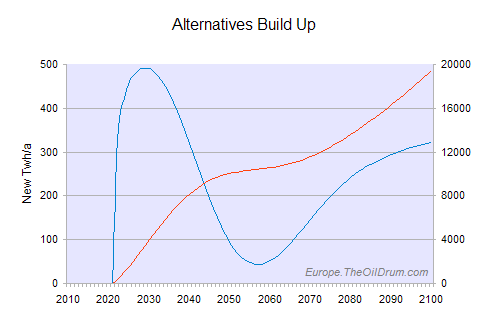
In light of this model the previous scenarios are revisited. The build up curves are markedly different, showing two distinct phases of growth. At first the alternative energy sources must grow rapidly to fill the gap, but as the efficiency wedge factors in, the build up almost stalls by mid century. Then, as the conventional fossil fuels reach their final days the build up has to slowly increase again.
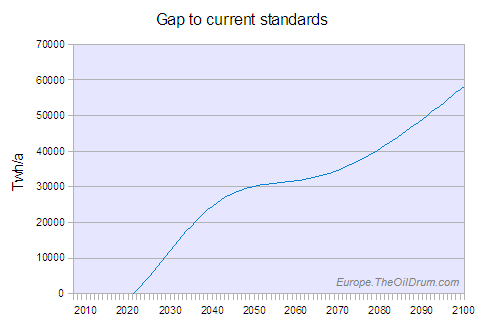
Figure 14 - With the Efficiency Wedge the build up curves start latter and exhibit two distinct phases of growth.
Scenario III – A single energy source with efficiency wedge.
Scenario III illustrates the amount of new infrastructure required for each of the alternatives assuming that the energy efficiency wedge reduces our consumption by half towards the end of the XXI century . Infrastructure build up now peaks just under 1 500 Twh additionally generated per year, summing 60 000 Twh of energy generated per year by 2100.
| Scenario III | New infrastructure per year at peak | Total infrastructure in 2100 |
| Nuclear | 55 | 2 200 |
| Coal | 90 | 3 700 |
| Offshore Wind | 28 000 | 1 100 000 |
| Onshore Wind | 62 000 | 2 500 000 |
| Solar (Km2) | 2 000 | 75 000 |
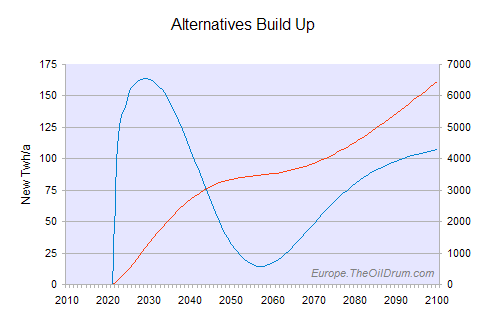
Scenario IV – Three simultaneous energy sources with efficiency wedge.
The last scenario looks at three alternatives simultaneously tackling the energy gap with the efficiency wedge reducing consumption. Infrastructure build up now peaks with 500 Twh additionally generated per year, summing 20 000 Twh generated per year by century's end.
| Scenario IV | New infrastructure per year at peak | Total infrastructure in 2100 |
| Nuclear | 19 | 740 |
| Coal | 30 | 1 200 |
| Offshore Wind | 9 300 | 370 000 |
| Onshore Wind | 21 000 | 820 000 |
| Solar (Km2) | 640 | 25 000 |
Conclusion
According to our analysis, conventional fossil fuels are set to peak in a decade or so and following that, decline will open an ever widening gap from today's per capita energy use. Based on finite FF resources, energy per capita is indeed headed towards a cliff, and this may lead Mankind back to the Olduvai Gorge if action is not taken to address this problem. Many of those who have studied this problem in the past have concluded that the journey back to Olduvai is unavoidable.The analysis presented here suggests that it is within the capacity of human endeavor to build new energy gathering infrastructure to substitute for the decline in conventional fossil fuels. By combining energy efficiency measures with the simultaneous expansion of solar, wind and nuclear energy Mankind may secure a civilised existence for the XXI century. A tremendous opportunity exists to build a more sustainable energy future and building this future will provide vast opportunity for economic growth and prosperity.
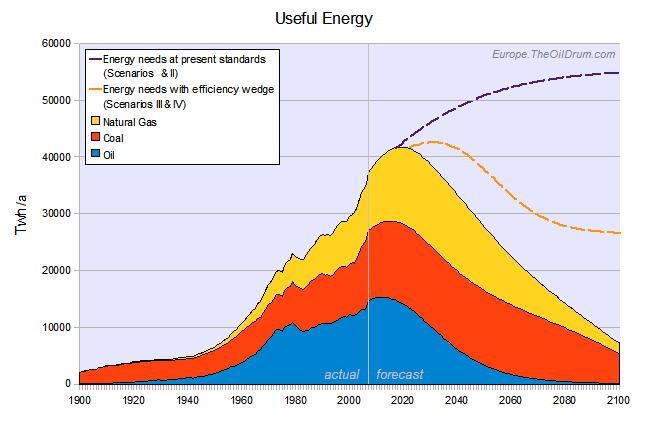
Figure 17 - Useful Energy from the Fossil Fuels.
The solid areas reflect the useful energy got from the Fossil Fuels according to the data and models used. The dashed lines reflect the total energy needed to maintain current standards of energy use per capita, with the orange line also factoring in the efficiency wedge model.
Click for large version.
The next two to three decades are crucial, where the fastest build of alternative infrastructure is needed, and when the efficiency wedge will have the slowest effect. But the numbers contemplated here are not insurmountable, and should be tackled with the right commitment and timely action.
To all the humans facing the Road to the Olduvai Gorge, Good Luck!
Luís de Sousa
Euan Mearns
TheOilDrum:Europe
Annex
Following is a spreadsheet with the data and calculations involved in the making of this article:Open Document version:
http://www.theoildrum.com/files/Olduvai2008.ods [240Kb]
Microsoft version:
http://www.theoildrum.com/files/Olduvai2008.xls [660Kb]
Personnel
Editors
Contributors
Peak Oil Primers
Archives
- November 2010 (3)
- October 2010 (6)
- September 2010 (4)
- August 2010 (7)
- July 2010 (6)
- June 2010 (7)
- May 2010 (2)
- April 2010 (8)
- March 2010 (4)
- February 2010 (6)
- January 2010 (3)
- December 2009 (5)
- November 2009 (8)
- October 2009 (12)
- September 2009 (6)
- August 2009 (5)
- July 2009 (11)
- June 2009 (8)
- May 2009 (16)
- April 2009 (10)
- March 2009 (7)
- February 2009 (10)
- January 2009 (15)
- December 2008 (9)
- November 2008 (9)
- October 2008 (9)
- September 2008 (13)
- August 2008 (10)
- July 2008 (14)
- June 2008 (23)
- May 2008 (16)
- April 2008 (12)
- March 2008 (16)
- February 2008 (9)
- January 2008 (13)
- December 2007 (13)
- November 2007 (16)
- October 2007 (22)
- September 2007 (8)
- August 2007 (9)
- July 2007 (16)
- June 2007 (8)
- May 2007 (7)
- April 2007 (7)
- March 2007 (10)
- February 2007 (10)
- January 2007 (12)
- December 2006 (9)
- November 2006 (15)
- October 2006 (4)
- September 2006 (5)
- August 2006 (5)
- July 2006 (9)
- June 2006 (5)
- May 2006 (10)
- April 2006 (9)
- March 2006 (13)
Vital Trivia
License

This work is licensed under a Creative Commons Attribution-Share Alike 3.0 United States License.
Luis - thank you for including me as co-author on this piece of work. I think I need to clarify for all that you have done 99% of this work that has taken many months to produce.
Many, many months ago now I did some data analysis and noticed that the per capita energy consumption from FF was rising. I also observed that gas and coal production may continue to rise for a number of years yet and on this basis concluded that Duncan's Olduvai theory failed the empirical test. Nate sent this to Duncan who was furious. I submitted the post for publication on TOD - but failing to sleep rose at about 3 am and withdrew the work. A year or so later we have this much more refined product from Luis. Richard Duncan's seminal work on this topic still stands - all we have done here is refine the time scale in light of new data and the benefit of time passing. Without VERY urgent action on building alternative energy sources (that exist - they just need to be built) and on energy efficiency Mankind will stroll back down the path towards Olduvai.
This work is an attempt to quantify what needs to be done to avoid this path. Whether or not it is within our capacity to achieve this both physically and behaviorally is open to debate. If we do not rise to the challenge the future is very bleak 2012 peak oil, 2018 peak FF energy.
Getting politicians, policy makers, leading academics and decision makers to grasp these issues has to be a major priority. The fact that this work is being conducted in the twilight world of The Oil Drum is really astounding. Although I am really encouraged by the number of senior academics who contribute to the work presented here. This twilight world will one day very soon be the mainstream.
I would like everyone to note the absolute importance that energy efficiency plays in the path away from Olduvai. Without that we are screwed - TOTALLY. Every action and policy we implement from now on must be based on the premise of energy efficiency - both consumption and production.
Hear hear! Nice work fellas. And Euan, when you say energy efficiency on the consumption side, I assume that means changing the conspicuous consumption paradigm, at least gradually, for if we get really efficient at producing profligate energy wasting toys, what have we done but buy a few extra years? We need it all - more oil and gas exploration, full investment into the highest energy gain/lowest environmental externality renewable sources (meaning there will be sources that should and shouldn't be accepted), smart building and efficiency improvements, and a gradual change away from consipicuous consumption as our cultural carrot. It can be done - but we can't sit on our arses until Olduvai, or something like it, wakes us up.
I know the 'twilight zone' of theoildrum is making a difference, yet am discouraged by how vociferously we debunked corn ethanol for the last 18 months as a waste of time and resources given what we are facing, and still the government went pretty much full speed ahead with ethanol mandates as the major thrust of becoming energy independent. Perhaps in this situation, the US will have to take the lead from Europe, who, though in similar straights, seems to be taking energy descent more seriously.
keep up the good work lads.
Yes, of course and no of course not. I think the efficiency of consumption maybe needs to be broken down into parts. Better insulation in homes, eating more vegetables, more efficient cars are all good things - consumption goes on whilst saving a lot of energy.
The next step would be persuading more people to share a home = less home building; to eat less food and to bicycle instead of drive. All good things as well involving less consumption.
Delivering the former efficiency gains I believe will be much easier than the latter consume less paradigm shift in attitudes. The problem is that hardly any of this is happening right now.
Luis' data on GDP per BOE I think is fascinating and quantifies what we already know. The USA along with Canada and surprisingly Germany and China need to get their acts together. There are likely two main messages in these data:
1. Manufacturing is an energy intensive way of generating GDP - so less manufacturing is good
2. The USA, Canada and Saudi Arabia simply piss away vast amounts of energy - and this will have to stop
I'd strongly disagree with the blanket "less manufacturing is good".
Pehaps we should manufacture better quality more durable goods, what would stand for less manufacture, but not less wealth. Or pehaps we should manufacture more solar/wind/nuclear capcity to fill the gap, what would stand for more manufacturing. Or probably both.
Manufacturing may be more energy intensive than other wealth creating means, but we've developed no other way of generating the amount of wealth we have today.
"we've developed no other way of generating the amount of wealth we have today."
As a programmer I find fault with this statement.
As a programmer I find fault with the idea that you find fault with that statement. A simple logical path will lead you to manufacturing no matter what industry you "program" for. Let's start with the manufactured machinery you work upon shall we? Then try and find any service industry that isn't intimately linked to some form of manufacturing. Real-estate would be close to the only one, and even it requires the wealth generated through manufacturing to raise prices (and dare I say it population), as well as the results of manufacturing to produce houses and farm machinery etc etc to make the land worth buying in the first place.
Without the mass-production, specialisation-facilitating society we live in there would be no need for computers, much less programmers.
""we've developed no other way of generating the amount of wealth we have today. As a programmer I find fault with this statement." As a programmer I find fault with the idea that you find fault with that statement. A simple logical path will lead you to manufacturing no matter what industry you "program" for. "
He said manufacturing isn't the only source of wealth, you said that manufacturing is an essential base. Both are true.
He's saying that programming, for instance, isn't manufacturing, yet it is a valuable, productive thing to do. You'd agree, right?
I call the idea that manufacturing (or farming, etc) is the most important thing, and the only source of value, the "garbageman fallacy". In NYC, sanitation workers used to say that they were the most important workers of all, because the city couldn't run without them. We can see the flaw in that, I hope...
Programming cannot be done (for any useful purpose) by just thinking about it. It needs computers and power. Power needs power plants and transmission lines. Ultimately, increasing wealth (economic growth) requires more resources for making stuff or doing stuff.
Hey us programmers need to eat or at least drink beer :)
Last I looked although I work at home don't drive much etc I still use a lot of resources.
Its just that programmers and support could be made pretty green with some work.
Also if programming itself would start advancing again then the number of programmers needed at any one given time could be fairly static or decline quite a bit overtime.
"Last I looked although I work at home don't drive much etc I still use a lot of resources."
That's an interesting question - how does one factor in people's consumption into their work?
My point is that the work itself doesn't require significant energy or materials - 10 cents of electricity per day, and $2/day for computer capital costs (a $1,500 laptop every 3 years).
Of course it depends on the life style but providing fore employees is a fairly static cost regardless of what they do. A large amount of middle class Americans are engaged in paper pushing because others are engaged in paper pushing.
I can see it in programming you have the huge convoluted mess that at its center is caused by a simple problem say one piece of information was not recorded or shared. Or the company has some stupid rule that wastes incredible amounts of time.
From what I've seen most productivity games are a myth. Things are outsourced and look better just because you have a simpler accounting schema. Real productivity is in the toilet. And trust me the overseas worker working for slave wages is not the most motivated person on the planet. All this is hidden in bad business loans in china and pumping debt in the US.
As with anything the shorter the chain of responsibility and the more a person is correctly rewarded for success or failure the better the business. Incorrect accounting practices have managed to hide this basic truth of business.
This rolls right back into energy/resource accounting to determine real profitability and gdp. True growth is increased ownership and no debt.
This give people the freedom to explore innovative business ventures.
Speculation on borrowed money/energy/resources is the root of collapse from the personal level all the way up.
"Programming cannot be done (for any useful purpose) by just thinking about it. It needs computers and power. "
Yes, but it needs very, very little compared to manufacturing. Think smelting, metal stamping, transportation of parts, assembly lines, transportation of finished products, etc. vs.....a laptop, using as little as 50 watts.
Without all that "smelting, metal stamping, transportation of parts, assembly lines, transportation of finished products, etc." there is no reason to have a computer. Computers are not an end in themeselves. They make it easier for people to do the "real" work of making things. Manufactured things are what drives any economy. Services, such as programming, make it easier to make those things and get them to where people can use them, but they aren't really required in the process.
Programming is an example of "services". Services aren't just support for manufacturing, they're a good thing in themselves.
Medical care, art & literature, entertainment, communication.
Arguably, manufacturing is a means to the end of enjoying services. They're certainly not a meaningless support function for manufacturing.
I have been having this discussion with sofistek for months. He is trying to prove that growth per se is bad. I have argued that it depends on the growth. That intellectual capital is different. He seems to deny that services are a real part of the economy even though they are becoming more and more dominant. This whole growth is bad topic is important but not very condusive to rational discussion. It is such an article of faith with that faction.
This isn't logical. It's important, but not useful? Logical impossibility, no? Growth is the very core of the problem you are discussing. If there were no growth, there would essentially be no problem. You'd have a great deal more time to find solutions. Hell, to go back further, neither you nor I would exist. No, we must discuss growth in order to find solutions that are sustainable. By definition, a solution that is sustainable within limits is not sustainable.
If you are going to redesign civilization as we know it, you'd darned sure better pay attention to the future.
Cheers
Sterling, I do not deny that services are a real part of the economy. I don't think you were saying that, anyway, so please don't misrepresent my position or the discussion we had. You were trying to say that parts of the economy that were represented by intellectual capital can grow without requiring more resources. I was pointing out that there is no real value in intellectual capital unless it is applied in some way. That application uses resources and so even that part of the economy would require more resources, if it was to grow in any meaningful way. I was also saying that parts of the economy don't represent the whole economy so, even if you could find part of the economy that can grow without using more resources, it would not the the same as sustainable economic growth overall.
You now try to portray services as the saviour that can allow the economy to grow indefinitely. What services are you talking about? Which ones use no energy or resources in their set up or delivery?
Why is it so hard to let go of economic growth? Growth in the use of resources cannot be sustained. It is not really hard to understand but it sure is hard to accept.
Because your formulation is too simplistic to be useful. Because you lump all kinds of economic growth together, kinds that are physical resource intensive and kinds that are not, you are targeting the wrong issue.
One can easily imagine a situation where you have strong economic growth but declining resource utilization, which is probably what would be best for the world. Let say I write some software that allows people to work at home two days a week and let's say people love it and are willing to pay more for it than they save in gas, etc. You rule that out it because it increases the economic. It is economic growth.
As long as we have people in the world, they have to do something. If the value of what they do increases in value, you have economic growth. Do you just want people to do nothing? They cannot think, write music and imagine?
Sustainablity is another too simplistic concept but I have to go out now. I hope to get back to that later.
Too simplistic? What matters to today's societies is economic growth as a whole. What does it matter that some parts of the economy are less resource intensive than others, if the other parts of the economy are needed for our survival and well-being, or at least perceived as being so? If we eliminate all parts of the economy except those where thought alone is necessary, do you think people would be happy with that?
I don't rule out efficiency gains but you seem to think that if we can be realise economic growth for some short period without more resource use, that means that economic growth can continue indefinitely without using more resources. If we can improve efficiency, that's great, but what is the long term sustainability plan? Without that, we would just be delaying an inevitable collapse.
However, even if you can imagine a fabulous future where no-one uses any more resources than they do now, and population is stable, do you think that would be a society that is remotely like what we have now?
Sustainability is certainly a simple concept but few people seem to realise what it means. Try reading Richard Heinberg's Five Axioms of Sustainability. But there is nothing simplistic about it; if a society is not sustainable, then it will end. Why is that so hard to understand?
Yes, but it matters if it would end before or after the earth is consumed by the sun.
The only level of consumption of a limited resource that is completely sustainable is 0. At current rates of consumption, it is not clear if fission fuel would run out before the Earth becomes unlivable for reasons that have nothing to do with people. So is that sustainable by any reasonable definition of the word? And if we increase the use of nuclear power and I am wrong and Uranium runs out in 5,000 to 10,000 years is that a problem if before that happens we harness fusion?
There is nothing magic about the level of how we currently value everything that people do (the world GDP). There is no reason to think that the current level of consumption of limited resource is OK and that a little more is impossible. It might be that the only way the world can survive is that we reduce our consumption of limited physical resources and that the only way we can do this is to increase the production of intellectual capital in figuring out how to do it. In other words, it might be that we count the value of everything that people do as rising (ie economic growth) but we reduce the things that impact the world in ways that threaten our survival.
Your idea that economic growth of any kind is bad puts you in the position of insisting that someone write a really shitty song instead of a really good one because the really good one would have too much economic value and therefore increase the economic value of everything too much (ie economic growth). Your fixation that the market value of everything that people do has to stay the same undermines the legitimate case that you are trying to make. We should limit the consumption of limited resources, including environmental quality, wild lands and other such intangibles. But economic growth is not a useful measure of how well or poorly we are treating the earth because it mixes high impact activities with low impact ones and people have to do something.
Of course it's not clear, but the reverse is also not clear. Unless one has certain beliefs.
That's a couple of "if"s in there. Which is part of my point.
Of course there are reasons. A good reason would be if the current level can be sustained for, let's say, several centuries without it causing problems, whilst a little more might not be sustained for a century. If we just assume that all of the resources we now consider vital are abundant enough and accessible enough to not worry about it for now, then that could turn out to be a fatal assumption.
That sounds good. I can't see how that could happen without our society becoming very different from what we know today. Do you know if anyone has done any work on how this might play out?
You're caught in the economic growth paradigm, with that analogy. Economic growth is bad because it uses increasing resources and, thus, is unsustainable. If we level out our use, as you suggest earlier, that would be a good starting point and it wouldn't be economic growth.
Again, you are using the paradigm that we currently have. Why must everything have a "market value"? What has to, at least, stay the same is our level of resource consumption. Do you have any comments on the axioms of sustainability that I linked to earlier?
Like I said, there is nothing magic about the current rate of economic growth where the outlook would suddenly change, like in your example, if we increased it by say .1% per year.
So I am in favor of our society becoming different than it is today. Less resouce consumptive. More intellectual capital.
You are the one who is obsessed with market value. The way you measure economic growth is to total up the market value of everything that people do in a year and compare it to the market value of the prior year. If it is greater, then you have “economic growth”. The reason that market value comes into play is that your measure is “economic” instead of “physical” or maybe “destructive”. That is my point.
OK then make that argument. Do not say economic growth has to stay the same. Say resource consumption has to say the same. Or limited resource consumption has to stay the same. I will debate that one with you too but at least there you are starting from a more defensible position.
I have never said that. Nor am I obsessed with market value. What I'd like is to achieve indefinite sustainability.
You appear to be claiming that economic growth (which people appear to need in order to have aspirations) can continue by only growing intellectual capital. I don't believe it, but that would be great because that increasing intellectual capital would never result in anything tangible.
Resource consumption must not exceed the renewal capacity of those resources. This is not the same as saying resource consumption must stay the same, though we will need to get to that point, at a lower rate of consumption for at least some resources. The five axioms described by Heinberg gives more details. That would be a good place to start from.
OK. I am with you for that with indefinately meaning a long time but not forever. I think we can achieve that by switching to a fission, wind and solar infrastructure and have contining economic growth as the economy shifts more to intellectual goods like arts, software and services. There are at least millions of years of fission fuel where the consumption rate is twenty times what it is now and fission supplies 60% of all energy. Well before that the world will almost certainly switch to fusion power, which would be sustainable at least through the time the Earth is consumed by the Sun.
For other limited resources we may have to have rising consumption until we can stabilize the world population since we know that development in the only thing that reliably stops population growth. At that point we will have to reduce consumption of scarce resources to maintain long term viability. But the world economy will continue to grow through changes to low physical resource consumption activities as noted above.
Sterling
Ha, ha, ha ,ha, cough, splutter..........
Verbal sewerage that's all you write!
You are one mentally deluded Richard Cranium.
I think Engineer-Poet would be the only person who would fall for your garbage, why don't you look him up, you can give each other some blog fellatio.
Thanks for the reasoned critique.
Well, there are some whose research shows uranium reserves may only sustain current fission for a few decades. Other fissionable fuel may be available for longer but, at least to some degree, it is wishful thinking that it will enable nuclear generation for centuries, never mind millions of years. That may turn out to be correct but it's a gamble.
Do you honestly think that the world can shift most of its economy to those things that use very little resources? Again, that would be wishful thinking, in my book. The only one of arts, software and services that uses few resources is arts (since anything to hand can be made into art). Software is not an end in itself and there are all sorts of services, with the meaningful ones either being resource hungry themselves (e.g. building services or freight services) or leading to the manufacture of resource-using goods (like houses). Manufacturing and agricultural industries will continue to be very large, especially as we are heading for billions more people.
Your hope that the consumption other limited resources can continue to rise until they don't need to is, again, wishful thinking. It seems that you hope that business as usual (more or less) can continue until nature takes its course, population stabilises and business no longer see profits as a reason to do business.
That takes a lot of believing.
You seem to be arguing something thats entirely academic. The end of sustainability happens well after we've consumed the entire solar system.
Not exactly something thats topical today.
No, we are already unsustainable. That will become obvious not when we have consumed the entire solar system (which is an impossibility) but as soon as the supply of some vital resource can no longer meet the demand. There must be many resources that are vital to our societies, so the chances are quite good that scarcity will hit before too long.
The problem now is that growth itself is a goal. Economic growth for the sake of economic growth is a problem. Economic growth borne of need/survival is going to follow natural cycles. Slowing things down to a non-growth oriented paradigm will reduce the rate of use of resources. This should provide more time for development of technologies that aid this process.
Cheers
Only if the way you reduce economic growth slows down resource consumption. Since economic growth includes both high consumptive activities and low consumptive ones, it matters how you slow down growth. If you killed off all the low consumptive activities you could reduce overall economic growth while still increasing the use of limited physical resources.
People have to do something (unless you want to kill them all off). The economic level is just the market value of everything they do. It is possible to have an increasing market value of all that we do (economic growth) while at the same time that we reduce resource consumption. People just need to do more smart, creative, low resource consumptive things and less of the opposite.
Precisely. Of course certain parts of the economy need to grow. We need growth in energy efficient housing, renewable energy, walkable/ bikeable urban spaces, public transportation, food production systems which preserve topsoil and recycle nutrients, etc. In purely physical terms the growth of this important, sustainable infrastructure could proceed much faster if we shrunk those parts of the economy which are wasteful and necessary (e.g. SUVs, jet skis, plasma screen televisions, etc). We could also free up production resources by putting emphasis on manufacturing long-lived repairable products and eliminating planned obsolescence. We need an economic system which can grow those parts of the economy which need to be grown, shrink those parts which need to shrunk, and maintain with maximum efficiency (i.e. without concern for sales volumes) those parts of the economy which only need maintenance. Instead we have a system of production in which every sector of the economy is striving to grow as fast a possible without any concern for long term consequences.
If it needs resources, then it needs resources. It's pointless wishing that resource use away or saying that it's tiny, compared with some other part of the economy. In any case, programming was just an example and it doesn't happen in isolation, it is done for a purpose and that other purpose may use more resources.
We just can't do stuff without using resources. The more stuff we do, and the more stuff we use, the more resources we use. The key is to figure out how to use resources sustainably and that can't be done with growth.
"If it needs resources, then it needs resources. It's pointless wishing that resource use away or saying that it's tiny, compared with some other part of the economy. "
Umm, no. If something takes very little resources, that's important. If a programmer/artist/writer/entertainer/medical researcher/doctor/poet/therapist/engineer/lawyer can do his/her work with only a laptop that lasts pretty much as long as you want it to, and can be powered by a $200 solar panel, that sounds pretty sustainable to me.
No it's not, because it is within the context of an unsustainable society. Programmers, medical researchers, doctors, engineers and lawyers don't do their work for no end. Artists, writers, poets and engineers do their work to be enjoyed by others, who can afford to enjoy them because of the rest of the economy. And all aspects of our society need to be taken as a whole. Even the aspects you mention add to resource use. Maybe if all parts of the economy could be as frugal in resource use, then our problems would be less. But that is wishful thinking and there is no reason to suppose that any pursuit, just because it is a low resource hog, can continue unchanged in a society that is suffering from being unsustainable as a whole.
There is a large tendency, even among the posters here, to treat aspects of the society in which they live as completely separate. Even the energy issue isn't the sum total of the problems we've accumulated by living unsustainably.
Oh come on you guys. These kind of dramatic behavior changes aren't going to happen, no way. We didn't work so hard for our creature comforts just to give them all up voluntarily. If you think otherwise you haven't studied the human animal enough.
Even I am not going to share my home with someone or bicycle in the winter if I don't have to. I'll deforest the entire area for fire wood before I start sharing my living space.
We're screwed. It's written in our genome. Your time line is probably too optimistic too because declining oil production will lead to all kinds of cascading failures including declining coal and gas production.
I hope you're being sarcastic.
I think that SolarDude makes an excellent point, although perhaps a bit exaggerated for effect.
Middle class people in high occasionally share their houses to make the mortgage, but usually the sharing is done with some modification; i.e., putting together a bedroom/bath suite out of two bedrooms, or renovating a basement. People with less money will take in relatives, or share with a friend.
I would expect that many of today's mansions will become multiple unit dwellings, and that more townhomes and low-rise apartments may be built. However, this will require zoning changes that will come only when people are in pretty bad shape.
I would expect growth in bicycle traffic to occur first in places that are bike-friendly (have trails and vehicle drivers who are not out to massacre bike riders), but in many places, I would expect very small, possibly electric or hybrid, that do not go much more than 50 for around-town. Of course, there are car polling and ride sharing which were common in the '70s.
I think that things will move more gradually and less drastically at least for 10-20 here in the U.S. We have a lot of fat that can be cut in the form of discretionary spending and tolerable adaptation.
I think that giving up one's own dwelling, however small, and covered personal transportation, however small, will be some of the last things to go.
will be one of the last things that most people will do
Yes, but when ppl are screwed and understand that they turn to common sense on the ground. They double up, they share, they car-pool, they trade locally, don’t pay VAT, etc. To mention some hyper contemporary yet minor examples.
They finally do, all on their own, what they were sincerely advised to do 50, 60 years ago in some vague way by scientists, activists, while the pols trumpeted endless prosperity, growth, expansion, consumer Nirvana, domination though caring and humanitarianism, new colonialism, technotopia, human exceptionalism, with a good dose of war and hate to keep the ppl on board and chugging along.
So we are screwed but it is gonna take quite a while.
Could you expand on this? Why was Duncan furious? I have often seen this argument used to "debunk" the Olduvai theory and I have often wondered what Duncan's response was.
Most people don't enjoy viewing what they might construe as a refutation of their work. I'd hope, and expect, Euan's description of it as an update with better data is accurate and would smooth things with the originator of Olduvai.
Perhaps I am being presumptuous on all counts and should let Euan speak for himself.
Great work, guys.
Cheers
PS: I'll hopefully be riffing off this on my blog sometime soon. Let me know if there is any objection.
EDIT: Riff complete.
http://aperfectstormcometh.blogspot.com/2008/02/lucy-were-hooooome.html
The original work I did was pretty incomplete and with a too short time horizon. Duncan has spent a huge amount of effort in quantifying future energy supplies and my initial analysis was admittedly unsound - but it never got published and has led on to this work.
The FF forecasting work presented here is all based on the work of others - so that part we are standing on the shoulders of giants. There is however a huge amount of work that Luis has done re-basing all systems to a common baseline and developing the population and GDP models and the various scenarios.
Duncan on the one hand I know has a pessimistic view of the future while DaveR I know believes that the expansion of new energy systems is well within our capabilities. The objective of this post was to try and quantify the scale of the problem that confronts us. At present I stand with the optimists and believe this is achievable - though ecologists among us will shiver at the thought. I am equally happy to take on board their holistic views about sustainability and build in a desire to have a lower future population on Earth - it makes the energy situation easier to handle.
The main problem we face is the intransigence of governments and corporations - and there is the distinct possibility that Mankind manages to snatch failure from the jaws of opportunity.
There was a documentary on the island nation of Tuvalu on one of the indy channels here last night.
The documentary started with the citizens of Tuvalu expressing their great concern that their island was "sinking" due to global warming. There were numerous shots illustrating the encroachment of the sea and consequent erosion of the island, and interviews describing recent floods beyond any the old-timers could remember.
Then the documentary went on to a $14 million windfall received by the residents of Tuvalu when a group of American businessmen bought the nation's ".tv" internet rights.
Of the $14 million, $1.5 million went for a seat at the UN, where a diplomat from Tuvalu tried to raise international concern about Tuvalu's global warming plight, and basically got nowhere.
The rest of the money went for roadbuilding and SUV's on the dinky island, as well as a small amount dedicated to attracting tourism.
When asked why they were building roads on a sinking island, the islanders asked what else they were supposed to do with the money? Why not make themselves more comfortable in their remaining years on the island?
I think people have very little actual free will and control over their own actions, especially when you get to large groups of people. Give them money, give them access to energy, and they will automatically pursue roads and SUVs. They can't help it.
You see it in the markets all the time. The way the pros make money in the markets is by betting against the hard-wired neuroeconomic tendencies of the masses. It's virtually impossible for the masses to overcome these tendencies, including on energy issues.
They could have build solar powered boats, so that when the time comes they could get off the island in a GW friendly way.
Or even better, they could use the islands while still above water as foundations for a raised platform like Sealand, only much larger, and with plenty of solar and wind - turn themselves into permanent energy islands. With the islands as foundations they could really build the things to be typhoon and tsunami proof. Design the things so that the upper surface is dedicated entirely to solar PV panels, solar water heaters, solar water distillation units, maybe a little CSP for some small scale industry (run a small forge so they can make a few repair parts, for example), and to gardens, orchards, livestock pasture, and recreational parks. All residences, offices, workshops, etc. are located underneath the top surface. They could really do something with this if they put their minds to it.
Oh yeah, I like that better. No sense leaving when you can adapt right where you are. Not to make light of GW and rising seas at all, but with enough money, they could do lots of very constructive things.
They had 14 million dollars, not 14 billion dollars.
I would hope it is obvious anything is possible. That really is not the problem. There are too many instances in history where the setting of the group mind to a goal has resulted in amazing achievements. OR, perhaps more often(and as sort of noted), the setting of rulers' (in all their varied and sundry forms) minds led to the marshalling of resources, by force or otherwise, to achieve things we now view as amazing. The US industrial base and WWII and the Great Wall are two good examples on opposite sides of the spectrum. (However, history is not rife with examples of collapse/decline being avoided.) I think we can safely dispense with what is not possible.
Our real concern is with what is probable. However, that discussion requires going into areas of debate that take us away from the practical discussion of solutions and into, and as far as, the murky world of conspiracy. Even when people are made aware of such things as the Gulf of Tonkin and GM vs. the electric car, they still refuse to acknowledge that there might currently be agendas that are not in line with the greater public good at work. The question then becomes, is it worth going into? If it isn't, how do we deal with the intransigence of governments and corporations which we know to be actively working against the greater public good? (E.g., Exxon/Bush and Cheney vs. Climate Change.)
Our concern then must be turned to the attitude of the average person. Faced with the enormity of Climate Change and Peak Oil in and of themselves, within a context of a civilization fraught with corruption and corporate distortion of governance, how can we reasonably expect people to not just throw up their hands and get on with the mundane or throw themselves into an orgy of living life to its hedonistic fullest?
It is this reality that causes me to espouse the local solutions over the grand global schemes of massive power grids. You ask someone to help their family or the neighbor they know vs. asking them to sacrifice for some Great Other, you are more likely to get them moving. This inertia may then provide the impetus for stitching things together into greater linkages. Of course, it is probably simple common sense to let each level of society do what they are best able to do. I.e., these two levels will almost certainly do as they are doing now: run parallel. Still, we cannot trust the gov't or the corporations to do what is in Joe Average's best interest and should assume we must do this for ourselves. Let the moneyed and the powerful build grids. Meanwhile, let us lesser folk build straw bale homes, homemade windmills and solar engines, etc.
This inependence of power will allow the Joe's to stand in opposition to or support the system that rises or continues from this point, depending on which way we go: Blackwater and martial law or a new Greatest Generation.
The posibilities are wide and, I submit, likely to be in one or the other extreme. The non-linearity of the present/coming change coupled with being in what Kenennedy would call the Acquisitive Age, the final stage before collapse, make this seem quite likely. Interestingly, while all the reviews of his book focus on the issue of balancing military and economic might with regard to the rise and fall of the US, what struck me in the book, and what I remembered, were the four cycles he describes civilizations/nations/powers going through. His description of the final stage perfectly describes where we are now. It is a time when acquisition is all. The excesses lead to ruin. The corrolary is overstretch and/or overconsumption for the wealthy and powerful nations. The problem is globalization has brought the entire world directly into the acquisitive stage. Many nations skipped directly to the final stage due to the influence of globalization. Korea is a good example, but of extreme speed in moving through the cycles, enabled by the global system.
After WWII and the Korean War, the nation was devastated. They first worked collectively towards the common goal. This is akin to the move of civilization to farming and towns/communities. They next fought for survival via miltarism and dictatorship. Next came the industrial development, leading to the ascendancy of ideas/ideals as stability was achieved, then into acquisitiveness as wealth was achieved. (It's been a very long time since reading the book, so my descriptions of cycles may be quite poor.)
The entire planet (or, perhaps better to say the developed or semi-developed parts of the world) has, to some degree or other, jumped straight to the final stage. This leads one to conclude that the next step is a return to the beginning, or collapse, for if we are in the final stage and surrounded by evidence of overstretch, overshoot and the malaise of internal rot bred by acquisitiveness, where lie the strength and resources to deal with the coming Perfect Storm?
Kennedy on the US (and this was 1988!):
http://www.time.com/time/magazine/article/0,9171,966718-3,00.html
If we accept the extrapolation "As goes the US, so goes the world," coupled with acceptance that we are in the final phase before the fall and then look at the further destabilizing effects of Climate Change and PO, it is difficult not to conclude we are in a world of hurt.
That is huge amount of inertia. I think it short-sighted to think the state can manage this. Chaos tells us discontinuities will come, bifurcations will happen and increase in frequency over time. Systems theory tells us that complexity leads to break down at some critical mass. History tells us cycles exist and that civilizations and nations rise and fall.
No, I don't expect the collective to fix this. I do think it is possible to transition very painfully to some other system, but it will happen piecemeal and largely on the backs of localized solutions that will likely have to stand in opposition to those who do not have the best interests of the Common Good in mind - or, who think the elite/wealthy/politically powerful know best and it is best to let the minions eat their cake and watch their TV sets.
I could be wrong. We may be witness to a Great Molting and Transition through Peaceful Cooperation. History suggests otherwise.
Cheers
Good solid sobering analysis. Thanks.
yes, good post, thanks.
Hi Luis, Euan,
Thanks for a terrific post. I like the time frame. One of the interesting things about your analysis is that the fossil fuels are supply side (production based for oil and gas, and reserves based for coal), while the alternatives are demand side. That makes sense. Alternatives are based on manufacturing, and not subject to exhaustion. And the historical growth rates for wind/solar, which are a factor of ten growth every ten years, are sufficient to provide the amounts that you propose for alternatives.
Dave
I doubt you are correct - there will probably be some Liebig minimum not being considered here that will be the limiting factor.
In order to grow, as well as excess energy, plants require unpolluted air, water, N,P,K, trace elements, a lack of predation etc - and, at any one time, any one of these will be 'at limit'.
There is a similar list of unpredictable requirements for econonomic growth - availability of affordable excess energy is but one important (and completely unpredictable) element and IMO doesn't tell a meaningful story in isolation.
The use of averages like 'conventional fossil fuels per capita' are somewhat misleading - as fig.12 shows, almost no country consumes the average amount! ... and almost no person in those countries consumes the world average amount.
Can you explain this? Don't alternatives require finite resources to harness and have some effect on the environment, especially if they continue to grow?
Would you really expect those growth rates to continue as the absolute quantitative increases become huge?
While the resource side was adequately covered, the analysis forgot the sink side constraints when burning fossil fuels. The global warming problem can be seen as a depletion problem. What is depleting is the CO2 absorption capacity of the atmosphere. NASA climatologist James Hansen has just moved the stabilization goal post from 450 ppm CO2 concentration down to 350 ppm, a limit we have exceeded already 20 years ago.
http://www.columbia.edu/~jeh1/RoyalCollPhyscns_Jan08.pdf
We are therefore already in overshoot mode and we need to EXTRACT CO2 from the atmosphere if our civilization wants to survive. I guess the turning point will be the disappearance of the Arctic summer sea ice in the next years (albedo flip)
http://www.ametsoc.org/atmospolicy/documents/May032006_Dr.WieslawMaslows...
That will wake us up. We have to abandon our carbon based consumerism.
Nature will not allow us to burn all the fossil fuels in the above scenarios.
The conclusion is that building up renewable energy capacities is even more urgent than ever. We need to retool car factories (which will close down after peak oil anyway) for mass production of components for energy PRODUCTIVE renewable systems, not energy CONSUMING goods.
Just take back the vehicles and use them and anything else available as scrap metal to make windmills. 800 million vehicles and lots of electronic garbage would b a big start and could pour into the factories one end and otu the other end as windmills.
"Turn your swords into ploughshares"
Fantastic article. I agree. We need to have a comprehensive plan for wind and solar energy to be built in now.
One point, it seems Europe is already weathering this crisis better than the US.
"One point, it seems Europe is already weathering this crisis better than the US."
Well sure, Iceland(geothermal, hydro), Norway(hydro), Sweden(hydro, nuclear) and France(nuclear) are doing fine. Wind-energy poster-child Germany is falling ever deeper into dependency on dirty coal-power however. Finland is struggling to build more nuclear so they can stop burning coal and pete; denmark is doing quite well with wind power, but they're dependent on Norway for load balancing.
The point is that, for the most part, Europe has been building in renewable energy solutions and efficiencies for years. Automobiles are required to operate at a higher fuel economy standard. Nuclear energy is practically renewable as they don't have the same regulatory hurdles for reprocessing waste that we have and true renewables -- wind/hydro/geothermal/solar provide a substantial portion of energy.
They are ahead of us in renewable/self sufficient energy. We remain much more tightly wedded to the fossil three: coal, oil, gas. It's hurting us and will hurt more as time goes by.
In my opinion, Germany's primary failure is taking nuclear off-line. They should replace coal with wind and use the nuke plants for load balancing. At some point, these countries are going to have to look at storage for wind energy.
Coal, gas, and oil, are only set to become more expensive. This is likely to happen even as renewables become less expensive over time.
Look for solar energy also to make headway by the end of this year with an overbuild in capacity and prices set to fall in both polysilicon and manufactured panels. New thin film solar is also starting to make its way with much lower cost solutions for utility based solar energy.
We might find ways to make cheaper solar PV panels and a lot could change. As fuel prices rise and the availability gets tighter, the more these ideas seem practical. I would like to see the distributed generation nature of PV become wide spread. It has so many benefits that a lot of the energy problems may not seem all that insurmountable any more.
I'm a huge proponent of grid-tied modularity through solar infrastructure on homes and public buildings. I think California is doing a fantastic job currently and the US would do well to follow its lead.
In all, we need more republicans like Schwarzenegger.
Actually, one other thing -- anyone notice oil's pushing $103 per barrel?
Why do you think wind and solar and all your so called “true renewables” will save the world?
Do you have an example of solar panels or windmills being made with renewable energy?
ALL the hard work is done with fossil fuels. Exploration, technical development, mining, transport, smelting, manufacturing, assembly, erection and maintenance.
That does not include food required by people, which enables the whole process eventuate and unfold.
If we had no fossil fuel, there probably would not even be hydro electricity.
The furnaces for smelting ore and making steel and alloys are built run and maintained mostly with fossil fuel, what does renewable energy have to do with that now and in the future?
Is there a plan in place that describes the process whereby renewable power generation is manufactured with other renewables, or are you still under the impression that peak oil only means peak oil and there will always be enough for everything?
What in the future, will have priority for the remaining non renewable energy?
Will it be food? Will it be mining or transport or defence or coal fired power, or emergency services or building construction or manufacturing or exploration or public works (bridges, roads, power grids) or research or maintenance or law enforcement and so and and so on.
If power from renewable sources has to be redirected to reproducing and maintaining renewable energy, there will be less for the public domain. How much less is yet to be calculated as far as I know.
Is any renewable source of energy viable for billions of humans and long term existence, or is it as I suspect, a pipe dream and a pacifier to suck on for the next two or three generations.
Of course I'm not saying that the so called renewable types of energy should not used and developed. They may buy time for a miracle of really true renewable energy generation to be discovered.
Every step in the manufacturing process that can be done by electricity can be done by renewables. I'm doubtful that there are many processes relevant to the manufacture of wind generators or PV panels that could not be powered by electricity. Even steel can be made by electric blast furnaces. It is not an insurmountable design or engineering problem to set up industrial processes for renewables manufacturing that are entirely renewable energy powered.
Your point about needing to account for the energy that goes into building and maintain the renewable energy generation infrastructure is well taken, though. There is an overhead factor that should be taken into account. We're pretty much getting into a discussion of EROI for these systems at this point. I have seen various EROI figures quoted for renewables. According to this article, the EROI for wind averages 24.6 (with a std deviation of 22.3!). Solar (PV in particular) seems to be all over the place right now, according to this study it might be in the range of 10.0-12.0. Overall, it would appear that figuring on an EROI of 10 (and thus allowing for a ten percent "overhead" to cover the costs of making and maintaining the renewables infrastructure itself) would be a reasonable assumption.
The 10 to 1 return on PV is a good example. It is said that the first 3 years of a 30 year PV lifespan go to pay off the energy used to make it. If we have the materials to make these, then it is a good investment of energy. We need that leverage to gain the most out of our fossil fuel usage. There is no denying that it takes fossil fuels to produce renewable resources now, but it is a good use for those fossil fuels.
Your links don't give any indication that renewable energy can be used to manufacture more renewable energy.
It's doable........ but is it achievable? Is it scalable?
EROEI for renewable energy are just guesses. Until a windmill is manufactured and erected from the ground up using renewable energy we won't know if it is practical.
What are we looking at.........a world of electric tractors, combines and crop dusters. Electric trucks and trains. The electric blast furnaces are going to supply the steel required for a sustainable world.
Someone would know how much steel is produced daily or yearly and by what method. Now estimate the cost and practicality of producing all the steel required in electric arc furnaces, which have not even been financed and built.
You expect that we will achieve sustainability simply because it is possible. It is possible to do many things but not practical. In the end all you have is hope.
Ah Bandits, back so soon?
In any case, let's take a look at a few major sectors of the economy that are run on electricity along with some pretty obvious potentials:
1. Automobile manufacturing -- grid based.
2. Electric arc furnaces are available and in use now: http://www.arcfurnace.com/electric_arc_furnaces.html.
3. Now take a look at this quote: "Steel making with an electric arc furnace is also economical. Every tonne of electric arc furnace steel uses about 7.4 GJ of energy compared with about 16.2 GJ for every tonne of BOS steel." Hmm. Looks like it's even more efficient than regular BOS steel.
4. Traditional BOS steel doesn't use fossil fuels at all. It uses oxygen. And the oxygen is produced by refrigeration. All easily done with ELECTRICITY. Very nice! Looks like steel survives peak oil thank you very much.
5. Well I'm sure we could have a world of electric trains, vehicles, and tractors if we needed to. That's the whole purpose of the HV, PHEV, EV build.
6. Electric machinery is widely available now so that's a no brainer.
There's more than just hope out there. There are a number of very powerful means by which to achieve an end. Solar and wind power are sustainable and they are more than just a potential. With each passing year, they will become more and more viable. You seem to think that this is some pie in the sky dream. It's not. Simply put, it's the most practical way to sustain us long-term.
Scale it all up with windmills (renewables) for me.
That was my point but as usual you %#**%$ you make up and read into my post what you feel you can argue.
While you are scaling it up how about factoring some costs for this fantastic power generation.
1300 million tons of steel was produced world wide last year. Would you like to guess how much ore was smelted in electric furnaces.
A typical steelmaking arc furnace is the source of steel for a mini-mill, which may make bars or strip product. The steelmaking arc furnace is generally charged with scrap steel, though if hot metal from a blast furnace or direct-reduced iron is available economically, these can also be used for steelmaking.
http://en.wikipedia.org/wiki/Electric_arc_furnace#Advantages_of_electric...
While you are at it Google "blast furnaces" and educate yourself instead of trying to ply me with your misleading crap.
If you want to dream about electric combines, heavy haulage and airplanes dream on, just don't try and convince me with your drivel.
You can make iron using electricity instead of coke. You electrolyse iron salts, like iron sulfide, one of the most common rocks you can get below a few hundred feet. It's what makes water taste bad in large areas of the country.
I'm not saying this is a good idea, I'm saying it is possible at no more than two or three times the coke oven produced iron price.
You can't use it directly as electroformed metal because it is iron, not steel, and it is contaminated by hydrogen. You have to run it through a steel minimill first and toss in some carbon.
Lots of stuff is available using different technology if you are willing to pay two or three times the current price.
A startling illustration of the scalability and sustainability issues being discussed in this sub thread (though applicable to nuclear rather than strict renewables) is the Olympic Dam uranium mine in Southern Australia. There is a proposal to turn it into an open-caste operation on a scale even larger than the Escondida copper mine in Chile. Turns out that the whole project is on the borderline of viability at best, despite the desperate need for uranium and a decision by BHS Billiton is expected later this year. If it goes ahead (a BIG if) the diesel fuel required to remove a 3 Km diameter x 1 Km deep layer of overburden just to reach the low-grade ore bearing strata will increase Australia's entire annual diesel consumption by over 70% for 4 full years !!! - not to mention the vast requirement for fresh water in a drought-stricken country plus the vast quantities of fossil fuel, nitric acid and other chemicals to process the ore when they finally get to it.
John Busby of Sanders Research has written extensively about it at
http://www.sandersresearch.com/index.php?option=com_content&task=view&id...
What desperate need? The market is highly depressed because weapons material dumping has taken so much of it away as has the effective moratorium on building reactors. As of result, there has been very little exploration for new resources because the mining companies have identified plenty (50 years or so) for their short to mid term business needs.
It looks like the producers are going to have to ramp up soon but there is no reason to think they will not be able to. Although there has been so little exploration we know that Uranium is quite plentiful in the crust and that there is at least one trillion tons that can be extracted at reasonably high EROI. After that, there is another couple of orders of magnitude in other fission fuels and more efficient fuel cycles.
That was not the point of my post but, since you raise the matter, I beg to differ. There are good reasons to suppose that security of uranium supply is a potential major constraint on the expansion of nuclear power (Including but not limited to its refined availability being a function of the sort of operations illustrated in the article referenced).
My understanding is that the proposed nuclear renaissance is largely posited on breeder reactors being brought on stream and becoming 'self-sustaining' fuel-wise so-to-speak, on a time frame compressed enough to avoid what amounts to a looming 'peak-uranium' issue. Yes, I know there's enough of it in the oceans to fuel more reactors than you can shake a stick at - indefinitely; but that's not the point. In similar fashion to there being a vast surplus of potential energy from sunlight, the trick is to turn minuscule concentrations of it into usable fuel. Given that to date, the track record of successful sustained breeder reactors is near non-existent, it requires quite a leap of faith start relying on them at this juncture.
BTW, I have no issues whatever with nuclear power per se and have neither a pro nor anti nuclear agenda. I just think that, given the host of uncertainties involved, together with what can only be described as the obfuscating bluster, secrecy and evasions of the nuclear industry itself, it would be the height of folly to assume that it can somehow come to the rescue of our 'non-negotiable way of life'.
It's pretty clear to me that that 'non-negotiable way of life' is on seriously borrowed time and the sooner TPTB find an honest way to come clean about it the better.
We have been debating this Uranium supply issue at TOD for years. I have not seen your UserID before so perhaps you have missed it.
As far as I can tell the case for limited Uranium supply, such as the paper by the Energy Watch Group, all come back to a Uranium mining industry study which estimates Uranium reserves that I think has been misunderstood. From what I understand, reserves are defined as identified resources that can be economically exploited with current technology in current markets. The study in question estimates reserves based on a price of $65/lb and $130/lb. So far the industry has identified reserves that would last 50 years.
First of all, I take issue with this analysis because even though in today’s depressed market they could not sell Uranium for more than that, the correct measure of the threshold price is the price at which Uranium generated electricity would be uncompetitive with alternatives in the market that is expected to emerge over the next twenty years or so. Since the price of oil has risen ten fold in the last ten years and since all fossil fuels will peak in the next twenty years, the correct threshold of viable price would be one where the price of electricity rises as much as twenty fold over the next twenty years. Since Uranium is only 1% of nuclear energy costs (25% of fuel costs where fuel costs are 4% of costs), the price of Uranium could rise 1,000 fold and still be within that viability threshold. So to give us the answer we are looking for, that study should have estimated reserves not only at $65 but also at $650, $6,500 and $65,000/lb.
The second issue is the idea that because the oil industry has worked very hard to identify all oil deposits in the world, that the Uranium mining industry probably has done the same. The question is, why would any industry spend money to create inventory (reserves) far beyond their short to mid term business horizon where there product is so price inelastic? Free Uranium would not sell more reactors since it would only lower the price 1%. Why would we ever expect Uranium reserves to be more than 50 years or so since it takes money to find and qualify reserves? They would just stop exploration, which they did for about 30 years up to recently.
Since mining industry reserves do not tell us anything what do we do? The only other good option is to estimate world resources based on distribution in the crust. This study by Ken Deffeyes published in Scientific American estimates that there are about one trillions tons available at reasonably high EROI.
Don't forget that that is at the current rate of consumption. Nuclear advocates do not envisage current rates of consumption but vastly increased rates of consumption.
I knew it was a mistake to start posting :-)).
TOD is on an already far too long 'must-read' list and posting commitments elsewhere make serious involvement here impossible so my apologies for starting something I cannot finish.
Let me just say this: In all the credible studies of the viability of massive nuclear energy expansion that I have seen, security of uranium supply (ie ramping up the delivery of enriched fuel from the theoretically vastly available but minuscule concentrations of known ores) always figures in the top 2 -3 problems; along with waste disposal/storage and proliferation.
The site you referred to is an interesting addition to my portfolio so thanks for that; but there are many others, equally impressively qualified, which take a far less sanguine view of the viability of massive expansion. There are some very interesting papers here for example:
http://www.oxfordresearchgroup.org.uk/publications/briefing_papers/secur...
and the Sanders Research site referenced in my above post gives a feel for the truly vast quantities of FF's needed to ramp up uranium production.
I will agree that all the studies by the anti nuclear groups do use the same sources and do say much the same thing. I am convince that the ones about fuel supply are just mistaken.
If you do not have time for this debate now just come back in a few weeks. You will not have missed anything because we just go over the same points over and over. No matter how much evidence and logic we present, the other side continues with the same arguments.
The Sanders Research article is by one John Busby, a lean energy advocate who surprisingly enough just doesn't think there's enough uranium (he's fond of claiming that the lights will go out in France in a few years time). His article consists of mainly recursive references to his own doubts coupled with an outright lie concerning the contents of BHP Billiton's annual report. Don't believe me? It's available online, so download it and check to see if there's anything remotely like what he describes within.
The Oxford Research group paper is mainly built on the discredited work of Jan Willem Storm van Leeuwen. Not surprisingly John Busby's keen on quoting him as well.
Is it discredited or do nuclear advocates like to think it's discredited? Might this turn out to be similar to the hockey stick of climate change which appeared to be discredited because so many people said so, but two separate studies vindicated it within the last couple of years.
If sabretache's story about the BHP Biliton uranium mine plans are correct, then that clearly demonstrates the desperate need and the difficulty. What reason do you have for stating that there won't be a problem with ramping up uranium production, other than the technicality of average crust concentration? Does it rely on wishful thinking (which sometimes works out)?
Do you think those kinds of difficulties would have stopped the oil industry where they ARE facing imminent shortages. They are supposedly spending about $135 billion just to develop the Kasagan field in the Caspian Sea.
There was a recent story about a new Uranium province recently discovered in Africa covering about 16,000 square kilometers. They are going to spend about a million dollars exploring it over the next few years. Wow!
I take that as a no then?
I would tend to agree that we cannot currently use renewables to build more renewable infrastructure.
If peak FF is in 2018, then we have 10 years in which to bootstrap off of FF to develop the needed renewables infrastructure described in the post. If we leave it until post peak FF, then we are, as they say, screwed. Whitewater ride down the Olduvai gorge, here we come!!!
"They should replace coal with wind and use the nuke plants for load balancing."
Nuclear is great base-load, but in most current types of plants you don't want the fuel to go through too many heating/cooling cycles. Only a small fraction of the cost of nuclear power is in procuring the fuel; much of it is actually in building the plant itself and in operating the plant. It makes very little sense to have a nuclear plant generating anything less than peak or almost peak power unless the cost of the fuel goes up dramatically.
"Coal, gas, and oil, are only set to become more expensive. This is likely to happen even as renewables become less expensive over time."
And it's going to become less and less affordable to provide huge subsidies for renewables(e.g. net metering, tax deductions). It's not at all clear that technological advancement will win out over disappearing subsidies.
"Look for solar energy also to make headway by the end of this year with an overbuild in capacity and prices set to fall in both polysilicon and manufactured panels. New thin film solar is also starting to make its way with much lower cost solutions for utility based solar energy."
I doubt PV will get anywhere near competitive on the utillity scale without subsidies for many decades. Producing cheap solar power is a small part of the problem. Either you must figure out a way to store it cost effectively, either as chemical energy or retreivable as electrical power(e.g. pumped storage) or you must pay someone else for having excess generating capacity that they forgo using when you're generating power; this depends on the cost of producing excess generating capacity(e.g. bigger furnaces, turbines etc. than you really need) and how significant the operating costs are and how they vary with load.
I see a little more potential for rooftop PV among individuals if the costs go down. You incur no tax or transmission cost on this electricity and it coincides with AC requirements quite well. If solar PV becomes too popular it will force utillities to balance the increased variability in demand with more excess generating capacity and electrical power provided by the utillities will become more expensive.
I'm a lot more enthusiastic about solar for heating and solar thermal plants.
Denmark is still dependant on coal power with imported coal and will be hurt by rising coal prices and their north sea natural gas will soon start to run out and will probably be repalced with gas imported from Norway.
The ammount of possible wind power in Denmark is limited by the nordic grid to hydro power Norway and northern Sweden. There are significant grid maintainance, reinvestments and new power lines but not enough for unlimited growth in wind power. For that we need greater acceptance for new high tension lines and that the least expensive technology is used as much as possible.
It would help a lot if Norway decided to invest more of their oil money in strenghtening their grid and that would also make it possible for the next generation to use the vast wind and wave power potential along the norwegian coast.
It would have helped a lot if Danish and Swedish "greens" had not gotten the Barsebäck nuclear powerplant closed down since it is sited close to Denmark and perfectly placed in the grid for unloading it from transporting base load and allowing the ballancing of more wind power in Denmark. Hopefully the Danes will change their mind. The small municipiality with the closed down reactors has switched "business idea" from sea front properties to trying to attract the building of four new reactors if national politics would allow someone to invest.
Nuclear power in Sweden has very strong local support in the municipialities closest to the sites. They are dusting off the old regional planning from the 70:s and arguing that the sites are planned for 1-2 additional reactors and that we should start prepairing for the replacements to the current reactors. And Oskarshamn and Forsmark are competing for the siting of the final high level waste repository.
But it is not as the situation in Finland where the reaction to the fifth reactor that now are two years over schedule is three seriously funded competing efforts for building the sixth reactor. One of the efforts suggest several new greenfield sites for 1-2 reactors but I dont know how hard the competition is for getting the investment.
And regarding nuclear investments we have the baltic countries and Poland trying to get a replacment built for the ex sovjet Ignalina plant. And the baltic countries are realy intrested in building strong
HVDC ties to the nordic grid.
All of the nordic countries are investing a lot in biomass power, district heating and cooling, combined heat and power production, heat pumps and efficiency. If those investments continues, we continue the renewable investments and get the nuclear power investmnets done we could within 15-20 years have a northern grid almost independant of fossil fuels with significant CO2 neutral power export to the middle european grid.
And I hope that rock solid power delivery at a reasonable price will attract chemical, mechanical, server farms and other power intensive industry.
Thank you for that review from that part of the world. We in the U.S. seldom get to see what is going on there in that detail, it is beneficial that we do.
Portugal is apparently getting nearly 40% of its electricity from renewables, chiefly solar, wind, and hydro, and one of the first commercial wave power generators. Growth in renewables has been quite fast, with a lot more generating capacity on the way:
http://www.ecoearth.info/shared/reader/welcome.aspx?linkid=93389
A somewhat related article:
http://www.bloomberg.com/apps/news?pid=20601087&sid=aLJGjEpQ7F1g&refer=home
Let's hope Bush doesn't veto again.
Thanks, Luis!
Very good work - I like the long time horizon from 1900 to 2100!
Excellent work guys, this kind of reminds me of the 30 year update of the Limit's to Growth book i am currently reading. The only discrepancy I see is using the United Nations population data. I honestly can't see population increasing to 10 billion people at the end of the century. I severely doubt that the UN model does anything other than extrapolating current growth trends into the future, much less including increasing scarcity in fossil fuels. After all, the idea of Peak Fossil Fuels is still in it's infancy in mainstream media and government. I think that would cause the barrel per capita figures to be less steep in the 2020-2100 area, only because their are less people.
I think there are going to be too many problems in supporting a population that large especially the way things are continuing with government's polices on growth, efficiency and resource allocation. Water and food are going to be large factors in limiting growth and climate change is sure to wreak havoc with agricultural because the climate region's suited for growing food are going to shift faster than the land's will be able to adapt. Also we can reasonably assume that economic factors due to fossil fuels peaking are going to make it much harder to finance the creation of renewable alternatives such as wind, solar ect. I'm just looking at the dip between fossil fuel availability and alternatives availability in that dip/lag between 2018 and what looks like ~2040. Also from Nate's recent post about I think declining EROEI's are going to put all of our economies in a disastrous state of flux by growth in the energy sectors and contraction in everything else. These factors make these graphs look pretty optimistic IMO.
I agree wholeheartedly, we must build renewables now and as fast as we can if we all want to make it.
Overall a wonderful post and I think we can all learn a lot from this data. This is why I love theoildrum.
-Crews
Thanks for your ideas Crews, some comments:
Unfortunately the work made the MIT team lead by Dennis Meadows doesn't take Energy into account. This seminal work, that still is today one of my major references on this field, only models the flows of mass to and from society.
Population growth is presently evolving along a Gompertz growth pattern with its first derivative having peaked almost 20 years ago. The UN forecasts are quite plausible barring any severe disaster (check this old post by Stuart). And of course the objective of this work was to assess how can we maintain the current path, avoiding difficult choices or realities.
Thanks Luis,
That is a little disappointing, I'm only 1/8 a way through the book and I find they don't take energy into account, sigh.. I would guess that probably means that all of the world3 models talked about in the book are going to all be a little too optimistic. Well, Meadows was quite an optimist by nature.
Thank you for the old Stuart post, I think I'll make going back through the old oildrum post I haven't read a new project of mine.
I really like this post, in the way I think it gives us a pretty good idea of how fast and the extent to which we need to replace our fossil fuel energy sources with renewable ones. Also I don't mean to criticize, I think this article did a wonderful job of fulfilling it's purpose, I just like to throw idea's out their. I am trying to learn more about modeling so I can make more of a contribution to theoildrum than just a few comments here or there. I really appreciate all the time and effort you put into this, Luis, it's a noble thing of you to do.
good luck and best wishes,
-Crews
A tremendous opportunity exists to build a more sustainable energy future and building this future will provide vast opportunity for economic growth and prosperity.
Beautifully said. Let's get to work. :-)
Actually that's part of the 1% credited to Euan.
Amazingly, he managed to have "sustainable" and "growth" in the same sentence and still make sense.
;-)
One of my colleagues looks at how this might play out politically in the US:
http://www.commoncurrent.com/notes/2008/02/whats-rockin-our-world.html
Optimistic, perhaps.
I assert that "sustainable growth" is an oxymoron.
It’s been said that growth on a finite planet can’t continue but some people don’t intuitively see that. They’ve lived their whole life in a context of ever-expanding growth and can’t imagine it any other way.
But it’s true: infinite growth on a finite planet is impossible. If you don’t believe that, try the reverse in a thought experiment. Try keeping the economy the same size then continually shrink the planet. See? Equally impossible.
The good folks at the Center for the Advancement of a Steady-State Economy (http://www.steadystate.org) can give you the background math if that’s interesting to you (under ‘Resources’).
I encourage everyone to look at the work of the ecological economists there. Probably their biggest contribution is putting the mathematical teeth behind the assertion that human growth necessarily reduces biodiversity i.e. the number and range of other species on the planet. In a nutshell, as we grow we crowd out other species. This is self-evident to me, but they (the ecological economists) support this view with math.
So please: let's start getting real. The paradigm of growth is ecologically bankrupting the planet. Putting the word "sustainable" in front doesn't, in my view, change the underlying math of human growth == biodiversity loss.
-André
Cultural growth, in the sense of more knowledge and understanding, more artistic and creative achievements, etc., is quite possible in a steady-state economy. But that's about it.
So, if a steady state economy delivers all those things, and presumably the essentials such as food, clothing, shelter, and so on, what more would you want?
“But that’s about it?” Seems like more than enough for any human soul to yearn for. Freedom of creative expression. Artistic expression. Greater knowledge and hopefully greater understanding.
What else would you want from life?
I don’t know where you live, but let me ask you this, when was the last time you could stand in your back garden and see the Milky Way? When was the last time you slept with your windows open and awoke not to the roar of traffic but to the peace of silence?
I have no idea what you want but I’d gladly trade the maxed out, fucked up, self destructive, super sized world we live in for those values to be found in a steady state economy any day. Even if that is all it has to offer.
Innovation can continue. its not bound by energy. Cheaper better longer lifetime lower energy use and probably the big one higher quality. On the human side better service.
On the personal side you would look at higher education with potentially more people exploring the arts then before. To offset this the work force would be more flexible so people could work and contribute but still better themselves.
Next considering that such societies would have to adopt a zero to negative population growth strategy as a simple way to increase wealth on would see personal wealth gains as the population decreases and labor commands higher rates.
I'd guess that this would be offset by extensive use of advanced robotics to replace increasingly more complex tasks. Just about anything that can't be enhanced with a personal presence.
Also of course a move into both cyberspace and real space as a way to expand wealth would greatly decrease the pressure on earths resources.
So I don't see finite energy usage on earth as a hard limit to increasing personal wealth as long as the population declines back to a low level.
Actually, that's fine with me. I live in a small town, and yes, I can and have (recently) stood in my back garden and saw the Milky Way (though still through some light pollution, unfortunately). In the summertime we do sleep with open windows and awaken to birdsongs, not traffic noise.
The more distant I get from the urban rat race, the more utterly ridiculous it all appears to me.
I have a feeling that the original ideal for "big society" was to enable individuals greater access to "creativity", art, music, philosophy, medicine etc etc. Seems we need to stop growing in order to pursue our stated objectives. Let's face it folks, society as it stands today is a petrochemical "drugs and violence" orgy.Bring on the cliff.
Right, after all the orgy of murder and rape at Carthage never would have happened if we hadn't discovered oil.
Dumbass.
aangel - would you accept a lower population, where every individual was much "wealthier" and happier than today as a definition of sustainable combined with growth - not of the whole economy but of individual prosperity?
And with a declining population - managed decline not catastrophic decline - that heritable wealth passing down through the generations may be one way of achieving this uplift in standard without burdening the planet.
I doubt that the "decreased population = bigger slices of the same pie all around" idea will work out that way, though. It might be possible for some countries to undergo a relatively peaceful and benign gradual transition to a lower population. When we look at it from a global scale, though, I can't see large-scale, relatively quick decreases happening without things also happening that will degrade the natural environment and the economic infrastructure in ways that will permanently shrink that pie. In other words, the global carrying capacity will be permanently degraded. Fewer people to share the pie, yes, but with a smaller pie their slices are not likely to end up with much more actual pie on the plates; it could, in fact, end up being a good bit less.
Hi, Euan. Pleased to meet you.
I might accept that but I would ask you to further define what actually is growing. I just don't know what you mean by "individual prosperity." If you don't mean anything close to material prosperity, then I believe you are defining growth in an uncommon way.
For instance, it's still very common to find people assert that it is best to encourage impoverished people to grow their way out of their economic situation so that they also stop denuding their local environment. And they are right when a person is starting below a certain level. When survival is at stake, a person will use every scrap of ecological capital even if it means their future is mortgaged. So having them grow to meet a certain level of material prosperity on the surface looks like a good thing to do.
But what works at the very "left side of the curve" can't continue or their collective material needs and wants rapidly outstrip the ability of the local environment to supply it. When that happens, a country looks to import materials from abroad, preferably from a country that hasn't yet grown enough to require those resources themselves. Fairly soon one has the whole planet of 6.7 billion people trying to live a Western lifestyle, which is easily demonstrated to be physically impossible given just a material flows analysis.
Gandhi could see it even back then: we are stripping the world bare like locusts. And all our proposals will come to naught unless we address the fundamentals: we must sanely reduce our numbers, as you point out. Everything else is just "a fix."
The alternative is ecosystem collapse — if petrocollapse doesn't beat it to the punch.
So all that is simply to ask: could you further define what actually is growing and let's see where that brings us in the conversation?
-Andre'
Andre' you are putting me on the spot, which is fair enough. I am trying to work out which pieces of the jig saw we need. if all we can promise is economic and environmental collapse then this will likely become a self fulfilling prophecy. So here are some thoughts that as yet do not make a complete picture:
I am persuaded by the need for global population to decline. So some how through the course of this century measures to reduce population will have to come about.
Currently we waste a huge amount of energy and any society that wastes so much is inevitably impoverished. Energy efficiency measures will lead to greater wealth.
The FF energy we consume right now is non-renewable and many argue that the 0.7C warming from CO2 produced thus far has resulted in accelerated loss of Arctic Sea ice. Building abundant supplies of alternative / renewable energy sources can secure a sustainable and prosperous environment for mankind.
Rebuilding global energy infrastructure which will happen sooner than many think will generate significant economic activity. There will be winners and many losers. The most conspicuous losers will be the FF companies, auto companies that do not adapt, airlines and airplane manufacturers etc. We will invent less energy intensive ways of entertaining ourselves - substitution of one industry with another will come about.
The internet (or derivatives) will play an important roll. It is already playing an important roll in speeding economic transactions which results in growing GDP. Las Vegas will come to you.
So what will grow is global GDP per capita and GDP per capita per boe. Set against a backdrop of falling population, total GDP may or may not fall. What matters most to investors is to have a part of the economy that is growing strongly. The widows and orphans who leave their money in Exxon, American Airlines, GM and Boeing may be very disappointed.
We will of course have inflation which will obfuscate the true value of what we own.
As mentioned before, declining population results in heritable assets being focussed on succeeding generations.
I lived in Norway for a number of years during the very early days of the oil industry there. The Norwegians were extremely wealthy back then on the back of abundant hydro power and declining population. Heated pavements and and lit ski trails - luxurious living in the midst of arctic winter. I suspect that Norwegians had a higher living standard back then than they do now even though they are now much wealthier. It depends how you measure wealth.
Cheers, Eaun,
I have been trying to see where we are in the ability to produce power by non-fossil fuel means against your scenarios.
It is perhaps too early to expect wind, or even more solar, to be producing a substantial fraction of the outputs you postulate - I would be interested if anyone has the current increment in Megawatts per year for wind to hand though, and I may try to google something up if I have time and no-one else has the figures to hand.
On one of the energy sources, nuclear, it seems clear that we already have around the capacity needed for the lowest case scenario, efficiency gains and splitting the burden of production.
That postulates a nuclear contribution of around 19GW/year.
The biggest bottleneck in the nuclear industry is forgings for the pressure vessel, with only one current manufacturer with a capacity of 12 vessels a year.
If they were used for large reactors of the 1.6GW Areva design that comes out to 19GW, our target figure.
Currently the forgings manufacturer is looking to double capacity within a few years, and two more manufacturers are going through the process of obtaining regulatory approval and setting up production.
This might come out to around 50GW of production capacity within a few years, in any case clearly more than that required in the next lowest case scenario, of all sources sharing in increased capacity but no efficiency gains, 30GW, and near perhaps to that in the case where nuclear alone provided the incremental power but there were large efficiency gains, in which case you would need 55GW.
It is also clear that on the drawing board at the moment there are no plans to meet the 90GW target of producing all the incremental power from nuclear with no efficiency gains, a further round of expansion would be needed to reach this.
Of course, this is only to consider one bottleneck, large forgings, but the time-scales involved perhaps make it reasonable to envisage a similar rate of growth in other factors such as getting personnel trained.
Here is a reference to an expert discussion of capacity constraints and progress in overcoming them:
http://larouchepub.com/other/interviews/2006/3332tom_christopher.html
Industry Rebuilding Its Nuclear Manufacture Capacity
Dave - in 2007 there was 20,000 MW of wind capacity installed. Luis' calculations show at peak we need to install about 50,000 MW per year. I think this clearly shows that 50,000 is easily feasible - in fact it almost seems too easy - maybe I made a mistake. The neat thing with renewable energy is the cumulative build in capacity.
One can see a massive business opportunity servicing wind mills. We would of course run into problems with replacing old plant - but the frames should hopefully be built to last 100 years. Maybe the blades and gear boxes will have to be replaced much more frequently than that.
A poster called Down Under is very skeptical about the longevity of wind turbines - but I think we gotta assume that engineering problems can be solved.
I don't think there will be too much problem re-building our nuclear engineering skills - if the worst comes to the worst we can always call on the Iranians to help us out.
http://www.gwec.net/
By way of contingency we have not allowed for expansion of large hydro here - I'm not sure if that can make a significant impact.
Thanks for the info, Eaun, but is sounds to me as though perhaps that is the old-buggabo of actual capacity vs nameplate rearing it's head - presumably Luis is talking about 50GW actual, IOW around 150GW nameplate, so wee are currently building around an eighth of what is needed - I will check back in the article in a sec, as it is not easy to do when you are writing a post.
Your 20GW is indeed name-plate, I assume?
Large hydro could be regionally important in Africa, but not really on a world basis - I am very hopeful that in tropical regions solar will do most of the job though - it is at higher latitudes where it seems to me not very sensible to hope for much from this source - winters are too dark and cold, and transmission lines from warmer climes darn expensive.
Not sure where you got the 50GW figure from, Euan.
Looking back at the article Luis gives 90GW as the total needed with no efficiency savings at peak and 45GW with - the easy way of seeing that is to look at the case for nuclear power only as that is in nice easy 1GW increments.
If you use mixed power sources you are looking at around 1/3rd of those figures.
OK, the figures as presented are a bit more complicated, due to smoothing and different assumptions for what peaks when, but that is about the size of it.
Using Luis' assumptions of off-shore wind in 3MW turbines at 30% efficiency and off-shore 5MW at 40%, and for comparison with what is happening in the build today just focussing on the on-shore build, because that is what almost all of it is at the moment,
Then to run everything with onshore wind you would need around 3*90 GW = 270GW of nameplate capacity, around 13.5 times present build of 20GW nameplate.
You would need around 90GW of nameplate for a 1/3rd share of the need, so around 4.5 times current.
In the best case for on-shore wind with it's taking 1/3rd share and with high efficiency, you would need 45GW nameplate, around 2.25 times current build.
Even the lowest case sounds challenging, although in practise it would be helped out by the much more expensive off-shore wind build, and to me at least it sounds as though any thoughts of running the whole of society on wind are not on the cards, and that it would be very, very difficult to build even a 1/3rd share of power needs if high efficiency is not attained - IOW it would need high prices and energy use to be severely constrained.
The US has IIRC about 15GW of wind nameplate, and added about 5GW in 2007. Wind was about 30% of new capacity in 2007 (the balance was mostly gas, which has an equally low capacity factor).
Ramping up wind to provide it's needed contribution of 270GW per year would cost roughly $500B, or roughly 1% of world GDP - when you consider the lack of fuel or operating cost, that's not bad.
Solar is more expensive, currently, but PV costs really are falling quickly - this is obscured by prices, which are staying high due to an excess of demand over supply (panel pricing is falling quickly, installation a bit more slowly due to the current immature, retrofit-based, cottage-industry based nature of installation - this will change). The fascinating thing about PV is that it's hard for utilities to control. Once it hits parity with retail peak grid pricing, in 3-5 years, it will grow very quickly. When it falls below retail average pricing, a few years later, it will be uncontrollable.
That's in the right ball-park, as the recent Pickens 4GW wind plant cast $10bn, so that would work out at about $670bn.
The issue I would see though is that it is highly location-specific, and the windiest places aren't usually where you want the power.
Here is a map of wind resources in China, for instance:
http://www.ewea.org/fileadmin/ewea_documents/documents/publications/stat...
070129_Wind_map_2006.pdf (application/pdf Object)
In some areas it should be very helpful, in others it would be a very difficult resource to use and would require massive line investments.
You also have back-up and so on, and in some places you might need to go off-shore, where costs are around double.
Wind looks to have a big part to play, but integrating it and building the transmission lines and so forth will lead to some difficulties.
Eaun said:
A couple of other possibilities deserve mention, although the decision to exclude them was right as they are too immature, but both have a very large resource base indeed.
I exclude all the variants of Ocean power, as bigGav recently covered that in an excellent article, but would like to mention firstly high altitude wind, which if we can pull it off has enormous advantages over wind turbine technology.
Over around 300 meters at sea and 800 meters on land the wind is a much more reliable and stronger resource - you throw away most of the superstructure, around 95%, and get a resource available almost all of the time and almost everywhere.
There are many proposals for harvesting it, including one, Makani, sponsored by Google, but for those interested in finding out more I will just highlight one, the Kitegen proposal, which has had a 1kw prototype flown and is going up to a 5kw model this year:
http://www.kitegen.com/
Sizes up to 5GW should be possible! -that is rather a lot of wind turbines, and costs should be a fraction of those of other power sources.
Of course, the control of the kites would have been impossible until recently, but we now have a lot of computing power available to throw at it.
A German company recently launched a kite-assisted ship:
http://www.environmentalleader.com/2007/05/23/belugas-skysail-could-cut-...
Beluga’s SkySail Could Cut Fuel Consumption 30% - Environmental Leader: Green Business and Corporate Sustainability News
So this may indicate that control problems are indeed soluble.
Another alternative is hot dry rock geothermal, currently undergoing trials at Soultz in France and to be tested in Australis.
Here is MIT's estimate of potential in the US:
http://www.sciam.com/article.cfm?articleID=517E9954-E7F2-99DF-36C206BCA2...
These are two potential major contributors to low carbon power.
Euan,
I think that would be a very nice outcome (increased GDP per capita and increased GDP per capita per boe) — as long as the world total numbers decline at a steady pace and we institute cradle-to-cradle resource loops everywhere. I think there would need to be some significant modifications to your plan for it to work, though.
For instance, to say that Boeing et al will not provide returns to make widows and orphans happy is an understatement. I just finished reading the Ayers and Warr paper (ACCOUNTING FOR GROWTH: THE ROLE OF PHYSICAL WORK PDF INSEAD, 2004). (Tip of the hat to Gail and David Strahan.) I had been looking for someone who worked out the math behind the relationship between the economy and energy. The furthest I had gotten was that short-term oil shocks reduce global GDP by 0.7 to 1.4% within four quarters of the shock (The Macroeconomics of Oil Shocks PDF, Philadelphia Fed, 2007).
But really it was Ayers and Warr's work that I was looking for. They demonstrate what classical economics fails to do because it does not have an energy input. It addresses capital, labor and resource inputs almost exclusively. It's actually quite shocking to me that it took us collectively until 2004 before someone thought to put energy into economics as more than just another sector of the economy! I think I'm going to create a list of Humanity's Biggest Blunders. So far I've got:
(For those nuclear boosters out there, I think we've got a mess on our hands with over 400 nuclear reactors that have to be decommissioned plus their spent fuel that has to be safely stored basically in perpetuity — while we're experiencing Energy Descent. I am doubtful we will responsibly be able to address this issue.)
In any case, most grand plans that I read fail to include that post peak our economy will be in a shambles and I think that you make the same mistake. The elasticity Ayers and Warr calculate is a perfectly intuitive 0.7 (see Figure 10). That essentially means that as energy declines, the economy declines. Beyond the first year or two where some efficiency might buffer the situation, our economy cannot continue at anywhere near its current size no matter the efficiency brought to bear. (N.B. that curtailment/conservation is different from efficiency.)
That further means that:
In other words, I don't think your vision of rebuilding our energy infrastructure has a chance of occurring before several centuries pass — unless a pandemic wipes a bunch of us out leaving more energy per capita for the remaining crew of spaceship earth.
As for your concern regarding a self-fulfilling prophecy, I think the time to be concerned with that is long gone. I believe that there isn't anything that can be done to avoid petrocollapse now — we needed to start decades ago. Now the important thing to do is, in my view, tell everyone about petrocollapse so that we can prepare. That is exactly what I do in my public speaking in which I call for leaders to emerge from the audience to start organizing us. I set it up as a game and everyone can play one of four roles:
There you have it: my take on our collective future and what to do about it.
-Andre'
www.InspiringGreenLeadership.com
Sorry but that is all built into the near 100 EROI for nuclear. The real problem is not budgeting waste disposal for coal, especially greenhouse gases. If that were done, no one would build any coal plants and most of those displaced would go to nuclear.
Hi, Sterling.
Perhaps I'm being obtuse but I'm not seeing what you're pointing to. If:
where are you expecting to find the energy to decommission the nuclear plants and safely store the fuel? I just don't see how the EROEI is even relevant in that context. It becomes a budgeting exercise: how do we use the remaining energy from all sources?
-André
Simple you fund the development of the waste handling with the first generation of nuclear powerplants and build all the waste handling equipment, waste cannister factories and start putting waste in final storage before those plants close down. And you build the next generation of nuclear powerplants with part of the revenue flow from the first generation and then the next generation pays for the handling of the rest of the first generatio waste if the set aside funds fail for any reason. And so on with more generations of nuclear powerplants or other power generation.
Hi, Magnus Redin.
I encourage you to tell everyone who will listen to do exactly as you recommend.
Unfortunately, I cannot find any evidence that this consideration is even being discussed.
-André
The first generation of commercial nuclear powerplants in Sweden has funded the RnD and a large fund for decomissioning and waste storage.
The high level waste encapsulation plant is designed and might start building in 2012 and it and the final repository is planned to be ready for use in 2018.
The schedule will probably slip some as it has done before but the waste handling effort has allways been taken seriously and I am absolutely sure it will be be completed as a true best effort.
If I assume a start date in 2020 and that the reactor life lenghts will be around 60 years it gives an overlap between power production and repository use of 10-25 years.
I realy hope we get a political go ahead for a new generation of nuclear powerplants in Sweden. Its an intresteing thought that it is certain that those will run their whole life lenght during the peak oil downslope. Wonder what their value will be in 2040? I dont have a good idea on how to calculate it. I hope they will be built for easy replacement of the preassure vessels, the concrete parts might be used for a very long time indeed if we dont get a wonderfull technology development.
Finland is ahead of us. They have started building their final repository as a pilot effort that will become part of it if it turns out ok, they will use the same technology asSweden. They are building their first new generation reactor and have three competing efforts for the next one.
Hi, Magnus Redin.
Very good (that cleanup is being considered).
However, what I was referring to is the necessity of setting aside energy for cleanup during energy descent. Is that part of the conversations Sweden is having? My fear is that cleanup will be pushed aside.
-André
We are going to have plenty of electricity as long as we dont start destroying infrastructure instead of investing. And anything made from oil can be made from biomass and electricity but not in the volumes we are used to even if we have a fair ammount of forest growth each year.
I dont fear for the chainsaw oil and petrol, diesel for the logistics that is inefficient to do by rail, hydraulic fluids, transformer oil and so on. It will also take a long time before heavy oil becomes scarce enough to force a switch of everything to biomass or coal. In the mean time we can for instance turn scrap and electricity into ball bearings and trade those for heavy oil that needs a lot of hydrogen for upgrading.
Hi aangel,
It seems to me that you are over-estimating the difficulty and energy costs of decommissioning - at the moment we use gold plated methods suitable to a very rich society.
If you leave a reactor, it gets cheaper to finish the decommissioning the longer it is just shut up - you don't have the heavy expense of dealing with very hot material, so essentially after, say 100 years then the problem is a heck of a lot less.
As for the fuel, you put it in water and again leave for 20 years or so, and after that it is sufficiently cool to be dry stored in casks.
The problems of waste are greatly exaggerated in my view, and are in fact far, far less than those of the coal industry - it is just that that has never paid to clean them up.
I would not favour deep underground storage of waste - it seems to me that it is in fact a very valuable resource, which can be used as fuel for reactors we are now designing.
Here is one design which should be in mass-production by 2025 - it is mostly licensing that is going to take that time:
http://nextbigfuture.com/search/label/thorium
So that is the nuclear prospect - hundreds of times better fuel efficiency and 1000 times less waste than currently.
Even before that date, present generation 111+ reactors are much more fuel efficient and produce less waste than previous reactors, and in fact most of the waste anyway is from the weapons program, not the civil program.
So in fact an expanded reactor program will not increase the present level of wastes much at all, by most metrics.
The reason is that the waste already in storage is decaying, so that it is less radioactive, so you can add to the stockpile whilst overall radioactive levels are fairly constant or even go down a bit.
I don't mean in your case, but the public is perhaps a little confused by some of the issues in nuclear matters.
For instance, some radioactive waste is radioactive for hundreds of thousands of years, and some are very lethal.
The point is though that is is the speed of decay that throws out loads of radioactivity, so the real nasties don't tend to hang around for long, and the ones which do hang around for ages do so precisely because they are not giving out much radioactivity.
The issue is more complicated than that, as how readily the body absorbs the particular element also varies, but in general holds good.
That is why the vast majority of the problem is solved simply by putting the very hot fuel under water for a couple of decades.
I hope you find some of this useful.
Dave Mart-
Being somewhat kind...
Actually, none of it.
You have admitted to not being an engineer - thus strongly implying that you are not a physical scientist - therefore I forgive you for your egregious errors and false conclusions that you have arrived at and have been posting - repeatedly - to TOD.
You have recently been joined by friends (using the term loosely) Charles Barton, Joseph Somsel and perhaps Sterling and you are all seriously underestimating the long term storage problem of high level nuclear waste (not spent fuel, but fission products). I gave a brief mathematical and physical description of the enormity of the problem back on Feb. 10 in DB but got no response from you.
I will gladly refute your claims (and the others as well) but perhaps this thread (begun yesterday) is no longer the choice location for the discussion... should it be moved to a more current location?
Skip
Absolutely fine - I always welcome reasoned discussion, but as you say another thread might be the best place for it.
I am also very encouraged that you seem to think that I am not confusing the issue by a misunderstanding of the science, other than if most of the scientific community who support that science are also mistaken.
I might add that that body would include not only the names you mention, several of whom I believe are well qualified technically to form a judgement, but also the recently retired British Chief Scientist, and such green luminaries as Lovelock.
If it is indeed a misapprehension that I am suffering from it can hardly be said to be one which is outside of much scientific opinion, or to be a personal misunderstanding of that opinion.
If I have not unfairly represented that body of opinion perhaps it would be best if you took up the debate with those better technically qualified to represent it, as I assume your own training is in nuclear physics and engineering.
All of us are presumably trying to find the best solutions, and to me at the moment it seems that nuclear is by far the most developed alternative, and also that strategies developed in France actually run most of the electricity of that society, whereas the notion that you can run most things on renewables alone is theoretical at the moment, and current costs are very large.
Jump not to conclusions - particularly those not supported by the data ; >) First Rule of Rational Thought: Assumptions are Evil.
My training(? whatever that means) is neither in nuclear physics nor engineering: I'm a Ph D (trained?) theoretical physicist, long in the tooth; my dissertation advisor worked with Einstein back in the late '30s early '40s. General relativity and gravitation; cosmology; quantum field theory; the fundamental mathematical structure of the Universe... simply put, first principles and not quoting authority must be the basis for analysis and conclusion.
You are erudite and an excellent debater - no doubt, and I credit you with that - however, as I enjoyed the performances of William F. Buckley, Jr, I find your comments in these discussions works of art, I also find them lacking in substance. You, in particular WRT nuclear power, simply quote authority; but wrongly and poorly. As I would not go to Bill Buckley for advice on any *real* scientific issue ( or for that matter, any issue of substance), I can not consider you (or your *friends*) a knowledgeable source.
Therefore:
I will not debate you.
I will not accept (or follow) any effort on your part to introduce *strawman* arguments or that which is simply, a bagatelle. Your post above, to which this is a (belated) reply does contain scarecrows which neither scare nor require me to respond to - with one exception (being one mentioned in a post below): I care not (and neither does the rest of the inhabited planet) what Lovelock might harbor in "his shed at the foot of his garden"... unless they are 79 virgins.
I will address only comments posted by you and others addressing the contents of links so posted (by you folks) on the issue of nuclear power generation of electricity and how the information contained has been either misinterpreted or possibly manipulated to conform to *support* a possible predetermined position held by the posters...
...in other words: how some are cruising the internet as itinerant farm/orchard laborers seeking the low hanging fruit (re: cherries) in support of the *family back home*, ie. what is most seemingly desirable for them (the posters) in their future.
I hope that I'm wrong. Prove me so...
Pick the field... the weapons will be keyboards.
If I do introduce any strawman arguments, it will be inadvertently and I will welcome rebuttal.
Whenever someone has shown me to be mistaken, I have always immediately withdrawn.
At the end of the day, I don't have a dog in this fight, and welcome any contribution renewables can make, it is just that I can't see renewables doing the trick at the moment.
It is just that AFAIK nuclear power is the only means which can be mass-produced and make power almost everywhere, and like yourself I get annoyed with strawman arguments - I feel that some of the people who argue against nuclear power do so from a priori grounds, and in fact no matter what answer is given them regarding a solution to a particular technical argument they might offer, that will never touch the real grounds for their objection which lie at a deeper level than that and they will simply shift the ostensible argument - the real reason for their objection might be a feeling that the nuclear program is a result of the American industrial-military complex or some such.
For those of us who think that GW is a real phenomena, even supposing the risks of nuclear power are at the level of the extreme projections of it's enemies, even supposing we had had a Chernobyl every year, which is fact is impossible as Chernobyl had no containment vessel, that would hardly have caused many more deaths than are attributed by most reckonings to the coal industry over the last 30 years, and in retrospect it seems clear that a mistake was made in discontinuing the nuclear program, as CO2 levels would now be substantially lower, and the deaths from, say, a 3 degree temperature rise would be of a different magnitude entirely to any the nuclear program night have caused - and in fact no deaths at all have been attributed to the civil nuclear power generation program in the West since it's inception,
The risks therefore remain theoretical, the dangers of running out of power or contributing to greenhouse warming real and substantial.
Risk is always assessed against other alternatives, so it seems clear that not only was discontinuing the rapid expansion of nuclear energy a mistake, continuing to do so now that the risks to climate are clear would be a disaster.
I await your response with interest!
Skipinbluff said:
It is perhaps worth pointing out that the same could be said of your own critique, as you have in fact said nothing of substance, just gave an accusation of general wrong-doing.
Of course any debate I could possibly participate in will not operate at fundamental levels, you surely would not expect, say, a newspaper article to do so either, but presumably feel it is right that matters should nonetheless be debated by the more general public, as we all have the responsibility of making up our minds on numerous issues in which we lack full expertise, for instance in which doctor we should trust, which we decide without a medical degree.
Specifically, although you may disagree with the overall risk assessment of nuclear waste handling, it is surely correct of me to point out that although nuclear waste remains radioactive for a very long time indeed, most of the real nasties decrease in potency in a relatively short time, precisely because they are so energetic.
You may also care to confirm that to the general public this is not always clear, and so my own comment on this is likely to increase understanding to the general populace, and is, in fact, accurate, and it is a fair statement that risks do decrease rapidly with time, and also that spent fuel has been dealt with successfully for many years in France by exactly the methods I describe.
Regards,
Skipinbluff and others who have joined this thread.
Would you like to have an open thread to debate nuclear waste storage, reactor maintenance and decommissioning?
You'll find my email in my details. If you send me a 500 to 1000 word submission laying out your position then this may be posted at the top of a new discussion thread where we can gather the various points of view on this important issue together.
Euan
Euan-
Thanks for the offer.
My submission will follow later today - I'm located in SE Utah (USA) and on Mountain Standard time so expect it this evening...
Skip
OK Skip, I'll look forward to it. Lets hope others commit their views to writing too.
A Word file is fine. If you have any charts or figures attach these as jpg or png files.
We have a fairly busy schedule this week and both PG and Nate are away - but I'd hope this may find space some time during the week.
Euan
Skip,
looking forward to it. I looked up your comment on Feb. 10. Very enlightening.
-André
Euan, can I suggest at least two topics?
It seems to me that weapons proliferation is the most important problem with nuclear power, and that it's only tangentially related to waste storage, reactor maintenance and decommissioning.
If we are ever to have any hope of beginning to approach consensus on these things, I think we have to narrow our focus, and deal with one thing at a time.
Personally, I think that nuclear is an inferior option to renewables, but that we'll need nuclear in the current climate emergency. I think others, like even the most dedicated German opponents to nuclear power, will come to the same view. But, I don't think we can understand why they would prefer coal to nuclear without considering the weapons question, and I think it needs its own topic.
The cost of Yucca is measured in 10's of $billions. The cost of the Iraq war, justified with WMD, is measured in 100's of $billions, or even $trillions. The cost of sanctions for Iranian uranium enrichment is measured in 100's of $billions, just in the form of a risk premium for oil markets.
Weapons proliferation deserves its own topic.
Ok Nick, so all the risk issues are:
Safety of U mining operations
Operational safety of reactors
Waste storage
Decommissioning
Weapons proliferation
That's pretty good. If you wanted to broaden the definition of risk, you could include security of uranium fuel supplies (IOW, risk of not having enough), risk of inadequate speed of ramping up nuclear construction, and risk of excessive construction cost.
Personally, I would rank these issues like this:
Most important: Weapons proliferation
2nd: Risk of inadequate ramping speed
3rd: Operational safety of reactors
4th: Waste storage
5th: Security of uranium fuel supplies
6th: Excessive construction cost
7th: Decommissioning
8th: Safety of U mining operations
I would combine #2 & 6, and 4 & 7.
Another very good topic would be comparison of all of these, vs. the risk of climate change (and probably including the risk of peak FF).
Just my perspective.
I think any debate about nuclear needs to be holistic. Its not possible to weigh all the pros and cons if you spilt the arguments up.
So we will be having one big bun fight - but I'm noting all your points.
If you want to be holistic, then you should discuss its advantages and real potential as well.
Of course.
"I think any debate about nuclear needs to be holistic. Its not possible to weigh all the pros and cons if you spilt the arguments up."
I really think it's unlikely we'll make significant progress in this manner. There won't be sufficient space and time to address each of these areas, and nothing will be resolved.
We continue to have on TOD endless circular arguments about the simplest of issues, such as whether there is sufficient uranium to fuel reactors. I think it will be a very difficult challenge to begin to come to some kind consensus on even the easier topics, let alone the harder ones, like reactor operating safety, or proliferation. A post which tries to handle all of these at once is doomed to get bogged down - there simply isn't space and time.
It's true that all of these topics are somewhat related, but most of them are sufficiently different that a thorough treatment can be done without definitive answers about the others.
It is in fact going to be very difficult to come to resolution even if the scope of discussion is limited. So many people have idee fixes, and are willing to post without doing research or having relevant or detailed knowledge, that it's going to be lucky to make progress even in a narrow discussion. We might only succeed with a series of posts for each sub-topic, in which basic issues of fact are settled (what are costs? what materials are involved? what are their properties? what are the processes by which things happen? and so on...).
Just because you focus on one piece at a time doesn't mean that you don't eventually get to that holistic picture. I would suggest that the best way to handle this kind of thing is old-fashioned analysis. Analysis involves breaking things into manageable pieces, working on each piece until there is understanding, and then bringing those pieces back together again in a holistic picture.
Once we have a beginning of that kind of overall picture, we can start to evaluate nuclear's role vs other energy sources, in the context of climate change and peak FF.
I'll think about it. But I still haven't received a submission from Skipinbluff.
The end of his handle is bluff.
My apologies on lack of submission... I'm presently wearing 'too may hats' and got called away from it - which is leading to my necessity to go on the road for a few days this coming week. I hope to have it out to you before setting out late Tuesday afternoon.
Commenting on the recent collection of posts concerning the scale of the new topic: nuclear power generation requires mining; refining; modifying, 'burning'; collection and treatment of the resultant burned; recycling and/or the safeguarding of the burned; transporting the various phases of the fuel and the burned; designing, prototyping and building the various pieces of capital equipment to accomplish all; cleaning it all up afterward; finally, having it really work!
It won't if decisions are made not based upon hard science. In the best case it would work for a while... in the worst case it would create major and irreparable damage... the likely would be never finishing it before running out of (whatever).
A very complex thread indeed.
I will focus on the clarification of the issues of waste management that have arisen and the apparent misunderstanding of the physical science governing it - some posters have seemingly been led to believe that issues have been solved in reality when, in fact, they have only been speculatively and prototypically discussed.
Back to it...
Skip
And theory needs to be tempered by practicality and probability. For example, it may be theoretically possible to build reactors at a fast enough rate but is it likely (with planning, objections, diversion of resources, etc)? And the earth may theoretically contain enough fuel sources for thousands of years but what is the likely ramp up speed for the needed technologies? In the end, any conclusions should ask: is this conclusion based on what we know to be true (supported by data) or what we think might be achievable over some period?
Hi, DaveMart.
Thank you for your input but I must confess that I'm not really interested in pursuing the nuclear thread very far. I don't think we'll have much money to build the plants and one can't put their product into a gas tank, so it doesn't help with the liquid fuel shortage that we're going to have to deal with first.
As for your implied assertion that the waste products of the nuclear industry are not far from being easily handled, I'm inclined to want to take good care of our long-suffering planet and the people on it so I would like the waste to be addressed with due care. Everything you say may be true but for the moment I'm going to assume that your proposals are at best the barest minimum and are more likely to be insufficient when examined closely.
-André
You must form your judgements on whatever basis seems most appropriate to yourself, but perhaps it is worth pointing out that the electricity from nuclear power could be put into a battery to run a car, and that it is the only technology that we currently have which has been proven to be able to provide most of the electricity for a modern society, as France currently gets 75% of all electricity from it, and that we simply have not got that sort of experience with suggested alternatives.
Since it is also reasonably cheap - see French electricity rates - and low-carbon, if we think that GW and energy shortage are likely to be problems it would seem, to me at least, that you would need the strongest grounds possible to rule it out as a solution, and it would be folly to lightly dismiss it.
So perhaps it might be time well spent to check the assumptions - Lovelock actually offered to store nuclear waste in the shed at the bottom of his garden, so perhaps I am not being quite so minimalistic as you think! ;-)
Hi, DaveMart.
True, true...I will say that I have no trouble moving to an electron economy. What I don't see happening is a wholesale move to electric vehicles given the economic conditions we'll soon be in. Nor do I think we will have the money to build nuclear plants.
What I find lacking in these types of conversations is any significant appreciation for the effort and expense of changing our infrastructure in any significant way in any appreciably short amount of time before civilization collapses. On last count there were over 800 million vehicles in the world that operate on liquid fuel and the money to move them to electric motors will soon be in very short supply.
As I mentioned earlier, I believe that we will enter energy descent largely with the infrastructure we have. We may sneak in a few electric vehicles for first-responder units (ambulance, fire, etc.) if we're smart — maybe a few police cruisers — but not much more, in my opinion.
Best,
André
What I always find rather weird in these conversations is that many of those most convinced that civilisation will collapse due to energy shortages and/or that Global warming will lead to mass deaths, seem most determined to rule out using nuclear energy to avoid this.
Even if you accepted the most extreme fancies about the risks of nuclear power, surely those would be entirely trivial compared to the alternatives presented?
In the worst possible case, Chernobyl, according to Greenpeace around 60,000 people will eventually die due to it (according to the World Health Organisation the figure is around 100, and that is the figure that forms the basis for present risk assessments in medicine, for things like x-rays and so on - risks from low doses of radiation are now assessed as being much lower than once thought, but Greenpeace has chosen not to adjust it's estimates, though if Greenpeace ever assumed anything other than the worst possible case for nuclear I have yet to hear about it)
That accident occurred in a reactor without any containment vessel at all - none are now built that way, and Three Mile Island proved that containment vessels work, no-one died.
Compared to that, all the risks from waste etc are trivial, and even the occasional Chernobyl, which is now impossible, would do tiny amounts of damage compared to the fall of civilisation or massive climate change.
The line of reasoning of those who are not doomers is that renewables will do the job - well, maybe, but we have no advanced society at the moment that substantially runs on them, other than hydroelectric where available and geothermal in Iceland, so we really don't know.
In any case, I am perfectly prepared to use renewables wherever they are practical and affordable, so the difference in opinion just means I have more alternatives.
The main point though is that risk assessment is always relative, and if things are as bad as you think the risks of nuclear are tiny by any reckoning against the catastrophe you feel will happen if we don't' have carbon-low power.
This is the reason given you (also given by me, perhaps others):
To which you "answered":
He pointed out in the second post that a primary issue was time, not just safety. This is not something you can't figure out, it is something you intentionally ignore. The point has been made to you several times. You have thus far refused to answer it. Your reasons thus far, if memory serves, are:
- I'm just not interested in talking about the issue en toto; I just want to talk about nuclear energy without regard to the constraints placed by current reality. (I paraphrase.)
- I don't like you. (I paraphrase)
To reiterate: the reason we place the question to you, and the reason the above-quoted poster has no interest in discussing this further with you is simple: if either short- or mid-term peak is the reality, your nuclear option is a no-go. Period. Given short-term peak (pre-2020) is by far the most likely scenario, your focus on this solution is tiresome.
Do yourself a favor and answer the questions posed to you. If you continue with putting your fingers in your ears and singing la-la-la's, you're going to find yourself increasingly marginalized.
Cheers
Eaun has asked us to take the debate to a separate thread, and therefore I will do so.
As a brief response, you have not demonstrated beyond any doubt that the time is too short and so it would be incredibly stupid to act on that assumption if there was even a 1% chance that this was incorrect, I would also point out that this goes beyond the normally accepted situation outlined by the IPCC and relies on the work of Hansen and perhaps others, but is no no means the generally accepted view.
Also, reasonably responsive dialogue is needed before there is any point engaging - in your present response you could not resist the opportunity for sarcasm, and I really can't be dealing with your attitude - if you want to stick to the point, great. If you want a response, try having normal manners.
I didn't actually bother reading your posts, as I found the attitude tiresome, and did not answer because I was unwilling to wade through the verbiage, and so was entirely unaware of whatever you were on about, not because you had made such an irrefutable point
Do yourself a favour, and drop the snotty attitude, you have already marginalised yourself.
I am not the only person with whom you have used this childish tactic. There are at least two others I have noted. You get your ass handed to you for ignoring valid arguments with the pretense that you have been treated uncivilly.
You are a joke.
BTW, your reasoning is idiotic. I haven't "proven" the short time frame? When the hell do you anticipate that will ever happen with any of the arguments we are discussing? We are discussing opinions in the end. We could agree on every technical point and still completely disagree about the overall topic and viability.
How do you not understand this?
Further, your logic is completely backwards: my stance has almost zero risk while yours is nothing but risk. The reasons have been listed before. Perhaps you can drop your persecution complex long enough to read them. And learn something.
Cheers
Agreed.
One example from Davemart above:
For all of Dave's holier-than-thou attitude when it comes to "debating", he is very big on childish statements like this and then dispensing random insults to anyone who disagrees.
Hopefully we'll see a better discussion of the risks of nuclear power in a dedicated thread, instead of having this stuff endlessly repeated on unrelated thread after semi-related thread after tangentially-related thread...
bigGav, if you must make comments such as that renewables can do the whole job of running the economy without the assistance of nuclear power, and then apparently not have thought through the argument in any way or have any back-up for your statement, then you can expect to be questioned on the basis of your claim.
All reactors, at least in the West are built with a containment vessel, and hence a explosion with the same result as Chernobyl is not possible, so long as the containment vessel does anything at all - it worked rather well at TMI.
Maybe you are right, Andre, but the thing is there really does not seem to be much advantage to operating on that assumption - I don't think that we will all carry on business as usual, particularly since we have delayed so much about nuclear power, but we might at least be able to run trains and so on whilst we build more capacity, both nuclear and renewables.
It still seems odd though that you should be so concerned with the possible problems of nuclear power, when they pale in significance against what you project!
You are talking about billions dying, and massive climate change I would guess, although you do not specify, so the risks of nuclear must be tiny in comparison, and isn't it worth giving it a go with all we have, on the off-chance we are not so doomed as you suppose? :-)
I've seen this kind of argument from nuclear supporters before. It goes like this:
Since the energy problems we face could cause widespread pain, why not try to avoid such pain by ensuring nuclear is brought in to fill the energy gap.
It's an appeal to emotion, though I've no idea if the proponents actually do fear for the condition of billions of people around the globe. The problem with appeals to emotion is that they aren't rational. Maybe it's impossible to find a totally rational argument for or against nuclear power but, for me, it boils down to this ...
We've seen what a reliance, and growing reliance, on finite sources of energy can do. Isn't this why we've got the problems we have now? The proponents of nuclear swear blind that there is an abundance of fuel sources and that we will never run out. Isn't this what we used to hear from big oil? A small group of people argue, and have researched, that the nuclear fuel source position may not be as rosy as some would have us believe. Isn't this how the peak oil movement started out? If we somehow plug the energy gap, how would we be positioned, in 50 years time, in terms of sustainability? There could be 9 billion of us. The global economy could have tripled. Resources scarcities could be facing us in all aspects of our lives (if they haven't already). Would nuclear have no environmental consequences in that time? Would we be well positioned to reduce our impact on the planet where we live, or not? Would we be facing even large numbers of starving people by 2060? There are many other issues, including those connected with the possibility of nuclear societies collapsing if the attempt to bridge the gap fails.
I've been a nuclear supporter in the past. Today, it just seems like totally the wrong solution.
Your argument against nuclear power could basically be made against anything that postpones hardship and tries to bridge a gap to a sustainable future with breeder reactors, solar power of fusion power.
The billions will hurt argument is not a good one since few can feel the difference between one hurting person and a billion hurting. One perfectly taken picture of one starving child moves people much more then statistics about a million dying. Realy trying to save billions is more about working with abstractions then feelings since we are not wired for it.
I dont know if I realy feel for the billions hurt if peak oil is handled badly and we dont do all good things that can be done like building more nuclear power. Perhaps I do it to a degree since I try to focus on other things like how to solve small parts of the problems.
My take on more nuclear power for a better future is that it would be good for us where I live and that we could export a lot of that benefit and that would help manny millions and the trade makes it possible for us to buy stuff we need. That we can provide energy and energy intesive goods makes it easier for other prople to solve problems.
Each reagion or country that do the same takes an additional part of the preassure and makers more resources available. This creates a positive competition instead of a fight for a shrinking cake.
This is of course bad if you are sure that we are doomed and that an immediate dieoff is the best "solution".
Magnus,
I find the whole thing happening just to the north of my home inHamburgh up in Scnadinavia encouraging according to your description, that with a good mix in 15-20 years you guys can make a sustainable future. You seem distressed about greens turning off the nukes in Norway and I would presume in Germany, as it reduces low C02 flexibility during the transition. This all sounds sensible. I appreciate noridc common sense as I do generally German common sense (being anglo saxon by birth and seeing how they are living off credit and how manufacturing is going down the tubes along with engineering /technical skills).
I would like to add however that Sweden, for example has not fought a land war for several hundred years and very little physical fighting occurred in the other scandinavian countries as well over that time period.
I wonder however what would have beenof any nulcaear power plants under such circumstances as described here in 1942:
http://en.wikipedia.org/wiki/Bombing_of_Hamburg_in_World_War_II
I think a sense of continuity of scandinavian nuclear power plants over a couple hundred years is based on the peaceful past of hundreds of years and arguably sensible given that past. Larger powers like Germany are more competitive generally and can expect to be attacked and to get more involved. Neutrality is unlikely long-term so that war is almost assured. Will another operation Gomorrah hit Hamburg ever again? Unlikely but who knows. If USA loses its global role (bankrupt, wahtever) and the EU falls to bickering again then with high European unemployment and / or inflation certain types of parties could come to pwower in France/UK/Germany/Russia causing similar European civil wars as have occurred again and again over the last centuries. Maybe Scandinavia will reamin isolated and neutral, but Germany is a transit land if not a participant in a major war, as it has always been one or the other. Nukes are not safe in central Europe inlight of future economic instability. I would not recomend it here, technically sound(see Dave Mart,etc.) or not.
Norway only have at least one research reactor but yes I am distressed about "greens" wanting to shut down nuclear reactors during global warming when we are close to peak oil.
Thinking about the possibility of running industrial sites during centuries and how to handle things in a multi thousand year perspective is probably influenced by the nuclear power debate and I like things that work well.
We have been extremely lucky to not have had any wars during the 1900:s and most of the 1800:s. Part of the luck has been that we have traded with threathening powers and been more valuble to them alive then invaded. We can provide other countries with wood products including chemicals and fuel and we can export electricity and electricity intensive goods but this only works well if nobody attacks us and trashes the effectiveness of our society. Our productivity and realpolitik value is not from more or less single point sources as in Irak.
If the world would becomes tougher I would very much like to have a lot to trade with and this also helps to stabilize our neighbours.
Would you find it a good idea to buy more power from Sweden?
Or to move energy intensive and man power lean manufacturing to Sweden?
Like with solar in the south and wind on the north sea an hydro where it occurs as well as large amounts of wood, these enrgy sources can be traded or used to manufacture where they areto resource poor areas like Germany. If the people in Grmany percive the political and milityry risk for nukes too high they should remove them and perhaps build twenty of thm on the arcic circle wher perhaps nobody is living and no armies can march to quickly and thn send cables to central Eruope (just an idea). At any rate wars always happen, just like technical mistakes. I just think nuclear has a too high level of need for zero mistakes over a too long period of time. We're only human after all. I jut don'T buy it. Thepopulation is getting older and will b poorer, maybe north Afrcians and so on will slowly "invade" Europe,etc. Who knows the future?
Indeed it could, if the attempt is intended to allow business as usual until the world's population is satisfied with its lot. Realistic attempts at sustainability start now, with powering down.
I've heard an alternative argument on this theme. There is some level of population that can be sustained indefinitely, and reasonably comfortably, on this planet. No-one really knows what that level is but let us suppose it is 3 billion, for the sake of argument. If the population decreases from here, we lose 3.7 billion people. If we artificially support an increasing population to 9 or 10 billion, we lose 6 to 7 billion people to reach a sustainable level. So which is the greater evil? To force a continuation of growth to hurt more people in the long run or to accept earth's limits now, knowing that it means a smaller reduction?
Now, that argument would be valid if the sustainable population is anything from 2 people to 6.7 billion people, and even up to about 8 billion people (unless we stabilise there). Only if one believes that the sustainable population is above about 8 billion would that argument start to make some sense but, even then, it requires fingers crossed that population will stabilise at between 9 and 10 billion (the estimates for the last 4 years have not shown a declining growth rate).
The indefinately sustainable population level must be extremely dependant on the technology level and the wisdom in the technology use.
It is a good thing to use better technology and live good lives with it while thinking and acting for long term. And this do not result in a power-down if you in a benign way can produce what other people need.
Unfortunately the wisdom in leadership and local culture varies, some places will be turned into garbage heaps like Naples.
If it were correct that we would run out of uranium and thorium after about 50 years or so, which I do not accept as remotely likely, as it is utterly unlike oil and gas and is not a rare material only produced under specific circumstances, has a very low cost for finding more resources as opposed to the very high one for oil and gas and is very energy dense so you don't need much of it to produce a lot of power, in short it is the opposite of constrained oil and gas resources in just about every way, even if this were the case, those 50 years could be invaluable.
Whilst I think that renewables are far too immature to take the strain of running the whole of society in the immediate future, I am sanguine that 50 years of progress would radically transform the situation.
So in other words, if it did nothing else, nuclear power would tide us over.
There's your problem. That has not been demonstrated. There are large available resources of nuclear, wind and solar. We just need to transition our energy infrastructure.
It is possible that we will not do it but I think it is unlikely. The urge for survival is too strong.
aangel-
Re:
The economist Nicholas Georgescu-Roegen addressed your last blunder above - in terms of entropy (which determines natural energy flow) - in his book entitled The Entropy Law and the Economic Process
Skip
Hi, Skip. Thanks for that. I may check it out but had you seen what the sole one-star reviewer at Amazon said? I checked out the reference he gives and indeed there seems to be a shift away from entropy as disorder to simply entropy as 'leaking energy' (my term).
If you think the analysis stands despite Lambert's efforts to propagate a more accurate explanation of entropy (http://www.entropysite.com) than the one Georgescu-Roegen uses (and that everyone else uses, including me until I just read Lambert's work), I may pick up the book. Otherwise I'm very satisfied with Ayres' and Warr's paper.
-André
Well, you don't know me from Adam's Housecat...
...but the ninth reviewer (and Lambert) are lacking in depth of understanding of entropy.
However, do not interpret the above to mean that I accept the definition of entropy as, simply,
*disorder*.
I do not... perhaps chemistry texts define it such - but that could be one reason that so many chem students are poorly educated.
Skip
Hi Andre,
Thanks and just chiming in to ask if you received an email from me and/or could you possibly get in touch? (Mine is listed.)
The idea of wealth at all is unsustainable. I know it sounds so very "Red", but it is inescapable. Both usury and the pursuit of profit lead to unlimited growth and poverty. Do I expect this to change? No. The 20/80 rule has always applied and likely always will. It's a matter of human nature. But, any sustainable system must do away with both of these ideals and/or accept the inevitable cycles of rise and fall, build up and collapse.
I first had the epiphany that led me down the non-acquisitive lifestyle I lead when I read The Forgotten Door by Alexander Key. There was a single line in the book that not only encapsulated the essence of the values the book espoused, but put into question the very nature of the current paradigm. For me it was a Socratic moment, with me in the role of the student.
The protagonist, after his benefactor marvels over the value of the gems in the hand-made knife he carries, and confused that his knife might be more than a tool lovingly made and used, he asks, "How can a thing have two values?" (May be a misquote.)
Great question. If I wasn't an idealistic little twit before reading that line, I certainly was after.
Cheers
Ya think?
I would have to say that is a bit of flabby analysis. The profit motive has turned out to be the most relible way to motivate people. The threat of poverty also helps. If you really think "the idea of wealth at all is unsustainable" then why do you not expect it to change?
Given the way the world has developed in the last 50 years I am not betting on the Marxists.
I am not sure that the term sustainable in this context means infinite. It might mean that there is a source of replenishment to the stock of energy. If it took a long time to create the coal field, nothing is really replenishing it in a short time frame. If you consider solar, the sun will continue for a long time and every day that your part of the earth faces the sun the energy is replenished.
Hey JD, a post full of cheers for 'Olduvai Duncan', whom you despise and consider a crackpot, and you just drop by to say 'Let's get to work?' Come on, man, put in the boot!
Not only that, JD once referred to de Sousa as "the stinky liar."
Luís, good post - many thanks for all the work (incl. Euan).
Several pieces caught my attention, but this in particular:
Can you already now explain shortly why?
Does this mean in your model, that district heating through combined heat & power (aka co-generation or tri-generation) would see a ramp down?
Granted, the past 10 years have not been so good to district heating markets due to rising temperatures and this may continue to be so (the end of the warm cycle in northern hemisphere soon will let us find out).
However, from the point of view of energy generation efficiency and existing infrastructure, I'd think that co-generation would at the very least stay where it is at now, or increase.
This would mean that heat would remain an important vector for residential energy use in those countries that already deploy it, and that 'everything electricity' scenario wouldn't be as plausible everywhere.
Or did I misunderstand what you were trying to explain?
Ok, SamuM let's try to make it more clear:
Co-generation requires a heat engine. Now, from the four alternative sources considered above only Unconventional Coal can provide you that. I'm not saying that co-generation will disappear completely during the period we analysed, but it will possibly loose some of the importance it has today.
Electricity seems a straight forward answer because it can serve all energy sources we considered. But especially on Transport, electricity poses itself today as one of the best candidates to replace oil-products. Why? Because the main advantage of oil based vectors is their volumetric density. Hydrogen, ammonia, and other light molecules are today just dreams.
But this work is still under way, so please wait a little longer and continue checking TOD:E regularly.
From the four alternatives showed, only wind does not have a heat engine. Solar may have or not depending on how it is implemented, nuclear and coal eletricy generation are based on heat engines.
Again about solar, the best ROI, EROEI, and efficiencies seem to be reached from heat engines nowadays. Altought that may change on the future.
District Heating & Cooling
In the near term Heating and Cooling Districts, given sufficient density, diversity and proximity, of thermal and power loads can susbstantially increase our yield from natural gas from 50% (aasuming combined cycle less T&D losses) to 80%+. A Smart Energy District,one where indvidual building automation systems are clocally monitored and managed, can dynamically shed and shift loads and susbtantially reduce generation. At the ssame time, this becomes a cost-effective means to incorporate geothermal, solar thermal and PV at a scale that is more economic than it might be for individual buildings (for example, well-spacing distances would be insufficient for large buildings in a dense urban setting).
Luís, I understand how co-generation and Carnot heat engine works.
But I'm afraid I cannot understand how the scenario envisions we will go into less efficient power systems, by abandoning co-generation and moving to pure electricity generation from the primary fuel heat engine process.
There is no way to capture as much energy from a BTU of heating oil/natgas/coal to electricity vector alone as there is to electricity+heat combined (i.e. co-generation).
This was the point that I tried to make and I am still quite baffled how any energy company would :
- abandon existing paid-for infrastructure (co-generation)
- go to less efficient energy conversion systems (pure electricity, which has a lower total system conversion efficiency, thus increasing their fuel bill and decreasing their sold energy output)
... especially in a world of starving primary energy fuels & restrictive emission cuts.
So, going for all electricity infrastructure: currently I see this as theoretically possible in the very long run, but not yet very believable.
I agree on the issue of coal. It looks like the only source for now that scales up. Solid bio-fuels, bio gases and energy waste are for the most part niche fuels in OECD countries.
Which is also what I'm afraid of. Coal is too cheap, too readily available, with existing plants, with working markets and it we know how it works providing base load electricity (unlike wind/solar, which in many parts of the world are still seasonal/intermittent and provide a challenge for demand load balancing).
I also agree on the electricity vector (in some carrier form like chemical batteries) providing the bulk of the transport energy need.
However, when we hit primary energy fuel crunch, I'd be surprised if we didn't try to make every last bit of BTU count from every drop of fuel we burn.
This would necessitate using excess heat from the heat engine that the electricity generation cannot capture and try and capture it into another, lower quality form. For transport I can't be sure what this could be, but perhaps compressed air storage would be a possibility (heat->pressure exchange).
However, this doesn't change the big picture in your scenarios, that I agree on.
SamuM - I'd understood this somewhat differently to Luis' explanation. My understanding was that all energy sources were rebased in electrical equivalency to ease comparison. TWh is easier to use as a base than BOE when comparing wind with gas for example.
With respect to my opening comment up top I see energy efficiency as the main driving force behind energy policy. Thus, combined heat and power reported to have 90% efficiency must be expanded to replace large inefficient coal fired electricity only plants which are 30 to 45% efficient. This doubling of efficiency halves your CO2 per unit energy. In effect, in the UK you would displace the gas fired domestic central heating boilers - saving gas and CO2. So why is this not happening everywhere? I'm writing this up today.
Ah, ok. Then I misunderstood. That would make sense.
At this point, I'm concerned about the use of nuclear weapons in the not-so-distant future. The global military apparatus will not be marginalized, it will go out kicking and screaming.
the efficiency wedge implies i have to be sleeping right now (0100) instead of reading TOD! ;)
if everyone surfed only during daylight, that would save at least 5% of our energy usage... (lighting/cpus)
Do the authors think that if we can somehow rise to this challenge and smooth the way down to 5 boe/person/year, that our collective societies will have no further resource problems? Are other resource (in the broad meaning of that word) problems likely to kick in and derail any efforts to address the energy problem alone?
I've read some optimistic opinions that resources are just a matter of energy (and substitution). If so, isn't it likely that one or more vital resource will draw more and more energy to ensure its availability, thus rendering the 5 boe target obsolete as a measure of what can maintain a reasonable lifestyle by 2100?
Nice work, by the way!
Guys,
A great deal of very interesting and thought provoking workd, thanks and well done!
Clearly we need to begin a economic, social and cultural realignment of our civilization as a priority, and soon. Yet I believe this will prove far more difficult than most people imagine or hope.
We are talking about fundamental, structural changes in the way we organize society on a global scale and first and formost a radical change in the way we think, our ideas about the world, and a redistribution of wealth and power on a far more equitable basis. We need more democracy and political reform in order to engage people in the necessary changes in consumption and lifestyle which are so urgently required. I believe we could 'cut a deal' with people; less consumption of crap, in return for an increase in democratic participation and control over there one lives, not 'more' but 'better'.
However, this will bring us head to head and into conflict with the fundamentally undemocratic and hierarchical structure of modern corporatist/capitalist society. This is a big problem. We are talking about confronting and defeating a set of socio/political/economic ideas that have dominated the western world for a least thirty years in their most extreme form.
Such a 'counter revolution' is going to be very, very, difficult to achieve. Yet all over the world there is a feeling that we have been moving in the wrong direction. It's wrong to underestimate the latent 'revolutionary' potential contained in the populations of many countries, and not just the poor ones.
However, it would be a fundamental mistake to underestimate the opposition to fundamental change from those sections of society that benefit so disproportionaly from the current socio/economic paradigm. The ruling elite will not sanction reforms that threaten their hegemony and rule, pleading with them that it's in their own best interests too, unfortunately won't work.
Their answer to the energy crisis is war and occupying the countries that contain the resources we reguire to maintain our way of life, which is really a way of death. Think if the 3 trillion dollars wasted in Iraq and Afghanistan and the 3 trillion dollars wasted by the other nations involved, had been invested more wisely. 6 trillion dollars in alternative energy sources, conservation, efficiency drives, energy education programms, better insulation of homes, an alternative, integrated, transport strategy... 6 trillion dollars could have made a real difference and put us on a pathway to change. Yet we've pissed it all away in the sand and are likely to continue and accelerate down the road to disaster, unless we take control of the fundamental heights of society, break the power of the aristocracy and change course.
Peak Oil and Peak Fossil Fuels in general are fracturing events. This kind of events are always, and will always be, used as pretext to put forward ideological agendas.
TheOilDrum has no ideological line behind it, and considering the multitude of backgrounds of the different people involved, I'd say it is pretty much shielded against any attempt of high-jacking.
Dear Luis,
I appriciate your work, but I don't believe I was using Peak Oil as a 'pretext' for putting forward an ideological agenda, and I certainly had no intention or even desire to 'high-jack' anything. I thought I was just desecribing the world as it is!
As a rather well-off and successful 'champagne anarchist' I and my family are going to be shielded from the worst effects of Peak Oil, climate change and societal breakdown, for a long time, and if things deteriorate substantially we'll just immigrate to New Zealand or buy some land in Argentina, which I've been seriously considering of late.
So I benefit directly from the current, grostesquely unfair, wasteful and environmentally unsustainable corporate/capitalist system. I detest the way we worship the market and have washed our hands of responsibility for its destructive effects, concentrating exclusively on the positive aspects. What bothers me is that it isn't sustainable in the long term. I also have problems enjoying my success when so many people are starving and living in abject poverty. I feel this deminishes me as a person too. Hegel felt the same way about slavery, as an institution it simply corrupts everyone involved, though some more than others.
I think rampant, unbound, turbo capitalism is doomed. I wish it wasn't as I profit so handsomely from the world corporate/capitalist economy. I'd like my children and their children to live as well and comfortably as I have, only it's not possible, or the price we pay is going to explode. I'm worried about the consequences of its death throws and what eventually might replace it. I'm not really happy with the idea of sending armies of our 'peasants' out to fight wars against other 'peasants' over scarce resources, just to keep me and my family in luxury, though I've met influential people, the Davos crowd, who don't agree. They think our foot soldiers are just stupid, ignorant, brutes who need to be herded off to war every now and then, rather than let them hang around getting into mischief and worse.
Politically I consider myself to be very pragmatic and non-ideological. I'm not really a very dogmatic anarchist. My wife's family are 'fallen' european patricians/aristocrats, but rather cynical about where the money comes from. Once they owned slaves. Because of my very priviliged position I can stand back and observe the system from a 'neutral' perspective.
I'm very cynical about it, and its ability to change very much. I wish it wasn't so, but alas.
I am, however, an implacable critic of the present western ruling class and the system which serves them so well, believe me, it's far beyond what they deserve. At the very least we need a good shake up and an infusion of new blood into the ruling elite. It has become fossilized and is full of enetia. These are people who are currently squandering six trillion dollars on grostesque, imoral, insane, imperial wars. I only mention my complete disdain for the ruling 'aristocracy' because I wander in and out of these circles and I have observed nothing that leads me to conclude that they have any sense at all of the real magnitude of the challanges we face, or have any idea whatsoever of what to do about them!
Changing society and implimenting the necessary 'reforms' is going to be a real uphill struggle, especially with the current crop of leaders who are in charge of the world. Waste six trillion on stupid wars, they can do that, but use these resources wisely, no way! Think about it for a second, we have leaders who can piss away trillions on war, yet they cannot even tackle world hunger at a time of unrivalled prosperity! What does that tell us about them? Are we really supposed to believe they are capable of addressing the far greater chanllanges of Peak Oil and Climate Change? I remain to be convinced and I am sceptical in the extreme.
Of course one can argue that precisely because Peak Oil and Climate Change will also effect them, that they have an interest in finding solutions to these monumental problems. I doubt this very much. I believe their 'solution' will be more war and violence directed at the poor, making them pay an obscene price for our gross over-consumption. Make no mistake, we will go over the cliff edge unless we change, any fool can see that much surely?!
I hope this doesn't sound too 'political'. It wasn't meant to. I was just trying to examine the socio/economic obsticles to change realistically. We won't deal with the problems we face unless we change the way we organize society. We need an alternative economic paradigm. Now whether this will actually happen, whether it is possible, or even diserable, given the collosal wealth, economic and military power of the 'ruling class' is very debatable and 'political'. I was just attempting to point out that implimenting structural reforms to the way we do things, isn't going to be easy or without cost. Especially now as we enter the twilight of the 'democratic' age, and the shadow world of brutal, raw power, once more.
I would advise you to move now while your money is worth something. A very large fraction of New Zealand's population is overseas and will be coming home if the shit hits the fan. If you aren't already in New Zealand, you won't be able to move there for any amount of money.
The the environmentally destructive effects of our current economic system and the potentially huge social discontinuities which might be brought about by resource depletion have been evident to thinking people for many decades. The fact that even with the evidence for global warming and fossil fuel depletion becoming stronger every day no intelligent strategy for dealing with the problems posed by human economic activity has emerged is a reflection of the underlying structural nature of our economic and political system. To claim that narrowly focusing on technology and ignoring larger social issues puts you above the fray of political ideology is complete nonsense. By refusing to discuss issues of political and economic power (They cannot really be separated.) you are effectively promoting the ideology of the dominant culture which (in my view) is dragging us down to destruction. Would a person who criticized the Roman power structure rather than concentrating on how to conscript more troops and slaves to shore up the declining empire have been guilty of pursing an 'idealogical agenda'?
http://en.wikipedia.org/wiki/Albert_Speer
I really appreciate the honest research and hard work that Luis and others do on this web-site. I re-read the original Olduvai Gorge theory and the original premise about the third phase of civilization: "...de-industrialization phase...limited by the exhaustion of limited non-renewable resources and continuing deterioration of the natural enviroment".
I'm with writerman, I can't be optimistic about our ability to solve the problems in an energy scarce world. In a democracy the status quo will always move to disenfranchise. When circumstances thrust events upon us we might or might not adapt but humans are evolved to deal with the "tooth and claw" not obscure speculations about the future.
I am building a web-site www.lasvegasthecrash.com
based on the notion that Las Vegas NV, Americas shadow capital, will be the first city in America to fail. I base my predictions on A. Las Vegas being a zero sum economy (they produce nothing) B. geographically isolated C. overextended local resources (particularly water)
The question I present in my web-site is: Will a far poorer American economy, with the end of cheap energy (particularly gasoline,)continue to swarm to Las Vegas NV via roads and Jet travel in sufficient numbers to support the massive infrastruture that is Las Vegas.
I think not...
I grew up around Las Vegas and I have seen booms and busts come and go but I wager that this bust will be of a scale that will be unprecedented.
Joe - I think you are spot on with Vegas - apart from one minor detail - the neighboring Lake Mead and Hoover dam which churns out a vast amount of electricity. Part of Roosevelt's post depression new deal I believe. Its just a pity no one came up with a better idea of how to use all that dirt cheap electricity. Vegas sure is a lot of fun though:-))
On a more serious note our UK politicians are always harping on about expanding tourism. Its about the only "industry" they harp on about endlessly.
So when they breathe in its tourism, tourism, tourism. And when they breathe out its CO2, CO2, CO2.
Meshing social and political agendas with the harsh reality of energy decline is not an easy task.
I agree that Vegas will return to dust.
I think that the Vegas/Hoover Dam issue is analogous to one that we will see play out repeatedly (in the US & elsewhere) over the next few decades.
The US Bureau of Reclamation owns Hoover Dam (as well as Flaming Gorge, Glenn Canyon, Davis, & Parker Dams that constitute the "Colorado River System"). The primary purpose of the system (including the primary purpose of Hoover) is to provide water for industrial agriculture to the states that are members of the Colorado River Compact. The secondary goal of hydroelectric generation works well when there is plenty of water in the system to meet commitments. However, the water from the Colorado River is overcommitted (the allotments to the states was set at a period we now know was an anomalous wet period), and this is becoming especially problematic as Colorado is now planning to take their allotment under the compact (they have not previously, as there is little population in Colorado West of the continental divide, but now there is massive water needed to invest in things like coal-bed methane recovery, not to mention the water need should people begin to exploit Colorado oil shale).
Bottom line: Vegas has one of the modern civil engineering wonders of the world sitting right next door, that is capable of generating huge volumes of water and a fair amount of electricity. However, the politics of that system are not under their control, and the demand (accompanied by the legal/political weight of California, etc.) for water will likely begin to compromise the ability of Hoover to generate power sufficient to meet the needs of Las Vegas. Maintaining water levels behind Parker and Davis dams (downstream from Hoover) will take priority, as those are the irrigation diversion points (which function only at sufficient waterboard levels) for California and Arizona agriculture. If, as many expect, we have entered a period of long-term drought in the western US, meeting the primary commitment of the system (irrigation) will compromise the hydroelectric potential.
None of that really undermines your conclusions re: Vegas, which which I agree, but I think the irrigation/hydro problem is interesting. The Majority of the major dams in the western US are set up similarly--irrigation is their primary legal commitment, and hydro is second (to include Grand Coulee, which is the largest hydro generator in America).
Jeff - thanks for your well researched insight into the "politics of water" that is moving at a speed noone could have imagined ten years ago.
Currently in Las Vegas the municipal water authority has just passed a rate hike of 36% for water customers. They have also approved a 2 billion dollar pipeline to siphon off the Great basin Aquafier. The Great Basin Auqaufier is the last unspoiled area in NV and is the remanants of the last ice age retreat 15,000 years ago. The ecosystem is one of the most delicate in the world. The estimates are with NV draining 20,000 acre feet of water a year it will deplete Great Basin in 7 years.
But in the the cash is king world of Vegas fish and raptors are "fer huntin' and fishin'". They don't carry much "juice".
Las Vegas gets only a scrap of the energy out of Hoover Dam. CA gets almost all of it. You have to remember that when they built it (with federal dollars) Las Vegas was a dusty little town of drifters and grifters not two million plus. They recently built a solar generating station north of vegas that is generating enough energy for 72,000 homes. Nevada as a solar source is unmatched. The biggest problem for Vegas is water.
Interesting piece; you've shown so well why we are all headed down the Road to the Olduvai! Great job! Duncan is vindicated.
Perry
I'm puzzled that two graphs show coal peaking about the same time as gas. However that could be plausible if the world economy hits a plateau driven by oil and gas shortages while political conditions make it difficult for coal to fill the gap.
More specifically I think existing forms of coal use will be surreptitiously increased (out of sight, out of mind) while well publicised new forms (CTL, ICG) will be condemned. As an example of sneaking increase Australia's new government is speeding up railways, new mines and export terminals for coal while talking tough on GHGs. So far Joe Public hasn't noticed.
I also think ICG may be overhyped as a way of getting at low EROEI coal. Experiments to date seem unconvincing plus it seems implausible that scrubbed CO2 can be reinjected into the same coal basin from which the producer gas was created.
RE: Coal
People frequently forget that when one type of resource becomes too scarce/expensive, other resources are used as substitutes. Thus, as oil and NG peak and decline, people will turn to coal as a substitute. This is why a mere extrapolation from present levels of usage is unrealistic.
If we look like falling off the olovidi cliff nobody will be much concerned about co2 emissions, exept those middle class hippy types who eat lentals. If people think greens are endagering their survival they will be strung from lamposts.
you talk about "stringing" greens up fairly often
in my worldview, the first up against the wall are those who denied AGW, who ignored the pleas of "the Greens" to reduce, recycle and reuse, who squandered the resources of the planet and in the process polluted, poisoned and used up what we were given - how about Westexas' Iron Triangle - who continue to promote endless growth and a "everything is fine, keep spending - go big" mindset? You don't think those folks should share the blame? It's the GREEN'S of all people who are to blame?
keep in mind the violent protests at events like meetings of the WTO or burning down ski areas or spiking old-growth redwoods weren't Humvee owners angry at the cost of gasoline...
but this kind of fingerpointing is destructive and pointless - but very indicative of politics and mindset, we'd be a lot better off trying to convince people to conserve, insulate and put up solar arrays than sitting here fantasizing about which particular group should be the first to be blamed and suffer the consequences
Can I just point out again...
These mathematical models take nice, steady state, uniform views of human systems. But guess what, it's the unevenness, the human dimension that governs what is really likely to happen in reality.
Take exportland as an example. Taken as a global whole the decline rate could be considered to be gradual and replaceable (as shown above). However when nationalistic and commercial concerns are bought in, we arrive at precipitous rates for some areas and growth in others. What price mass construction projects if fossil fuel availability is declining at 20% pa nationally? Are you going to focus on energy efficiency when there is no food?
I think we really do need CAS/agent based sim view of this to make sense of future scenarios and planning. We need a Peak Oil Wargame to explore the human dimension to potential decisions.
Somehow I think that's already been done behind government doors.
I completely agree. If the rest of the world increases their per capita energy use closer to that of Europe or the US, the peak could get earlier and the downslope could get steeper. That's exactly what the rest of the world is trying to do. We saw the Tata Nano, right here in the oil drum, just 10 days ago!
Garyp, I had to scroll down this far before finding a comment about the effects of the human factors on the decline of world energy usage per person. Thank you.
Any projection that leaves out how humans will react to shortage is not complete. I am not trying to diminish the fine work that went into the 'New Olduvai Projection' by all who contributed, but to project a future course for energy consumption I think that a look back at how humans have reacted in the past to resource constraints should be part of the projection. Of course, no two situations in history are quite the same but there are plenty of situations to draw upon to get a good idea of how various populations will react to energy constraints.
In my estimation, as resources are constrained a series of wars will insue. Wars effect economies, economies effect attempts to diversify energy sources. If the current US deployment of hundreds of bases around the world, while fighting several different conflicts, is not a good example then I would be hard pressed to present one. Does anyone on TOD think that the US military machine is going to sit idly by while their funding is transferred to PV, wind turbine manufacture, etc.? An understanding of our history reveals what brought us to the place where we are...A look back at our history can help remove the veil that partially obscures where we are going...and, combined with an understanding of human nature, will help us to understand how the future will likely unfold.
Tremendous work - many thanks!
A couple of notes:
The figures on energy efficiency do not include Japan, which is a large enough player to affect the overall results, and whose high energy efficiency perhaps indicates where the rest of us can hope to be within a reasonable time span, especially high density countries like China and perhaps India.
It would also be useful, if the figures are available to distinguish how far different economies have moved from FF economies already - ie France is a considerable way down the route of moving away from FF already due to it's large nuclear fleet, so the energy use includes more 'good' energy and less 'bad' energy.
So in essence what I am asking is if it would be possible to indicate how far down the road different countries have got, and to show one of the leaders, Japan.
As an aside it should perhaps be noted that the Canadian CANDU reactor is already able to burn thorium, so it is not 20 years away, I understand.
Thank you for questions.
Japan generates 1760$ per boe, you can check these figures for all countries listed by the BP Statistical Review in Annex A.3 of the spreadsheet. Table 3 list the countries that presently generate more than 2000$/boe yearly plus a few others for reference.
Those 20 years is a ballpark figure that is usually what a new energy source takes from entering commercial production to reach 1% of the market. That's what happened with the first generation of Nuclear reactors.
Thank you for the response - the figure is not as good as I expected from Japan.
I wonder if you have any comments or links to offer on the second part of my question, regarding present energy mix of renewables and nuclear to FF?
It would give us some idea of how far different countries have to go, although the figures might be difficult to access.
You could always go and browse the BP statistical review on that matter, but in my opinion the GDP/boe figure is a good proxy for that.
We at TOD:E have this old project of having a thorough energy assessment state by state where that and other questions will be fully answered. We are working on it, so keep in touch.
Thanks for your efforts to keep up all informed - I will look forward to the figures you get when they become avialable.
Absolutely great work ! Applause, applause ! Gives an excellent sense of magnitude and scope of the problems we face.
Now, the devil is in the details, as always... our world is a very complex place, it will be very,very difficult to implement what looks so clearly put together here. But evidently, if we don't act yesterday, ouch big time !
A small quibble - the number of units assumed factors in the largest size of wind turbines currently in use, around 3MW on land and 5MW at sea.
Currently the largest nuclear plants are around 1.6GW, not 1GW, so perhaps it might be argued that that is the better figure to use, as it would give a better 'feel' for the numbers involved in each field.
Of course in future turbines might get larger, but annular fuel and so on could also increase the output of reactors.
I would take at least 1.5GW as the size of plants to be built. Even that might be low since there has been a continuous process of increasing the output of existing plants. They are likely to be built with 1.5GW rating but produce more on average during their actual lifetimes. Certainly 1.0GW is too low.
Using the BP statistical review I got a ballpark number of 0.8GW per plant. Naturally this number is affected by uptime, but I wanted to reflect present standards.
1 GW is just a reference number, you can always change that in the spreadsheet and see what happens.
Your number represents averages that include a lot of small, older plants, some built in the 1980s. In recent years the nameplate size built has been around 1.0GW. But the models the are now on offer have rating in the range of 1.0 to 1.7 GW. And as mentionned before, not only are uptimes improving but many reactors have had their output boosted well beyond their original ratings, a development that is certain to continue. So projections over the next 92 years will all be the reactors now on offer or larger. I do not see how including 1980s reactor sizes is relevant for projecting the next 92 years. Are you basing your wind turbine capacities on 1980s technology?
OK, so you had to pick a number. I am using 1.5GW.
How do the resource figures used for the different FF sources compare with the figures used in the IPCC climate change forecasts?
Are the carbon emissions assumed to be above or below the IPCC forecast levels?
Thanks.
That's a question in many people's mind.
They don't exactly compare, the IPCC scenarios are on a completely different level where fossil fuels never peak:
This graph was published in article by Kyell Aleklett but it was likely produced by Jean Laherrere.
You should also check Dave Rutledge's post on that matter.
Interesting! I am familiar with Dave's work.
So in your scenario's too, CO2 levels never reach even the minimum level of the lowest hypothesis for change of the IPCC figures.
I rather disliked the almost religious certainty of some of the people who were arguing that GW was indisputable - they seemed to discount the possibility that the assumptions were mistaken too readily, and a lot of dodgy methodology was employed - they tended to have the same people assessing the work as producing it, I understand, if I haven't been lead astray by some of the nuts opposing the idea of warming.
Your scenarios look very hopeful, although tricky to pull off in the short term, with an easily conceivable build, and GW problems greatly mitigated.
In the UK, for instance, even for an all nuclear scenario, you would only need to build around one reactor a year.
It is perhaps worth pointing out that if the non-FF build is continued at a high rate into the back-end of the century there is no reason on the figures why everyone on the earth should not have an energy rich future, instead of many remaining at the relatively low levels they have at present.
I think the UK has to do a lot more than that.
We are facing terminal decline of North Sea oil and gas. We are closing our aging nuclear reactors at a rate greater than one a year. Most of our coal reserves are tapped out, although we have some room for short term growth. When it comes to renewables, our government is all mouth and no trousers. We have excellent wind and tide resources, not so good for solar, but local and government blocking has reduced build rate to a pittance.
We are more energy efficient than the US, but we are just as indebted, just as bankrupt. We will be very hard pressed to find the capital necessary to invest in sustainable energy sources before we go into catabolic collapse.
Don't get me started on UK policy, or the lack of a coherent one.
I was talking longer term here, not addressing the monumental cock-up the UK has made of current supplies.
We sold surplus oil at $35 barrel a few years ago, and are now buying it back at $100 barrel.
That about says it all.
We have 3 million grade G houses, the lowest insulation standard, but no constructive policy to do something about it, or the further 9 million grade F homes.
We have a massive gap opening in supplies as the nuclear plant gets retired, but they want to screw around for about another 4 years in authorising reactors which are already approved in other advanced economies like France, Canada, and Finland.
Since we have lost a build capability of our own, we will then go to the back of the queue awaiting French help to build our reactors.
Solar in my view, other than residential solar thermal, which again the government is doing nothing to promote, is an expensive waste of time in a country with the long winters and short days you have here - you pay a fortune, and still don't get the energy you need when you most need it, just produce energy with little use in the summer, as we don't use much air conditioning here.
The cost of the proposed off-shore wind build is now estimated at a staggering £66bn, and the 33GW nameplate will actually produce on average only around 10-11GW of real power per hour, as the wind don't always blow.
It does track use quite well, but just the same for that money you could have around double the nuclear power, IOW the whole of the UK base load.
Alan from the Big Easy has got me convinced that since the Government is doing effectively nothing for conservation, they have got us in such a hole that we will have to fork out at least part of that ludicrous cost.
Just one comparison to show what a bunch of morons our masters are:
We generate around 20% of our electricity from nuclear power, and that is being retired without means of putting more in place in a timely fashion.
France generates around 75% of their electricity from nuclear, and has some of the cheapest electricity rates in Europe and will certainly replace as needed.
So how come France plans to install 5 million thermal solar heaters in the next few years, and is already installing 50,000 air source heat pumps a year, whilst our hero's do effectively nothing?
Gordon's plan for the third world is obviously to join it.
Sort of. I believe the full top secret plan is.
1) Re-nationalize BP
2) Church of England to accept Islam as the One True Religion. Archbishop of Canterbury to become Ayatollah Williams.
3) BP handed to Iran (well they've always wanted to get back in!) in return for promise they will supply us oil/gas.
4) That's It!
Not quite true, although I agree with most of your comments, I got £400 from central Gov + £1000 from local Gov to install passive solar.
I would assert that GW is indisputable — it's the magnitude of the impact that is worth spending time examining.
On one hand, the six degrees above normal may not happen because there seems to be insufficient accessible carbon in the earth's crust to create that. On the other hand, almost all the impacts that were expected to happen at a two degree temperature rise are happening much, much sooner.
The picture that is forming is that the impacts are happening sooner and of greater magnitude but we may avoid runaway climate change if we can keep the positive feedback loops in check. Don't forget that we're still going to burn the other half of the carbon we can easily get.
-André
This is where the work done last year on climate sensitivty is so important. Some are running around saying, as you pointed out, that there simply isn't enouh carbon to make these scenarios reality. Hansen, et al., show that the sensitivities are almsot certainly much greater than we thought. If accurate, and current evoidence says it is, there is more than enough carbon to blow past 2 or 3 degrees and into the unlivable ranges above that. In fact, they say we have to go backwards to 350 just to maintain 2 degrees, let alone arrest levels at 450 or more.
http://www.columbia.edu/%7Ejeh1/East-West_070925.pdf
Cheers
Did you consider the methane from permafrost and in frozen form on seabeds?
There do seem to be significant upside risks for GW, even if the future FF burn of man is not as high as the IPCC has projected, with trigger points and so on perhaps being passed.
For energy security we should anyway move on from Fossil fuels as rapidly as possible.
In the UK, for instance, even for an all nuclear scenario, you would only need to build around one reactor a year.
No, you have to finish one reactor a year. Since they take 5-7 years to build, you have to work on 5-7 reactors a year. Since you're in this alone, you also have to build the factories to manufacture the piping, heat exchangers, switchgear, the what-have-you, from scratch (because it doesn't exist worldwide). Does the UK have the engineering, manufacturing, and construction talent to do that all at once?
Quite clearly it will take time to ramp up to a build of one reactor a year, which is why it is a crying shame that the last few years have been wasted.
At a guess, and it is only that, if we say 6 years to build a reactor, we might be able to start construction of a second about two years after the first, as presumably the work would separate into phases and the staff who had began the construction of the first could move on, perhaps spitting into half experienced and half new staff, so you might also be able to start a third.
A similar process might operate later in the build, and so you might reach the rates you correctly postulate after around the time of completion of the first, in six years or so.
We would certainly be trying to get critical staff from France, bringing people back from retirement and so on.
Previous major nuclear builds such as in France have operated to this sort of time schedule.
Climate change science is a complex blending of disciplines.
To begin you have THE ECONOMISTS: They create economic models that consider resources as infinite for all practical purposes. Specifically, the IPCC has a set of models by various economic research groups called Special Report on Emissions Scenarios (SRES). The amount of fossil fuels assumed available by SRES is based on a single review paper published in the late 1990s by a single author (Roger). These models yield changes in the atmosphere over time and are handed over to the next group of folks.
THE CLIMATOLOGISTS: They put the emissions into models of climate change and in total are called Working Group I in the IPCC. Purely physical models, no socio-political ideology behind them. Where they are lacking is comprehensive understanding of delayed feedbacks in the Earth system from melting permafrost, loss of ice sheets, ecosystem disruptions, etc. They do get the short-term feedbacks amazingly well. Once the temperature and precipitation outputs are available from the climate folks they hand the data off to another group...
THE BIOLOGISTS, AGRONOMISTS, FORESTERS, ETC.: This is where it starts to get scary...because these folks basically try to comprehend the consequences or "IMPACTS." They are piled into Working Group II in the IPCC. Now what is "funny" about it all, is that the Working Group II reports read like "Hell on Earth" but the SRES reports read like "The March of Progress!" In systems modeling this is called "unresolved tension" and ideally the modeling teams work together an apply feedbacks that bridge the tension. But the IPCC is such a big undertaking and the implications are so unsavory that this is not happening.
Even worse...the IMPACTS are happening much sooner than expected or "100 years ahead of schedule" according to folks measuring ice. So, don't think we can just smile and read this fine report or the great work by Dave Rutledge and stop worrying about climate change. Peak fossil fuels may limit human driven atmospheric change to 450 ppm of co2, but that is almost certain death for the planet as we know it.
And don't forget: No planet, no sex. No planet, no money. No planet, no grandkids. No planet, no hot rod cars!
Maybe Writerman can get that message across to the Davos crowd. I agree it may be in their hands.
Dave, this is a pretty sensitive issue right now and I am writing a separate post on it. We needed to get this one by Luis out of the way first.
I have a scenario from Chris Vernon attributed to Jim Hansen where he has coal production trebling from current levels by 2077. If there is indeed that much coal to burn then I wouldn't be so concerned about energy decline.
Don't really want to get involved in another climate debate here - and so suggest we defer that discussion until next week.
No problem Eaun - I agree that there is plenty to digest here without straying too far into the climate debate, but they do help to give for me a very hopeful tinge to this post, with mitigated GW and an easily conceivable build.
It is perhaps difficult to get our heads around the numbers for a solar or wind-turbine build, as they are must so large with thousands of kilometers of solar and hundreds of thousands of turbines, but we can perhaps easily see that it happening from the nuclear build - if we just used that and no efficiency improvements, we would have to build 90 a year, tops.
Actually a modern reactor is more like 1.6GW that the 1GW quoted, so that knocks the figure down to 56 or so, and if we just assume the single energy efficiency improvement of the use of annular fuel that might come down to 35 or so.
If we can't build that number then we really don't deserve to survive, and China alone plans a capacity of 10 a year by 2020, IOW around nuclears' share of the load if we assume all three of solar and wind and nuclear contribute equally.
None of this is to say that peak oil and so on won't cause grave transition difficulties, but longer term it seems prospects are good.
Are you publishing the Jim Hansen scenario here? If not have you a link?
You are in for one serious shock in the not-too-distant future, friend. Just be ready. You have too many fantasies affecting your analysis.
I await the new work next week. Consider keeping in mind not only energy and peak, but also the discontinuities, the economic chaos... not to mention your fascination with junk science in the face of overwhelming data...
Cheers
Well, that is fairly rude but by no means substantive.
If you have anything of an alternative scenario to offer, go ahead, but please leave out the supercillious attitude and sneers and get on with it.
And let me add the discontinuities occurring, now, with food. Consider all these and more in your analysis, or you will, indeed, wake to a very rude reality.
The rest was just observations. I'm not in the habit of pretending what is isn't, so don't consider doing so to be rude. Perhaps it's just growing up with 8 brothers.
Next week, friend.
Actually, I am not a friend of yours, nor you mine, and I rather dislike the assumption of familiarity.
I believe I clearly said on this and many other occasions that although I felt that the physical task of generating enough energy for the world was clearly manageable, that getting from a to b would be extremely difficult and perhaps would not be done successfully.
In fact, I am one of those who thinks there is grave danger of mass starvation and war, so please do not over-interpret my observations which were only concerned with the feasibility long term of generating enough energy for our society and in no way referenced the hazards on the way.
Please. Don't be petty.
You are essentially spamming the site with nuclear support and anti-AGW posts. I have over-interpreted nothing. Your caveats have been noted elsewhere and needed not be raised by you here. But you fall back to the same Pollyanna reprises while never, and I am not overstating, never addressing key issues. This is a signature of an agenda being promoted as opposed to the objectivist stance you claim.
By the time I was 12 I knew to watch what people do, not what they say.
The expectations you have for nuclear are not realistic because you refuse to present an analysis that includes discontinuities. You have been asked many times, yet have never bothered to address how nuclear fits into a Peak @ 2009 - 2012 world. Your response is Baliunas-like: it must be the sun! I will find the connection! In your case it is, "I believe we have time. Nuclear isn't too expensive and isn't too dangerous, even in a world progressibvely more unstable."
(Sarcasm)Well! Don't we all feel so much better!(/Sarcasm)
Meanwhile, food prices skyrocket, crude oil production remains flat, oil demand grows, grain is turned from food to fuel, drought grips large areas of grain producing nations, ice melts all around us... but we have time.
You cannot discuss solutions without looking at all the issues. You can discuss technology that way. Unfortunately, you typically stray into solutions. This actually makes sense. You cannot bifurcate the discussion that way and expect coherence.
Cheers
At least we have got beyond the false bonhomie.
The rest of your agenda is noted, if not actually read, as it is endlessly repeated.
For someone with nothing to say you sure have a slow way of saying it.
I have plenty to say. Read this with an open mind, for failure to do so labels you a liar:
http://www.ucsusa.org/news/press_release/ExxonMobil-GlobalWarming-tobacc...
The full report is there on the site as a .pdf link, but it is not opening for me on this computer.
There is no real debate. The certainty is as high as can be stated scientifically. If that's not good enough for you, you aren't interested in knowing, but in fitting to preconceptions. Particularly since you must avert your eyes from what we see all around us in terms of climate change to even entertain your ridiculous notions. Here's more to document the intentional effort to distort the science.
http://www.environmentaldefense.org/article.cfm?contentid=4870
http://www.environmentaldefense.org/documents/3860_GlobalClimateScienceP...
http://www.commondreams.org/headlines03/0528-10.htm
http://www.msnbc.msn.com/id/16593606/ (A pile of bull, actually. Exxon put a bounty on anti-IPCC report findins after the latest was published last Feb.)
http://www.timesonline.co.uk/tol/news/world/us_and_americas/article53375...
The only reason there is ANY doubt about mankind-assisted global warming are Exxon and the BuCheney administration. I question the ability of those who ignore the fact that Exxon actually developed a plan based on the cigarette industry's anti-smoking causes cancer campaign to think independently. It is fully, completely documented.
www.exxonsecrets.org
http://www.cier.umd.edu/climateadaptation/index.html
This is important stuff. To the extent there are those still spreading this crap out of ill will, ignorance or ideology, there will be people like me to kick you in the arse.
BTW, there are no pretenses. I don't know you, and don't care who or what you are. You're text on a screen. I care about you spreading drivel. The use of "friend" was obviously conversational in nature. It is absurd you would respond as you have to the use (it causes me to wonder at your age, frankly), but less and less surprising. You seem to enjoy challenging, but react defensively when challenged. It fits the profile of someone with an agenda who fancies themselves openminded.
Cheers
You suggest a build rate of only 90 per year. This is for how many years? What are the characteristics of the locations you propose putting 90 nuclear powered electricity generation plants?
If you actually believe 90 plants in total could be built at all, let alone 90 per year, how long do you estimate those 90 plants would take to complete? How long would it take to ramp up to “full production?”
Not to mention who are you expecting to fund these plants? Who will insure them? Who will operate them? Who will build them? Is there a sufficient number of competent engineers and building contractors to build this number in the apparently short time you believe it could be done.
If the various proposed UK incinerator sites were by and large stopped by those who were expected to live next door to them, do you actually believe proposing 90 nuclear sites would not lead to even more vehement opposition? I don’t want to live near one of these things, despite all the glib assurances of those of the nuclear persuasion here at TOD. Windscale, TMI, and Chernobyl are more than enough to dissuade me.
What if, despite all the opposition that would inevitably arise, the government sanctions construction and they do go ahead? I suspect you’ll see the likes of protest and civil disobedience you never believed was possible.
Building nuclear powered electricity generation plants is most definitely intergenerational tyranny, and I for one refuse to become a tyrant imposing my will upon future generations unable to defend themselves from such attacks.
As noted above, he should be using something like 1.5GW per plant so his build rate peak would be 60/year. In the eighties, more than 20 were completed for five consecutive years peaking at 29. Doubling that, considering there was not a crisis then, seems eminently plausible. His build rate seems reasonable.
Most of those reactors would be built at existing sites as older ones are taken out of service. There are seven reactors at one site in Japan today.
Let's price the 3,600 reactors required for scenario one. At $5 billion (certainly a conservative number considering economies of scale) that is $18 Trillion, which is roughly 27% of world GDP for one year (2006 world GDP was $65.95 trillion) and that would be spread over 92 years. The US spent 38% of GDP on the war effort in 1944. If it was really mobilized, I would argue that the world could finance all those reactors in one year. Spread over that period, we are looking at .25 to .5 % of world GDP per year.
I think private investors will fund most of that although it would certainly be an appropriate government function to help. Guaranteeing loans and insurance certainly are also appropriate roles for government. Society should act collectively through government to insure the survival of civilization.
We are talking about a 92 year period. People would have to be recruited and trained. Companies would be formed.
I do not think so. I think that once people realize that the world faces an existential crisis with the decline of fossil fuels, they will look at what options they have. They will discover that the opponents have wildly exaggerated the disadvantages of nuclear power. They will realize that it is one of their best options and by in large they will support it. Of course, there will be die hard resistors, but society in general will overrule them.
I do not see that at all. I see it as the best hope to preserve civilization. We should also build up wind and solar as fast as we can.
Sterling The technology already exists that would allow us to mass produce hundreds of reactors every year, for far less than the price of Light Water Reactor technology. It is laid out in literally hundreds of documents covering thousands of pages, that reports research primarily conducted from the 1950's to the 1970's at ORNL. Those researchers believe they could build a safe breeder reactor, which could not have a core melt down accident, which would produce no nuclear waste, and which could not be used of nuclear bomb proliferation. It has recently been shown that such a reactor can be mass produced with carbon-carbon composites the same way Boeing builds airplanes.
Isn’t one of the problems that these reactors require plutonium to get started? And isn’t it also possible for these reactors to actually be used to produce plutonium that could then be used for weapons? I’m no expert but it seems to me if these reactors need to be kicked off with plutonium, then there’s going to be plutonium floating around. And if they could be used to produce plutonium, then there’s going to be more plutonium floating around. I’m not saying your wrong, simply that the case doesn’t seem quite so cut and dried.
Adding plutonium to the world and moving it around doesn’t seem to me to do much for reducing proliferation.
Add in the mass production angle and I really don’t think we want to be doing this. Unless we are really are the death worship culture we seem to be hell bent on becoming.
Everyone is terrified of nuclear proliferation when it comes to breeder reactors. But France and Japan use breeders to reprocess their nuclear waste into energy very effectively.
The question needs to be asked -- how valuable is near renewable nuclear energy and can we build a system that keeps safe the materials involved?
If we don't reprocess the waste, Uranium is nonrenewable. If we do, we vastly increase the potential for nuclear energy to help solve this mess we're in.
One final point. Maybe I'm mistaken, but it seems to me that people are stuck in a 'we must support one form of energy solution' frame of mind. It's the panacea mindset. For my part, I don't think it's very smart to put all your energy eggs in one basket. That said, my bias lies in favor of anything that is renewable and can be scaled upward over very long time scales.
Wind and solar show a vast upscale potential. Nuclear, I think, could play a part. Biofuels can be a limited short-term time buyer and may help hold a liquids capacity over a longer period. XTL (coal, gas) will likely do the same. Geothermal, hydro, wave and OTEC could also add new energy in the margins as time goes by. Efficiency will have to be a huge part of any solution to Peak Oil. I also think that hybrids, PHEVs, and EVs can do a large part in transforming the ground-based transportation infrastructure.
But I think the focus should be building in as many of those new energies as possible as soon as possible while husbanding coal, oil, and gas for the precious raw materials they can provide.
Couple of points - one, I don't see a lot of working breeder reactors in the world
in fact in the Wiki entry for breeder reactor - nearly all of the "notable breeder reactors" are either closed or slated to be closed:
Japan: Monju, being brought online again after serious sodium leak and fire 1995 (sounds very safe)
France, Superphenix, closed 1998
U.S., Clinch River, construction abandoned, not economically viable
in addition I had dinner last evening with a couple of physicists, one of whom noted that according to one of the world's leading fusion experts (working in England), breeders have a very serious problem with emergency shut downs - in a standard reactor this can take place over some time (hours I believe was the statement) - but with a breeder it is measured in seconds, and nobody is sure that any automated system can react quickly enough to stop the reaction
this statement was off-the-record so I cannot cite who made it (although the gentleman who made the statement doesn't have a security clearance so he should be ok making the statement) - but it is a source I consider very knowledgeable on the subject
I keep asking why if breeders are so great, we don't have any here in the US - I wonder if the above shut-down issues explains it
I agree that Nuclear power must play a part in our transition away from FF use, I just wonder if (like so many other cases we see here; ethanol for example) - the big nuke-buildup folks are over-enthusiastic and ignoring some serious issues (uranium availability becomes a much bigger issue if breeders are not safe to operate)
Yeah, just like the sun is not renewable. At current rates of consumption, there are literally billions of years of fission fuel. The common estimates of Uranium reserves considers them to be economically viable under current circumstances only for $65 / pound and $130 / pound. They do not consider $650 / pound or $6,500 / pound even though prices like those would only raise the price of Uranium generated electricity about as much as the prices of oil and coal have gone up in the past year or so. Given how little effort has been put into Uranium exploration, the only way to estimate the total usable resources is to look at the crust distribution of Uranium and Thorium and consider the lower bounds of EROI to mine it.
I agree. I think we should build up wind and solar as fast as we can and that the amount of increase of those should exceed that of nuclear. But nuclear is coming off a much larger base and it can serve a much more important role in the electrical grid, that of baseload power displacing coal. Renewables get to be much more expensive above about 20% because above that level you have to solve the intermittency problem with storage options that now cost as much as generation. So I recommending a mix of 60% nuclear, 20% renewables and 20% fossil fuels by mid century. Wind and solar have plenty of supporters and do not need my help.
We cannot put the nuclear genie back in the bottle. The Pu240 produced by reactors is not much of a proliferation threat compared to all the weapons material around or the ability to enrich Uranium and considering how hard it would be to extract from a power reactor and how small a bomb you could make from it. As you mentioned, the partially spent fuel should be reprocessed leaving true waste that is really small in volume and has half lives in the few hundred years.
Then of course there's:
http://www.greencarcongress.com/2008/01/schlumberger-ac.html#more
Oil Shale. Looks like they're onto something here. I'd be curious what the extraction rates are. If good, maybe US could start to build in some self-sufficiency and we could fight back a peak?
Game changer or something just at the margins?
I think oil shale is a significant 'game-helper'.
You can extract it in retorts(cookers) with a huge mining operation very similar to Alberta's or rather cleanly as the Shell Mahogany electric heaters(toaster method). You get some gas and about 1500 barrels of oil equivalent(2/3 shale oil, 1/3 gas) out of an acre of ground over a couple years. You'd need 24 GW of electricity to extract a
million barrels of oil equivalent per day(5% of US daily consumption); about 300,000 tons of coal per day. It's 40% cheaper than CTL in terms of coal used.
It would also use less coal than electric cars
compared to comparable hybrids; 2000 kw/ton x 4 miles/kwh x .86 grid efficiency= 6880 miles versus 140 gal/ton x 50 mpg= 7000 miles.
While energy and capital intensive, it would provide a domestic source of liquid fuel energy, and of course we use oil for other things than burning in cars( lubricants,etc.).
We could also use local Colorado, Wyoming wind and solar electricity to save on non-renewable coal as well in making shale oil.
We cannot put the nuclear genie back in the bottle.
Yuppers.
Now, show how protection of plants is working out (Wackerhut guards caught on film sleeping and THAT was only released to the citizens when the channels that are supposed to stop such a simple thing from happening failed.)
Now show how 'wise' man has been in handling the waste (Mine tailings, nations not following their own laws on re-cycling/waste handling, nations dumping waste into oceans are examples just off the top of my head)
Now show how the making of fission plants have not suffered from shortcuts in manufacturing or errors that compromise how a reactor will operate. (Errors are one thing - but the cases of vendor fraud?)
The three failures alone listed about have things like human greed, human laziness, humans making mistakes or the more complex attack motivation issue.
I've YET to see the fission pushers address the above points. Or show a working fission system.
Nuclear exceptionalism shows its face again. We face the same problems with hydroelectric power, except that hydropower has killed far more people.
Isn’t one of the problems that these reactors require plutonium to get started? And isn’t it also possible for these reactors to actually be used to produce plutonium that could then be used for weapons? I’m no expert but it seems to me if these reactors need to be kicked off with plutonium, then there’s going to be plutonium floating around. And if they could be used to produce plutonium, then there’s going to be more plutonium floating around. I’m not saying your wrong, simply that the case doesn’t seem quite so cut and dried. - goritsas
goritsas you seem to believe that plutonium is some sort of nuclear buggeyman. Surely, these are questions ment to frighten small children. Excess plutonium from cold wear nuclear weapons is now being burned in reactors. Reactor technology is redusing not increasing the supply of plutonium,
The answers to your questions are no, plutonium is not need to start thorium breeder reactors. No thorium breeder reactors do not produce plutonium, No for technical reasons the uranium produced by thorium breeders is unsuited for the manufacture of weapons.
Finally your assumption that that reactors manifest in some way a "death worship culture" is to say the least irrational.
Yeah, they probably are. Like the small children in Nagasaki and Hiroshima. Like the small children in Chernobyl. Like the small children living next door to Windscale. Like the small children playing in the depleted uranium munitions laden dust by the destroyed tank in the road just beyond their front door. You pick the village. There are many.
Well, as I understand it, Plutonium is pretty nifty stuff when one wants to get a really big bang for one’s buck. So yeah, I guess you could say I see Plutonium as a bit of the ole’ nuclear bogeyman. But then you probably add a few grains of that otherwise maligned element to your bowl as you pour the milk onto your Captain Crunch. Do you use a lead spoon?
Let's be clear here, I'm asserting this, not assuming it. For someone with your great philosophical capacity, I'm sure you'll agree this is a most important difference.
Let me see… Sufficient concentrations of fissionable materials leading to chain reactions do not occur here at the surface of the Earth naturally. At least no place I’ve ever heard of. But then, I have to admit, I haven’t been everywhere. Sometimes I think I’ve been nowhere. Then I read guys like you and I realise I’m going no where. None of us are. Getting back to the point. Any one who believes that assembling fissionable materials in concentrations sufficient to sustain a chain reaction, controlled or otherwise, is praying to death. Otherwise, no one would undertake such an act of perversion. Why would one willingly seek the unconstrained destruction contained within the atom by choice unless suffering from a delusion of control so great as to render them mad?
You cannot even control your own bowels beyond a certain point and you want me, and the rest of humanity, to believe you should be entrusted with forces capable rendering my home, and yours, uninhabitable? Extinction by natural catastrophe is one thing, extinction because the lure of the atom proved too great is insanity.
Do you think there might be a reason fissionable materials are relatively scare and in relatively dilute concentrations, at least as far as carbon based, DNA driven biological life forms are concerned? Do you think there might be a reason there aren’t any natural nuclear reactors operating here on the surface of our blue Planet?
There are reasons and those reasons are obvious. High concentrations of radioactive materials are deadly for life. Maybe not every life form, but for higher order mammals they are. As a higher order mammal that’s capable of choosing life over death, I’d prefer to leave those radioactive materials in the same concentrations they’ve been in since the first amino acids began replicating nearly four billion years ago. You, and all your ilk, would rather do precisely the opposite. You are choosing to promote death over life.
No, most molten salt reactor designs, and all mature molten salt reactor designs are thermal spectrum breeders that are optimized to run on a rich uranium fuel of U-233 bred from thorium or enriched uranium from mines (u235 mostly) rather than transuranic fuels. For plutonium breeding you would have to develop molten chloride reactors. An interesting concept aestheticly but hardly necissary.
U-233 could be used for weapons, but most reactor regimes inevitably spike it with U232 which because of its strong gamma emissions is undesirable for weaponization. Any country desiring weapons takes a more traditional approach of building enrichment cascades or plutonium breeding.
To both you and Charles Barton,
Do Thorium fast breeder reactors require seeding? Would Plutonium be useful for this process. As there is an abundance of Plutonium about with the “reduction” in nuclear warheads, would this be a cheap and ready option for such seeding? On the basis of economics would Plutonium be a first choice for seeding if indeed seeding is necessary at all?
Could a Thorium fast breeder reactor be used to produce Plutonium, at all? Even if this was at the expense of its primary civilian goal of electricity generation?
They aren't fast breeders. Fast breeders is a contraction of 'fast neutron breeder reactor' and liquid fluoride breeder reactors that utilize the thorium fuel cycle run from the very thermal to the epithermal range depending on the moderator choice, but because of the characteristics of the salt, they could never be considered fast neutron breeder reactors and given the low delayed neutron component of fast breeder reactors this is a good thing from the control perspective.
Liquid fluoride thorium reactors require initial fissile load, and this can be met with either U-233 or enriched uranium. Plutonium is both undesirable and ineffectual for this because of its low solubility in FLiBe salt.
Sure. Any reactor could. You would have to design it for that purpose however. Its not something that you can hide as a plant operator. Basically you would have to have a seperate tube of FLiBe salt with U238 running through neutron flux and purify the salt through the fluoride volitility process. Whats left behind is good weaponizable plutonium, but the production volume is necissarily small because you're parasiticly consuming neutrons that are needed for breeding U233 to fuel the reactor. Either that or you would have to make the entire breeding blanking U238 for plutonium production, but then you need to constantly supply enriched uranium fuel... and if you have that enrichment capacity you'll just turn the enriched uranium into weapons.
Basically thorium breeder reactors are unsuitable for weapons production. It may be that that played into part of the reason they lost funding to liquid metal fast neutron breeder reactors which can be very readily applied to weapons production during the halcyon days of the cold war.
Let's play with some numbers. Reactors needed for the US: 400 - 1000. Let's be ultra-positive and go with 450. For price, let's be L. Ron again and go with 3.5 billion/ea. That's $1,575,000,000. Divide that by the number of households (2000, US Census Bureau) and we get $14,931/household. I'm sure the number is a little smaller with a bit of population growth. Hell, given the numbers are so low, why the hell not just give away 30k to every household to install alternative power. You're lookin at 3 billion dollars. That's less than ONE nuclear reactor. The sheer number of customers would drop prices, too.
That's equal to 18 days of running the Iraq war.
Now, if we go with lower cost set ups to buy or a DIY windmill, some home/apt retrofitting and maybe some solar power, does it make so much sense to spend all that money on nuclear? There are people building windmills from scrap for hundreds of dollars, for example. Given a national initiative, grassroots or otherwise, wouldn't getting green power into a very high percentage of homes be feasible? Apartment owners could band toether with tenants to put in solar and/or wind(transferable credit for renters moving?) Businesses can do their own retrofits, neihbors gettin together with neihbors for a build-out...
How much less nuclear backbone would you need with every home with 5 - 15k dollars to spend on some form of renewable power, all tied back into the grid?
92 years? How are we not talking about a few decades at the very outside? The reductions of GHG emissions have to be front-end, not evenly spread out. Think more along the lines of the rule of 72.
To recap: for 18 days of war or less than one nuclear power station we can have solar and wind power in every household in the United States.
Someone explain to me how it is sane to build 450 nuclear reactors vs. the above.
Cheers
I, for one, like to get on the Internet at night. There are too many trees (many very tall) around my house for solar panels or a wind mill and the people around here would not let me cut them down.
Wind and solar can supplement the grid but the are not suitable for baseload power. Personal wind and solar are certainly not going to solve the problem.
I am advocating building national infrastructure that solves the problem of the decline of fossil fuels. You are into lifeboats.
My position on global warming is the same. The best thing we can do is build nuclear reactors to displace coal power plants. With oil, gas and coal all peaking in the next 15 years, there is no way the people will accept more that the unavoidable decline in oil and gas due to depletion. Maybe we can leave some of the coal in the ground if we can build reactors fast enough.
The assumption there will be no crash is a dangerous one. We get back to risk analysis. When we can provide a huge amount of power for a tiny fraction of the cost and time you want to use to protect us from depletion, why would we not do it? Where is it written the backbone must be built before the local infrastructure? Why shouldn't they be built concurrently?
My proposal was intentionally localized due to the high degree of certainty (my certainty, not a consensus) that neither the government nor the market will be able to handle this in isolation. You have the perfect example in WWII. Victory gardens weren't just a good idea, they were necessary for continued good nutrition. The same went for resources which led to rationing and recycling.
How can the best we can do be something that is unsustainable? Nuclear plants will need replacing three times a century at a current cost of billions per. The localized grid will, too, but, again, you care looking at a very small fraction of the cost for the same degree of replacement. For the same billions per *one* reactor we can supply a huge fraction of the total needed and leave the robust solutions for backbone, greatly reducing the number of large plants we need. If we add to this equation lifestyle changes of reducing, recycling, reusing and localization, all the more so.
I would argue, in fact, that meeting the localization goal is more important because it deals with the real issue: consumption. A massive localization drive could achieve partial energy autonomy for every household in the US within a period of a few years, not decades. It would have the added benefit of *requiring* lifestyle changes with concomitant savings of energy by reducing use via the renewables and behavior changes. However, if we assume we have a 5 - 10 year period before the shit really hits the fan, then the current grid supplies the backbone as the new backbone is built out. Under this scenario, deprivation may be eliminated for some or all over that initial time span.
Additional benefits occur from the localization of the household-based energy build out. In order to achieve this, there will be flexibility needed. Economies of scale interfere if we just assign a few companies to build all the windmills, heat pumps, solar panels, retrofitting materials for homes/apartments/businesses, etc, needed. No, the key to the plan is that it be localized solutions built out by local people wherever possible. This means, for example, the scavenging of materials to build rather than the manufacture of new materials everywhere and anywhere possible. In the cities, we would likely need to commercialize the process a bit, but hopefully only to the level of resources. I imagine a return to the days of barn raising, but with windmills, etc.
By making this a community-based process where community solutions are customized by the community with assistance from knowledgeable locals or other reference persons/professionals, we instantly integrate the whole system into a localized whole. this might have the added benefit or reducing the need for relocations. A localized solution of this magnitude would save incredible amounts of financial resources. Those resources might be applied to some of the macro level solutions (things other than backbone) that certain communities, such as cities in the southwest dealing with water shortages, might need.
If real net declines of 4% or more a year set in, we will never have the opportunity for your plan. My plan would have a good chance of succeeding whether those declines come or not. This is simple risk analysis.
I realize a great deal of interest and even fun comes out of the intellectualizing entailed in the intellectual process we are all engaged in at TOD, but the time for chat and brainy ideas is quickly passing, if it has not already passed us. I hope to encourage people to begin narrowing the conversation to the realities at hand and try to get to some conclusions before the decisions are taken out of our hands by circumstances.
Cheers
No, they need about three sets of turbines, six sets of electronics, two sets of cabling, two sets of piping, 1.3 sets of containment vessel and so on per century. Incremental maintainance stops making sense when a more efficient reactor is designed or when the concrete building is worn out.
So, when people on this thread state nuclear power plants face decommissioning, they don't mean replacement is necessary?
Color me confused.
Cheers
I expect an third generation reactor like the EPR to run for a very long time. It can probably be maintained by part and subsystem swapouts for a century or two since it is designed for it.
The early reactors were not built to be easy to service or for major subsystems to be easy to swap out. That the first Swedish reactors get new turbines, upratings and life lenght extensions from 40 to 60 years are probably more to our perculiar politics then good technical sense.
Had we not had a fixation on the number of reactors and not killed our local nuclear powerplant industry I would expect them to have been decommissioned about now and replaced with new units.
Its a difference between old and new reactors and the new ones are better and can be run and maintained longer.
Of course, if we do end up with those WWIII resource wars that some have mentioned elsewhere on this thread, then those 90 new reactors per year become 90 new targets per year. And then we really do end up with "a republic of insects and grass" (Jonathan Schell)
If we got to the point where reactor containments were the best available targets left, there would no longer be any people left to worry about anyway.
Got proof to back this claim up?
I'll call bullshit on your claim otherwise.
Still cannot manage a civil discourse, eh?
Might not be civil, but his question is still sound. I know if I were a war planner, hitting electricity production facilities would be a priority. You'd get the double bonus of taking out important infrastructure AND denying the use of that land if you breached the nuclear containment apparatus.
So what is their war objective? To punish their enemy or prepare his territory for conquest? Would not the first be better served by hitting a city than a very hard containment? If you just want to disable him, why not hit the soft electrical switching and transmission lines? As mentioned down thread, wouldn't we rather give up a reactor than a mid sized town?
What would be the scenario where having reactors would result in worse damage for us than the attacker hitting other target? A reactor is very hard and very few people would be killed in hitting it. We can argue how bad the the effect of a breach would be but even Chernobyl, which had no containment, was no where near as bad as a nuke hitting even a relatively small town.
oops -duplicate-
Since reactors would be located outside of cities, then if they served to divert a bomb which would otherwise have been dropped slap-bang on a city centre it seems that that would be preferable option.
Obviously, you have no concept of how many sites in the US are already targeted. Every city/village with a population of over 10,000 is targeted. If war were to start perhaps not all of these small population centers would be nuked, but perhaps they would. To say that a reactor site would not be targeted, or, would be targeted and there by a nearby city would be left untouched is pure conjecture.
BTW, the Chinese have already proclaimed that they do not buy the hypothesis of MAD (mutual assured destruction) and, in addition, they believe that they can win an all out nuclear conflict. Perhaps the Chinese are bluffing, perhaps they are not. Who wants to call their bluff?
On your analysis it appears that the nuclear reactors would be the least of our problems.
It would take a nuke or a major bunker buster to breach a reactor containment. Put forth a scenario where you would use one of those on a power plant before you used it on a city or a military command or communications node. If not, if you still had nukes or bunker busters left to take out reactors, it would not matter.
If the attackers did use the nuke on the power plant rather than the city, would that not still be better for us?
No, it would not be better.
A targeted reactor, because of the containment facility, would require the use of a surface or subsurface burst. Surface and subsurface bursts result in massive amounts of fallout.
On the other hand, soft targets like cities are hit with air bursts. Given the size of modern warheads (in the several hundred kiloton range) the optimum height of burst is higher above ground than the fireball's maximum diameter, meaning that far less material is drawn into the fireball resulting in drastically lower volumes of fallout. Air bursts destroy "soft" targets (any structure incapable of withstanding more than about 5-15 PSI blast overpressure) via the blast wave. Exploding a warhead at optimum height of burst results in the largest possible blast wave. A 5 PSI blast wave destroys airport facilities, houses, skyscrapers, most bridges, etc.
So hitting the city results in direct damage that is then immediately over and done with. Like Hiroshima and Nagasaki, the city's surface is not irreparably contaminated and can be cleared of minimal radioactive debris far, far more easily than a heavily contaminated site that gets fallout from a surface or subsurface burst which also includes "hot" reactor isotopes.
So let's take a scenario where the nuclear plant is outside of a city. If the plant is upwind of the city then a strike on the plant kills everyone in the city with massive radiation from fallout and leaves the city's real estate dangerously hot for decades. But if we strike the city instead, the plant is still intact so can be captured by invading forces for power, the city's real estate is recoverable and structures can begin to be rebuilt in short order (just as occurred at Hiroshima and Nagasaki), and the rebuilt (and captured) city has a steady power source. Even if the plant is downwind, the contamination is so bad and of such long duration that it is highly probable that shifting weather patterns will drag significant amounts of it back towards the city.
From a war planner's perspective, if I expect to win the war, it makes far more sense for me to not target the nuclear plant and instead target the city. The only reason I would target the plant directly is if I expect to lose or if I wish to deny vast swaths of territory to anyone (including myself).
P.S. River's contention that every location over 10,000 in population reflects misunderstandings about nuclear weapons, targeting doctrines, fratricide, and many other aspects of the weapons debate. Even during the height of the cold war we saw no evidence of such targeting policies by the USSR and I am aware of no such policies today by either Russia or China. Instead, what we used to do was take a given weapon system, analyze characteristics and number deployed, then attempted to reverse engineer the most likely targets. For instance, we were reasonably sure that during the 1980s the number of SS-18 MOD 4 missiles deployed, coupled with their MIRVed warheads, fratricide issues, yield, etc., that this particular weapon system was targeted against US ICBM bases. The number of deliverable warheads in the SS-18 MOD 4 allowed for 2 warheads per ICBM silo plus an approximately 8% failure rate plus allowed for followup strikes against additional hardened targets. An earlier SS-18 model threw a single warhead of nearly 20 megatons and we scratched our heads for a long time about that one until we realized that the small number available allowed for 6 each 20 MT warheads to be used against C&C targets like NORAD HQ, the Omaha bunker or Mt. Weather with a high probability of totally destroying the target while having enough additional warheads to cover a roughly 10% failure rate, which was close enough to the 8% failure rate in the far larger MOD 4 missile force that we were then comfortable with the analysis.
Grey Zone...You present a good overview for a nuclear war that is carried out in war game fashion, but from a US point of view. China, Russia, and others might not have the same objectives in mind as the US war gamers or 'strategic thinkers' assume they do.
Did the Carthagenians believe that the Romans would utterly destroy their homeland and then spread salt over the ground so that no crop would grow?
Did the confederacy believe that Sherman would burn everything in his path, including cities, on his march to the sea?
No one can say what the Chinese might do if war erupts between China and the US. If the Chinese think that the outcome of such a war will be a draw, that is, equally destructive for both sides, why would they care if two bricks are left joined in the US? Right now the Chinese are attacking the US economy while at the same time modernizing and upgrading their military. The Chinese are using MAD, plus time, to their advantage and will continue to do so as long as their long term economic plans work. Do you think that the current administration said 'all options are on the table' to frighten Iran... Or China? By stating that MAD is no longer the only US military stance and placing first strike suprise attack on the table the US has added another war option...At the same time it has made the world a lot less safe from nuclear conflict.
Did River actually read his history or just pop culture anecdotes that have little to do with reality?
Your argument that hitting a city is better than hitting a nuclear power plant seems to be based on the point of view of the attacker who wants to conquer the territory. It will leave more of the city's physical assets in place whereas striking the reactor will destroy the economic potential of the area. I was talking from the perspective of the attacked. Hitting the city could kill 10,000-100,000 or more immediately. Hitting the reactor would likely kill a few hundred unless it is really close to a city. The contamination would also kill people but many of them could be evacuated before this happens. So, for the immediate to mid term, the number of deaths would likely be one or two orders of magnitude higher for attacking the city. To me, that is a much higher cost for the attacked.
Luis, thanks for this work which is somewhat comforting. Something CAN be done, obviously.
Less obvious is if enough WILL be done.
I'm working on it in my individual case and hopefully will set some good examples for the people in my vicinity, but it will take a me few more years to get the project completed (because of finances).
Meanwhile I remain a skeptical doomer as far as society as a whole is concerned.
I agree with that one. The scenerios presented show that something can be done - but in reality will there be the intellectual, physical and economic capital stocks to actually do it?
For example if food production starts to slump and the transportation industry cries out for changeover - then all those capital stocks are going to be diluted across sectors and most of those energy projects will not appear.
This data needs to be thrown back into the ole World3 model to get a more integrated feel of what will happen.
I sincerely belief that as there are things that can be done, these will have to happen bottom-up. Top-down will just take too much time, regulation, not to mention political will, to be meaningfull.
My small house needs a new roof. There goes my savings, but no debts for me. Next, a solar water heater will be installed, when new savings can cover that. After that, it is time for the PV panels. Or possibly wind, if I can get a permit for that.
It's just a matter of time for the neighbours to follow, as the price of electricity continues to increase.
Efficiency is the only option to out pace the declines.
Just to correct your chart, it appears home prices started to fall right about 1973 according to Case-Shiller.
http://www.1stmillionat33.com/posts/06-09-12/house_his.gif
It would be interesting to add housing values. If the trends continue we will likely see inflation in essentials (food and fuel) and deflation in every thing else.
Fortunately, in urban transport we are only about 2% efficient. Moving a ton to move a person in Start-Stop congestion is quite wasteful. It is possible to improve that efficiency to 70%. That re-tooling of transportation, if acted on in time can create a lot of jobs and lower costs.
Which technology? Ultracaps? Pumped storage? Why this conclusion and not Stuart's call for the Project Genesis World Grid?
As it stands wind still has that annoying habit of ceasing to blow at the wrong moment: Loss of wind causes wind power emergency
If I wanted to be super-picky then it could be remarked that the issues with nuclear have received some commentary, but solar and wind-power less so, and in fact both are unproven at anything like the scales hypothesised or generating that kind of input to the grid, and solar at least is very expensive indeed at the present time, and so may in fact have more issues which take longer to sort out than nuclear.
However, the real value of this study is to give an overall framework, and you can pick and mix for your preferred energy source, and have some idea of the numbers involved which you could not do before this study, so in my view this critique is essentially petty and the discussion should be on the overall numbers presented.
The real critique of this work would not lie in this sort of detail, but if Jim Hansen is right and there is way more coal than this is allowed for here you get a radically different result.
Regarding nuclear, the number I frequently use is that our combined consumption of nuclear + fossil fuel energy is on the order of one Gbe of oil (energy equivalent of one billion barrels of oil) about every five days.
It takes decades to fully deplete a field like Prudhoe Bay--the largest oil field in North America.
Worldwide, from nuclear + fossil fuel sources, we burn through the energy equivalent of the Prudhoe Bay oil reserves about every sixty days.
Then there is of course the question of the net exports of fossil fuels, the Export Land Model (ELM). Consider the following two articles (no link for Bloomberg). I estimate that both Saudi Arabia and Mexico will show 2007 net export decline rates in the vicinity of -10%/year. And remember that when production starts declining, the net export decline rates tend to accelerate with time. I do find it interesting that Saudi Aramco itself is projecting declining net exports of LPG (propane, butane).
Saudi Arabia LPG Exports May Start Falling in 2010, Aramco Says
2008-02-28 04:51 (New York)
By Shigeru Sato
http://uk.reuters.com/article/oilRpt/idUKN2749319120080228
UPDATE 2-Mexico's Pemex posts $1.48 bln 2007 net loss
Thu Feb 28, 2008 1:44am GMT
http://www.reuters.com/article/rbssEnergyNews/idUSL2889494620080228
Russia refinery runs fall 1.5 pct in January
Thu Feb 28, 2008 11:22am EST
Interesting that Russian domestic refinery runs fell and exports fell.
You might consider extending your model to manufacturing, especially in relation to grandiose schemes like the above. A very large fraction of industrial equipment is now manufactured in Asia; it's a pretty safe bet that in times of scarcity they'll keep it for their own buildout rather than sell it to us.
If someone actually wants to push the above, they should probably do a rough GANTT on it to check feasibility.
Thanks for a terrific analysis of the energy portion of the predicament humanity finds itself in. I'll tip my hat to those who have noted that we also face water, soil, fertilizer and other resource limits, not to mention climate change and species loss. The idea that we can utilize energy sustainably to foster economic growth on a finite planet remains conventional thinking, and will lead only to worse problems if we can get past the energy bottleneck. There is a critical component of that bottleneck, however, that is left out of this analysis. Ignoranceisasin pointed it out above - EROEI. Back in 1930, when, according to the Olduvai model, we entered the industrial age, the EROEI of oil was near 100:1 and of natural gas near 40:1. Estimates vary, but the EROEI of oil is now perhaps 15:1 and falling fast. For natural gas, as highlighted on TOD yesterday it's even worse. So the net energy available to society to do anything other than acquire more energy is rapidly declining. Perhaps some of the authors or others more mathematically adept than I can model and/or graph this. What do all those curves look like when they're not only adjusted for population, but also for net energy? Then we'll have a more accurate picture of the energy bottleneck. From 100:1 down to 10:1, EROEI decline has relatively little impact. After that, it's literally like falling off a cliff. Someone posted a terrific graph of just that here yesterday, too.
Like clifman, I'm surprised there wasn't more comment here on EROEI (=net energy + 1.0). It's true that Luis said there was little good information on this. But there are some very well defined trends.
For example, as clifman says, what about the scary graph of Canadian natural gas EROEI published here, just one day before? It shows EROEI descending linearly from over 40 in 1995 to just under 20 in 2005. That's a fearsome slope.
It seems to me that the unexpected post-2000 bump in the per capita energy usage is likely to be a combination of two fundamentally different things. First, there has been a substantial increase in energy usage in non-US/UK/EU, low per capita countries (e.g., a new Chinese electric coal plant every week; enormous amounts of Chinese concrete production).
But second, there is increased energy usage as a result of being forced to use energy sources with lower EROEI, which effectively double-counts some energy. The enormous bump in corn ethanol comes to mind here, with an EROEI of 1.25 (and that's only after counting dried distillers grains as 'energy output'). That means 1.25 units of energy were produced but 1.0 units of energy were lost making it. Per capita energy counts both the input and output energy (2.25), even though you only really get to 'keep' output minus input (0.25). Euan's graph of the low-EROEI cliff makes this point very clearly.
The EROEI of conventional oil, natural gas, and coal is (still) so high that this correction makes little difference to them. But given that EROEI declines almost universally for fossil fuels as harder, non-conventional (=more energy intensive) sources are tapped, net energy per capita is very likely to diverge more and more in a negative direction from (gross) energy per capita over time. That makes the right end of the gross energy per capita graph a lot more scary (even when it's accompanied by jazz :-} ).
Rather than soothing me, the recent bump in per capita energy usage is profoundly disturbing, given its likely sources.
Marty - I think Luis acknowledges that eroei analysis is relevant but beyond the scope of this current work. As alternatives we have focussed on sources believed to have high eroei - wind (20), thermal solar (>>20) and nuclear - who knows but France seems to be doing OK.
And we don't really have a clue what the eroei of new oil and gas developments are. The recent analysis on Canadian gas has been subject to much debate here behind the scenes and is found wanting.
But you are right, we need a net energy per capita analysis instead of gross.
Thanks for the response. And I forgot to thank Luis and you for the very useful compilation.
I will be surprised if the EROEI of new oil and gas developments turns out to be higher on average than that of current oil and gas wells (David Maul's 2004 pdf illustrating more rapid decline of individual US gas fields necessitating more drilling for a given amount of gas comes to mind). As you have pointed out, the key question is exactly when we hit the low EROEI cliff (and the export-countries-keeping-theirs cliff, etc). The EROEI cliff may give a very non-gaussian look to the right side of the fossil fuel component of the net energy graph.
But I'll try to look more on the bright side of life.
Very good work. I'm delighted to see others doing this. The approach of relating GDP to energy is particularly good. I have used these arguments on the doomers for the last 6 or 7 years, and have published similar detailed analysis for the USA, with similar conclusions. I feel like NG is a little optimistic, and some of the efficiency conclusions a little pessimistic, but overall the scenarios are close enough and can be refined with further work. Americans and Canadians may have to adjust to a living standard like Italy or Argentina, but that is far from onerous, and the USA GDP/capita is very skewed by a small percentage of extremely wealthy people, so the adjustment for the bulk of the population is less than it seems. As prices rise, conservation will kick in surprisingly quickly, and efficiency can follow fairly rapidly, buying time and freeing energy for the build out of the alternatives. Clearly it can be done and therefore will be done. The bad news is that it won't be done until we are in crisis, probably both energetic and economic. The good news, at least for North America, is that crisis is, at most, 2 years away. Murray
Hi Murray, could you please link to your work? I'm quite curious to see it, and others here possibly too.
For USA scenarios see:
http://www.energypulse.net/centers/article/article_display.cfm?a_id=892 Also see the whole set of articles at energypulse. Murray
I,m an American, now living again in the USA after 27 years abroad, including Italy, France, Switzerland and Hong Kong. I have also visited Argentina. The Americans I knew had no problem adjusting to Italy or France. Korea is more difficult because of major cultural and language differences, and the God-awful traffic in Seoul.
There are wider gulfs in culture. Korea is particularly... Confucian. But it's not just that. It's the lack of organization, the lack of, ironically, cleanliness, the inefficiencies...
Do you, per chance, spend most of your time with good travelers? That is, those that really are travelers? The average American is anything but, wouldn't you say? It is this great unmoving middle I worry about. Almost by definition, those that do travel are not the group at issue. Even then, a large percentage don't do all that well. For all our sakes, I hope your perceptions are the more accurate. (I'd not bet the pot on it, though.)
Cheers
Yep. Italian society/bureaucracy is inefficient too, and in some places it seems like the plastic bag is the national flower, but these are minor irritants for living abroad. Americans adjusting to a reduced material standard of living at home won't face such difficulties, and what they do face will be shared, not unique to any individual or group. It is still their culture, their language, their infrastructure/bureaucracy. The adjustment will be gradual and manageable. Values will change in ways that support the adjustments, eg efficiency will become a virtue to be flaunted the way excess is today, etc. In Europe, during the first oil crisis, we quickly learned to love driverless Sundays and odd/even driving days. Riding bicycles and getting to know our neighbours was welcomed. Don't make an American mountain out of a Korean mole hill. Murray
This may be the real source of our differing opinions. I see nothing in any theory germaine to this discussion that encourages me to think the word "gradual" applies. For a time, yes. But once discontinuities get a head of steam up? No. What you must believe is that depletion will be slow, ramp ups fast and Americans patient. That's a lot to expect, if so.
Also, my experience with most people living below the US living standard is pretty much 0 1. On or off. They adjust or they don't.
Cheers
Don't make an American mountain out of a Korean mole hill.
Ok, I'm game. Please explain how 'Americans will accept less' when framed by credit card useage today.
What do you mean by "very difficult time adjusting"?
My definition is: suicide and murder rate triples, general life expectancy declines by at least a quarter.
Is that what happens to them?
Or are they just grumpy and complain a lot? Fist fights increase, drunken brawls, the wife gets roughed up, the husband gets his face scratched, the kids start therapy. You know, everyday stuff. Life goes on.
I am beginning to think you just like being argumentative. You and I have not interacted before, but I have read some of your other exchanges.
One reason generalizations sometimes work is that some things are based in character, characteristics, life experience, beliefs, etc. People who don't adjust well to lesser conditions in general, even on this rather small scale, would tend to also not adjust well to major upheavals. Do you disagree with this?
Do you see people as having different characteristics in different situations? Do you believe a hungry group is less likely to become a mob than a well-fed group? Do you really think everyone will just say, "Hell, we've had it too good for too long! He-he! We deserve a little comeuppance, dagnabbit!"
Finally, if you had to choose five average people of whom you knew nothing from off the sidewalk to build a community with, you'd choose Americans above all others?
Cheers
I think at least 90% of what's behind peoples' reaction to peak oil is middle class angst about loss of money and status.
Such loss (and fear of it, more so) is actually rather common, even on a substantial scale. But your "hungry mob" that people feel welling up within, is mostly fantasy. It's a stew of emotions in people who actually mostly live very ordered lives even when times are very tough. Quiet desperation as Thoreau has put it. But, for many Americans, not so quiet but still very un-mob-like.
To get a real hungry mob, you need sustained hunger. There is no chance of that in the US.
I sometimes think many people at TOD want to create a mob.
I'd choose my fellow Canadians first. US comes 2nd.
Chances are I'd be the one in either group who the others would consider fractious and hard to get along with!! :-)
I don't see how the US is immune to drought, fuel discontinuities, etc.
Clearly it can be done and therefore will be done...
You mean like it was done for hurricane Katrina?
Or a cleverly executed plan of peace and democracy like Iraq, where is was going to pay for itself in oil revenue?
Or the way it will be financed like sub-prime loans and credit default swaps?
Or the way it will be done like lowering CO2 down to 350ppm in the atmosphere so the Artic ice cap doesn't melt? (oops, it's just about gone 75 years sooner than the IPCC said it would)
I'm curious as to where all this political will power comes from.
'Big Man' political dictating?
Egalitarian Enlightenment?
Greed for the Common Good.
It's not even a glimmer on the global horizon. This things don't materialize out of thin air, do they?
Giant systems moving in the wrong direction have enormous momentum that does not lend itself to quick turn arounds. What is technically possible is seldom politically achievable in RealPolitik.
It will be a crap shoot, not an academic exercise with finger sandwiches served with tea.
We don't have a global government. The UN is a powerless joke. The reality is that it will be every nation for itself, with not enough lifeboats to go around.
Each nation will do its own thing, to a large extent constrained by its own local resource limits. For example, Iceland is doing a lot with geothermal. They've got it, so that makes sense for them. Many other nations don't have much or any geothermal potential, so the Icelandic solutions are not transferrable to them.
Some nations will be fortunate enough to be relatively well governed, they will make a lot of smart moves, and will end up relatively well off. France is one such country that comes to mind.
Other nations will be unfortunate enough to be relatively poorly governed, they will make a lot of stupid moves, and will end up poorly. Zimbabwe is certainly the poster child for this group right now, but it will have lots of company.
Add all these up, and you will get the global picture. My guess is that the bottom-up sum of these parts will prove to be less than the top-down global view described by the authors of this article.
I see, so the rich will give up as much wealth as it takes to adjust to the new energy regime, while the rest of us relax.
It's been too long since this was quoted on TOD:
And that's why I find this article strangely annoying: there is nothing in it about the technical feasibility of building all those X power stations per year, and even less about the socio-economic feasibility. Nothing about where the enormous resources would come from, i.e., at the expense of what and whom? I'm with writerman and aangel. You have to start with the concept of a steady-state economy, and then discuss how to get there. The type and number of power plants is the last, not the first, item needed.
Very nice post!
From my perspective the most important thing is to imagine (and model) that there is a possible solution to our energy situation. Humans need a goal to work towards. The details can get solved if there is a consistent goal. Thank you for placing that in front of us.
Having said that, just because there is a solution doesn't mean humans will choose it. That is the crux of our problem today. Not that we can't be working on energy and efficiency solutions, but that many people and nations are choosing not to.
I agree with many posters on TOD that we appear to be balanced between those who wish to perpetuate the existing system (at great personal gain) and those that want to change the approach (again at potential great personal gain?) to a more distributed and energy efficient system.
I have chosen to lead by example by purchasing more energy efficient devices, supporting non fossil fuel energy systems (even if they aren't perfect), using passive solar whenever possible and most importantly opting, whenever possible, to consume outside air and experiences rather than electrons, liquid fuel or disposable toys. The world needs both scientists/engineers to make energy efficient devices and the rest of the world (consumers?)to embrace those devices and lifestyles as the best choice.
It's that last part that requires non scientific leadership to show people the path. Best hope for selecting wise leaders moving forward.
Great article, guys!
Several comments:
WRT Alternative Energy resources:
Instead of unconventional coal (which I think could better be viewed as "icing on the cake" or perhaps a strategic reserve to tap into as a backup in case some things pan out differently and worse than planned), I would have preferred to see a cluster of renewable oceanic energy resources: tidal, wave, underwater ocean current, and deep water thermal gradient. Some of these need a little more R&D, but not all that much, and some are ready to move to the deployment stage now (indeed, there are already a few tidal facilities in operation). They are almost certainly deployable within the next twenty years or so, which is a relevant time frame for this analysis. The potential energy available is huge, certainly in the same league with solar and wind. The thing is, that decline in energy per capita probably is going to have to require us to operate a more frugal and less wealthy global economy; I think we're kidding ourselves to think that we can really escape that outcome. Best to assume it, and thus to also assume that we really are going to have to make the best possible use of very limited investment capital. Given the choice between an investment in a non-renewable energy resource (unconventional coal) and a renewable energy resource (solar, wind, or oceanic), it seems to me that the wiser choice would be with the renewables.
With regard to nukes, I am resigned to the reality that some additional build up is probably inevitable and unavoidable. I am hopeful that we can at least exercise due dilligence in making careful and appropriate site selections (and the number of sites that are truly safe and optimal for nukes are limited), constructing the things carefully and competently, and operating the things according to the strictest safety protocols. We can't take any of these for granted, but woe to us if we don't do things exactly that way. This in turn makes me to wonder as to what the maximum yearly build rate really can be, if we are to work within the constraints of what is required to build them right? We can certainly build a few each year globally and build them right. Ninety, however? Probably not. Even thirty looks to me to be quite questionable. I am thinking maybe a dozen or perhaps two dozen is absolute tops. A midway point of eighteen would break down to maybe six a year in the Americas, six a year in Europe, Middle East and Africa, and six a year in Asia and the Pacific. This sounds pretty realistic to me, realistic being a number that could be built without surrendering to the temptation to start cutting corners.
Finally, I understand your methodology of assuming that the pie gets divided evenly between your alternative energy resources as a necessary simplification for your purposes. Fair enough. However, it is most unlikely that things will really pan out that way. The optimal mix will vary between nations and regions depending upon local conditions, but even at the global level, it might be possible to get some sort of better estimate of the optimal global mix for these. It is beyond my abilities to tackle that challenge, but perhaps someone else would be up to it?
WRT Energy Conservation & Efficiency:
To a considerable extent, we can simply assume that energy conservation and efficiency WILL happen. People cannot use energy that is not available, and the global economy will adjust itself to whatever level of energy happens to be at its disposal. If there is less energy to use, people will learn to use less energy.
What really is at issue is HOW energy conservation and efficiency are implemented. The "default mode" is simply what most of us around here are calling "demand destruction". We are seeing this already. Here in the USA, prices have gone up for home heating fuels, so people have been cutting back their indoor temperatures from 72F to 68F, or maybe even 64F or 60F. Motor fuels haven't really gone up all that much yet, but they will. When they do, people will be cutting back and consolidating trips, and at some point some people will start trying to car pool. These types of things are the "low hanging fruit", and if they are or will be happening even in places like the US, you can expect that similar types of behavioral adjustments will be happening globally. More painful adjustments (such as going to weekly commutes or changing jobs or residences to co-locate both closeer together) will undoubtedly follow. If you ask people that are having to make such behavioral adjustments whether they are as well off as they were in the past, they will undoubtedly answer in the negative. Thus, I think it unrealistic to suggest that we can construct a pathway of renewables + conservation that does not avoid some personal pain and real economic decline.
I suspect what the authors really have in mind, though, are the bigger investments that will have to be made so that we can transition to a considerably more energy-efficient economy, and a better future than we would have if just left to the default mode of demand destruction. One high priority thing that comes to mind is Alan Drake's electrified transport and and transformation of the built environment around the principles of Transport Oriented Development (the other "TOD"). This all needs to be done to an extent that will enable us to eventually largely dispense with the current fleet of private passenger vehicles. This is necessary because IMHO, I doubt that there is any feasible and realistic future scenario that can be constructed that allows us to keep them all running, no matter how energy efficient we can make them (let alone that would allow the equipping of all of China and India with private motor cars). We can, perhaps create a future where quite a few households can have something like an NEV to rely on in addition to their feet or a bicycle for local transport (to the extent that mass transit falls short of their needs), and where anyone might be able to rent a much more energy efficient version of our present passenger cars when they need to go somewhere farther away that is not serviced by passenger rail. Some of the greatest energy efficiencies, though, are going to have to be achieved by people just staying put to a greater extent than they are now; I just don't see how we can construct an energy-efficient future that extends present levels of Western mobility to everyone on the planet.
Given that similar massive investments will need to be made not just in the transport but also in the residential and industrial sectors, and combined with the massive investments that will be required for the alternative energy build out (not to mention the increasing costs to develop and produce those increasingly expensive FF during their decline phase), it seems to me that the really crucial question is finance. How can we as a global economy come up with all the resources (both the money and the resources it buys) to accomplish all of this? It is truly an epic, daunting challenge. One wonders how it can be made to happen at all. Ultimately, what is needed is a massive reallocation of the global economic "pie", so that a much larger slice of global GDP can be devoted to all of these megaprojects. This means less available for everything else, which ultimately means less current consumption for the average person, and probably most people, globally. Given that it is in the rich West where most of the discretionary expenditures are taking place, it is there where the opprotunities for the largest cutbacks and re-allocations can be found. Thus, I see no way around it: the average person, including those of us in the privileged West, are going to have to reconcile ourselves to the reality of a poorer future.
Of course, in many poor countries, there is no "low hanging fruit". They are all pretty much at bare subsistence level. For them, "demand destruction" means going from something less than one boe/c/y to something close to zero boe/c/y. With that, "demand destruction" unfortunately really does start getting into "people destruction". I wish that such would not be a part of our global future, but I am doubtful that it can be totally avoided.
In conclusion, an excellent paper. Hopefully, some of the above comments might inspire some refinements for reevision and development in the future.
WNC Observer said regarding the figures in the scenario for nuclear build:
China alone plans a capacity to build 10 conventional plants a year by 2020.
That is in addition to plans to commence series production of Pebble Bed Reactors, which it is planned to make in a factory-like manner, with only assembly and a few other operations carried out on the actual final site.
France alone built around 50 reactors in a 17 year period, I am not sure what the peak build was but it was likely not too different to your figure for the whole of Europe - they only wound it down because they did not need any more.
The US also built it's 100 or so reactors in a relatively short time, and I would imagine that peak build was over your figure for the whole of North America.
If we need them, and I do expect a large contribution from solar, there seems little reason to think that enough reactors could not be built to power the world.
You’re one scary dude. If you believe global nuclear proliferation, even for apparently civilian use, is a good thing, you need to have your head examined. There’s more than enough nuclear materials already in usable form, and you want to add to that pool. There is no need to further refine and concentrate more fissile material. The risk is far to great it’s use won’t be confined to this grand and glorious scheme of yours for powering the world.
Memmel laid it out quite well just below.
http://www.theoildrum.com/node/3565#comment-310015
Chaos. Bifurcations. Tipping points. In Dave's world, these simply don't exist.
Please stop reading unwarranted assumptions into what I actually say.
Why should you assume that?
The point is that the best game-plan I can have will assume that I can make a difference - your assumption is one of impotence - if I am wrong what have I lost?
If you are wrong you have lost everything.
If you are right you are a looser.
You are a looser before you start.
In fact you are a looser.
Mentally.
Ah! Just saw this post! You have got to be kidding me:
Should I assume English is your second language?
And something less than an adult?
I assumed nothing. You have repeatedly refused to acknowledge the potential limits we are working within. You refuse to consider that time is an important variable or that collapse is a possibility. My description was accurate.
http://aperfectstormcometh.blogspot.com/2008/03/build-out-grid-vs-househ...
So, that wouldn't make any difference and is impotent? It includes core elements of many PO and CC activists' primary suggestions: localization, community, getting off-grid, local community, speed of action, limited cost, self-reliance...
- if I am wrong what have I lost?
Your life, and possibly the lives of millions of others. My plan would save... pretty much everyone regardless of what happens with PO and CC.
Cheers
Oh get real. Deaths and environmental damage from nuclear reactors have been extremely low over the last 50 years compared with the devastating effects of coal mining and coal fired power plants. The excess plutonium made during the cold war is now being burned up in reactors, reducing the total available for bombs. Spent fuel from new generations of reactors will be far more difficult to use for bomb making.
Er, actually it doesn't have to be in anything which could remotely go bang.
If you want to get into proliferating your opinion, please research at least the basics of what you are banging on about.
Oh, yes, nukes can certainly be built at that much higher level. The question is whether they can be built at that level without giving in to the temptation to cut some corners. I find it very hard to believe that the Chinese are not doing just that right now. I guess we'll have to wait for their equivalent of a TMI or Chernobyl to discover that I was right.
Say it ain't so!
That contractors would conspire in secret to violate the law to put more money in their pockets via cutting corners!
By God - you are start'n to sound like a theorist about a conspiracy!
TVA plans to complete a new reactor every 2 years beginning in 2013.
Thanks for your support in spreading this around the web.
http://reddit.com/info/6aagz/comments/ (science)
http://reddit.com/info/6aaje/comments/ (business)
I think this is a great piece of work -thanks for all the effort.
There will be a mixed response to the replacement so option 2 is more realistic IMO. I think that solar (thermal and PV) is going to turn out to be a major savior for the following reason:
Even though Solar is currently a tiny fraction of the overall energy amount it has the potential -unlike nuclear, coal and wind- to be mass deployed at the local level [admitted in theory we could have a coal fire or wind turbine on the roof but as 50%+ of global populations now live in cities the results would either be horrendous pollution or simply not enough wind power).
We have enormous manufacturing capabilities for mass consumer commodities.
Your peak replacement equates to 100million people (case2) 'buying in' -considering each gets 10 metres squared at $1000/metre or an investment of $10,000. This feeds into the local grid. $10,000 is doable, if its a toss up between that and no energy. At a pinch governements could offer energy loans or in a 'Manhattan Pinch' they could mass build thin film plants. (Stalin re-located a good chunk of USSR manufacturing capacity to the East within 6-12 months at the onset of war, don't say it can't be done...)
What I can't understand is Oil companies twiddling their thumbs wondering what to do when their core FF business declines. With careful planning they could OWN this space -the biggest infrastructure build-out mankind has known.
Nick.
I agree entirely. They are stuck in a mind set of declining FF threatening their existence instead of seeing this as a major opportunity. All those billions spent buying back stock only to see their share ratings decline. Stock buy backs are the signature of failure and pending extinction.
And when they do engage "imagination" it is still stuck in converting FF of one sort or another into liquid fuel.
I don't know if any of the current oil majors are capable of converting to integrated energy companies. They would need to get broken up for that to happen. Its possible the utilities - who are already used to dealing with electricity - will lead the way.
If you really believe that, then we're going to see rather a large number of corporations across the board become dead. Stock buy backs haven't exactly been occasional affairs over the past few years. In fact, they seem to have been writen into the Corporate CEO Handbook for Dummies these guys all seem to rely on.
Its actually based on what I read in The Great Crash by J. K. Galbraith.
Companies that are growing will normally raise capital on the market. Can you imagine Exxon having a rights issue today?
THANK YOU!!! That may be the best news I've read here in a very long time! Good riddance to the lot of them, I say.
The dinosaurs were replaced by the tiny mammals and birds creeping around at night in the underbrush.
This comment is sort of politics and sort of ELM related.
FFs are not uniformly distributed around the world just as populations are not either. Fungibility of FFs (and food as we have seen with export restrictions for example) will disappear along with spot markets in NYC, London, Tokyo, etc. for all FFs. Countries with supplies will, after Peak is recognized as the number one politcal and economic problem globally and shortages become apparent, stop exports or only make them under politcal constraints for hard goods(wheat, rice, gold).
So to make a long story short - here BAU, there Olduvai and dieoff. This is already occurring. USA has BAU and Pakistan, Nigeria have various stages of Olduvai and with food shortages to come sometime soon, dieoff.
So those places with energy will use them up ever faster as an increasing standard of living is recognized as important generally and those without will do without by neccesity.
So a mistake in any such model is to use a global and not a lot of national models due to market failure. This was already commented on above and that a database for nation states is being built up. I think the original Olduvai postulated the difference between when various countries hit the wall. So maybe you guys are not completely right and Duncan was right in another sense. Maybe apples and oranges here.
Also the comment was made that people will just switch to coal and use it up more quickly when oil goes out so we should presume for the global model after PO that CTL and similar accelerates, making Peak coal sooner than in the model, assuming that energy use per person remains constant between PO and Peak coal/Peak NG. I am assuming that people in production land will use more per capita or at least the same to maintain BAU after international fungiblity and spot markets disappears as well which is pretty cynical but possibly realistic.
However if we presume that import land is also military and technology land, i.e. EU, USA, Japan, China then we have WWIII for the export resources in neutral militarily weak countries, i.e. Africa, Middle East, which in a sense is already underway in Iraq militarily and economically in Africa(Chinese "neocolonization of Africa").
So due to poor distribution of resources and economic/military power and population any such model breaks down. Also all fuel will be made exchangeable after one peaks to make drawdown of the whole of FFs faster.
Another comment is that only technology (industrial) countries will be able to build such alternative or nuclear networks but they are mostly the major import countries. So they will, after stop of fungbility of surplus FFs have to switch over to survival mode and hit immediate Odlvuai, having not transitioned away, so that lots of new renewable and conservation infrastructure will not be feasible as this takes lots of energy, which will be suddenly unavailable. In states like USA/China/Russia with both industrial structure and lots of FFs this transition would be maybe possible but then they are all (or will be all soon-see Russia) net importers of energy so that a massive switchover to alternative or renewable enrgy will mean using all local sources for manufacture of the infrastructure while simultaneously eliminating the old infrastructure to make place for the new (stop driving to allow burning all the oil/coal, etc. in factories to make steel for wind mills).
Nigeria, for example, on the other hand has no capability to buildout alternatives despite a massive oil surplus.
Actually it is a great paper with lots of work and consideration. If I wasn't such a bastard I would have praised it instead of disparaging it. Essentially the leftwing here, who always praise back to the land localizaion meets up with the ELM crowd and the Chaos theory crowd to say, "every-man(country,etc.)for himself". So localization says everyone will rely on local stuff, i.e. self reliance. ELM says the same in terms of oil. It is all the same concept. Chaos theory or politcal realists are saying the same thing. See the modern globalization as a Tower of Babel/House of Cards. It only works when everything goes just right. Once the pie is not expanding, the stress in an expanding system gets too large to make rational decisons at the politcial level. Politicians however react very sensitively to political pressure directly so that market failure is practically a given, hoarding of oil, food, etc. for own use.
So efficiency improvements in countries with problems after wide spread public PO recognition and market failure resulting in shortages will mean essentially massive use reduction via govt. dictated rationing or price induced rationing as real efficiency improvements in terms of better boilers,etc. cost money and that will be the last thing anybody has available at that point in time.
This means in Germany we have big problems coming.
This means in [insert country name here] we have big problems coming.
Do you read the papers?
Gas Prices Soar, Posing a Threat to Family Budget
http://www.nytimes.com/2008/02/27/business/27gas.html?_r=3&ref=business&...
Good post.
One point I want to raise is I think that this illustrates that peak oil is a problem because of lifestyle. What your asserting is that if we change our lifestyle willingly then over the long run we will all benefit.
The problem with your thesis is two fold.
1.) Most people would view the changes needed to live in a low energy world as impoverishment or lowering the standard of living and thus their class in society. The wealthy need not make any changes to continue their current lifestyle. And few of the wealthy are ready to change the way they flaunt their wealth. Big houses, fast cars, boats planes, gardens in the desert etc.
This means that as we transition off of oil we have to deal with a energy concentration effect. The wealthy at each level will try to concentrate the energy to maintain the lifestyle they wish to enjoy. In many ways the is the reverse of export land. Real import land has the people with the most money buying all the energy they can possibly exploit and only after that do the poorer level get energy.
So you have a double problem these groups will be resistant to change and even as change is forced they won't practice conservation willingly.
2.) Given the above natural tendency to have energy concentrated in the wealthy. As change is forced on us the fruits of alternative energy just like the exploitation of oil will not be equally distributed. Since the overall energy densities are lower and less transportable this means a lot of the population will loose access to cheap labor multiplying energy. The mechanical multiplier joules or horsepower available to a lot of the people in the world will drop quickly. Thus instead of having hundreds or even thousands of horsepower at their disposal in the form of pumps, trucks tractors, propane etc they will be back dealing with the ability of a single donkey. As they are impoverished they are also cut off from markets that are now to far to reach etc.
I think these two factors will ensure that even as we transition and I do agree with your underlying thesis, we will not do it smoothly.
So the real problem is not making the transition since we could have done it at any point since the 1970's when this issue was first raised. Its that the transition is not smooth and it will only happen well past the last minute. In a sense your completely ignoring the reason why Jimmy Carter failed to change a nation.
In spite of my own thoughts on that, this article in no way indicates a change in lifestyle, hence expressions like "current standards of living". The efficiency wedge translates into doing the same using less.
But you have not proved that is possible.
A fuel efficient car is not a Hummer or Porsche. The wanton waste of energy because you can is a key part of our lifestyle. Two people living in a 5,000 sqft Mansion with 5 cars is the goal of the American Dream. The ability to throw money away is a critical part of showing your successful. The Potlatch concept is alive and well and integral to our lifestyles.
http://en.wikipedia.org/wiki/Potlatch
But its been perverted to in effect destroying the resource since who has the most is also important. The purchase of land to create a natural park or preserve a building etc is so rare it makes headlines. Returning wealth to the commons is not part of our society.
I'd like to add that I did visit a lot of Roman ruins in Spain and my conclusion was that they maintained a standard of living at least for citizens higher then we have today using renewable resources for years. But it was a different society focused on communal baths and the arts. The country club if you will.
These area's allowed a range of citizens that varied in absolute wealth to in effect treat each other as close to equals. Certainly you had a pecking order but diverting wealth from destroying resources to buying a better seat at the play as a sign of status was and is a brilliant way to manage finite resources.
Since we have lost the communal pecking order of physical events we are left with destroying resources to build monuments to ourselves.
Bottom line is your not dealing with human greed. In my opinion the addition of human greed destroys your argument since its the wealthy that have to change to redirect the desires of the poor towards less energy intensive ways to show superiority. Yet these same people are vested in the current status quo and have no need to change.
Consider this scenario.
Man six dollar a gallon gasoline is going to really hurt a lot of people. Dude your right unless your rich....
Over the long term this statement is false since eventually it will effect the rich but our society is incapable of seeing this and the ones least able are the rich.
Oh, we'd never see our political chiefs just giving away money to the villagers, now, would we?
(Now when was it they were going to mail out those rebate checks?)
;-)
I'd like to add that I did visit a lot of Roman ruins in Spain and my conclusion was that they maintained a standard of living at least for citizens higher then we have today using renewable resources for years.
Errr tales of the removal of trees at a rate greater than the replacement rate makes your observation worthy of re-evaluation.
memmel, I also lived in Spain on two different occasions and was impressed by the Roman ruins.
In your post you say that it was 'a different society, focused on communal baths and the arts'.
You make no mention of all the slaves that were necessary to make this idillac lifestyle possible for the Romans. Slaves were the FF equivalent of that time.
How did the Romans happen to be in Spain? Did the Spanish invite the Romans to 'take our country, make slaves of us, and build some baths to hang out in, and we Slaves will ensure the bath water is warm'?
Were the Romans discussing the arts and baths as they fought the Gauls?
I know that, and I understand that there are perfectly legimaite reasons for holding that variable constant in your model.
However, as I explain in another post elsewhere on this thread, I suspect that a big part of that efficiency wedge will have to come not from doing the same with less, but rather from just plain doing less. Such "demand destruction" is the default mechanism for bringing demand into equillibrium with declining energy supplies. We can avoid it, but only by reallocating a big chunk of our GDP toward investments in alternative energy and energy efficiency. Unfortunately, that reallocation itself leaves consumers with less of the GDP "pie" left over for them, and thus they must still end up with just plain doing less.
I appreciate that one of the things you are trying to do here is give people legitimate hope that the worst case doomer die-off scenario can be avoided. I share that desire and hope that we can do it. However, while we must give people hope, there is a real danger in giving them too much hope. I think it is best to be honest with people up front, and let them know that their future is going to mean being less well off, that they will actually have to live with less and not just learn to do more with less. That's my planning assumption, anyway.
people and our economy are a lot more adaptable than the average TODer believes. the home builders are building smaller homes in response to the market.
Thank you very much for the good work.
Let me just add a comment: I see the "Olduvai" metaphor as inappropriate and potentially misleading. WE tend to forget that by far most of what humankind has created of valuable assets (culture, arts, cities...) has been long before the onset of the energy intensive age of the 20. century. (Indeed, one could even argue that the quality of what mankind has produced has somehow declined since there is so much energy around.)
Now, there is no question that we are in for a hard landing, and the possibility of a catastrophic fall has to be considered. But I would rule out a return to paleolithc culture.
Metaphors are important. This one's nice because it's so catchy - but will not help in widening awareness of the problems ahead.
It's a quite an impressive post, thanks!
2000 dollars/boe(FF) as a target seems reasonable for most European countries but there are huge disparities between countries. For instance, just China (presently around 1700 dollars/boe(FF) and a mere 4 boe/capita/year), trying to reach a European way of life (~10-12 boe/capita/year) will require at least a doubling of the energy requirements per capita. Assuming that China population will reach an asymptote at 1.37 bln in 2010, we get 1.37*10/7.4= 1850 MToe/year for China alone. So basically, we have to explain to Chinese that they are presently right on target at 4 boe/capita and that they should stay there, good luck! :)
According to scenario IV (table 5):
Nuclear 19
Coal 30
Offshore Wind 9300
Onshore Wind 21000
Solar (Km2) 640
Do you have an estimate for new capacity for these sources for 2006 or 2007? just to get an idea of how far we are.
You touched two very important issues, thanks.
First, “current standards of living” for the remainder of the century can itself raise important questions, not only for China and other countries in similar stages of development, but even for wealthier developed countries. What's an Economy like where energy consumption doesn't grow? What kind of currency can be used in such Economy? Economic growth in such setting would only be able to come from extra efficiency (along the lines of the research made by Ayres that we so many times referenced here) and there are limits to that.
I left these questions answered on purpose. Chiefly because I have no answer for them, but also because the “End of Growth” and an hypothetical transition to a “Steady-State” Economy is something the world never experienced before and could enclose problems that we can't possibly conceive at the the moment. Among all of these Peak questions, this is the one that “defies my imagination” the most.
On your second question, I tried to do just that, but the data on Wind wasn't satisfactory (maybe I should have tried to search harder). The world has already built an average of 20 new nuclear power plants per year (1975 – 1995). China alone is building 150 new Coal power plants per year, but they have different outputs and I couldn't assess an average number.
Now, a wind turbine is a rather simple object, once the architecture is there its mass production is relatively easy (comparing to what's involved in a Nuclear power plant). For Solar the story is pretty much the same, especially on thermal and passive systems. So I'd say those numbers in Scenario IV are all achievable.
True, lots of unknowns, lots of unanswerable questions. I would argue, though, that given the inevitable exhaustion of all non-renewable resources, the end point for humankind (short of extinction) must logically be a steady-state, zero-growth sustainable economy. If all we are left to work with are renewable resources, then we MUST live within those means; there is no other logical alternative.
In such an economy, cultural growth is still possible, but all the physical flows must balance inputs and outputs, so physical growth of any type -- population, energy use, material production & consumption, etc. -- must be limited to whatever technological inventions enable people to wring more efficiency out of those resource flows. Those inventions would occur from time to time, but there is undoubtedly a law of diminishing returns at work which would render those increasingly few and far between. Thus, it need not be exactly zero growth, but it would probably be pretty close to it.
Such an economy would also need a fixed money supply. If any growth at all were allowed in the money supply, this would mean inflation. Inflation would result in wrong decisions and misallocations in the economy, which would ultimately result in waste. In such a sustainable, zero-growth economy, waste becomes close to the unforgiveable sin, something to be avoided by any means possible. It does not really matter whether such an economy used gold or paper or big round stones as its unit of money; the important thing would be to keep the money supply fixed.
A sustainable, steady-state economy means that the "standard of living" does not increase for people, except to the extent that cultural growth improves and enriches their lives. It also means that we can't achieve a sustainable, steady-state economy unless and until we get the average standard of living down to a level that can be supported on a sustainable basis by the renewable resource base. It is questionable whether we can quite do that at present on a global level, and it is very much doubtful that we can do it for those countries that are considerably more well off than average. Thus, we need to not only be coming to grips with the reality that the era of growth (in aggregate economies and individual wealth) must end, but that we'll probably have to go through an era of decline until we have reached a level that can be sustained. As I've said elsewhere, I believe that it does no good to be less than honest with people about this. They won't want to hear, they won't like to hear it, and they probably won't believe it at first. Nevertheless, the sooner that people can go through the psychological process of adjusting to that hard truth, the sooner we can move on past that and get to work doing what has to be done.
The good news is that because that sustainable future is a lower economic level than where we are at now, we do not have to set the bar for ourselves any higher than that. The goal we have to work toward is considerably lower even than the one you anticipated in your article.
I'm really baffled by the peak coal projections.
First, there are very, very large kerogen resources (aka oil shale) in the US and elsewhere (411 Gtons, per wikipedia). These are normally dismissed because of the assumption that they would be used for liquid fuels (which would be very difficult), but they can be burned relatively easily for electrical generation (as has been done for decades in Europe, on a relatively modest scale - Estonia has about 3GW, 95% of it's electrical production). Perhaps kerogen shouldn't be classifed as coal, but it seems pretty similar on a practical level. In any case, it should be included somehow.
2nd, the EWG (and I believe others) are relying on very, very superficial information on coal production/reserves/resources, and logistical models which don't look applicable, IMO. For instance, high sulfur Illinois coal peaked because of it's sulfur content, not because of resource limits, and UK coal has stopped because of political considerations and cheaper substitutes (a model which doesn't apply in a critically FF-constrained world). The strongest statement from the NAS coal reserve/resource study was that we needed much better information - that doesn't seem to support strong statements about peak coal, but would seem to suggest instead a risk-based analysis.
As best I can tell, a projection of a reasonably imminent peak coal makes sense due to rising cost curves for coal "resources", if there are reasonably priced renewable/nuclear substitutes (which looks very likely), but not otherwise. This is optimistic for GW (as it suggests that coal use will naturally decline), but is a strong counter-argument to Olduvai.
I was puzzled by the 90% downgrade in UK coal reserves, thinking someone had got a decimal point in the wrong place. Reserching it I came up with this. I am not promoting the site's views on climate change but it has something interesting to say about coal reserves.
http://www.climate-resistance.org/2008/01/imminent-shortage-of-stories-f...
Thanks for the link.
Hi Nick,
The projections of the Energy Watch Group include the full coal reserves for each state. For Illinois the reserves are 38 billion short tons. The annual production is 37 million short tons. When the R/P ratio is this large, 1,000 years, people will be suspicious (correctly) that the reserves will eventually be downgraded. This happened in the UK, Germany, and in the Pennsylvania anthracite fields. The Energy Watch Group included full coal reserves for Illinois anyway.
Here is the actual statement from the NAS report on coal
"Present estimates of coal reserves are based upon methods that have not been reviewed or revised since their inception in 1974, and much of the input data were compiled in the early 1970’s. Recent programs to assess reserves in limited areas using updated methods indicate that only a small fraction of previously estimated reserves are actually minable reserves."
You can buy the full report at
http://www.nap.edu/catalog.php?record_id=11977
This would lead us to expect that a new reserves study would reduce US reserves. If a future reserves study does reduce the reserves, that would have the effect of moving the Energy Watch Group peak to an even earlier date.
We have had several rounds of discussion at The Oil Drum about the role of politics in UK coal, and in particular about the role of Margaret Thatcher. Two things could be said. British coal peaked in 1913, while Margaret Thatcher was born in 1925. The European Coal Index has been at nominal record levels for the past few years, and Margaret Thatcher is no longer Prime Minister. Nevertheless, British coal production has dropped sharply during this period. It is now at 6% of the 1913 peak.
Dave
hhmmm. I'll have to take another, closer, look at the NAS & EWG reports. Well, a few thoughts.
"For Illinois ...When the R/P ratio is this large, 1,000 years"
Part of the reason the R/P is high is that production is low, due to the shift to western low-sulfur coal.
"people will be suspicious (correctly) that the reserves will eventually be downgraded."
I'm not sure how this follows.
"British coal peaked in 1913, while Margaret Thatcher was born in 1925."
My understanding is that this was due to the conversion of the British naval fleet from coal to newly available Persian oil, which was necessary to give the British naval fleet superiority over the German fleet (20% higher speed), rather than depletion. I'm not quite as knowledgable about the last few years of British coal production, but I have the sense that falling output has little to do with the extent of coal reserves - anyone out there who knows more?
What do you think of what I said about kerogen??
Hi Nick,
With regard to fuel for the Royal Navy, H. Stanley Jevons (son of the William Stanley Jevons of "The Coal Question," and Jevons Paradox) had this to say in "The Coal Trade," 1915, page 705:
"It is an interesting question how far the adoption of oil as the principal fuel of the British Navy would diminish the demand for the best South Wales steam cool. There are thirty-one South Wales collieries on the Admiralty list, and the amount of coal purchased each year for naval purposes is between two and two and a half million tons. This is about 3 per cent of the total output of the coalfield, but nearly 10 per cent of the output of the steam coal areas. The total consumption of oil on British naval vessels is approximately 400,000 tons per annum, or the equivalent of 600,000 tons of coal. We may say, therefore, that oil has displaced coal to the extent of less than 25 per cent of the navy's total fuel requirements and the amount of coal displaced by oil is less than 3 per cent of the output of best steam coal in South Wales. The transition from coal to oil must necessarily be a gradual one, and, to quote Mr. Winston Churchill's words, 'Coal will continue to be the main basis of motive power in the line of battle for the present.' No stagnation of the South Wales mining industry need be anticipated, therefore, from the adoption by the Admiralty of the new policy, as the general demand for steam coal now exceeds the supply, and the loss of naval demand will simply mean the diversion of supplies to other directions at only a small reduction of price."
You can download this book at
http://books.google.com/books?id=YdFNAAAAMAAJ
British coal production in 1913 was 287 million long tons, so it appears that naval purchases amounted to less than 1% of production. It is ironic in this context that last month the Tower Colliery, "the last deep coal mine in Wales," exhausted its coal and shut down
http://icwales.icnetwork.co.uk/news/wales-news/2008/01/25/miners-march-t...
Dave
My impression is that the naval conversion was the leading edge of conversion to oil - military needs propelled governmental sponsorship of oil procurement from foreign sources (initially Persia/Iran).
I have to admit I'm still learning here, but this doesn't seem to answer the overal question - was UK peak coal the result of conversion to something considered better, rather than outright depletion? IOW, the old saw: "the stone age didn't end because we ran out of stone".
Hi Nick,
With regard to large R/P ratios, the word reserves is usually interpreted to mean coal that could be produced legally and economically. With an R/P ratio as large as 1,000 years, the question arises, could you really do it? This particularly the case if production is declining. In the UK and in Germany there was a "gotcha moment" when someone in the government realized that there were few prospects for new mines that were worth putting money into. This caused a change in the basis for computing reserves from all the coal in the country to primarily coal within reach of existing mines, a much smaller number. For example, in going from the 2001 WEC Survey to the 2004 survey, German hard coal reserves dropped by 99%. British coal reserves fell by 90% in going from the 1980 WEC survey to the 1986 survey.
It is true that western coal really got going after the Clean Air Act was passed in 1970, during the Nixon Administration. However, the peak year for Illinois coal production was 1918, long before this.
Dave
"In the UK and in Germany there was a "gotcha moment" when someone in the government realized that there were few prospects for new mines that were worth putting money into. "
This is a key question, and I'm not clear on it. Why were new mines uneconomic? Often lack of economic justification depends on relatively small differences in cost, which might be insignificant in a much higher cost environment. In the period 1986 to 2004 oil/gas prices were mighty low.
" the peak year for Illinois coal production was 1918"
I just looked at Illinois production - it's striking that there was a strong peak around WW1, and before that, and for many years thereafter there was stable production at roughly 60M tons/year. That doesn't look much like a standard bell-shaped logistic curve.
Hi Nick,
Your exchange with Euan down thread may apply to shale oil. It has not been demonstrated that shale oil can compete with the renewables.
Dave
" It has not been demonstrated that shale oil can compete with the renewables."
I agree, though I think the margin would be relatively small, especially if we weren't concerned with environmental damage. Remember, we're talking about simple burning here, not a complicated oil-recovery process, and I think Euan is exaggerating it's difficulty a bit. It's dirty and messy, and probably would require substantial long distance transmission to eliminate transportation of low-density shale, but it looks perfectly doable if necessary.
My sense is that your analysis suggests that in time that coal will be uncompetitive, but that there are much larger resources that could be used in a true energy crisis. This is what I was trying to say above: "As best I can tell, peak coal makes sense due to rising cost curves for coal "resources", if there are reasonably priced renewable/nuclear substitutes (which looks very likely), but not otherwise. This is optimistic for GW (as it suggests that coal use will naturally decline), but is a strong counter-argument to Olduvai."
Does that make sense?
Hi Nick,
"My sense is that your analysis suggests that in time that coal will be uncompetitive, but that there are much larger resources that could be used in a true energy crisis. This is what I was trying to say above: "As best I can tell, peak coal makes sense due to rising cost curves for coal "resources", if there are reasonably priced renewable/nuclear substitutes (which looks very likely), but not otherwise. This is optimistic for GW (as it suggests that coal use will naturally decline), but is a strong counter-argument to Olduvai."
Does that make sense?"
I do not have an opinion yet on that one.
Dave
Check out DaveR's (he posted just up thread) Hubbert Linearizations. Base on actual production, it looks like a peak in around 2020-2025.
I just can't see HL for coal.
HL was developed from empirical observations of oil fields. Oil has unusual characteristics - there is a very sharp line between oil and non-oil (it pools nicely); it flows well; and supplies are limited by it's tendency to flow to the surface (unless caught in a trap) and dissipate.
Many things peak, like lead and mercury, without being depleted, and coal is one of them.
Coal peaked in the UK, and in Illinois, without being depleted - they just had competitors that were a little more convenient (oil for the UK) or a little cheaper (low-sulfur western coal, for Illinois).
I think if the production of a resource follows a logistics curve, then HL will work. Dave R got pretty good fits for it. I think when people historically made the original reserve estimates they did not realize how much of the original resource in place would not ultimately be recoverable. Once regions got far down the after peak down slopes, the remaining recoverable reserves had to be dramatically revised downward.
Since coal production seems to follow a logistics curve, I think the burden is on you to suggest why HL does not work even though it does seem to model historical production well.
As I mentioned on another post, as oil and NG deplete, people will be substituting coal (directly, or more likely through coal gassification or CTL). This suggests a discontinuity in demand and utilization, which is why you cannot project future rates of depletion for coal based upon past data.
Since oil and NG appear to be peaking almost simultaneously, and prior to just about any other energy source (we can disregard sperm whale oil), they don't have this problem.
I think HL is based on production and not demand. The resource is produced as fast as it can be. It does not work well where production has been throttled back (e.g. Saudi Arabia). I do not think this is true for coal in general.
If increased demand increases production, it will only make the resource run out faster. So the HL will be wrong by being too optimistic.
"I think HL is based on production and not demand. The resource is produced as fast as it can be. It does not work well where production has been throttled back (e.g. Saudi Arabia). I do not think this is true for coal in general."
I believe it is. Coal production fell in the US and UK due to it's replacement by oil & gas.
The proof of this is the lack of a long-term rise in the price of coal, as we apparently are now seeing for oil (it's too soon to tell for sure - remember, it needs to be "long-term").
Maybe in the UK but the btu peak for coal in the US was in 1999. Oil was last used for electrical generation in most of the world in the 1980s. Coal has been displacing oil, gas and nuclear. That's why global warming has gotten so bad.
People are often in denial about what causes resource production to decline. They just do not want to admit that the resource is running out.
I am having trouble finding a source but I believe I saw a story last week that the price of coal has gone up 200% in the last year or two.
"Oil was last used for electrical generation in most of the world in the 1980s. "
Yes, but gas has been the favorite for new generation recently.
"Coal has been displacing oil, gas and nuclear."
Not really, not in the US.
" I believe I saw a story last week that the price of coal has gone up 200% in the last year or two.
Yes, but 1) that's on the spot market, not in long-term contracts, which dominate the coal industry, unlike the current pricing convention of oil, and 2) that, as I noted, is very recent, and the result of capex lag, not overall depletion.
"Since coal production seems to follow a logistics curve, I think the burden is on you to suggest why HL does not work even though it does seem to model historical production well."
I did, and provided counter-examples: lead and mercury. They both apparently followed a nice logistical peak, but the underlying dynamics were very different.
HL is just curve fitting. It's only useful as a predictor if the underlying dynamic really fits a logistic model. Many things don't, and one indicator is price history. My understanding is that there has been no sustained price increase for coal - prices have risen recently, but there's no evidence that's due to depletion, just short-term capex lag, as is the case for many, many other commodities currently.
Right. Of course they are saying the same thing about oil. There is no real shortage of supply.
The US is the Saudi Arabia of coal but production peaked on a BTU basis in 1999. And now we import a lot of it.
OK, so I have not looked at your lead and mercury examples. One obvious difference with them than oil, gas and coal is that we are not consuming all that there is. Just what we can get too. Presumably they are distributed all the way down through the crust. And we have detailed production curves for coal all the way to where they stop mining it in some regions. It seems to match the logistics curve all the way along.
"Of course they are saying the same thing about oil. There is no real shortage of supply."
And that's understandable, because if oil has peaked, it will be almost unique among commodities. There are only a few other significant candidates, like copper (for which there are many substitutes), and phosphorus. The rest are due to capital expenditure lag.
"The US is the Saudi Arabia of coal but production peaked on a BTU basis in 1999. "
Not due to a lack of supply - as can be seen from the lack of rising prices at that time.
"now we import a lot of it."
Actually, we export more than we import. Water transportation from Australia to the coasts is cheaper than trucking or even rail from deep inland for a low density/cost item like coal.
"we have detailed production curves for coal all the way to where they stop mining it in some regions. It seems to match the logistics curve all the way along."
Yes, and those curves look just like lead and mercury. A production curve tells you nothing about the causes of falling production, which can just as easily be lack of demand as lack of supply.
As I said in my post a 90% reduction in reserves is very fishy. In Britain there have over the years been many estimates of future reserves and all give different outcomes. Plus UCG tecnology may vastly increase recoverable reserves.
Nick - organic shales typically have 10 to 20% carbon. So if you can get this to burn you need to mine a huge amount, transport a huge amount and you will be left with a huge amount of toxic ash to dispose of. If they have done this in Estonia they must have been desperate.
I do believe we will burn every last tonne of easily accessible coal and so the question of how much there is, is of vital importance. The Chinese have vast coal reserves - so why on Earth are they importing coal from Australia? The growth rate in consumption is clearly outstripping there ability to build new mining capacity.
We had three recent coal studies to choose between - and Luis chose the middle of the three. If we use Laherrere peak FF moves from 2018 to 2020.
At some point it will simply become easier to build wind or solar power plant than trying to mine deep and thin seams in remote areas.
"organic shales typically have 10 to 20% carbon. So if you can get this to burn you need to mine a huge amount, transport a huge amount and you will be left with a huge amount of toxic ash to dispose of. If they have done this in Estonia they must have been desperate."
My understanding is that Greenriver shale burns pretty easily, and that such burning was an integral part of the old-fashioned retort method of oil production. We're talking about simple burning here, not a complicated oil-recovery process. It's dirty and messy, and probably would require substantial long distance transmission to eliminate transportation of low-density shale, but it looks perfectly doable if necessary.
As I said to Dave Rutledge, I think we're unlikely to use shale kerogen for electrical production - it's dirtier, and probably a bit more expensive than wind/solar - but I think it's certainly doable in a true energy crisis. That's another reason I can't see North America ever having a true supply-driven electrical shortage.
" The Chinese have vast coal reserves - so why on Earth are they importing coal from Australia?"
My understanding is that it's similar to the reason why the US imports some coal (though it exports more): water transportation from Australia to the coasts is cheaper than trucking or even rail from deep inland (and distances are great, and rail infrasructure especially bad in China), for a low density/cost item like coal.
"The growth rate in consumption is clearly outstripping there ability to build new mining capacity."
That's very different from long-run depletion.
"We had three recent coal studies to choose between "
I'm not sure yet that they're independent of each other in data or assumptions.
"At some point it will simply become easier to build wind or solar power plant than trying to mine deep and thin seams in remote areas."
I agree. Please see my responses to Dave - do they make sense to you?
Hi Nick,
Jean Laherrere and The Energy Watch Group made their projections based on reserves, so there would be overlap between them. My projection is based on fits to production history, so I would say that it is independent of the other two. There is a little connection, because countries like the UK and Germany reduce their reserves after their production drops. In addition, I used reserves for Latin America and South Asia, because I could not find a trend for an ultimate in these regions. However, they amount to only 20% of the total.
Dave
Nick, in your view are the kerogen resources large enough so that it would move us back into trouble on GW?
I'm assuming here that the IPCC models are correct, not the much lower trigger points Hansen thinks operate, and that apart from the kerogen resources the other fossil fuel resources are as assumed in the article on which this thread is based.
"are the kerogen resources large enough so that it would move us back into trouble on GW?"
Yes, though not as large as the resource assumed by the IPCC.
Kerogen resources appear to be roughly comparable to coal, so their use would roughly double coal's CO2 contribution.
Please note that I think that peak coal is correct, given the existence of reasonably priced substitutes for FF electrical production.
Kerogen, and the coal reserves that have been priced out of competitiveness, are backstops that would be used only if renewables/nuclear turned out to be very expensive or unscalable, which I think is unlikely. OTOH, it does preclude an Olduvai scenario.
Sounds like it is still under the amount assumed in the lowest IPCC scenario.
Of course, that itself might be too optimistic and Hansen right, just the same it is comforting to have a resource good enough to tide us over, but not good enough to promote endless FF burn.
Any idea of the distribution of resources?
How are China and Europe placed?
The US is obviously OK.
I've answered my own question and tracked down information on the distribution of reserves:
http://en.wikipedia.org/wiki/Oil_shale_reserves
China and Russia also have substantial oil shale resources, although on nothing like the scale of America.
Of the big players only India has no substantial resources in this.
Even Britain has 500 million tonnes, which is a relief with Britain's monumentally incompetent energy policy and the high cost of off-shore wind - we look very likely indeed to have an energy gap here from about 2012 on, until we manage a substantial nuclear build as it seems to me unlikely that the finances will be found for much of the proposed off-shore build to actually happen - at least twice the price of nuclear, it appears.
Keep in mind that the Gorge theory speaks in terms of loss of electricity, which is generated primarily either by coal or NG in most places.
My problem with this analysis here is it looks at the Gorge hitting the world as a whole, which I think is a practical fallacy (US grid is not tied to the Russian grid or anywhere in Africa). Practically, there are already plenty of examples of the Gorge hitting all parts of Africa today, whether it be Zimbabwe or now South Africa. I won't bother citing them all now, but they are cited in this thread on the Gorge here:
http://www.peakoil.com/fortopic7291-0-asc-0.html
Further, and for my own selfish point of view, the Gorge will hit the US far sooner than it will ever hit places like Russia or the ME who sit on top of lots of oil and NG.
For example, the US relies heavily on NG imports from Canada, which are expected to drop 30% by 2015. So, where will the difference be made up?
http://energytechstocks.com.previewmysite.com/wp/?p=540
See also this article that Canadian NG imports may drop by 15% as early as 2009.
http://www.bloomberg.com/apps/news?pid=20601072&sid=auwWD7UDZ8WU&refer=e...
See also:
http://www.energybulletin.net/39298.html
Its unlikely enough LNG facilities can or will be built in time to make up for NG depletion in NA. There have been other threads on this issue in the Oildrum, but the warnings are there that we need them. Warnings NE will face power outages in more LNG facilities aren't built.
http://peakoil.com/article32655.html
Further, for those relying on coal, assuming we can get over political obstacles, the fact is, there is a good argument we have passed peak coal in NA. Canadian geologist David Hughs says we have passed peak coal in NA (this is a must see, this guy's expertise and speaking out is incredible to listen to).
http://www.peakoil.com/fortopic25978.html
http://globalpublicmedia.com/david_hughes_on_canadas_oil_and_natural_gas...
So, people need to review the way they view the "Gorge." It will most likely be a regional event, not a world event.
aren't those more about bad government than anything else?
didn't Duncan predict world wide blackouts?
http://peakoildebunked.blogspot.com/2005/08/31-whatever-happened-to-rich...
Sheese! I feel like I have fallen into a den of economists!
You know, those guys who sit on the two legged stools of 'production' and 'consumption' while the third leg 'return' rolls about under their feet. What is it 6.5 or 6.8 billion, I've lost count. Does that sound like a sensible number for this species on this world? Are the seas being fished out, species disappearing at some fantastic rate or other? Soil fertility falling, petrochemical fertilizers and biocides increasing on land and in the sea. But we will muddle through and make the world safe for alternate energy and new improved Kunstler salad shooters? Seriously?
The chapters on GW and planet degradation are not in by as long shot and those are the biggest part of the story IMO.
I find this article kindly intentioned but quite incomplete. I think if the the degradation of planetary resources is seriously factored in, then one would find that alternate energy attempts to avoid the natural result of exponential species growth will only exacerbate a bad situation.
I commend the efforts all of you have made and that you have the kindest of intentions and desires, but to me this is just more whistling past the graveyard and avoids what would best be done.
Mediation along this line: Vault on Arctic Isle Would Protect Seeds, seems to me to obtain to the real.
I share your frustration, totally.
I think it's worth noting that energy efficiency is much more cost-effective than new generation, and that improvements of much, much more than 2:1 are not only available, but cost-effective. A regression analysis of current efficiency levels, developed during a relatively low energy cost era, isn't realistic.
For instance, buiilding energy consumption can be reduced by 75% relatively easily and cost-effectively, and 90% is achievable by current technology (100%+, if you regard PV as efficiency, rather than production). For instance, just improving the windows in my home eliminated the need for heat above freezing temperatures.
Transportation energy consumption can be reduced by 75% quite easily, and 95% with current technology.
I'm not quite as familiar with manufacturing energy consumption, but my impression is that the same analysis applies (info/examples, anyone?).
The difficulty with efficiency is the replacement of capital investment/equipment, but in longer timeframes this is much less of a problem. For instance, 50% of US VMT comes from vehicles under 6 years of age.
Interesting article. Thanks for posting this! This also spells the end of globalization.
the end of globalization? why? it's still going strong in the face of $100 oil. globalization is about far more than just oil.
Globalization is based upon inexpensive fuel to use for transportation. Remove that, which is in the process of being done, and these transportation costs become very high. That was my thinking in the comment. I think that if you look at the economic figures closely you will see the beginning of a global recession (the US recession/depression is clearly taking form now).
A USA recession is not the ending of globalization. We are in a transition period between the USA being the largest consumer and China being the largest consumer of global products and services.
"Globalization is based upon inexpensive fuel to use for transportation. Remove that, which is in the process of being done, and these transportation costs become very high. "
Not really. Fuel costs are a very small part of water shipping costs. Further, the surface areas and energy consumption rates are such that large container ships could easily be 95% powered by wind and solar.
Prof Goose, could we have somebody do a formal analysis of this, to put this issue to rest?
Fuel costs are 60% the cost of shipping.
http://www.bizjournals.com/pacific/stories/2008/01/14/story1.html?ana=fr...
http://www.soundtanker.com/articles/bunker-fuel-prices.php
Prof Goose Prof Goose, could we have somebody do a formal analysis of this, to put this issue to rest?
That's interesting. A few thoughts:
The 2nd article says " Fuel purchases can represent as much as 60 percent of a ship's operating costs thereby greatly affecting your charter rate. "
"as much as" isn't "equal to". More importantly, operating costs are only a portion of total costs - capital, etc have to be included.
You have a good point, though. What I really meant to say was that fuel costs for water shipping represented a very small % of the value of shipping. Your 1st article illustrates this: "price of shipping a 40-foot container carrying 2,280 20-pound bags of rice to Hawaii has risen from $1,972 in 2005 to $2,782, an increase of 40 percent. " and, "The cost of shipping a 20-pound bag of rice to Hawaii in 2005 was 86 cents. It's now $1.22."
So, the cost of shipping 20 lbs of rice has risen by all of 36 cents, even while oil prices have tripled, and that includes large increases in other things besides fuel. The bags cost $10-$11, so that's about a 3.5% price increase on a a relatively low-density, low-value product - the % increase would be smaller on many goods. Surely, this is good evidence that PO will have very little impact on water shipping.
Finally, there is the fact that wind/solar can replace 95% of fuel conveniently and cost-effectively (and 100% somewhat less conveniently and cost-effectively).
Yep. How many Plasma TVs did a barrel of oil buy in 1998? It won't be long (maybe 5 years) until a barrel of oil buys 1 large Plasma TV made in China.
Well I know that oil hit $10 1998/9 and plasmas may have cost around $10000 - so thats 1000 bbls / plasma - na that can't be right? Can it?
And in two years oil will cost $500 and plasmas about $500 - hey we're getting close to reality.
Very cute:) ... but I still don't know how the net energy in that 1998/9 barrel compares to the net energy in one now, let alone 2 years from now, by which time we could be loosing plasma from the ears and eyes.
THE END OF CHEAP OIL DOESN'T AFFECT GLOBALIZATION
http://peakoildebunked.blogspot.com/2008/01/330-end-of-cheap-oil-doesnt-...
Globalization because of high oil prices has shown ZERO signs on slowing. it's more under threat from US overconsumption than anything else. meanwhile many of our exporters are booming based on the growth of emerging economies.
in the face of higher oil prices goods will still be shipped but they'll cost us more.
now the wild card. have anyone factored in the shipping industry using LESS OIL? Ships can use sails and can simply slow down.
Nick by shifting inter city freight hauling from trucks to railroads, an 8 fold increase in efficiency will occur. By shifting short and middle distance inter-city travel from aircraft to high speed electric trains considerable energy savings are possible. Finally the use of solar hot water heating and in some areas space heating, plus the use of ground and air source heat pumps, will all increase energy conservation. Finally, if lap top computer energy savings technology wis applied to desk top computers, significant energy savings are possible. Finally a world wide effort to stamp out coal mine fires would eliminate a significant source of wasted energy, and contributer to global warming.
if you car pool you can cut your transportation consumption by almost 50%.
"if you car pool you can cut your transportation consumption by almost 50%."
Heck, go from 1 person to 5, and reduce by almost 80% *. Of course, you've reduced quality of life slightly, because it's substantially less convenient, but it does mean that personal vehicle commuting even with enormous reductions in fuel use.
And, that's before the reductions in vehicle consumption I was talking about.
* Why almost? because more passengers increase fuel consumption slightly.
a member of my extended family used to ride from his suburban home and hour into the city. someone should do the fuel savings calculations on that. extrapolate that solution to the suburbs of phoenix and any suburb usa and you can see why I am not a doomer. some doomers will say people won't abandon their cars but this is lunacy. if the costs of driving go up enough people will take the bus or car pool.
Well, the low hanging fruit might be very cost effective, but for both energy efficiency and alternative energy, you are going to be able to rank order your opportunities in terms of payback period from best to worst. Unfortunately, once you've gotten past the easy low hanging fruit, you eventually end up having to do some hugely expensive megaprojects with very long payback periods.
"Unfortunately, once you've gotten past the easy low hanging fruit, you eventually end up having to do some hugely expensive megaprojects with very long payback periods."
This doesn't seem quite realistic to me. Could you provide more quantitative detail, and examples?
This is what I said: "For instance, building energy consumption can be reduced by 75% relatively easily and cost-effectively, and 90% is achievable by current technology (100%+, if you regard PV as efficiency, rather than production). For instance, just improving the windows in my home eliminated the need for heat above freezing temperatures. Transportation energy consumption can be reduced by 75% quite easily, and 95% with current technology."
What do you think?
Nuclear scientists have known for 50 years that a virtually unlimited supply of energy would be possible. Alvin Weinberg explained what was possible 40 years ago:
http://www.energyfromthorium.com/pdf/NAT_preface.pdf
Charles W. Forsberg, Per F. Peterson, and HaiHua Zhao, explain the technological breakthroughs that make it possible.
http://www.ornl.gov/~webworks/cppr/y2001/pres/119930.pdf
Thorium breeding reactors, which feature superior safety, no China syndrome with an always molten cores, elimination of the problem of nuclear waste, the breeding of new nuclear fuel without the risk of nuclear proliferation, and ability breed almost endlessly using virtually renewable thorium far more efficiently than uranium is now used as a nuclear fuel. New technological breakthroughs make it possible to mass produce such reactors using carbon-carbon technology used to build air craft. Such reactors can be built on assembly lines, with the possibility of hundreds being built every year.
Why haven't these reactors been built before? As I explain in my blog, political decisions reached by the Nixon Administration in 1972 cut short the most promising lines of reactor development.
http://nucleargreen.blogspot.com/2008/02/wash-1222-with-comments-part-1....
so Nixon's decision affected the entire world's work on thorium breeder reactors? since I see the Fuji MSR is still not really there
"The FUJI MSR is a 100 MWe design operating as a near-breeder"
- there are exactly how many working reactors of this type in the world? And could you clarify why Nixon's decision in 1972 kept the Soviet Union, China, France, England, Israel, South Africa, Canada, Norway, Japan (well they have a "near-breeder" apparently) etc. from developing this exciting and world-saving technology?
could you demonstrate how the statement "New technological breakthroughs make it possible to mass produce such reactors using carbon-carbon technology used to build air craft. Such reactors can be built on assembly lines, with the possibility of hundreds being built every year." is ANYTHING but hyperbole since there are NONE of these plants actually working as breeders from what I see?
Its not world saving, its just better than LWRs. So the fuel lasts millions of years instead of tens of thousands, not exactly a giant rush.
And during the days of the cold war, a capital intensive research project that has almost no military benifit isn't likely to get funding by any of these countries.
The post is excellent. Nevertheless, I think it is too optimistic and wrong in what it advocates.
The projected infrastructure requirements are key. They can't be met. That's where other resource constraints come into play. Not only metals and minerals, but water, soil, etc. Peak energy is now part of a wider problem. A desperate scramble to maintain a "civilized", i.e. high-energy way of life bumps into this wider problem.
Plus of course there is the near certainty of peak energy leading to ever more destructive energy wars on the one hand, plus hoarding (without the negative connotation the word implies) and disinvestment in extraction on the other. These factors can't be modelled but will play a role in shape of the downside.
But after the smoke clears, we'll be forced to scale back and rebuild a civilization, with whatever is left, that is much less energy-intensive, not very dependent on extraction of underground resources, is willing to control its population level, and is far more intimately involved with the soil. The oil age and the centuries leading up to it provided us an invaluable knowledge base and tool-kit. But now we're going to have to reacquaint ourselves with bugs, soil, plants, trees, and all the earthy matters we could ignore on the upside of the oil age.
What parts of our hi-tech hi-energy infrastructure-intensive way of life can be retained and made sustainable going forward know one knows. But I think it's much less than most assume (and hope.) But it can be a good life if we put as much talent and effort into as we did into building nuclear weapons.
The relative efficiency graph assumes that a linear fit is plausible. I think not. Observe that in the bottom left hand corner of this graph there is a strong linear correlation . Now cover this bottom left hand corner and it now looks like a random scatter plot. So the data tells us two things:-
a) below BOE per capita per year of 10 BOE, there is a strong correlation between GDP/Capita and BOE/capita
b) above 10BOE, there is no correlation with BOE per capita.
A possible economic explanation that GDP per capita constrains GDP development from other than fossil fuels. Wet pavements are caused by rain not vice versa even if there is a high correlation between water on pavements and the amount of rainfall. Simply put, poor countries have to maximise their energy production per unit of every scarce capital. That means using fossil fuels. Richer countries with abundant capital have a choice: they can develop energy industries which use much more capital per MH - such as Norway with hydro and France with nuclear.
There is a clear policy implication of strong correlation below GDP of 2000$ per capita and a BOE per capita of 5 barrels/year while there is only randomness above.:-
a) Countries consuming below 10 BOE per year should do as they wish but never exceed the limit of 10 BOE par year per capita.
b) Countries consuming more than 10 BOE per year per capita should cut fossil fuel use until they have reached this threshold.
There is a suitable basis for KYOTO II which even meets the Bush condition that the US will only agree to international binding limits if poor countries do the same. The limit for everyone is 5 BOE per capita per year. Thos above cut consumption and those below can increase if they wish.
Good points there Manfred.
The linear fit to GDP vs FF use is just a simplification, and it also gives an immediate visible perception of which countries are doing better and those doing worse.
As written in the article the efficiency wedge would have the highest impact in wealthier countries.
At the risk of making myself unpopular in this thread, I must say that I have always been baffled by the uncritical adulation paid to the the "Olduvai Theory" (which to be pedantic should be the Olduvai Hypothesis).
Duncan states that "Industrial Civilization can be described as a single waveform of duration X, as measured by average energy-use per person per year" and then deduces that "the life expectancy of Industrial Civilization is less than one-hundred (100) years, i.e. X < 100 years". Duncan defines the start date of Industrial Civilization to be 1930 and deduces that it will end by 2030.
On what does he base that deduction? All he offers in support of his start date is that "This is the 'leading 30% point', a standard way to define the duration of a pulse". In other words, he assumes without further proof that the course of Industrial Civilization can be described as a pulse and that the engineering convention used to describe the start and end of a pulse can be meaningfully used to determine the start and end of civilization.
But how by any stretch of the imagination can 1930 be considered the "start" of Industrial Civilization, when industrialization had been well underway for a century or more at that point? By 1930, mechanized factory production was well established, oil and coal fired steam ships and trains carried goods and passengers around the globe and mass production of automobiles, truck, aircraft and tanks were underway. It would be more likely that in 1930, the first year of the Great Depression, people thought that industrial civilization was ending, not starting. If one offers that this is "merely a convention" then how can one not say that Duncan's terminal point of Industrial Civilization, 2030 might not be as indistinct as its start?
More significantly, how meaningful is it to use *world* per capita energy to define the arc of Industrial Civilization? A significant portion, indeed the majority of the world population has not been and is not now truly a part of industrial civilization. In the heart of industrial civilization, North America per capita energy consumption is still growing, not declining (especially here Canada). Duncan's measure may say something about the prospects for the non-industrialized but I think it has, in itself, no predictive value for industrial civilization proper, and that the conclusions drawn by Duncan and others, based on this measure alone, are unwarranted and meaningless.
This is not to say that the peaking and decline of world energy supplies is not a crucial issue for industrial civilization and the world as a whole. It most certainly is and will lead to at least a major contraction of the extent of industrial civilization and perhaps its eventual total demise. I just think that the "Olduvai Theory" has little to tell us about timing of that process. I personally think Kunstler is more likely to be proved more correct, at least as far as naming the situation, when he call this the *long* emergency.
But I must credit Duncan with coming up with the best slogan for the decline of industrial civilization. You have to admit "back to the Olduvai Gorge" has a ring to it. The image couldn't be more graphic.
I was hoping you would examine the underlying assumption of Duncan's work, which is that civilisation depends on a certain level of energy usage. We (well, mainly the Americans), use a lot of energy, but do we need to? I think it is the Everest principle: we use it because it is there. Without demonstrating what energy we really need and what is incidental, this analysis is worthless.
The cheering crowd looking up at the towering cathedral of charts and figures appear to have overlooked the gaping hole at the foundation.
I think you should read the article in its entirety.
I think you should read the article in its entirety.
I think you should read the article in its entirety.
I think you should buy me a peanut butter cheesecake. Mmm...
Thank you for the article. Excessively interesting!
Do you any info on past, present and future coal EROEI?
Thanks again,
SolarHouse
One issue I see is that liquid fossil fuels are not equivalent to electricity. Our built infrastructure uses petroleum for transportation. We will need major changes to get to an electricity economy.
A second issue is the cost (in terms of fossil fuels) of all of this new infrastructure, plus new electric cars, trucks, much better electric transmission systems, road maintenance, etc. I wonder how we will be able to set aside enough of the available fossil fuels to do all of these things, plus have enough left for food, clothing, and the basic necessities.
A third issue, assuming all this can be done, is convincing folks to forego current consumption in sufficient amounts that this amazing transformation can be done.
Oh yeah, we need fossil fuels to make renewable possible. This is a good use for fossil fuels. We should be using as many renewable sources as possible now and saving the fossil fuels for later. Some people ask when will we run out of fossil fuels, as if that is when we will need to go to renewable energy . I contend that going to renewable energy sooner rather than later is a smart move.
"A second issue is the cost (in terms of fossil fuels) of all of this new infrastructure, "
Actually, the cost of converting from ICE vehicles to EV/PHEV's is negligible, if done over a sufficiently long period of time (say, 20 years).
With large production levels (100k/year, say) PHEV's like the Volt would cost no more than the average light vehicle (just under $30,000), though the first generation due in 2010 looks likely to be about $35K. Such PHEV's would get us 80% of the way to EV's. Eventually, as battery costs fall, EV's will be in the same cost range.
If ICE's were replaced with PHEV's in the normal course of things (i.e., through attrition), it would cost essentially nothing.
Very little additional infrastructure would be essential. 90% of vehicles are housed off-street, where charging is typically available. Parking garages and parking meters could provide power outlets - they do so in Canada and Minnesota now for engine block heaters.
enough of the available fossil fuels to do all of these things -
Again, I will raise EROEI. I think it's likely that the spike in per capita energy noted about 2005 has been due at least in part to the need for society to plow everything available into energy production - tar sands, deep water, biofuels etc... But the NET energy available is shrinking. Comparing X amount of total FF in 2040 to the same amount of total FF from 1960 (to pick two roughly equivalent points on the intro graphic) without correcting for EROEI paints an inaccurate picture. As we shift from straw in the sand oil at near 100:1 EROEI to tar sands and biofuels down in the single digit range, we will have little available fossil fuels to do anything other than use it to produce more energy. It's a rapidly worsening negative spiral, and we need to recognize that. This post has tremendous value, but only if we factor EROEI into the scenarios as well. Everyone who hasn't should look at yesterdays post on the net energy of NA nat gas. (And to be clear Gail, I simply used your comment "available fossil fuels" as a means of making my point. Not holding you responsible for this in any way. In fact very much appreciate the clarity of your analyses elsewhere.)
In fact I'd call this the 'set aside problem'. Suppose the cleantech had a payback of 8 years. Then we would need all the FF energy for 8 years to create enough cleantech to replace FF use. Or 50% of the FF energy for 16 years, and so on.
Better modelling would allow for learning effects, interactive gains and cutoff points. The main conclusion is that much of remaining FF energy should be embodied in long lasting machines and materials, not so much in joyriding.
"Suppose the cleantech had a payback of 8 years. Then we would need all the FF energy for 8 years to create enough cleantech to replace FF use. Or 50% of the FF energy for 16 years, and so on."
Fortunately, wind, solar and nuclear have E-ROI of 20-50.
Also, the energy that is currently going into buidling FF infrastructure can be redirected to renewables. Stop building coal/NG, start building renewables. If you do it slowly enough to phase out FF by attrition, it costs nothing. If you do it faster (as would be very, very desirable), then you start to have additional costs...
In fact I'd call this the 'set aside problem'.
I don't think we have a set aside problem because those that don't have the money will be outbid by solar and wind companies that will have boatloads of money. when you pay $10,000 for solar power the money is set aside in a way because the cost is in the solar package. the cost of materials is there. the cost of labor, cost of oil to get the trucks there, cost of powering the solar manufacturing plant is all in the final cost of the system.
Another issue I see is what I would call the inefficiency wedge.
Since we are reaching limits on the world's resources, it costs more to extract existing resources from the ground. When we mine many kinds of minerals, we need to separate the desired mineral from more and more extraneous material. We undertake all kinds of maneuvers to cut back on pollution - for example adding scrubbers to coal plants, or closing some coal fired plants down. Because of CO2 pollution, we are talking about CO2 sequestration, requiring the burning of much more coal than if no sequestration were considered. Water must be pumped from deeper in the ground, because aquifers are depleting. In some cases, desalination plants are needed, where rainwater would have been sufficient in the past. Soils need more amendments because their natural fertility has been depleted.
That is a good point. There are more advanced ways of getting more out of oil wells, but they cost. It was said that we will get the oil, but it will cost more. We may get more out of each unit of energy, but each unit will cost more and maybe even be a larger percentage of GDP.
Since we are reaching limits on the world's resources, it costs more to extract existing resources from the ground. When we mine many kinds of minerals, we need to separate the desired mineral from more and more extraneous material. - Gail the Actuary
Gail, this is exactly were our vision fails. More energy is simply thrown away in mining tailings, than has ever been produced from fossil fuels.
http://www.australianminesatlas.gov.au/info/aimr/thorium.jsp
http://www.resourceinvestor.com/pebble.asp?relid=40784
http://www.atsdr.cdc.gov/toxprofiles/tp147-c5.pdf
To quote from WASH-1097 (written in the late 1960's:
"The use of the thorium cycle can lead to reductions in the amount of uranium ore that must be mined for the production of electrical energy; nevertheless the amount and cost of the uranium ore required still will be more important than the amount and cost of thorium ore. For example, a thorium fueled reactor might require on the order of 0.1 kg ThO2/kWe to provide its initial fertile material requirement compared to about 5-10 times as much uranium ore to provide for its initial fissile fuel requirement. At a ThO2 cost of $5/1b, the initial thorium requirement would, therefore, be about $1/kWe, or a thorium inventory charge of less than 0.02 mills/kWe compared to the uranium ore inventory cost of 0.1 to 0.2 mills/kWe at an ore cost of $8/lb U3O8. Clearly, in contrast to the effect of an increase in uranium ore price, an increase in the cost of thorium ore by a factor of two would have little effect on the cost of electricity from a thorium-fueled reactor."
Government research on Thorium based reactors, most conducted from the 1950's to the 1970's is in open archives. A massive amount of information is on the internet to any one who has the slightest curiosity.
http://www.energyfromthorium.com/pdf/
Uranium and thorium in phosphate mining tailings, represent an enormous energy reserve. Indeed this precious legacy is regarded as a public health problem!
http://www.atsdr.cdc.gov/toxprofiles/tp147-c5.pdf
The failure to
Fair points Gail.
Changing the Transport infrastructure will take its time, we are talking of decades, you don't change every car overnight, you change how the new generations of vehicles are built. But steadily deploying solar panels and wind turbines or Coal plants is another matter. I imagine each country will tackle the energy crunch on its own way, using the resources it may have at hand.
On mass resources depletion, it is important to remind that their production rates are largely a function of the energy used on their exploration.
To address some of the issues you raised I used a cycle of 80 years for the efficiency wedge to factor in.
As I have already pointed above, all the scenarios envision the continuation of current average life standards, avoiding the difficult choices of energy decline.
"On mass resources depletion, it is important to remind that their production rates are largely a function of the energy used on their exploration. "
hmmm. When you say energy, do you mean literally? As in BTU's, or exergy? I've never seen any evidence for that, or even a preliminary analysis of it.
"To address some of the issues you raised I used a cycle of 80 years for the efficiency wedge to factor in."
And yet the lifetime of capital equipment that consumes energy is much shorter, except perhaps for buildings. Heck, the effective mean lifetime for light vehicles in the US is only 12 years (as far as energy consumption - the average age at scrapping is higher, but older vehicles are used much less). In the US, it only took about 20 years to double light vehicle fuel efficiency (mid 70's to mid 90's).
A bit less than doubled, according to this reference:
http://autoxprize.typepad.com/axp/2006/07/20_years_later_.html
And then we've actually trended down, since then. Leaves me less than optimistic that we'll double it again anytime soon. The fruit is there to be picked, sure, but I fear we'll let too much of it rot on the vine. And even if we do double efficiency, Jeavon's Paradox says we'll consume it elsewhere. These tendencies and more are why I expect us to grow like mad (literally) until we fall off the cliff.
"A bit less than doubled...And then we've actually trended down, since then."
Depends how you define efficiency. Here's what your link says: "Given that the average MPG increased roughly 7 MPG during 1975-1981, if that rate of change had continued (with constant average weight and acceleration), the average MPG today would be 42 MPG rather than 21 MPG. "
So, engine efficiency has doubled again in the last 20 years, but the gains were applied to performance & increased vehicle size.
"even if we do double efficiency, Jeavon's Paradox says we'll consume it elsewhere. "
Not in an environment of rising prices - in the last 30 years gas prices have been dropping sharply (while incomes rose), and that's why no one has paid attention to MPG.
Are you suggesting the United States has any kind of political plan to solve its looming energy problems, be it a peak oil problem or, more closely a NG shortage problem? We have an aging infrastructure, dirth of nuclear plants, and a dirth of LNG (assuming it would be available to us anyway).
Many problems are solvable but for politics, but, if the US Social Security problems are an indicator, there is no hope we in the States or NA can avoid the gorge, bc its far more complex to solve than a simply accounting issue like SS.
the market?
The market hasn't solved the energy woes of Africa, nor is it contributing the trillions necessary to update all the grid, NG pipelines, build new infrastructure, LNG facilities, tankers, etc.
It seems, more often than not, the market crushes, not builds.
It is a nice piece of work... but:
Measuring energy efficiency using the GDP is a serious mistake. Energy efficiency should be measured as E(out)/E(in). As soon as you mix an imaginary variable (money) with a real variable (energy), it all gets messed up.
It makes no sense to say that this or that much dollars can be 'produced' via 50% less energy usage if efficiency gets better. You cannot eat and drin dollars and you also cannot heat your house with dollars.
I think the author of this piece (Luis) is mistaken when using energy efficiency as a synonim for the energy intensity of the GDP. As a result, I also think the end result is distorted. By a big margin at that.
"Measuring energy efficiency using the GDP is a serious mistake."
He may be considering a different question than you are.
As I understand it, he's answering the question: "Can GDP rise, while energy inputs stagnate, or even fall?".
The answer to that question is, clearly, yes.
Which raises a question for me: why does anyone think that the Olduvai model's prediction of falling energy per capita would mean anything, even if it happened? Energy efficiency is much cheaper and cleaner than producing/consuming more energy. I would think that was a good sign, not a bad one.
Of course it can. GDP is measured in dollars (i.e.: currency). It depends on pricing. If there are many virtual services for example they can cost a lot in dollar terms - so GDP is going to rise. On the other hand, if the price of energy goes up spending all that GDP via the ripple-effect won't be hard.
But what does it really mean? In the end it is consumption in real terms. (Food, shelter, heat, clothing, computers, etc.) The energy intensity of the GDP allows us to raise the GDP for ever and ever - it depends on pricing and money (virtual entities).
However, energy efficiency is something else. Energy instensity is an output/input ratio. You can convince me that energy intensity can be measured as bushels of corn / energy invested (vs. energy out/energy in), but you cannot really convince me that energy intensity has anything to do with GDP in a real economy.
GDP and dollar terms in general are totally bogus when it comes to dealing with energy.
At least that's what I think.. But you may try to convince me I'm wrong.
I'm not really sure of what you're arguing.
" what does it really mean? In the end it is consumption in real terms."
So, you feel that programming has no value? Only things that you can drop on your toe, or measure with a meter, have value?
I'm arguing that GDP is not a good measure of real economic output (programming included). GDP can be distorted in many ways - discalculating inflation being one done recently. If you are talking about energy (as this article does) and try to argue about how to fill energy gaps (as this article does), then you should count production and consumption in energy terms (as this article does not).
Consumption (i.e.: output) is being measured in dollar terms (GDP) and production is being measured in energy terms (boe). I think it messes things up.
Imagine the following. A hypothetical country does the following:
makes 100 pairs of shoes (that it sells for USD 150 [i.e.: USD 1.50 per pair)
buys everything else to cover its needs for USD 50
It does nothing else. Makes no profit. Now. The price of oil goes up 50%. Energy efficiency goes up 25%. The price of shoes rises 40%.Price of everything else rises 30% Now said country:
makes 125 shoes and sells them for 125 X 1.5 X 1.4 = USD 262.50
buys everything else it needs for USD 65
The country made a profit, even though efficiency went up only 25% vs. the price of energy going up 50%.
But if you look in energy terms the picture is different. And it works both ways. I simply don't think that energy efficiency of the GDP is the same as energy efficiency in energy terms. If you want to close an energy gap, you have to count everything in energy terms. If you use GDP your model will inevitably fail.
"I'm arguing that GDP is not a good measure of real economic output (programming included)."
I don't know what would be better. Energy inputs are not a good measure of prosperity.
"If you are talking about energy (as this article does) and try to argue about how to fill energy gaps (as this article does),"
But that's not all the article is talking about.
"then you should count production and consumption in energy terms (as this article does not). "
But who cares how much energy we consume? We care about the services it provides. If a vehicle uses 10% as much energy, but is just as comfortable and fast, we're just as well off. That's the point here: we can be just as happy and prosperous with half the energy, or have twice the goods and services with the same energy.
Think about programming: two programmers on laptops (or PC's with LCD screens and high efficiency CPU's) can do twice the work as 1 programmer with a CRT, and a low efficiency CPU. Right?
I'm not clear on the point of your model. Energy efficiency went up, the number of shoes produced went up (which, all else being equal, I assume is a good thing), and there was some general inflation. I don't see any specific problems, beyond the inconvenience of inflation. I would point out that energy is probably about 5% of the cost of making shoes, so in your example an oil price increase wouldn't raise prices anything like that much.
After all, US oil prices have about quadrupled in the last 4 years, but inflation has only increased from about 2%/year to about 4%.
Sure. I wasn't building a model at all, let alone presenting one. And I can sure see and understand (even to a degree agree with) where you're coming from. However, I'm 100% positive that using energy intensity of the GDP will lead us nowhere in a shrinking economy.
On the other hand, I'm also sure this thread is not about my ramblings, so I'll put together something better (that looks more like a model) and post it later in a different thread.
I've been reading this site for 13 months now, and I'm quite familiar with energy concepts discussed here (at least that's what I think) so I should be able to come up with something more original than simply stating that the GDP is not a really good measure of things - which I think is more or less common knowledge anyway. :-)
So thanks for answering and I'll get back on this subject soon.
There are a lot of more or less negative inputs above concerning negative reactions of society, uneven implementation, lack of FF energy to make the changes etc, along with self-serving terms like "realist". Sure there are problems and issues, but they do not create insurmountable barriers. Yes the transition will be unsmooth, both in time and geography. The scenarios are just global overviews, not detailed topographies. Sure there will be some societal upset, but riots in the streets? - not likely, and not enough to derail necessary progress. In fact, when things get really dire, humans pull together. see the great depression, or post WWII Europe. Also consider that the necessary changes are spread over 50 to 100 years. They are not a sudden cataclysm. When oil was $20.00/b about 5 years ago, the doomers said that $100.00/b would tear society apart. However a slow ratchet with time to adjust at each stage, and that didn't happen. Similarly, a gradual reduction in living standards, from say the USA current level to the Italy current level, over 50 years will simply be absorbed. Also for FF resources, consider that one large PV plant can produce enough PV in 1 to 2 years to power itself, and provide the energy to build another plant, and from there you have a cascade w/o FF. 100,000 wind turbines a year? We build 17 million cars trucks and buses a year in the USA alone. How about if we divert maybe 20% of that to wind turbines? Failure of government leadership? Wait until a few hundred people in New England have the gas furnaces go out during freezing weather in early March. Such a political reaction you will see! Greed? Issue smart cards with each car that are needed to activate gas pumps, and that result in pump price inverseley proportional to vehicle efficiency. Those greedy Hummer drivers will hate paying more than Joe Prius more than they love their Hummer, regardless of what they can afford. Is it going to be samooth and easy? - No. Are there any real barriers other than pessimistic imaginations? No. Actually the greedy bastards in the USA and Canada have it best, because we are so inefficient and profligate that we can make very large adjustments without any significant sacrifice, while creating jobs and generating a real sense of individual satisfaction at contributing to something worth while. Can China do it? The USA economy could be operated at present standard of living on much less than 1/4 of the primary energy used today. If China develops using the best available technology rather than continuing to repeat the mistakes of the already developed economies, yes they can do it. For all you who are calling me a Pollyanna, just remember that human beings are at their best when they have to overcome adversity. Murray
Great work Luis and Euan. One area where you might be a bit too optimistic is in not fully accounting for the lowering of average EROI for the entire system, as we are seeing dramatically for FF. This will mean less available net usable energy for the same amount of total energy produced.
"the lowering of average EROI for the entire system, as we are seeing dramatically for FF. "
Well, renewables/nuclear have very high E-ROI.
Also, a fall of E-ROI from, say, 40 to 20 (as we saw in a recent article on NA NG) means an increase of the ratio of energy input to output from 2.5% to 5%. Of course, you always hate to lose 2.5% of your energy profit, but it's not a really dramatic change.
No, the drama begins as EROEI falls below 10, which is where we are headed. If that weren't true, would we be mining tar sands, making corn into fuel and even talking about oil shale? (EROEI of about 7, 1.3 and less than unity, respectively, in my understanding)
Or another way of looking at this is once energy economics take over the higher eroei renewable sources will become the natural choices and drag us out of the low eroei FF sink that we may be disappearing into?
Wind with eroei of around 20 and direct solar likely higher the residual issue is energy quality - storing energy and energy density issues - and this tells you where the smart research money should be going.
"the residual issue is energy quality - storing energy and energy density issues - and this tells you where the smart research money should be going."
True. Fortunately, we have time for this. The grid can absorb some variance even now, and a smartgrid and EV's (which absorb variance) will grow at roughly the same speed as renewables.
I would note that an E-ROI for wind of 20 applies to older, smaller models. E-ROI increases pretty proportionately by size, as you can see in the wind E-ROI chart #2 in the article posted a while ago by professor Cleveland (who specializes in E-ROI) - http://www.theoildrum.com/story/2006/10/17/18478/085 - keep in mind that standard sizes go off the chart, at 1-3MW. Vestas indicates 40+ for current models.
See my piece on wind at http://www.energypulse.net/centers/article/article_display.cfm?a_id=892 which seems to have preceded Cleveland's article. His EROEI is good, but his bird kill concern is unquantified and unjustified. Murray
" his bird kill concern is unquantified and unjustified."
Yeah, he seems to have been concerned with providing balance by noting all of the various objections to wind, without going into the detailed rebuttals we would have liked to see.
A few points on the idea of buildup of nuclear reactors:
Known uranium reserves vary from estimates of 40 to 70 years-worth left at CURRENT rates of use - even given that more deposits can doubtless be found, still, how long will we have enough uranium for traditional reactors on the truly massive scale the article proposes? Thus, is this a feasible long-term, large-scale solution?
Thorium reactors have several problems - one, they still require a rod of uranium 235, in addition to requiring an 'extra step' in the cycle to produce the equivalent level of energy reaction, which substantially increases cost of use vs. energy production over the old reactors. Even if we build thousands of all-thorium reactors, we STILL need uranium to run them. Thorium is estimated to be three times as plentiful as uranium...comforting for the reactor idea - until we use all the uranium.
(One of the biggest problems we face is that we are running short of almost ALL needed resources already - and many are interdependent; and most of the large scale products we discuss are as well.
For example, refining oil shale uses (and by nature sullies) tremendous amounts of fresh water - the world is already running low on that. Canada has loads of water - but will they be smart to use it up refining their huge 'reserves' of oil shale? I don't see them (or anyone) doing it on the scale required for oil shale to become a sizable part of our energy future. We are already running short of fresh water in the USA - we don't even have enough to process our own oil shale deposits, let alone the massive Canadian ones - we already can't provide Atlanta and the whole state of Georgia with enough water, with the Western USA coming up on the same huge problem; et al. Not going to happen, in my view. Desalinating seawater to get fresh for processing oil shale? Absurd - beyond the waste of fresh water, and what to do with the fouled water, etc., think of the costs and return. Interplay of simultaneously depleting resources is seldom taken into account in many given energy 'solutions', and is where most fall down -not saying anything about this post at all)
Back on reactors - thorium produces roughly half of the nuclear waste of uranium reactors - there is still a massive waste problem with that many reactors.
Thorium DOES produce plutonium - just not the same way that uranium does in the nuclear cycle. Uranium breaks down into plutonium, thorium builds up into plutonium via joining particles - not solving the 'no plutonium for nuclear weapons' problem at all; merely lessening it. These are just a few ideas on possible problems - there are doubtless more.
Enjoyed the post - thanks for writing.
" refining oil shale uses (and by nature sullies) tremendous amounts of fresh water"
Shell is pursuing in-situ oil production, and I suggested that electrical generation from kerogen would be likely in the event of something resembling "olduvai", but I'm not aware of anyone on this post, or even many people anywhere, suggesting the old retort method of deriving oil from kerogen (aka "oil shale").
Thorium DOES produce plutonium - just not the same way that uranium does in the nuclear cycle. Uranium breaks down into plutonium, thorium builds up into plutonium via joining particles - not solving the 'no plutonium for nuclear weapons' problem at all -seven
Not very likely though. Before thorium would become PU239, it would have to pass through the stage of U233 and U235 both of which are highly fissionable. Only a minute amount of thorium would become plutonium. Thorium breeder reactors are often considered good candidates for burning plutonium from nuclear weapons. You are telling the usual green scary stories about nuclear power.
Your misconceptions have been debunked over and over again, here and elsewhere. There's plenty of uranium and spent fuel can be recycled and the worst parts burned up in special reactors. spent fuel need not be a "massive" waste problem with recycling and even without.
Thorium reactors would only need an initial partial core of U-235 for initial criticality. Once established, the Th-232 to 233 conversion would be free of further U demands. And yes, plutonium would be detectable in a steady state thorium cycle but in near trace amounts
I get a distinct feeling from your post that you think that any type of society without electricity is automatically not civilized. Your flat wrong on this and need to look around you more without the toys no mater how enjoyable they are.
The current nuclear reactor construction bottleneck is large forgings for the reactor vessels at about 12 GW per year. New forges are coming on line to boost that within 5 years easily. Assuming 19 GW/year of new nukes is a bit conservative.
Since reactors now are moving up to around 1.6GW in size in many cases, then we already have around the 19GW/year capability.
Here is a discussion of nuclear build capability, costs and potential:
http://larouchepub.com/other/interviews/2006/3332tom_christopher.html
Industry Rebuilding Its Nuclear Manufacture Capacity
I could not read your link past "Lyndon LaRouche's Economic Recovery Act" due to his reputation.
Great job!
I've come to realise that models that simulate the transition from fossil fuel to non-fossil energy could be generalised to simulate three scenarios:
1) Smooth transition, such as what your graphs show;
2) A slow transition, where the ramp-up in non-fossil energy production does not keep pace with the decline in fossil fuels. In this case the graph would show a large "U" as total energy production declines before eventually increasing;
3) The worst case, where the "U" is so deep that it leads to social breakdown, war and collapse. The ramp-up in non-fossil fuel energy production is aborted as a consequence of general economic collapse. This is the scenario I hope we can avoid.
I'm an optimist and believe that scenario #1 is doable, but #2 and #3 are also possible. Most of the commentors on this site seem to expect either scenario #1 or scenario #3.
Models such as yours can help us to imagine scenario #1, which is the first step to bringing it about.
Regards,
Wonderful Work - Great Article
I do, however, think you're overlooking, somewhat, that potential of biomass. It's sustainable, and capable of being Scaled-up, greatly.
http://biopact.com/2008/02/surging-interest-fischer-tropsch-fuels.html
I agree to an extent, my university has recently found some micro-organism's that can be used in a cellulose based applications to get a 7.7 EROEI which has a lot of promise. I would hope we would not use environmental destructive and ecologically risky mono-cropping methods for our biomass source. Also we need to figure out our water usage problems here in the US.
I think Geothermal is the most efficient and highly overlooked resource. If drilling cost can be brought down enough we can drill anywhere for all the power we could ever need.
The goal of bio-fuels right now should be to end the choice between food or energy that we currently make...
There's no advanced degree in my background (just four years of college), let alone a completed degree of study. I am just an average Joe who just happened to come across this web site via a key word search on Google. But in my military service, I spent six of my ten years of service working as an intelligence analyst.
So, as I read more of the articles on this site, the more informed I become, and the clearer the concept of "peak oil" becomes to me. The potential fallout, ramifications of this topic are quite disturbing and threaten us all.
The majority of the comments that I've read on The Oil Drum are enlightning, and enhance my knowledge base. Every day, I drop in and read a lot of the latest imput.
The one thing that I want to say, at this point (as an outsider trying to understand some of the more technical information listed here) is this:
*There needs to be an effort to inform the people without advanced degrees (or education above college) of the importance of this issue, in a manner that makes sense to them.
If the masses truly aren't aware of the urgency of this issue, then they won't alter their ways of consumption.
An effort should be made to inform the people of China, India, and the United States in particular, via the web (and other media sources). Not just targeting the intelligensia, but the common folk as well.
No doubt this point is probably well known by many who frequent this site-I most likely am unware of the efforts being made to do. I'd write more, but my wife just got home and wants me to make dinner, and feed the dogs, and clean up around the house....
pnm identifed the problems
Let's see how pnm deals with the problems.
This is a great post. And I really appreciate how you posted the spreadsheets as part of the article.
How fast can alternatives grow? I went searching the literature and found a few papers relating energy return to growth rate. You might find them helpful in choosing which of your scenarios is technically feasible.
(WT = wind turbines, PV = photo voltaics, SOFC = solid oxide fuel cells, HSTPT = solar thermal parabolic)
This is a graph of several different power sources that are each growing as fast as possible without costing society a negative energy penalty. You can see why solar thermal is gaining popularity over PV.
Here are two papers:
"Dynamic exergy analysis for capacity expansion of regional power-generation systems: Case study of far West Texas" Humberto R. Becerra-Lopeza, Peter Golding, Energy 32 (2007) 2167–2186
"Dynamic energy analysis to assess maximum growth rates in developing power generation capacity: case study of India", Jyotirmay Mathur, Energy Policy 32 (2004) 281–287
Growing faster than the maximum energy positive rate might be possible with government intervention, but it does mean more poverty for society in the short term, to free resources for long term energy generation. Kind of like the US WWII war effort.
Excellent post. I read it to say, roughly, that it's not thermodynamically impossible that we're not entirely screwed in this particular century.
Throw in declining energy EROEI, declining NPK availability, altered rainfall patterns & soil depletion, add Tainterian declining returns on investments in complexity and "receding horizons" deriving from the "best first" principle of every kind of resource extraction. Add a pinch of ocean acidification, collapsed fisheries, withered amazon and coalmine fires while seemingly at the brink of self-reinforcing methane release. Throw in evolutionary dopamine addiction and the human capacity for delusion/aggression and stir well. Then look at it from a slightly more detached thousand-year timescale, which is still just a blip even in human terms. It's hard to project an "unscrewed" future by 3000 AD for any species, much less humans.
The original world of Lucy's Olduvai is looking pretty good by comparison with what we're cooking up.
Still, many thanks for this work. It's possible to hope for the best even when logic argues against it... so I will.
Excelsior.
DaveR,
I'm disappointed with your statement that 1918 89 million ton maximum represented a 'peak' for illinois coal(in the sense of resource depletion), it borders on the misleading IMHO. It is the 'peak year' for production but as late as 1991 coal production was 60 million tons not the 32 million tons of today. Clearly there was a shift away from Illinois coal to Wyoming coal and natural gas. It was a demand peak, not a resource peak.
Here's the historical record of illinois coal production
http://pubs.usgs.gov/of/1997/of97-447/Illinois_Basin.htm
Looking at the statistics year by year you can see the effect of depressions, mine openings and closings, etc.
If the EIA gives a recoverable rating of 37 billion tons than 32 million tons is 1000 years of production and I don't believe that illinois coal will remain 'unpopular' in the days ahead. I agree with the comment that coal is not as ameniable to Hubbert linearization as oil and gas, certainly not on the state level.
Hi marjorian,
Thanks for your comment. I was responding to Nick's comment "high sulfur Illinois coal peaked because of it's sulfur content, not because of resource limits." Nick clearly means "maximum" here.
"I don't believe that illinois coal will remain 'unpopular' in the days ahead. I agree with the comment that coal is not as ameniable to Hubbert linearization as oil and gas"
I am not aware of anyone who has used a Hubbert linearization for Illinois coal in their projections. The Energy Watch Group analysis is by state, but they use reserves rather than Hubbert linearization for their projections. People should not blindly use the Hubbert fits for oil or gas either. For more on this, see Adam Brandt's "Testing Hubbert"
http://abrandt.berkeley.edu/
"Certainly not at the state level"
A rate plot for Pennsylvania anthracite is given below. The dashed curve is the normal fit.
Dave
"I was responding to Nick's comment "high sulfur Illinois coal peaked because of it's sulfur content, not because of resource limits." Nick clearly means "maximum" here. "
Well, that's a perfectly reasonable interpretation, and it's roughly what I meant (I wasn't aware of the WWI burst of production), sp I would say now: IL coal dropped from it's normal production levels of about 60M tons/yr because of a better substitute, not because of resource limits.
Do you have any reason to believe it was a supply problem, and not falling demand?
Hi Nick,
I do not think your question has a simple answer. The USGS has done an outstanding study in coal in the Illinois basin. You may have seen it. The title is
U.S. Geological Survey Professional Paper 1625–D USGS Coal Assessment for the Illinois Basin, 2000
You can download it from
http://energy.er.usgs.gov/coal_assessments/
It is a 60-MB file.
The assessment includes coal in Illinois, Indiana, and Western Kentucky. First off, there is a lot of coal in the Illinois basin, around 200 billion tons, and the majority is in seams thicker than 42 inches. However, virtually all of the coal has high sulfur content. Only about 10% can be strip mined, and the production from surface mines has fallen sharply in Illinois, from 35 million short tons in 1969 to 5.6 million short tons in 2006. The study lists "depletion of low-cost reserves" as a factor in this decline, so I think it is fair to say that for surface-mined coal, there is a "supply problem."
For the underground coal, there is a demand problem; there is little demand for high-cost, high-sulfur coal. The studies referenced in the survey indicate that only about 10% of the Illinois coal is economically recoverable. It is not clear this situation will get better any time soon. Western surface-mined coal doesn't just win on sulfur. It also wins on price, and as more rail connections are added, it is likely to compete even more effectively. And by the time the West runs out, there may be effective competition from renewables.
Dave
It sounds like we see this the same way. Just to be clear, I would paraphrase the statement that "there is little demand for high-cost, high-sulfur coal. " as saying: "While the cost and sulfur content of Illinois basin coal has not gone up (say, due to mining of lower-cost or lower-sulfur portions), Western coal has become available which undercuts IL coal on price and sulfur content, thus greatly reducing demand for IL coal."
Does that make sense?
Hi Nick,
I am with you. If Eastern coal were cheaper than Western coal, people would have been more energetic about adding scrubbers so that they could use it.
To try to wrap up a great discussion, I will try to distinguish my approach from Jean Laherrere's and the Energy Watch Group. They start with the reserves, which are based on geology. From the perspective of reserves, it matters a great deal whether there is a lot of coal in Illinois; because it is counted as reserves. Depletion is taken into account explicitly. When there is production, it is subtracted from reserves.
My projections for future production are based on fits from past production data to sections of cumulative normal curves. These trends can stable over a hundred-year time frame that includes wars, depressions, technology change, and economic growth. Good examples would be US oil, British coal, and Pennsylvania anthracite. Depletion is not taken into account explicitly in this approach.
I think that the approaches are complementary, and in time they will converge. To the extent that the past is a guide, the oil and gas reserves will be approaching from the low side, and the coal reserves will be approaching from the high side. For the examples I gave, the production fits have given better predictions of the ultimate production than reserves, but that is no guarantee that they will be better for future world oil, gas, and coal.
Dave
That all makes perfect sense.
Just to clarify for readers/lurkers not as familiar with the details: the two other projections, Jean Laherrere's and the Energy Watch Group, are based on reserves. People who estimate reserves start with resources, which are based on geology, and apply an economic test: how much can be economically produced, given current technology and pricing? Now, in the case of coal, for many areas cheaper substitutes have appeared recently, which have made much of the coal reserves no longer competitive cost-wise. So, the groups that issue coal reserve estimates have in several cases dramatically reduced the official estimates of reserves.
The coal wasn't depleted, nor did it get more expensive, it's just no longer competitive, and is now considered unlikely to be mined.
This means that we are likely to see peak coal sooner than would have been expected in the past. However, it must be stressed that this is in an energy-rich environment.
Should we see a real energy crisis, as is envisioned in the Olduvai Scenario, these resources would be extremely valuable, and would be used if needed, thus restoring reserves to their former levels, and greatly increasing coal production and pushing peak coal out to a much more distant future.
In effect, use of these three coal projections is inappropriate where one is projecting a true energy crisis/Olduvai scenario.
Hi Luis, Euan,
What a great response! An all-time classic at The Oil Drum.
The scale of the maximum 3,000km^2/year solar plant build-out can be compared to the area affected by coal mining. I will take the mined-out area to be 1m^2 per metric ton of coal recovered. This is equivalent to assuming 50% recovery on a 1.5m average seam thickness, using the bituminous coal density 1.3t/m^3. At this rate, the current world production of 6Gt/year is affecting 6,000km^2/year. This means that the area affected by coal mining is comparable to the area that would be devoted to solar plants in your maximum build out.
At least with solar plants, we can choose locations that have very low environmental impact; we do not have to take off the top of a mountain in the Appalachians.
Dave
To get consumers and governments to move beyond BAU to something else, would you not need a signal? While there may be several types of signals, certainly price is one. It seems to me we would be better off if we had some inkling of what the world would look like and how it would function at different levels of very high oil prices. Say $200 a barrel up to $2000 a barrel. Carefully done we might have a better sense of when we might see some recognition and action.
MrHSmith8
$100/bbl is enough. The problem is the time lags to move to substitutes.
For instance, it will take GM another 3 years to get the Volt on the road, and several more years to satisfy demand. If all new vehicles were EV's, it would take 6 years to cut fleet fuel consumption by 50%.
After the peak in oil; for each “1 million barrels per day drop” in crude oil supply that occurs in a year, this is what it is equivalent, in other sources.
70 one gigawatt nuclear power plants or the approximate output of 283,000 one megawatt wind turbines. (Calculated at 25% of the rated wind plate capacity)
If crude oil output falls by this amount each year after peak, the above amounts would have to be constructed each and every year of this drop, to maintain energy supplies.
This is just with loss of oil , and does not include loss of NG or coal.
DocScience
http://www.angelfire.com/in/Gilbert1/tt.html
"for each “1 million barrels per day drop”...is equivalent to 70 one gigawatt nuclear power plants "
Well, in the US 1 gallon of gasoline will power a car for 21 miles, while an EV can go that distance on 7 KWH's.
On that basis, you'd need about 12 1GW nuclear plants, or 40,000 wind turbines (at 30% capacity factor, which is more realistic).
The current grid is at less than 50% capacity, and can handle the electrification of most light vehicles without expansion. Of course, that would mean more FF consumption - wind/solar/nuclear would be the way to go.
This is an interesting piece. Its weakness, of course, is that of the Olduvai hypothesis itself - the idea that energy and civilization are equivalent to one another. I think of this as essentially an error of metonymy that equates the objects of civilization with the civilization itself. Thus, electricity becomes not a useful convenience that both enabled and disabled the civilization, but essential to any kind of meaningful future.
That is not to say that I don't find electricity awfully convenient myself, but I don't mistake it for an essential, and neither should the rest of us.
Sharon
I may be wrong, but this user "SkipinBluff", who claims to
be a physicist of some sort, and indirectly name-dropped
Einstein, sure comes across as a condescending jerk by way
of assaulting DaveMart's understanding of things. I do
applaud Dave for being WAY more civil to this jerk than
he deserves. I would not tolerate his condescending crap
so kindly.
I really doubt he is a true academic, though I admit he does
possess the requisite arrogance to be one. On the other hand,
there is no shortage of @-holes in the world. Many academics
do have an overblown sense of self.