Cracking shale and why horizontal wells are slick
Posted by Heading Out on April 10, 2008 - 10:00am
This past week, courtesy of Leanan and Gail it seems that there have been more than the usual number of stories on natural gas developments and the potentials of formations such as the Utica shale, the Haynesville shale, and the Marcellus shale. These are all relatively tight deposits that have only become economic because of increasing gas prices and advances in technology. So I thought it might of interest to explain just a little of that technology, and why it costs so much more for the horizontal well. So the post is largely going to be on horizontal wells, vertical natural fractures and slick artificial ones. To “thank” Gail I am also going to try and describe a slide on ethanol use that I saw at a talk I went to this week on Global Warming by Richard Stegemeier, a member of the NAE, and lest it has been missed I will end with a reference to the Worlds Worst Wind Farm.
To begin with it’s probably best to start with rock pressure. And to explain this I am going to do some simplification, so, as I ask in most of these “techie talks”, to those who do know better please understand that this is trying to explain concepts, but also please do comment on where I may either accidentally or by error, get something wrong.
As we go deeper into the earth, the weight of the ground above us will also increase. For a very simple measure we can assume that this is around a 1 pound per square inch (psi) increase for every foot deeper we go. So if we were, for example, 10,000 ft down then the pressure in the rock due to that weight would, undisturbed, be around 10,000 psi. (This is about 7 times the pressure that you see coming out of a car wash pressure washer for example).
When a oilwell is drilled vertically down into that rock it does not see this pressure, but it does see a part of it. The reason is that the rock on either side of the hole can now expand into the hole, and we’d rather it didn’t. (It’s somewhat as though you step on a rubber eraser – the eraser will bulge out laterally as it compresses vertically under your weight). The resistant pressure in the horizontal direction can be calculated as a function of the vertical pressure through a ratio known as Poisson’s Ratio . Sufficient for our discussion to say that can have a value of about 0.3. So that if we are 10,000 ft down, then the vertical pressure on the rock will be around 10,000 psi, and the horizontal pressure will be around 3,000 psi. If the well is vertical then the casing for the well has to be designed for the 3,000 psi level.
Now, if instead of just drilling the well vertically I turned and drilled it out horizontally through the rock, then the hole would now have the 10,000 psi squeezing down vertically, and the 3,000 psi coming in from the side. So the first thought that we have is that the casing (the lining that we put into the hole to make sure that it stays open) has to be a bit stronger. Life gets, however, a bit more complicated than that. When you put a hole into ground that is under pressure, the first response of the rock is to try and move the weight of the rock over the hole onto the rock on the sides of the hole. This roughly doubles the pressure that is on that thin layer. Before the hole was put there that particular rock was held in place by the rock around it, and collectively the mass could carry the original pressure. But now there is no rock where the hole is, and thus the confining pressure on the rock there is less. (In technical terms you have shifted the load from a triaxial confinement under 10,000 psi to a uniaxial load of 20,000 psi.) The result can be that the rock on the sides of the hole crushes under the load. This then puts crushed rock or sand into the hole, and that interferes with lots of things. Now you can possibly stop that by keeping the pressure high in the liquid that you are using inside the hole to get the drilled rock out (the drilling mud), but if you keep that pressure too high, then the oil/gas won’t flow to the well and so you have to drop it down to a certain level.
Life also gets a bit more complicated in reality, since the presence of the fluid in the rock tends to even out the pressure within it. So that while, relatively close to the surface, and in a dry rock the ratios may be as I gave them earlier, with a fluid saturated rock, and in an over-pressured region, the horizontal pressure can be as high as 80% or more of the vertical value. The values generally get closer to 100% as the wells go even deeper, but that is another story.
So rock pressure is the first problem that you have to deal with. But why do we drill the horizontal holes in the first place, why can’t we just use the old vertical ones. Well the reason is that the old ones didn’t work very well. And to explain that I am gong to try and re-explain a recent article from Penn State . (then I’ll give the relevant quote).
Shale is a very fine grained rock, and though gas can gather in the small pores of its structure, if the gas is to flow to a well, then it has to migrate through passages that are very narrow, and thus very resistive to that flow. However, as the shale has been formed under geological pressure and over time, the pressures not only compressed it from mud into shale, but they also caused it to fracture. In the Marcellus shale, for example, the cracks that occurred in the shale are roughly vertical, and form two sets that are perpendicular to one another.
The first advantage that a horizontal well has, over a vertical one, is that the well can penetrate a long way through the rock that carries the oil or gas (OG). The amount of OG that comes from the rock is, in part, a function of how long the length of well is in the rock that carries it. So that while a vertical well might produce say 800 bd from a well that goes straight through a 200 ft thick layer of oil-bearing rock, when the well is drilled so that it goes out 4 miles horizontally through the oil-bearing rock, then the production per day may go up to 10,000 barrels.
The second advantage relates to the way in which the fractures lie in the rock. Because they are vertical, a vertical well won’t hit very many of them, and so since these fractures provide an easy flow of OG to the well, rather than the difficult path through just the rock, then the well will not show very much production. (And this was the case with many of these shales when tested earlier).
However if the well is horizontal (see figure) then the well will intersect many of these fractures and in drawing the fluid from them will also provide an easy path for fluid to ease out of the rock into the fracture paths, so that the entire rock can be more easily drained.
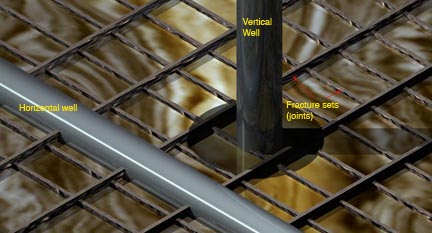
Now in the picture I have shown one set of joints as being bigger than the other. And that is usually the case, because the horizontal pressure, that earlier I had suggested was the same in each direction, actually usually isn’t. The strongest horizontal pressure will tend to close up those fractures that run perpendicular to it, and tend to open the ones that run parallel with it. Thus it helps to know at the level of the shale, what the pressures in the different directions are (those engineering among us generally refer to them as stresses rather than pressures). The best direction to drill is then perpendicular to the maximum horizontal pressure, if we want to take the best advantage of the fractures in the rock. The only problem with this is that it also increases the pressures on the sides of the borehole, so that if we go that way, and the rock is not that strong, then we may be making the borehole stability worse.
But even with a horizontal well the production may not be that great, because the fractures are still relatively narrow, and so flow won’t be that fast. And so there is another tool that can be used, and that is to deliberately put a crack into the rock on the side of the borehole. On a very small scale, if you look at the picture, you can see a shaded zone around the vertical well. If I could make a crack out from the well at that level and grow it out just a short way you can see that it already intersects two of the better joint sets, whereas at the beginning the well didn’t reach any. And if we could do this from the horizontal well and grow that crack out a goodly distance horizontally, then it would intersect a lot of the vertical fractures and production would become high and useful.
There are, however, three snags to forming and growing that crack, all solvable, but all costing additional money. The first is that if we just grow the crack out and then let the weight of the overlying rock close it up again, then we haven’t made a whole lot of difference. So we have to prop the crack open. For this we need to inject relatively fine grained particles (let’s call it sand, though the technical term is proppant) into the crack in enough quantity that it will fill up the crack and hold it open so that it gives an easy path through the rock to the well for the OG. (We won’t go into what a mess pumping sand at more than 10,000 psi makes of the pump – Halliburton gets paid very nicely to fix those problems).
The second snag is that trying to push sand into a thin crack and get it to go very far can be an exercise in futility. Among other things if you are using plain water the sand tends to settle to the bottom rather fast, and if it fills the crack near the well, it then acts as a filter to stop sand going back further into the slot. So now we change the chemistry of the water by adding what are usually known as long-chain polymers. These chemicals thicken the water so that it will (at relatively low chemical percentages) suspend the sand in the fluid. Because these molecules are also slippery (in another variety they are added to the water in crowd control water cannons to produce what is known as Banana Water – since it makes the street too slippery to stand on) they also reduce the friction between the fluid flow and the walls of the crack, and this also helps carry the sand further back into the crack, and gives the slickwater title to the hydrofrac.
The third snag is a bit more technical. You remember that earlier on I talked about the pressure about the hole causing the sides of the horizontal well to crush. Well at the top and bottom of the well instead of the rock seeing this additional crushing pressure, the shifting of the vertical load to the walls of the hole, can mean that the rock will go into tension, where it is much weaker. As a result cracks can appear in the top and bottom of the horizontal hole. Why is this a problem? Because the easy way to cause a fracture to grow is to fill the well with liquid and increase the pressure of the liquid until the rock breaks. (Hence hydraulic fracture or hydrofrac). But if there is a crack there already then just increasing the pressure in the hole causes that crack to grow. And if the crack is vertical then it won’t grow in the horizontal direction we want. And so it is time to call in the engineers (who also don’t come cheap) to do the interesting things that cause the crack to grow in the right direction.
The benefits to all this for the Marcellus has been described by Engelder.
"Conservatively, we generally only consider 10 percent of gas in place as a potential resource," said Engelder. "The key, of course, is that the Marcellus is more easily produced by horizontal drilling across fractures, and until recently, gas production companies seemed unaware of the presence of the natural fractures necessary for magnifying the success of horizontal drilling in the Marcellus." The U.S. currently produces roughly 30 trillion cubic feet of gas a year, and these numbers are dropping. According to Engelder, the technology exists to recover 50 trillion cubic feet of gas from the Marcellus, thus keeping the U.S. production up. If this recovery is realized, the Marcellus reservoir would be considered a Super Giant gas field. . . . . These fractures, referred to as J1 fractures by Engelder and Lash, run as slices from the northeast to the southwest in the Marcellus shale and are fairly close together. While a vertical well may cross one of these fractures and other less productive fractures, a horizontally drilled well aimed to the north northwest will cross a series of very productive J1 fractures.
You can see examples of the fracture patterns in the Marcellus here
The upfront money may give some pause to prospectors. A typical well that drills straight down to a depth of about 2,000 to 3,000 feet costs roughly $800,000.
But in the Marcellus Shale, Range and other companies hope a different kind of drilling might yield better results — one in which a well is dug straight down to depths of about 6,000 feet or more, before making a right angle to drill horizontally into the shale. That kind of well could cost a company $3 million to build, not counting the cost of leasing the land, Engelder said.
The company, in a December financial report, estimated that two horizontal wells are producing roughly 4.6 million cubic feet of gas per day. Tests on an additional three recently completed horizontal wells showed potential for a total of 12.7 million cubic feet of gas per day. Industry experts call those results promising.
The benefits have also been projected here.And while they may be considerable, it is only after the wells are in production, and not only initial flows, but also well lifetimes are established, that the true benefit will become apparent.
But until some solid, repeatable well data emerges, the Haynesville will remain more diamond in the rough than diamond ring. As BMO Capital Markets analyst Dan McSpirit rightly noted in a report last week: "The proof (of Haynesville economics) is in how the wells get drilled and the rates of return such operations yield." He added, "These are early innings. Lasting value creation should be revealed later in the game."
.
So there you have a brief explanation of how the new technology is slowing, though it won’t stop, the declining gas reserve in the United States, And so on to a couple of other items, for those who have survived this far.
I attended a talk on Global Warming this past week, by Richard Stegemeier a member of the National Academy of Engineering, who began by drawing a distinction between engineers and scientists, and noting that it is largely climate scientists that have been involved in the publications of the IPCC. He was somewhat cynical about the cherry-picking of data that those scientists had used to try and buttress their arguments (citing for example the major retreat of the Glacier at Glacier Bay National Park, which had its most significant fraction before the GHG concentrations began to increase, and in some parts is now advancing ), but, in the main, (and why I mention it) he came back to the same points that Dave Rutledge has given here, namely that by about 2050 the fossil fuels that are currently considered to be causing Climate Change will have been used up, so the dramatic predictions that are made for global doom are more than a little unrealistic since, by the time of 2100, when the projections usually predict that there will be serious global flooding because of these GHGs, the world will, in actuality be some 50 years beyond the time that any of the current suspects will still be in significant use. As those of you who read these notes may remember I think that Dave is a bit of a pessimist when it comes to the size of the ultimate coal reserve, but with a decline rate of 4% for oil I was moved to comment at the presentation that it reflected the views of an almost incredible optimist.
But he did give an interesting view on ethanol (corn based) that I had not considered before. It went something like this:
The average person will purchase around 400 gallons of gas for their car in a typical year. To replace this with ethanol will require purchase of around 600 gal. To produce that amount of ethanol the farmer will have used about 300 gal in growing and harvesting the corn needed for the entire amount; it will then take some 3100 gallons of ethanol to carry out the distillation required, and the some 250 gallons to carry out the distribution of the ethanol to the service stations. Total ethanol required to give the average driver a year’s worth of fuel – 5,300 gallons.
(Small caveat – these are his numbers and I haven’t checked them).
And if you have stuck with me so far, a rather humorous story, at least as far as the London Times was concerned on Sunday. It is, in their opinion, the world’s worst wind farm .
Contact
- Content: editors at theoildrum dot com
- Tech support: support at theoildrum dot com
License

This work is licensed under a Creative Commons Attribution-Share Alike 3.0 United States License.
If what you say is true about fossil fuels, we need to go full speed ahead on renewables. If what you say is untrue, we need to go full speed ahead on renewables. Either way, we need to accelerate the introduction of renewables in order to deal with FF shortages or an abundance of fossil fuels. Of course it would help if we had better priorities, less attuned to perpetual war and more attuned to using energy resources that are more amendable to peaceful cooperation.
There will be no oil or coal for peace program; there will only be fighting over whatever is left. Forward thinking and acting could actually enable a certain reasonable level of survival, maybe not the abundance we are used to but a tolerable living nonetheless.
And by the way, we can start by cutting back on our energy use; it is not really that difficult with a little bit of commitment. Nothing really fancy is necessary, for example, to cut one's electricity use by 25% with the right appliances, clothes lines, CFLs, conservation habits, power strips, etc.
"I attended a talk on Global Warming this past week, by Richard Stegemeier a member of the National Academy of Engineering, who began by drawing a distinction between engineers and scientists, and noting that it is largely climate scientists that have been involved in the publications of the IPCC".
Holy cow. There are climate scientists and not Oil CEOs on the IPCC. I cannot believe how misleading your statements are. This article is ridiculous. I don't know why you want to start this conversation on TOD but you have. Glaciers are retreating all of the world and you just cherry picked some data.
"Glaciers are retreating all of the world and you just cherry picked some data."
Absolutely false. Antarctic ice is the largest extent it's been in 50 years, some 40% more ice extent. Tabet glaciers are increasing, so too are glaciers in South America. There's some 3500 glaciers around the world, the alarmists are looking at only a small handfull of them and extrapolating.
I have worked in scientific (not climate) research for a few years now. If anybody on one of my teams was being dishonest, I would blow the whistle and so would most folks in this line of work. I've looked at the research papers and the overwhelming consensus is that climate change is real. If you would like to post a peer-reviewed link...
Show me the peer reviewed links that all the world's glaciers are shrinking.
Antarctica:
http://icecap.us/images/uploads/Wilkins_Fracture_Barely_A_Blip_in_the_Bi...
"Mountain glaciers and snow cover on average have
declined in both hemispheres."
--IPCC Fourth Assessment Report
The IPCC is not peer reviewed. Sources from science journals or other publications that shows each one that is shrinking, how long it has been shrinking (before the 1900's?).
If the world is warming ice can be expected to melt and the water run into the sea and also if the oceans warm they expand - so, if the world warms the sea level will rise.
Is the sea level rising? A simple question, what is the answer?
Yes, it is rising, but you are about to find out things are not what you have been led to believe.
Here is the change in sea level for the past 20,000 years:

For the past 8,000 years:

(From http://www.globalwarmingart.com/wiki/Sea_Level_Gallery)
Now for the past 110 years:

Notice the flat rate of 0.19 feet/century. (From http://tidesandcurrents.noaa.gov/sltrends/sltrends_global_station.shtml?...)
Recent article:
Recent Satelite data:


(From http://sealevel.jpl.nasa.gov/science/invest-nerem.html)
The IPPC forth report says there has been no, repeat NO, accelaration in the rate of sea level change. Yet they predict more than the current rate. Why has there not been any change in the rate yet? How much must that change be? Well, 3 to 4 TIMES the current rate to match the IPCC predictions, 30-40 TIMES to make Gore's 20ft prediction. Thus the graph would have to look like this:

So all the hype about radical sea level changes has not occured yet, read below on the islands in the Pacific too.
So, you agree - overall the world is warming - the sea level proves it - change IS happening. If the temperatures are changing that means climate is too. Clearly from your charts this is normal even without man's actions.
What is not normal is burning of fossil fuels (that have taken millions of years to accumulate) in a few tens of years - this causes a massive discontinuity in C02 levels and it is MAN MADE, so it is avoidable - any climate changes resulting from this will likely be discontinuous also and, by implication, avoidable.
Because of inertia you would never expect to see simmultaneous cause and effect - there WILL always be a time lag.
The sea level is a proxy for AVERAGE temperature change and because of the huge bulk of the Oceans there is massive inertia - near the North pole where we see the normal (self limiting, due to the curvature of the Earth) positive feedback from melting sea ice the temperature changes (and climate changes) are way more than average - this implies that elsewhere the changes will be less than average (where glaciers are not retreating? ... the South Pole?)
However, few places have zero change in temperature and hence zero change in climate.
History tells us to expect climate change, it is not change that is the potential problem but RATE of change.
So this then begs the question, when will the rate of sea level start to accelarate? If all these glaciers are melting, and have been because of AGW of some 20-30 years now, why has that water flow into the seas not increased the rate of rise? It also begs the question, if this lack of rise, if it continues flat, kill AGW theory?
So realize what you are saying. You are saying that there is no sea level rise at the moment that is caused by AGW. Thus all the media reports, all the hype about the CURRENT sea level rise is flat wrong right? You can't have it both ways. If the current trend is flat and, as you claim, the change in the rate is yet to come, then the current rate CANNOT be from AGW. Thus all the hype that it is from AGW must be wrong. By your own admission.
Sea level doesn't change on a dime. It is probably the slowest acting effect of global warming.
If you do look more closely at the recent data (the last 100 years or so), the sea level rise is accelerating, though quite modestly. At this point it's nothing terrible, but it does have the potential to become much worse.
Did you not read the abstract?
"Extending the sea level record back over the entire century suggests that the high variability in the rates of sea level change observed over the past 20 years were not particularly unusual. The rate of sea level change was found to be larger in the early part of last century (2.03 ± 0.35 mm/yr 1904–1953), in comparison with the latter part (1.45 ± 0.34 mm/yr 1954–2003). The highest decadal rate of rise occurred in the decade centred on 1980 (5.31 mm/yr) with the lowest rate of rise occurring in the decade centred on 1964 (−1.49 mm/yr). "
And you have a reference to back up your claim it won't turn on a dime, and you have a reference that it will become much worse. And you fully agree then that the current rise, in spite of Gore and others, is NOT currently from AGW. Right?
I don't know what the future will be and neither do the IPCC researchers - or you! Not least because nobody knows what all the variables and feedbacks are.
The climate research gives probabilities not certainties - if you are looking for certainty you won't get it. The data the IPCC and others use is statistical and has error bars, it is not 100% accurate and you need to take lenghty periods of time (decades) to get a feel for what is happening. The statistics are not as accurate as you think they are (nor are the IEA and EIA oil statistics, on a month by month basis!)
Is there climate change? ... yes! North Polar ice melting more and more for one good example! Will the climate of some parts of the world change adversely in the future ... Yes!
Is man responsible for part of the change? ... yes! How big a part? ... nobody knows! The historical temperature data does not go up in straight lines during warming periods and it won't do now - just because the temperature is not doing what you think it should for AGW does not mean there is no AGW due to fossil fuel burning.
Is man's use of fossil fuel, horizantle drilling, non-organic farming, overfishing etc etc sustainable ... NO!
Peak oil, peak food, peak population and peak pensions are just a few of the unsustainable challenges besides anthopogenic climate change facing man.
BAU means an uncertain world - get used to it.
Richard is just trying to bamboozle you by changing the plot scales. The sea level rise is accelerating and he has already been corrected on this point on this list.
Chris
Then you better tell the IPCC as their 2001 report says: “No significant acceleration in the rate of sea level rise during the 20th century has been detected.” The 2007 report says: "Global average sea level rose at an average rate of 1.8 [1.3 to 2.3] mm per year over 1961 to 2003. The rate was faster over 1993 to 2003: about 3.1 [2.4 to 3.8] mm per year. Whether the faster rate for 1993 to 2003 reflects decadal variability or an increase in the longer-term trend is unclear."
Include in your letter to the IPCC a copy to Holgate from the above reference I cited.
Interesting, Chris, you did not provide a reference. Please do so. How much is the change in the rate? You did not say.But I do have references that shows it has NOT changed From:
http://www.newsbusters.org/blogs/noel-sheppard/2007/09/22/unbelievably-d...
More refs:
http://www.worldclimatereport.com/index.php/2008/01/04/lowering-sea-leve...
(Kolker, A. S., and S. Hameed. 2007. Meteorologically driven trends in sea level rise. Geophysical Research Letters, 34, L23616, doi:10.1029/2007GL031814.)
http://www.worldclimatereport.com/index.php/2007/09/14/sea-level-slowdow...
Richard,
it is not possible to debate with you because you do not do so in good faith on this issue. As a simple exampe, you ask for references and links from me now when you know that I have already demonstrated your contention to be false here on TOD.
Chris
I post references, even if i have to do it several times. If it is false that sea level has not changed its rate then SHOW US!! How difficult can it be to get a ref and post it? None! So do it, back up your claim with one reference.
I have already shown by the references above that the rate of sea level rise has NOT changed. How on earth is that NOT on good faith?!
If there is any lack of good faith it's your claim that this is MY contention when all I have done is post the references, hence it is the conclusion of these researchers that there has not been any change in the rate. So go take your disagreement to them.
Dogmatism at its best again.
While you are at getting that reference, send it to this too, I'm sure they will be receptive to be shown by you that they are wrong.
http://www.oism.org/pproject/s33p36.htm
Did you actually read this chart or was this just another quick and dirty cut and paste job?
Just looking at the graph, sea level increased by 5 inches from 1850 to 1950. It increased by more than 6 inches from 1950 to just past 2000. The total increase appears to be greater in the latter 50 years than in the previous 100 years. The graph is misleading, as an absolute change in 50 years which is greater than an absolute change in 100 years can't have the same slope. The annotation "trend continues at same slope" appears to be wrong and could just be b.s. on your part.
So, no, this graph seems to show that you are wrong and supports others on this site arguing that you are wrong.
Perhaps you could draw the line from 1800 to compare 100 years with 100 years. But that would not support your conclusions.
Not to mention that last decade or so seems to be trending upwards.
Your 7 inches per century doesn't even make sense. Which century? Certainly not from 1800 to 1900. And from 1900 to 2000, it increased by 8 inches.
So, what is it about this graph that makes any sense and even remotely supports your conclusions?
Please stop blaming the messenger. If you have a problem with this graph, or anything I post with a reference, then take it up with them. This is not MY graph, this is the graph from that website. The point is the rate is not changing. To match the IPCC, to get that trend you would need, it would have to be 3 TIMES the current rate. As noted in the references I've posted before, the rate is not changing, it is fluctuating within normal ranges. If you have a reference that supports the notion that the rate has changed, please post it. If not, then the current hype that the changes in sea level is because of global warming must be wrong. Certainly the 19,000 scientists who added their names to this petition think AGW is wrong. Go contact them and show them they are misguided. http://www.oism.org/pproject/s33p357.htm
So,now the new cop out is that we should go to your original source if you post stuff on this site that is mislabled and fails to support your position. No. If you are going to post here, you should defend your own data, not expect others to explain your data by going to your source.
You have chosen to be the messenger for those who think that global warming is a hoax. Then you post a graph that says the opposite of what you say about sea level rise and then ask me to not blame the messenger. If you don't want to be blamed, then quit posting info that says the opposite of what you purport to believe. As long as you keep posting stuff on this website that you use to support your position, then you should actually analyze your information to ensure that it says what you think it says.
In fact, you have posted a reference that actually indicates that the rate is changing. I assume you stand by your reference. So, thanks for providing a reference that shows that the rate of change is increasing.
But you are mixing two concepts. First, has the rate of sea level rise changed. It certainly appears that it has just from what you've posted here; never mind what other references are out there. Once we have determined that the rate has changed, the question becomes one of causation. According to your reference, the IPCC is not ready to state that they have enough data to confirm that the sea level rise is caused by global warming. As scientists, they are taking a conservative position and as, is typical of scientists, they are calling for further study, including more years of data. This is to be expected.
But one cannot conclude that AGW is not causing sea level rise just because scientists have not conclusively stated the opposite.
Don't ask us to contact your so called scientists. Either defend your positions with valid data or quit posting. Next time someone else posts here in support of AGW, should you be expected to contact the IPCC?
Or maybe you should. We here in Boulder have probably the greatest concentration of climate scientists in the world. Start with NCAR. Take the tour and talk to the scientists who actually were part of the IPCC. Argue with them. They can take everything you throw at them. I have seen them in action. But don't tell them to go contact one of your references if you are having problems arguing with them.
"In fact, you have posted a reference that actually indicates that the rate is changing. I assume you stand by your reference."
Yes I do stand with the data. It's saw toothed, did you not see the other 2 that has a higher rate for a while, then drops? This is just another of those saw tooth changes. In fact, again I refer you to the IPCC 2007 report about this very point: "Global average sea level rose at an average rate of 1.8 [1.3 to 2.3] mm per year over 1961 to 2003. The rate was faster over 1993 to 2003: about 3.1 [2.4 to 3.8] mm per year. Whether the faster rate for 1993 to 2003 reflects decadal variability or an increase in the longer-term trend is unclear. "
But you are missing the whole point. To get to the IPCC's 20 inches in 100 years would require a rate THREE TIMES the observed rate. You claim the IPCC is conservative, so too do people like Gore who wants 20 feet of rise, that's THIRTY TIMES the current rate! Others have thrown out even higher rates over shorter distances of time.
"But one cannot conclude that AGW is not causing sea level rise just because scientists have not conclusively stated the opposite." Nor can you claim the opposite then.
Bottom line: Is the current rate BECAUSE of AGW? Yes or no. If Yes, why has the rate not changed to the value it should under the predictions? If not then all the current hype on the MSM about the rise because of AGW is flat wrong. Which is it?
Richard - is it possible that the change in trend around 1860 marks the onset of melt following The Little Ice Age?
I'm surprised this thread is still going - its been very interesting. If you reply can you send me an email flagging the reply - since I may forget to come back here.
Euan
It certainly looks that way doesn't it. That was my first thought, but did not want to speculate.
Thanks Richard. Its too simple, isn't it?
I'm just back from X country skiing in Norway where on quiet evenings in the mountain cabins I read about the advance of Norwegian mountain glaciers during The Little Ice Age and about the sea ice apron that surrounded South Greenland - which no doubt was reflected by extended ice cap and glaciers on shore. I've also read about perma-frost inside excavated Greenland Norse settlements - pretty damned sure that permafrost wasn't there when the settlement was inhabited during the MWP.
Are you refering to me or the Warm Mongers? Because those are the VERY arguments I use to support the skeptical position!! There is nothing in what you said I would disagree with at all. Thank you for supporting my position.
The IPCC work is absolutely peer reviewed, much of from scientists at the worlds great universities. The idea that they would falsify their work and that others would collude is risible.
Nasa's GRACE program has measured ice sheet loss from Greenland over a period of at least 10 years; and the loss is accelerating.
There is also plenty of evidence of glacier loss, all over the world. There is also plenty of other evidence of warming so I am afraid climate change sceptics are beginning to look just a little bit silly, irrational even.
Another reader asks for evidence of rising sea levels. Check out the Carteret islands (Papua New Guinea) and Tuvalu (S. Pacific).
At the same time I understand and support Heading Outs comment on there being insufficient FF to raise CO2 levels by the amount the IPCC a warning us about. Unfortunately I am not sure that that matters. I think we have committed ourselves to sufficient global warming already (temperature inertia in the sea is holding back atmospheric warming) so temperatures will continue to rise causing massive dislocation and damage that is now inescapable.
That does not mean there is no point in working hard to reduce FF use, of course we must. We might just get lucky and only have PO to worry about!
"The IPCC work is absolutely peer reviewed, much of from scientists at the worlds great universities."
Here is a list of other scientists from the world’s great universities who do NOT accept the "consensus", this list is growing.
http://www.businessandmedia.org/specialreports/2007/globalwarming/Skepti...
And the papers in the IPCC report are not peer reviewed at all. They are written for the report and not subjected to other scrutiny before publication. In fact, the summaries are written first by non-scientists and then the scientists are told what to put in their reports to coincide with the summaries. This is not my wild accusation; this is a charge from the very scientists themselves who wrote for the IPCC.
"Another reader asks for evidence of rising sea levels. Check out the Carteret islands (Papua New Guinea) and Tuvalu (S. Pacific)."
Yes, you had better get up to date on this. Tuvalu has NOTHING to do with sea level rise and everything to do with over population and bad land practices. There's lots about this on the Net, simple google will find it.
"I think we have committed ourselves to sufficient global warming already (temperature inertia in the sea is holding back atmospheric warming) so temperatures will continue to rise causing massive dislocation and damage that is now inescapable."
What peer reviewed papers do you have to back up this "thought"?
http://www.middlebury.net/op-ed/global-warming-01.html
this link shows how Co2 works.
so before you run around like chicken little, lets first look at
the basic facts of CO2.
soon to come is a new report.
from
http://aqua.nasa.gov/
so lets all wait before shouting like loons.
coming soon, and you wont be too pleased.
mr. neutral
Thanks for posting that nice summary of skepticism of AGW.
This is also good:
http://www.energypulse.net/centers/article/article_display.cfm?a_id=1598
"AGW is just such bad science at this time that I want nothing to do with it."
"In the AGW school of warming, the litany of one poor package of junk science after another - attempts at distortion, editing, hiding data, changing data (Hansen), inventing trends (Mann), changing conclusions (IPCC), ad hominem attacks (Hansen and most of them), censorship by a hysterical media, outrageously incapable computer modeling, and even outright lies (fill in the names here…) - should send enough alarm bells ringing to warn even the most obtuse about what is happening; though not loud enough to alarm the faithful it seems. It really is a new religion."
Hmmm.... his bio says,
His articles on the site include,
"Anthropogenically driven Global Warming (AGW): Some pro and con comments" [if you read the article, it's all con)
"The Inevitable Nuclear Resurgence, and the Inevitable Panic Attacks"
the rest are just on how awesome nuclear reactors are.
GoogleScholar (only in beta, so it might miss a lot) pulls up
- a book, Health Aspects of High-level Radioactive Wastes [pdf]
- Science and Risk
- Origins and Management of Radioactive Waste
and the same in French.
So he appears to be quite the authority on radiation hazards to humans. But about climate science he can claim no special authority, and has written no peer-reviewed articles on the topic so far as I can see. He seems to spend most of his time advocating in various media for more nuclear reactors.
Well, at least we can't accuse him of being self-interested, since one typical argument of pro-nuclear people is that it'll mitigate climate change... if climate change doesn't exist then no mitigation is needed and we can forget the nukes, right? Sutherland doesn't seem to be aware of peak oil or other resource issues.
Global Warming Petition
http://www.oism.org/pproject/
Sorry to burst your bubble, but the fact is, the IPCC reports aren't "reviewed" by anyone. Here's how the system works:
1. The reports are written by a small group, some of which aren't even scientists, and all but one of which has a personal stake in preserving the hoax. These writers are political appointees, not chosen from the best of the scientists actually doing empirical science. All of the global warming panic is being generated by "models", not empirical science. In fact the models are so flawed they are the laughing stock of the broader climate science community.
2. After the draft is finished, then the "committee" is invited to comment. The writing group can reject any comment it wants, and in particular rejects any comment which seriously disagrees with its already established opinion. The literature is full of irate letters from scientists who howlingly object to the censorship, to no avail. The writers word is final... there is absolutely no "peer review" allowed. The Secretary General of the UN himself cannot alter one word of the report.
Yes, I'm an atmospheric physicist, and I realize most of you on this forum are not. I can recognize "cut-and-paste" as well as anyone.
For those of you who are not rocket scientists, you might like to read this excellent summary which was written for the layman at this link
http://www.middlebury.net/op-ed/global-warming-01.html
For a more detailed discussion of the Corruption of the UN IPCC reports, try
http://www.meridian.org.uk/Resources/Global%20Dynamics/IPCC/index.htm
"Modeling" is not science. It is a prediction which unfortunately is fatally flawed because the modelers, in their urgency to promote the hoax for political and economic gain, deliberately omit critical variables from their models which would expose the hoax for what is is.
This is not a "conspiracy". This is a collection of junk scientists, policy wonks, journalists, and radical environmentalists who independently support the panic because it will ( and already has ) divert vast sums of money into a large assortment of environmental projects.
I am in weekly contact ( indeed, almost daily ) with some of the finest climate scientists on the planet, and to date, not one of my colleagues is buying into the anthropogenic global warming hoopla. The notion that "all the world's scientists agree" in in fact part of the hoax mechanism, and nothing could be further from the truth.
In fact, "warming" came to a screeching halt several years ago despite continuously increasing CO2 levels, and since then there has been a slight cooling trend, according to the accepted HadCRUt3 data which now shows a decadal cooling trend of 0.4 degrees Centigrade per decade.
You all can argue until you are blue in the face, it will not change the science one iota. Climate change is a natural phenomenon, and to date there is not one scintilla of actual empirical science to indicate the future will be any more than a cyclical repetition of the past.
Fortunately, Solar Cycle 24 is predicted to be a fairly warm one lasting 11 years, so hopefully the cooling trend will self-arrest, but also unfortunately, Solar Cycle 25, which will peak about 2022 is going to be one of the quietest sun cycles in many decades, with significant cooling to affect most of the rest of the 21st century.
You may now continue with your cut-and-paste BS which evidently even the plagiarists on this forum do not actually understand.
Thankyou for posting this.
I've got an email yesterday showing that Al Gore has admitted he owns or has direct stakes in environmental companies that are directly benefiting from the alarmism. How ironic, these very people here who hate capitalism and champion AGW are being duped by the very Minister of the dogma (Al Gore) practicing capitalism at its worse by creating a need for his "product" based on the fear of the masses. So where is Gore getting the $300 million from to promote the alarmism of AGW? From the money his companies will make off it, which in turn will come from the people conned by his message.
When I get back to my computer I'll post it.
Thanks again for the support of integrity in science.
Kindly spare us your Gore fetish.
I have no doubt that there are many people who support peak oil theory on this site and elsewhere who also invest in oil and other energy companies, who play the commodities market, and who are otherwise invested in companies or commodities which will profit from a shortage of oil. I guess all of us here are being duped.
Your real need here is not to support integrity in science. Your overriding passion is to defeat what you think is a position purely driven by socialism and the desire to destroy capitalism.
So, really, in your view, all the time, effort, and passion that Gore has spent getting the message out on global warming over the years is just driven by pure greed. And, oh my God, he is investing in environmental companies. Well, at least he is clearly a capitalist.
You have gone down that road and yet you bristle when it is pointed out that the source of much of your "information" comes from organizations who are mainly driven by the need to perpetuate the status quo.
Thanks for coming out and showing us where you are really coming from.
How is posting peer reviewed papers that shows the sea level has not changed it's rate "comes from organizations who are mainly driven by the need to perpetuate the status quo. " Please explain.
The difference is that Gore is making his own demand. It's snake oil salesmanship pure and simple. He makes up the hype and claims the world will die if we do not act and buy into his "solutions". If any one else did this everyone here would be screaming to have his head. But because Gore is the messiah of the orthodoxy then it's OK. He's no different than the evangelicals on TV fleecing the flock of followers.
Excellent! Tell us, for what university, institution or company do you work for? Have you a webpage detailing your qualifications, experience and publications?
Please name these scientists, so that we can learn more.
If you've no reply, we can only conclude you're talking bollocks...
"If you've no reply, we can only conclude you're talking bollocks..."
Dogmatism at it's best. Instead of taking the man at his word, you assume he's lying due to some ulterior motive, because AGW orthodoxy must be maintained at all costs. This is how true religion works.
The big test will be will you give up AGW if what he postrd is true? Will you state that? That will be the true test to see where your own motives are.
Yep, the cracks in AGW are widening. Take some advice, best you get off the sinking ship soon.
Yes, I'm an atmospheric physicist
I am in weekly contact ( indeed, almost daily ) with some of the finest climate scientists on the planet, and to date, not one of my colleagues is buying into the anthropogenic global warming hoopla.
One of the things I have noticed about the cut-and-paste morons is the fact that when they are unable to understand the science, they always attack the messenger. Sorry, Sonny, but you're not going to get my name or my university or my CV or my colleagues, as those are reserved for professional discussions and unfortunately you do not qualify. If you want to "assume I'm talking bullocks", please go ahead. Assumption not based on fact is most typical of the academically ignorant. In fact, I would expect you to "assume" various degrees of conjecture, since it is clear you have no scientific understanding of your own.
And to clarify a point, it is clear that it is "you", not "we" who have come to those "assumptions". Please do not suggest that the rest of the individuals in this forum are as scientifically and mathematically illiterate as yourself.
Now that we have exchanged suitable personal insults, I will "assume" you are happy, and this is my last note on this particular subject. My dear old Dad once told me, "Never get into a kicking contest with a jackass".
Farewell...
Can you please contact me off list? jrwakefield@mcswiz.com. You are new here so you may not know what I have endured trying to debunk this hoax for almost a year now. Definitely on your side.
For my part, I do not think that academic qualifications or experience are needed to understand the basic science behind these sorts of issues; a good general education combined with effort will do the trick.
You're the one bringing up qualifications.
You're saying, "I Have A Degree, So Respect Mah Authoritah." If that's so, prove it.
You're saying, "Many Qualified People Believe As I Do." If that's so, prove it.
You can't wave your and others' qualifications around as "proof" and then fail to show it. Argument from authority is always a logical fallacy, but if you're going to use it, at least demonstrate the authority.
Otherwise, we have to assume that in fact you are not an authority, but are just making things up.
"Trust me" is not really a very persuasive argument.
"For my part, I do not think that academic qualifications or experience are needed to understand the basic science behind these sorts of issues; a good general education combined with effort will do the trick."
Now that is a very interesting thing to admit, because I get flamed for not having a PHD in atmospheric physics, that I should spend 10 years getting one to have any rational challenge to the AGW dogma, and now you are saying I don't. So which is it?
Interesting that also you assume he is lying, for what motive you do not say, but you expect us to believe the nonsence of AGW from people who have no qualifications to do so. You think he is lying because you dislike the message. It is not a message you want to hear. Your whole life is around AGW being true, and it will come crashing down when shown to be false. So you must pull out all the stops to prevent that from happening. Typical dogmatism.
You want a list? How about this 19,000 http://www.oism.org/pproject/s33p357.htm. Go EMail them all and tell them they are lying.
You ask for proof, yet no one from your side provides one shred of it for support. Dogmatism at its best.
Bottom line is are you just lying too?
I never said you had to have a PhD in atmospheric physics. I certainly don't have one :)
I can't be held responsible for what other people have said to you. Just because other people and I agree that you're talking bollocks does not mean that we also agree on whether or not you should have a PhD in atmospheric physics before you can say anything about the world's climate.
I assume he's lying because he's making a grand claim but refusing to back it up. If I said, "actually I have a doctorate in atmospheric physics, and am in daily contact with climate scientists, and they say that AGW is real and we're going to turn the planet into Venus by 2050", then you would - rightly - ask me to back it all up.
His motive I plainly laid out - to be able to make an argument from authority. "Me is smart, trust me."
Not at all. I don't expect you to believe me when I say that AGW is real, but I would expect you to believe the thousand or more people involved in the data collection and scenario development that went into the 177 separate scenarios reviewed by the IPCC.
Likewise, if I said (for example) that raising women's literacy and prosperity lowered birth rates in the developing world, much more so than raising that of men, I wouldn't expect you to believe me, but I would expect you to believe the World Health Organisation, or UNESCO or similar.
I'm afraid I can't email any of those on your list of 19,000, as they're just names, with no emails, no location, place of work or similar listed.
In addition, you don't mention that this petition was circulated in April 1998, before the development of a true consensus. People change their minds over a decade, after all.
The OISM website you direct us to is the Oregon Institute for Science and Medicine, staffed by,
- Dr. R. Bruce Merrifield, a retired professor at Rockefeller University in New York, who won a Nobel Prize in Chemistry for performing the first laboratory synthesis of an enzyme using a peptide synthesizer, in 1964.
- Dr. Fred Westall, described on the OISM website as "an expert in the biochemistry of immunology and a former director of laboratory work at the Salk Institute."
- Dr. Jane Orient, a physician in Tucson, Arizona, heads the Association of American Physicians and Surgeons, an organization that says it works for "less socialism" in medicine. Orient is best known for her claim that childhood MMR (measles-mumps-Rubella) vaccinations cause autism.
- Carl Boehme, a computer consultant with an address in Boise, Idaho, is listed as the OISM's "Professor of Electrical Engineering."
which is to say, exactly zero climate scientists. Doctors, biochemists, and one eletrical engineer (there seem to be a few of these floating about in climate change denialist circles, including old Fred Singer, once an apologist for the tobacco industry).
The OISM website is still taking "signatures" for its petitition. You can apply to sign up here (pdf for you to print and mail in). The form asks you to tick whether you have a BS, MS or PhD and in which field, and note any other specialised knowledge you have. They don't ask which university you attended, or what year you graduated, and thus have no way of verifying if you're telling the truth. I could send in thirty forms claiming to be thirty different people with PhDs in this or that, and those thirty names would be duly added to the list.
As sourcewatch notes,
The names on that list, their qualifications or even whether they exist at all, are completely unverifiable.
On the other hand, here's a list of institutions which believe that human-made global warming is real and a danger. And they all verifiably exist, and can be contacted to check if they really believe this,
The Academies of Science of the following areas,
* United States
* United Kingdom
* Germany
* Japan
* Canada
* China
* France
* India
* Russia
* Italy
* Australia
* Belgium
* Brazil
* Caribbean
* Indonesia
* Ireland
* Malaysia
* Mexico
* New Zealand
* South Africa
* Switzerland
http://www.nationalacademies.org/includes/G8Statement_Energy_07_May.pdf
http://nationalacademies.org/onpi/06072005.pdf
http://www.royalsociety.org/displaypagedoc.asp?id=13619
http://www8.nationalacademies.org/onpinews/newsitem.aspx?RecordID=11676
American Association for the Advancement of Science
(i.e. The guys who publish the Journal of Science, the most highly syndicated peer reviewed science journal in the world)
http://www.motherjones.com/blue_marble_blog/archives/2007/02/3630_aaas_s...
American Geophysical Union (a scientific organization with over 50,000 members, mostly earth scientists)
http://www.agu.org/sci_soc/policy/positions/climate_change2008.shtml
The Pentagon
http://money.cnn.com/magazines/fortune/fortune_archive/2004/02/09/360120...
http://observer.guardian.co.uk/international/story/0,6903 ...
http://www.grist.org/pdf/AbruptClimateChange2003.pdf
Exxon Mobil
http://www.exxonmobil.com/Corporate/news_speeches_20070213_RWT.aspx
http://www.nytimes.com/2007/02/14/business/14exxon.html?pagewanted=print
http://www.msnbc.msn.com/id/16593606/
Even the American Association of Petroleum Geologists
http://dpa.aapg.org/gac/statements/climatechange.cfm
http://www.youtube.com/watch?v=SZurM7c19ig
So if you want to make arguments from authority, well I reckon verifiable authority beats unverifiable authority any day.
But haven't you heard the latest from Jr? He is just the messenger and is not responsible for his own utterances or any data or other information that he posts here. And, of course, you haven't even scratched the surface of all the organizations supporting AGW. But Jr has his precious petition.
Nice try, but... All those groups and organisations are just piggybacking on the IPCC reports, which we know are not peer reviewed, and were written by non-scientists to get what they wanted in policy first, then told the scientists what to write to conform to the message. That's why it's called a hoax. It's not the first time the entire world has been duped, but it is the first time at this scale.
"I assume he's lying because he's making a grand claim but refusing to back it up."
Make sure you practice what you preach with everyone then. Lots of outlandish nonsence is spewed here with no references. I can see his point, why would he want to subject himself to the intolerant bigotry on this subject any time someone posts contradictory comments. I'm used to it, maybe he isn't.
No defence of the 19,000 univerifiables, then? Excellent, we shouldn't expect to see you mentioning them again until they can be verified.
Well, I am not going to ask for references if someone says the sun will rise tomorrow. Some things can be assumed. But if something outlandish is posted, then yes I'll ask for a reference, assuming it's a topic I'm interested in.
If it goes against the broad scientific consensus, then it counts as "outlandish."
Boohoo, more from the denialist playbook, cry "I'm being persecuted!"
Nobody asked him what his qualifications were. He volunteered them. He said, "I'm qualified, so you should trust me."
"Okay, prove it."
"What?! Prove my claims?! I'm being persecuted!"
If you bring it up, people might question it. If you don't want it questioned, don't bring it up.
I mean, if I say, "actually the moon is made of green cheese, and you can't question that because I have a PhD in planetology, and a diploma in cheesemaking, you just have to trust in my brilliant and broad knowledge", then you're going to at least ask me where I got this PhD from. Or would you just trust me?
No, you'd question me, and rightly so. Bollocks should not go unchallenged.
And there's not the least bit of chance that he's ligit? No benifit of the doubt when the message is not what you want to hear? I'll ask again, would you reject AGW if he were right? And I will check that list. In the meant time here is a smaller list, just a few hundred, with their affiliation http://www.businessandmedia.org/specialreports/2007/globalwarming/Skepti....
Go post at realclimate.org, they'll sort you out, troll.
jrwakefield believes that
DrumBeat: March 25, 2008
Well, he's wrong.
It's part of ZOG. I'm a Jew and thus part of the conspiracy.
Their domain is owned and paid for by Environmental Media Services http://www.activistcash.com/organization_overview.cfm/oid/110
From RealClimate
If you really want to say something intelligent about global warming, rather than copy and paste from wacko websites, review your undergraduate quantum mechanics textbooks, particularly the sections on blackbody radiation and infrared spectroscopy. The physics has been understood for over one hundred years. By the way, The Oil Drum is hosted by the GAIA Host Collective, which by your logic makes Heading Out to be in the pocket of some weirdo commie tree hugger's association.
Turn the tables around and if I had posted what you just did you would claim that you cannot trust what they say as they are biased and would not reveal their true funding. And you would add, if they have no affiliation to EMS, then why does EMS own the domain name? You would say something is fishy about that. So much is thrown about my postings as being funded by big oil (with no proof at all of that, just a blatant untrue allegation.), how is my allegation any different? I’m just showing the hypocrisy and double standard. What is important is the evidence on all these sites, not who funds them.
So you see what you want to believe is what you want to believe. To me my sources are just a legitimate as RC (though I personally think RC is biased big time, but I'll give it the benefit of the doubt). Hence the only reason people squawk and complain about the sites I post is because they DO NOT want to even think there is any possibility of any kind of doubt over their dogma of AGW. They hold this dogma not because of the science (there is none in the outrageous alarmism) they hold on it it because it is vehicle they can use to slam democracy. Thus they hold onto the dogma of AGW (as opposed to the scientific theory of it) for ideological reasons.
But in SCIENCE one has the RIGHT to challenge any scientific theory, and not be lambasted with intolerant bigotry and name-calling. That is not a sign of good science, it’s a sign of dogmatic belief systems scared of being shown wrong.
Once the momentum of the "skeptics" starts to grow, which it is, and the world just does not behave with the dogma (which it isn't), then one wonders what will become of them.
So you want to challenge the science with science? Go ahead and make your case with science (you haven't so far). Don't worry, I can take it, I'm a physicist.
Then you know perfectly well that NO theory in science is settled and that anyone is free at any time to challenge any theory based on evidence. That one should be able to present that challenge without having to suffer the wrath of intolerant bigots, right? So why is AGW any different?
And I have CONSISTENTLY provided peer reviewed references, yet those here would rather trash the source than deal with the evidence. Those same people spew out all kinds of wild predictions with no basis on any peer reviewed papers. They take Gore hook line and sinker yet his presentation is far from the scientific understandings, and blatantly wrong on at least 32 counts.
So where is your scientific integrity since you are a physicist. Or is your ideology getting in the way. Ask yourself.
Denialism 101
[General tactics] conspiracy, selectivity (cherry-picking), fake experts, impossible expectations (also known as moving goalposts), and general fallacies of logic.
I'd mark this post as part of
But it also has bits,
and also
And of course, if you're persecuted then you're just like Einstein, right?
:)
Overall, not bad as a denialist post. But it'd benefit from using just one tactic at once. A shotgun's only effective at close range, at longer range you want a single round to go out and hit your target. So I advise sticking with one tactic until you're called on it, then change. I give this denialist post 4 out of 10.
Dogmatism 101
Take what you actually are and smear the oposition with it. "conspiracy [The UN and Radical Environmentalists], selectivity (cherry-picking) [disallowing any contradictory evidence], fake experts [Al Gore], impossible expectations (also known as moving goalposts) [The recent 1998 to now non warming is part of global warming!!], and general fallacies of logic [CO2 will kill all life on earth]."
Yep, that's the AGW dogmatism all right.
I didn't "disallow any contradictory evidence", I just failed to respond in detail at all to your blatherings. I'm not responding to each and every little bit of confusion and deliberate obfuscation, I'm just mocking you.
I'd be the last person to argue Al Gore has any clue what he's talking about. He's just making the turn to leftish greenish politics so many former politicians make. He was responsible, after all, for making sure the Kyoto Treaty was nice and wet and woolly on the US. So maybe he's trying to make up for that, I dunno.
There's been global warming since 1998, when the period is taken as a trend in a longer series. As someone concerned with peak oil, you already know that you can't look at day-to-day figures to discern long term trends. There's no, "oh look Russia added 100,000bbl/day in January, therefore there will be no peak ever." It doesn't work like that; we consider long-term trends, coupled with the general science.
But you know that already.
I don't know of any qualified person who believes that CO2 rise will kill all life on Earth. Of course, defeating your opponent's arguments is always easier when you make them up yourself. Don't be ashamed, that's part of a long tradition begun by Socrates.
Keep working on it, jr, you're still not quite up to being a proper denialist. Really you need your own crackpot theory to put up in opposition to it, and you can submit it some journal some mate of yours created online. Call it, um... Climate Researchers Against Persecution.
"I'm not responding to each and every little bit of confusion and deliberate obfuscation..." back to you.
"I'd be the last person to argue Al Gore has any clue what he's talking about."
Now compare to biophiliac below:
"I have not seen Gore's movie, but my understanding is that aside from some overdone visual effects, the scientific content was sound by the standards of documentary film-making."
So whose right, you or biophiliac?
"I don't know of any qualified person who believes that CO2 rise will kill all life on Earth" Lovelock, and many on this site have claimed that the earth will be unlivable by man nor beast.
http://www.middlebury.net/op-ed/global-warming-01.html
is Peden, qualified or did he just get behind in the union dues.
or?
read it and pick it apart.
please.
Dr. Peden may be an expert in his field, but he has missed several basic points that I can see.
For example, he shows a graph of the absorption/emission lines for CO2, claiming that they are vary narrow and can't possibly influence climate. He ignores the fact that H2O absorbs in different portions of the spectra and that the CO2 lines fall within "windows" between the H2O effects. He also misses what's called "pressure broadening" of the CO2 lines, which spread their effective range of absorption. In Over much of the Earth, the atmosphere moves thermal energy from the surface to higher elevations mostly by means of convection. It's at the higher levels of the atmosphere that the so-called "greenhouse effect" is strongest. The result is that when seen from outside the atmosphere, the Earth's emission spectra looks like that of a much colder body than what we experience at the surface.
Peden also claims that CO2 is a heavier molecule than O2 and N2, thus will settle to the bottom of the atmosphere. The atmosphere is in constant motion and the gases are very well mixed throughout. The same is true for CFC's, although there are denialist who claim that those settle out as well.
There's more there which I think is flawed, but I'll leave it to the experts to pick it apart.
E. Swanson
It is true that nothing is settled in science, but ask yourself if you are qualified to even try. What is your background in quantum mechanics, IR spectroscopy, atmospheric chemistry, cloud physics, etc? And ask yourself what your agenda is: Why are you trying to disprove global warming and not some other "unsettled" theory like the theory of gravitation, the Standard Model, the big bang? If you really want to make a contribution to science by correcting a big mistake that we are all making, you have to move beyond cutting and pasting graphs from various websites and become an expert: invest 10 or 20 years to learn the subject and people will *start* to take you seriously.
I have not seen Gore's movie, but my understanding is that aside from some overdone visual effects, the scientific content was sound by the standards of documentary film-making.
By the way, the vast majority of scientific literature supports the AGW hypothesis, which means that your source of references is carefully edited.
Then no one here is an "expert" either to make any claims about what will happen in the future. I'm quite capable of reading papers and understanding what the thrust of the paper means. I read a very wide array of technical books and papers on science, including physics, geology, paleontology and evolutionary biology. So do not for one minute imply I'm incapable of understanding what's going on. I taught myself geology and debunked a creationist who claimed that polonium haloes showed the earth was created in 3 minutes (Gentry has a PhD in Physics). Took me 2 years, but I solved how the halos formed and published. With no formal training in geology. Just read the published materials and talked to geologists. G. Brent Dalrymple edited the paper for me and said I was the best amature geologist he'd ever met. I even got to visit his lab at the USGS before he retired. So don't even try to belittle my ability to understand science.
"By the way, the vast majority of scientific literature supports the AGW hypothesis, which means that your source of references is carefully edited." Not acording to this list of skeptics. http://www.businessandmedia.org/specialreports/2007/globalwarming/Skepti...
"the scientific content was sound by the standards of documentary film-making."
Google: Results 1 - 10 of about 461,000 for "al gore" errors.
Specifically http://www.newsbusters.org/blogs/noel-sheppard/2007/10/20/35-errors-disc...
and http://www.telegraph.co.uk/earth/main.jhtml?xml=/earth/2007/10/11/scigor...
You are questioning the scientific ability and motives of thousands of geophysicists who study global warming, why should I not question yours? Your web sources (above) and methods (googling) are bogus. There is a whole industry of Gore bashing, so no surprise. Why don't you stick to scientific sources and databases? Go to your university library and go through Nature, Science, GRL (and other AGU journals), etc.
Not "thousands of geophysicists who study global warming", a small number, and some of them I do highly question their motives (Like Hansen) (you are all quick to point to unjustified motives of the long list of scientists I've presented). There are lots of papers published in those very journals that do not support AGW theory. They are reviewed in www.worldclimatereport.com, www.co2science.org, www.icecap.us, and www.climateaudit.org. If you go past your ideological objections to the sites and read the peer reviewed papers they present then maybe you will see that there is a mountain of evidence there that makes AGW highly suspect. Do yourself a favour, just go and read the papers they present.
I've been curious about Gentry's Polonium Haloes for a while, after a local Seventh Day Adventist preacher loaned me Gentry's book. I think the whole notion of the Haloes was likely to be off base. So, do tell us where you published, so we might read your astounding findings for ourselves. Better yet, where's the PDF, so we can all read it.
Ah, come on, here's a chance to brag and bask in the limelight!
----------------
EDIT: Here it is, thanks to Google and the talkorigins FAQ.
Wakefield, J. Richard , 1988, Geology of Gentry's "Tiny Mystery", Journal of Geological Education, May, 1988.
http://www.talkorigins.org/faqs/po-halos/gentry.html
---------------
E. Swanson
http://www.csun.edu/~vcgeo005/gentry/tiny.htm
http://www.middlebury.net/op-ed/global-warming-01.html
For example Richard S. Lindzen, in his paper at the 2005 Yale Center for Globalization conference clearly points to one particular pro-hoax web site calling itself "Real Climate" which tells us that it is all about "climate science from climate scientists", featuring among others, the now universally discredited work of Michael Mann and others who were too quick to become his overnight followers. The site isn't actually run by "scientists", it's actually run by Environmental Media Services, which specializes in spreading environmental junk science on behalf of numerous clients who stand to financially benefit from scare tactics through environmental fear mongering.
Even though the central part of the antarctic ice sheet is growing (due to the ozone hole), this is more than compensated for by the accelerating loss of ice at the periphery of the ice sheet.
See
http://environment.newscientist.com/channel/earth/climate-change/dn11648
for the full story.
Remember: if the whole thing goes, sea levels rise by 61 metres.
The whole thing will not go, it would have to be above freezing for hundreds of years non stop for it all to melt. It did not all melt during the global wide medeaval warm period, it won't all melt now. Second even if it did all melt, most of Antarctia is under sea level, hence the ice would be displaced by the water weight for weight. Thus the rise would be far far less than your claim of 61 meters, for which you give no peer reviewed paper to support. I get slammed for not providing references, so how come it's OK for you to not?
And your link is a year old now, things have changed, look at the graphs in the link I posted which is new. That article is not supported by refereed papers on the subject that has appeared in WorldClimateReport.
most of Antarctia is under sea level
This statement is unclear; most of the planet is under the sea level, as all oceans have a bottom. Do you mean most of the ice associated with Antarctica is under water? If so, please provide a reference.
That article is not supported by refereed papers on the subject that has appeared in WorldClimateReport.
You are getting your information from one-side blog? No wonder...
You need to list the 'referreed papers' so that they can be examined for their approach and findings. In the meantime, see this NASA article;
http://earthobservatory.nasa.gov/Newsroom/NewImages/images.php3?img_id=1...
http://en.wikipedia.org/wiki/Antarctica
"About 98% of Antarctica is covered by the Antarctic ice sheet, a sheet of ice averaging at least 1.6 kilometers (1.0 mi) thick."
"Antarctica without its ice shield. This map does not consider that sea level would rise because of the melted ice, nor that the landmass would rise by several hundred meters over a few tens of thousands of years after the weight of the ice were no longer depressing the landmass."
Yes, a large portion of the land mass has to be below sea level.
http://www.worldclimatereport.com/index.php/2008/02/27/antarctica-ain%e2...
For a peer reviewed study of the extent of the ice there.
Monaghan, A. J., D. H. Bromwich, W. Chapman, and J. C. Comiso (2008), Recent variability and trends of Antarctic near-surface temperature, Journal of Geophysical Research, 113, D04105, doi:10.1029/2007JD009094.
http://icecap.us/index.php/go/joes-blog/wilkins_fracture_barely_a_blip_i...
Wilkins’ Fracture Barely a Blip in the Big Picture as Antarctic Ice Anomaly 2nd Highest on Record
"You are getting your information from one-side blog? No wonder..."
Yes, because they review peer reviewed papers that does not support the dogma, and RealClimate, also very one sided, refuses to admit to. Referenced paper above.
"You need to list the 'referreed papers' so that they can be examined for their approach and findings." Then you better goddammed do this yourself, and others here, for every single outlandish "prediction" posted on TOD about the dire consequences of AGW. Next time someone posts some future outcome due to the effects of AGW I'll expect you to also demand "..to list the 'referreed papers' so that they can be examined for their approach and findings."!!!
Wow - what a map.
Isostasy - the rise and fall of land masses due to gravitanional loading and unloading - which may be ice or sediment - caused by the "glacial" flow of olivine in the earth's upper mantle (lower lithosphere upper asthenosphere)
and
Eustacy - the rise and fall of sea levels in response to the melting and freezing of ice caps or to changes in the volume of ocean basins due to plate tectonic processes.
Unfortunately I don't have a degree in Climate Science from The Euphoric State University and am therefore wholly unqualified to comment upon the radiative insular properties of CO2. Why is it that N2 and O2 don't insulate but CO2, CH4 and H2O (in particular do?) - I can never remember.
That's actually an interesting question. It really has to do with where the spectral bands of molecules reside. Molecules with two atoms don't have rotational degrees of freedom of the correct energy to absorb/emit in the relevant infrared frequencies. Molecules with more than two atoms, are much more complicated geometrically, and have many more energy modes. Thermodynamicists sare concerned with this because its affect the heat capacity of the gas, and spectroscopists are interested because they want to know the frequencies shapes and strengths of any absorption lines within the frequencies of interest.
This stuff is covered in intermediate (say senior year or first year graduate chemistry). I'm not a chemist, but I did study this stuff for my job.
The West Antarctic ice sheet is the one that is causing most head-aches in the Antarctic. It is grounded, but below sea level as your map shows. However its top is far above the level at which it would float. Sea level rise from this ice sheet alone is estimate at 5m.
However if this one goes, so will the Greenland ice sheet. That is worth 7m (that is peer reviewed) and I have personally worked that one out myself using GRACE data.
Even if sea levels only rise by a quarter of the amount predicted - say 3m - it will cause havoc. The problem is made worse by our limited understanding of ice sheet physics, particularly for one that is grounded below sea level. This whole issue is a risk management problem. Just as I cannot say with certainty what will happen in the future, neither can anybody else.
The right way of analysing this issue; as with any other risk, is to consider what the probability of a particular scenario happening is (eg sea levels rise 3m by 2020) and then to calculate the impact.
Have you worked out the thermal physics involved to melt the ice? That will show us what temps would be needed to melt it in what time frame? There all this hype out there that it will all melt, very quickly, yet no one has provided any calcuations that will show us this.
Greenland is also below sea level:
http://en.wikipedia.org/wiki/Greenland
"The weight of the massive Greenlandic ice cap has depressed the central land area to form a basin lying more than 300 m (1,000 ft) below sea level."
As Euan said - that is a great map.
And - no I haven't worked out the thermal physics involved to melt these two sheets.
However I am not sure the thermal physics are 100% relevant. There are other complex physics in play that are poorly understood. It seems that meltwater flowing through the ice does not re-freeze as assumed, but falls to the base of the ice sheet and destabilizes it. This could allow the ice to flow into the sea where the thermal physics become irrelevant - it floats away and melts, but then it is in the sea and the sea level rise has happened. There is evidence that Greenland glaciers are flowing up to six times their historic speeds.
As I say I believe this is a risk management issue and must be approched accordingly. There is science behind AGW, even if you disagree with it. There is significant evidence of warming, that is undeniable. Therefore there is some degree of risk that AGW is real. At this point we can argue over the extent of the risk, but if you try and tell me the risk is zero I could equally validly accuse you of dogma.
Just for the record - I am a "mature" student nearing the end of an Environmental Sciences Masters degree. I have read a lot of peer reviewed science supporting AGW recently. The universities position is that AGW is a "well supported theory". Good as the URL was on denial (and I understood much of it) I will need to see irrefutable SCIENCE knocking the theory over before I change my own position. However I have forwarded the URL on to my relevant Prof. and we will know doubt spend some time discussing it.
For the record I do not say there is no risk to climate change. The world in changing, it always has and always will, and there is nothing we can do about it. I even had someone on another list tell me that even if the warming is purely normal we should "fix" it anyway!!
What climate change will not do is wipe out the biota making the world uninhabitable. It wont do that for another 4 billion years if we understand how the sun works. The hype of alarmism and call to action is not scientifically sound. There is no published papers that make these wild claims (they would never get past peer review) it's all just from those who are going to make big bucks from keeping the alarmism alive.
But, you do need to read all the relevant information, don't be fooled by the dogmatists here that claim the sites I reference are biased, of course they are, but so too is their's, especially RealClimate. The queation is, what is the bias and what are the motives?
Good luck on your journey in this area, get back to us and let us know what you find out. You can contact me off list if you wish.
There are something like 100,000 glaciers in Alaska alone. The tidewater glaciers are not good climate indicators because they are strange beasts. Most of them have very healthy mass balances -they get more snow then melts, they gradually advance in their fiords pushing gravel below them, once they get too long that they can't stay grounded, they begin breaking up and rapidly loss mass/length to the sea, retreat takes maybe a hundred years, while the advance stage a few thousand. Because melting is such a small effect on these glaciers recent climate changes don't have much effect. Something like 98% of glaciers are currently retreating, which means 2% aren't. If climate was not changing you'd expect this ratio to be more like 50/50.
The total amount of ice in Antarctica and Greenland can be reasonably well measured by the effect of their gravity on satellites. The mass balance in Greenland is approximately known by this technique. The total volume in Antarctica hasn't changed enough (last I saw which is a couple of years old) to know if it was increasing/decreasing.
This email I got will answer that question:
While I believe that a strong program in finding alternate sources of fuel is vital, and that there should be some funding to examine any idea to the point that some valid numbers can be estimated as to its ultimate value, as the numbers that Dr. Stegemeier has quoted show (and as the MSM seems to be catching on to) there is a danger in too rapid a major commitment to any novel source until the true costs become evident. I also suspect that most of us that post here are strong believers, and practitioners, of various forms of energy conservation - unfortunately we have yet to convince the general public of this need.
The timing of this post seems good since the USGS is going to be releasing a report today on the technically recoverable reserves in the Bakken formation which uses this kind of method, though not in shale.
You might be interested in a discussion at realclimate.org of a preprint saying that there is already too much carbon dioxide in the atmosphere. http://www.realclimate.org/index.php/archives/2008/04/target-co2/
Chris
USGS is saying 3 to 4.3 billion barrels of oil can be recovered by this method from the Bakken formation:
http://www.usgs.gov/newsroom/article.asp?ID=1911&from=rss_home
Chris
Thanks for interesting material on drilling challenges, etc. The un-scientific cheap shot at climate science is unfortunately at big pimple in the midst of the article. Sure, we really need a cynical engineer bragging his wisdom over climate scientists. He's likely unqualified to even understand the models. And positively unqualified to criticize them. Nuts. Sadly this kind of stovepipe thinking is signature for Heading Out.
It is very disturbing. Are my page hits here on TOD contributing to anti-science rhetoric to the detriment of humankind? I think so. Any analysis is welcome...
I think I should start contacting sites that link to TOD and ask that they remove those links.
I don't agree with HO on this, but I do respect him as a scientist and as a friend...and I think discussions of these types can be informative.
Remember, TOD is a place to debate these issues, especially and most germanely the interaction of energy and climate change. No one needs to sit in a self-reinforcing echo chamber all the time...and I hope everyone learns from it.
The point is to have these discussions in an open and academic matter. If you disagree, do what Kiashu did below, not throw out threats. That really helps no one.
I disagree. I think it helps nobody to deny science and use purposely misleading statements to further your agenda. That is just plain dishonest.
Do you really think Radiohead would link to TOD if they knew that it was a site that published oil company propaganda?
Holy sweet f-ing Jesus.
re: "further your agenda..." and "oil company propaganda"...
The agenda here is the following (from the mission statement on the front page...)
If there's anything behind HO's statements, it surely ISN'T oil company propaganda. That is just sheer naivete. I will let HO defend himself and what's behind his statements, he surely doesn't need me to.
And as for your allusion to Radiohead (and yes, I love them dearly.), they have hopefully linked here because they support the mission above and because of the research that has been published here.
Get off your high horse like you know everything. Knowledge is conditional and probabilistic (save a couple of laws here and there). I know I surely don't, and I appreciate the opportunity to have my assumptions challenged and learn from forthright discussion, especially from smart people I disagree with.
What should I learn about climate change in this article?
That climate change is wrong because engineers are not included on the IPCC. This quoted statement is coming from a member of NEA who just happens to have been a CEO at a major oil company. Why didn't HO mention that? Why is the TOD using purposely misleading statements to deny science?
Well, the bit about the IPCC being st00p1d because there weren't engineers on it, I just thought that was not even worthy of comment.
I tried to reply to the points of actual substance, the points which were actually under some degree of doubt in the real world outside Cranksville.
If I had wanted to be secretive I would not have used his name - it is not as though it is hard to find his biography. Given that we are quite happy (it seems) to discuss regional events when they support Global Warming, it is interesting to see how rapidly they are denied when the facts don't.
Indeed. And that is because the preponderance of the evidence is growing, and has been for some time, in support of AGW. Denialist arguments serve only to distract public policy from addressing this massive risk management issue. This is not to suggest that any "science is settled". It is essential that the scientific process continue ... in the scientific domain ... as it is doing.
What is a "denialist argument" - in its generic sense?
I understand the terms counter argument and uncertainty - but wtfh is a denialist argument?
This describes well, though unfortunately not concisely, the essence of a denialist method of "discussion", whether a denier of climate change, peak oil, evolution, the usefulness of modern medicine, or whatever.
It has a focus on people who have their own crackpot theories to present in place of reality, but the general points about the approach commonly used remain valid even for those without anything to offer in place of what they're denying.
I would prefer that we don't discuss climate change on theoildrum because this is where I go to learn about oil availability.
Other sites discuss gobal warming. I can go there if I want.
Tell heading out, it was his article brought it up.
1. You are right. My complaint should have been addressed to heading out.
2. I am wrong. Global Warming is very relevant to peak oil. If the Arctic Icecap melts as the Global Warming people think it will, then we will be able to drill in the Arctic coastal regions. Therefor Global Warming denialists are assuming that we won't get much oil from the ice covered areas in the near future, and Global Warming believers assume that we will be able to drill those areas for oil when the melt is finished.
A denialist is someone who disagrees with your particular view.
My problem with Warmists is that they become hysterical.
But that's religious orthodoxy for you.
IMHO:
Peak Energy can kill us off a lot faster than AGW
Even so, it's a pretty daft way to introduce the topic of GW, sneak in some poorly sourced denier comments into an otherwise informative article. I guess it was included to spice things up a bit.
I thought the dumbest part was the final link about wind turbines. WTF did that have to do with anything in the article?
Maybe he's another climate change denier and renewables-hater and just wanted the chance to have a dig at renewables. Who knows.
Actually I put it in because I thought some of the readership - in line with the guy that wrote the story for the Times - would think it funny. I don't think it has anything to do with the validity of wind as an energy source, just an amusing aside.
The inclusion and placement of the wind farm link, after giving weight to the denialist cherry-pickings of an oil company CEO (only stating he was a member of the National Academy of Engineering), only threw further shovefuls on an otherwise informative article. As an engineer myself, I'm disgusted that Stegemeier inferred that scientists needed the help of engineers to perform scientific work. I think he was attempting a thinly-veiled rabble-rousing cheap shot.
I find The Oil Drum to be a valuable source of information. Nobody's perfect, of course, though slinging fastballs at hot buttons that are off-topic to an article distracts from its perceived veracity.
How many of these organizations do you consider to be ill-informed on scientific grounds? Your answer would be sincerely appreciated.
In terms of glacier melting, why not consult an organization that looks at this specifically and has data to back up what they say, the World Glacier Monitoring Service (WGMS), which states;
Actually Dr. Stegemeier didn't put it in those terms, he merely commented on the often different viewpoints of the world that engineers have relative to scientists, and if I implied that scientists need the help of engineers then I think it was misinterpreted. Although, now that you come to mention it I rather suspect that in many cases they do.
I was rather intrigued by two things that he said, the first being his agreement with Dave Rutledge particularly given his oil industry background, and the second his different way of looking at the cost of ethanol. Quoting the latter seems, in the short term, to have got me into trouble, but it does motivate me to go away and do the actual calculation to find out exactly who is right on this.
In regard to the Glacier study I believe that I have quoted before that in the early 19th century glaciers were (at the end of the Little Ice Age) at their greatest extent in 10,000 years. In the Medieval and Roman Warming periods they were significantly in retreat, and this holds true not just for those in Europe but also for those in Patagonia and in New Zealand. (I have previously give references for all these but New Zealand, and the reference for that is "Floods, Famines and Emperors," by Brian Fagan, Basic Books, 1999, page 186 - describing the Franz Josef Glacier). In some cases the glaciers retreated to the point of complete deglaciation, so that a repeat of that event is not, in itself, a unique event.
Even Fagan calls for "serious consideration of rapid climatic shifts", warning in 1999 of famine conditions that might arise due to disruptions in rainfall patterns. Note that global food production has not kept up with demand in 6 of the last 7 years, due partly to widespread drought problems in the US, Australia, Africa, and Asia.
Again, which of these organizations do you consider to be ill-informed on the scientific aspects of climate change? Please reply.
What role, if any, do you believe engineers might have in climate modeling and paleoclimatology?
Prof. Goose, you now know what I go through with people in this list. Welcome to my club.
Holy sweet f*cking Jesus?
Sweet f*cking Jeff
Are you suggesting that the Glacier Bay Glacier did not have its major retreat before 1900? Or that parts of it are not advancing? Because if you are then surely, given the facts, it is not I but yourself that may have a little problem with veracity.
As I have shown in link, after link, the performance of ethanol in low to intermediate blends (10% to 30%) is basically identical to gasoline. This is the area where 99% of the ethanol is used. Thus, the statement that the farmer would have to produce 600 gallons of ethanol to replace 400 gallons of gasoline is patently Untrue.
I used the figures from Wang, et al, that RR originally referred to to show that, after accounting for Distillers Grains, the total btu inputs from farmers diesel, nat gas for fertilizer, drying seed, electricity on the farm, etc. came out to approx. 10,000. Processing could run from 13,000 btus nat gas (Corn Plus,) to 24,000 btus nat gas (Siouxland.) Some older plants would be more, but almost all of the refiners are working very successfully at lowering their energy use.
If he had said "it takes a bit over half the ethanol equivalent to produce the four hundred gallons" I could accept someone making the worst case scenario, and "tut, tut" about how he should mention that efficiency is improving; But, THIS is ridiculous.
I'm Very Disappointed that an "Engineer" could make these Egregious Errors. I don't think I would want him working on my project.
The calculation was not made on low percentages but on total replacement of the entire amount of fuel that the driver would use in his car. The calculations then derive from the volumes that are required to generate that, with no discount for by-products. It is an interestingly different view of how to derive the effectiveness of ethanol from those one normally sees.
Well he did point out that the average temperature of the United States has not gone up from that of the Dust Bowl years, some 70-odd years ago, despite considerable increase in the amount of carbon dioxide in the air. He did also point out that the models have failed to explain the global drop in temperature between 1940 and 1970. So he has looked at them.
Well, the NASA GISS data does show a warming that exceeds that of the Dust Bowl years. The warm year in 1940 was equaled by about 1980 and the temperatures have continued to rise since. One should recall that the Dust Bowl in the U.S. was related to very poor agricultural practices, which led to massive soil erosion due to wind. Also, not to be forgotten is the impact of the Boll Weevil in the South, which destroyed the cotton farmers. Coupled with the impact of the Depression, many smaller farmers left the land and there was a return to tree farms all thru the South. Trees tend to produce cooler climate, due to evapotranspiration. The opposite effect is seen as the result of deforestation, such as that now happening in the tropics.
E. Swanson
Since the warmest year was 1932 it is a little misdirectional to use the year of 1940 upon which to comment. This is the graph from NASA and I don't think it shows what you say it does.
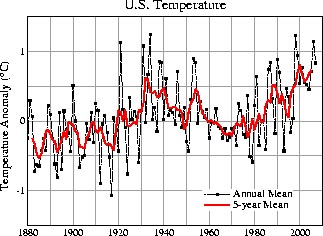
The NASA GISS data to which I referred was for the entire Earth, not just the U.S. The fact is that the impact of CO2 is a global problem and looking at just one area may show different trends than seen in the overall situation.
As for the U.S., remember that there was a rather strong period of industrial growth after the Great Depression, which included much more burning of coal and thus the release of lots of sulfate into the atmosphere. After the Clean Air Act took effect, the particulate and sulfate emissions began to decline, which might have been the cause of the cooling from the 1940's to the 1970's, then the reversal afterwards. Furthermore, evidence has been presented which points to a shutdown in the THC in the Greenland Sea in the late 1970's and early 1980's, a period during which rather cold winters were experienced.
E. Swanson
HO - where on earth did you manage to find such a shit looking chart as that? And are you trying to tell me that the truly massive 1998 el Nino event didn't manage to beat the old dust bowl in the USA?
And this reminds of the old Not The O'Clock News Swedish Chemist Shop sketch - where a man enters the chemist shop and asks for some deodorant. The chemist asks "ball or arsehole" to which the man replies "I want it for my arm pits" - hahahahahha!
All those who have time should check out the 12Be record for the mid 20th Century.
Two Ronnies actually.
Corbett: I'd like some deodorant please.
Barker: (Scandinavian accent) "Ball or Aerosol?"
Corbett: Neither it's for my armpits.
Yes it was very funny but probably doesn't work as well in print.
Now where did I put these four candles? :-)
For the grapes of wrath - am I really going that senile?
Hi, Euan:
It comes from the NASA site that Black Dog cited. They have other interesting graphs that show the relative temp gains of the North and South Hemispheres.
I have become amused by newspaper reporters that gleefully chat about global warming, but never seem to bother checking whether it holds true for their community. Leanan quoted someone from Myrtle Beach in S.C. the other day, and the nearest place with a long enough temp record is Charleston and if you look that up the average annual temp has been falling over the last few decades.
As you may note, only acceptable data can be considered, tut!
There's quite a lot of data which is not acceptable in it's basic form.
Most of the station data in the U.S. must be adjusted to compensate for various influences, such as a change in time of day of reading and station relocations, etc. However, the Idsos at CO2Science have now posted several years of weekly data selected (cherry picked?) from the USHCN data and displayed beginning in 1930 thru 2000. They do this even though the historical records for the individual stations indicate many problems with the raw data. I used to critique them each week, but finally tired of doing so, as there was little interest in this where I posted my comments. The station which I found most obvious was a site from Alabama, Gainsville Lock, which had been relocated half way across the state in 1987. But, it's apparent that the Idsos don't care about truth.
E. Swanson
How hard I wonder? If he can't tell the difference between regional and global, then he is kind of missing the point.
It is also untrue that the structure of the temperature record is unexplained. Aerosols have played an important role.
Chris
Not really, if you assume that "global doom" means "1,000ppm by 2100."
The IPCC said in 2007,
[source, p16]
Briefly and more clearly put, if we look at the whole 21st century and its emissions,
1,370-2,200Gt CO2e ---> 450ppm
3,590-4,580Gt CO2e ---> 1,000ppm
Now, we have already from 2001-7 added 315Gt CO2e to the atmosphere. So going from 2008 onwards, we find,
1,055-1,885Gt CO2e ---> 450ppm
3,275-4,265Gt CO2e ---> 1,000ppm
Now let's look at our fossil fuel reserves. It's more or less,
Burning a barrel of oil gives us 450kg of CO2e, a tonne of coal averages to 2,350kg CO2e, and each thousand cubic foot of natural gas produces 52.2kg CO2e. Natural gas's effective emissions are actually a bit higher since about 5-10% leaks out during processing and transport, and CH4 is about 23 times a stronger greenhouse gas over a century than is CO2 itself, but even though this doubles the effective impact of natural gas, we'll find below that it doesn't make much difference to the overall picture, 50 or 100Gt CO2e here or there.
And so if all fossil fuel reserves are burned by 2100 we get,
Putting us pretty squarely in the middle of the range giving us an eventual 1,000ppm, assuming we do all the burning this century. Is it possible? Well, 1,317Gbbl of reserves is only 14.3Gbbl/yr over this time, well under half the current rate. But we can see in any case that coal is 76% of these potential emissions, so really that's the bit that matters. And of course coal consumption has been increasing over recent years, it's not plateaued like conventional crude oil seems to have.
Still, let's take our 6Gt coal consumption, 31Gbbl oil consumption, and 100T.cu.ft natural gas and see where that takes us. Given constant consumption, coal still has 428Gt in 2100, but oil zeroes out in 2050 and natural gas in 2069. This gives us 3,453Gt CO2e due to fossil fuels by 2100, again well enough to take us to 1,000ppm.
But let's be optimistic for the climate, and assume that by some combination of carbon taxes and resource extraction limits we have a 5% decline in all their use annually from 2008 onwards. Does anyone think we can do better, or that extraction will hit us harder than that? I don't know what the accepted projections for fossil fuel production in (say) 2030 are around here.
Anyway, given an annual decline of 5% from 2008 on, coal reserves are 881Gt by 2100, oil still has 733Gbbl left, and natural gas 4,191T.cu.ft. I don't know of any scenarios published at TOD which give us over three-quarters our reserves remaining in 2100. But let's take that as an optimistic one for the sake of argument.
This then gives us 984Gt CO2e emissions due to fossil fuels by 2100. That looks not bad, it keeps us under the eventual 450ppm.
BUT it turns out that burning fossil fuels is only 56.6% of greenhouse gas emissions. The breakdown given by the IPCC 2007 Summary for Policymakers is, factoring in the total 49Gt CO2e emissions of 2004,
So that of the current 49Gt CO2e, only 27.7 comes from burning fossil fuels, though a good part of the nitrous oxide comes from natural gas turned into artificial fertiliser.
With the UN expecting world population to hit 9 billion in 2050 and then stabilise, with climate change making growing crops in traditional areas more difficult, and with fossil fuels growing scarce and the price rising we can expect freight to become more expensive, thus giving an incentive for countries to try to grow more of their own food; so that altogether it seems likely that the use of artificial fertiliser made from natural gas will increase rather than decrease.
With demand for more crop-growing land and biofuels, and decline of available fossil fuels, we can expect that deforestation will likewise increase rather than decrease.
Rice paddies and livestock are more difficult to judge. Certainly people will want rice, especially since the areas where it grows are already under some degree of food stress; but with climate change, melting glaciers reducing river flows and changing rainfall patterns, people may be able to grow more or less, it's hard to say.
Current high world production of livestock can only be sustained with heavy grain inputs (about 27% of all grain, and large parts of oilseed stock), so if grain production levels out, so will livestock use, and thus their farts and its methane.
The cement and chemical industry, where CO2e appears through chemical process rather than merely the stuff being heated by fossil fuels, we can also expect to continue. If we have business as usual then there's lot of construction; if we have a big buildout of renewables then we'll need lots of cement and chemicals.
CFCs will probably decline as more countries phase them out finally; but it's only 1.1%, or 0.5Gt of the total.
All things considered we can expect that the 21.3Gt CO2e of emissions which do not come from burning fossil fuels will continue, less those of the CFCs, leaving 20.8Gt CO2e.
20.8Gt x 92 years = 1,914Gt CO2e
This is well within the first range. Thus even without burning any fossil fuels we hit 450ppm by 2100, if we fail to have deforestation, livestock, etc emissions decline at all.
Of course, rather than not declining, we can expect them to increase. After all, it's one thing to tell people not to drive cars or even have electricity from fossil fuels - only about 800 million people have cars, and about 2 billion people have no electricity anyway. But it's another thing to tell them not to plant rice, or to not cut down forests and just go hungry instead, etc. So it seems reasonable to expect these emissions to increase in proportion to population, from
2008, 20.8Gt CO2e with 6.65 billion people, to
2050, 28.2Gt CO2e with 9 billion people, then steady.
In that case, we would by 2050 have caused 1,051Gt CO2e emissions, and by 2100 some 2,460Gt CO2e.
Adding this to the 984Gt CO2e from fossil fuel burning which declines 5% annually from now till 2100, and we get
3,444Gt CO2e emissions by 2100, which is a touch under the 1,000ppm range.
Now bear in mind that the IPCC is often considered to be somewhat conservative in its assessments of scenarios, especially with certain feedbacks (eg melting of the permafrost releasing methane is not considered in any of their 177 reviewed scenarios, ice shelf collapse and ice pack collapse seems to be happening much faster than anyone dared predict, etc). So an eventual total which comes just under some dangerous range may be pushed over into it by other factors.
And so you see that it's pretty hard to imagine a realistic scenario in which we're short of the 1,000ppm level by 2100, once we remember that burning fossil fuels isn't everything, and that in fact peak oil and climate change may mean that the other parts of greenhouse gas emissions increase.
This is making the assumption that the population will grow to 9 billion and "stabilize", how that will be is anyone guess. The population may crash, or it may rise faster.
It also negates the increase in per person CO2 for countries like China and India whose economy is growing along with its per person CO2 emissions. In 4 years China will outdo the US in emissions, and still has a long way to go to equal the per person CO2 emissions. They can achieve that in about 17 years, when they will be emitting 4 TIMES the CO2 as the US. By 2030 China could be consuming 150million barrels per day (calculated based on their current rate of increase of about 11%), which is almost twice the total world output. Hence cannot happen. (In 4 years the US and China will need half – 48mb/d-- of the world’s output).
Though an interesting academic look at possibilities, that's all it can be as our actual future has yet to reveal itself.
Well, whatever. It's just a comment written quickly in response to another sloppy article, an article that belongs in the bin with that nuclear one from Hannahan and Barton (poor Skip didn't deserve to be slung in with those two). So yes, it's just an academic look at possibilities.
All I really wanted to say was that the idea that peak oil will save us from climate change just doesn't stand up to any probable future scenario.
I'd be glad to hear of plausible scenarios where we don't bust through 1,000ppm, and which are helped along by peak oil/coal/gas - I mean, seems like we need all the help we can get, resource constraints, unlike public opinion, can't be ignored.
If the numbers for consumption requirements for oil and gas are near correct, once scarcity starts, people will not care what the level of CO2 is in the atmosphere as they personally struggle to survive. It's also a possible scenario that a massive die off from war, starvation, freezing will drop CO2 emissions dramatically and we never get to the 1000 level. Thus any potential speculative deaths from the effects of climate change would not happen as those deaths will already occur due to energy depletion and fighting over the little that is left. That would happen far sooner than any "tipping point" is ever reached (if there is one, no one can provide any evidence there is such as thing to begin with, only speculations).
Doom and denial, blah blah blah. Go away. You need practice and lessons in trolling. Try this primer in denialism. Study, learn, then come back to troll properly.
Would you say the same thing to a black man by calling him a nigger? No, but it's ok to insult someone else. You are just a scared intolerant bigot.
Bigotry, insults and name calling should not be tolerated on a site whose goal is to promote honest debate.
The honest debate on AGW continues in scientific circles and in the meantime, the vast majority of the research results are indicating AGW. Your pseudo-scientific copy/paste efforts in a peak oil blog contribute nothing to the debate, so why persist? Do you have a little more to lose -- in the short term -- than the rest of us?
You show me where anything I have presented is not based on the scientific literature. Take the sea level changes I’ve posted above. Show me where that is wrong. There is lots published that does not support AGW theory, there is lots published that challenges the AGW orthodoxy, but there are many here who become hysterical, as one person put it, when ever anyone presents anything that remotely challenges the dogma.
I persist because the integrity of science is at stake. That is my MAIN motivation. I have no political axe to grind, I have no ideology preventing me from reading all sides, it is strictly the integrity of science.
My second motive is the hysterical nonsense of dire predictions due to climate change presented here, that has no basis of evidence, is allow to just float through unchallenged as if it was a fact of the future. That they have some crystal ball that shows them what is actually coming. They wreak of apocalyptic nonsense I get from religious sects coming to my door every weekend.
We need to focus on the real threat to society, which is petroleum depletion, and stop spending money on things that cannot possibly stop CO2 emissions.
"Troll" is only a race in Dungeons & Dragons.
"Troll" describes your behaviour, which is aimed at stirring up drama for attention.
A negative description of a negative behaviour is not "bigotry". It's certainly "insults and name-calling" - though I'm not sure of the difference between those two, it seems like needless repetition. Of course, needless repetition is a tool of trolls.
You're not acting towards honest debate. Along with Heading Out, when it comes to climate change issues, together you're asserting conspiracy, cherry-picking data, presenting false experts and impossible expectations and shifting goalposts, and between you both your posts contain many and various logical fallacies, and of course both use false metaphors.
Your posts aren't even worthy of refuting. It's as though someone came here on The Oil Drum to say, "actually oil is all abiotic so really it's all going to last forever: there's a conspiracy of Big Oil to keep production low and prices high, just last week production went up 50,000bbl/day so it'll go up forever, here's a couple of scientists who believe in abiotic oil, prove to me oil was made by micro-organisms, if it could be made by bugs then Big Oil would have bugs making it today instead of pumping it from the ground, and anyway even if it was made by bugs still most of it is abiotic, plus the fact that you're abusing me proves I'm just like Galileo, also calling me a troll is just like abusing someone racially."
Sensible people wouldn't bother responding to that guy in detail.
You are wrong. Climate scientists are right. You are not like Galileo, you're much more like the Pope, demanding equal time for wrong ideas for the sake of "balance".
Hi Kiashu,
Your postings on this thread are much appreciated. Upthread you wrote, 'Burning a barrel of oil gives us 450kg of CO2e'.
What is relevance of the increasing dependence on heavy oil and bitumen to the production per barrel of CO2? (I'm referring to the carbon in the heavy hydrocarbons, not to the use of natural gas or coal in the extraction and refining processes.)
Glad you like 'em.
I should have stressed that the emissions figures I gave were averages only. But 95% of the samples will fall within +/-10% of those values. That's good enough for what I was discussing, burning 25-100% of EIA stated reserves over 92 years. When you're talking about so much emissions, whether it's (say) 1,753.2Gt or 1,621.9Gt doesn't actually make a big difference. The range of uncertainty of emissions from the burning, per unit burned, is smaller than the range of uncertainty in the IPCC-reviewed scenarios for 450 and 1,000ppm.
In regard to the oil burned becoming less sweet, if you just look at the burning of the stuff in CO2 it doesn't make much difference; the carbon content is the same, pretty much. Again the variation is much smaller than the emissions scenario ranges. But there are a couple of real differences: soot and other aerosols.
One difference is that the sourer oil is going to have more particulate emissions, more carbon soot. Depending on where the soot goes and what it's made up of, this can have a short-term cooling effect (blocks out sunlight) or a long-term warming effect (black absorbs more heat than white, so if it falls on snow/ice the stuff melts, also soot can form a nucleus to get you condensation and clouds, thus more warming).
You also get more other aerosols, more sulphates and so on. They have a net cooling effect, as well as giving us acid rain.
However, as realclimate puts it,
Thus, burning more sour crude and coal and so on, without lots of filters to absorb them, this increases this kind of delayed effect. Just as extra efforts at oil extraction postponing decline also give us a steeper decline, so too does extra emissions from dirtier sources give us more warming even after emissions stop.
In the West these days we're relatively careful about soot and aerosols, since we've been through London's 1950s "pea soup" fogs killing thousands, and acid rain destroying forests and so on. Our friends in the developing world have thus far been not so careful, though they're improving.
Check out some recent realclimate.org posts on aerosols for info from smarter people than me. Note where they say,
"aerosols remain the least understood component of the climate system"
Of course the biggest difference is in your parentheses, how much fossil fuels we had to burn to get that stuff, for example burning natural gas to get the oil from the Alberta sands. The emissions per unit of useful energy go up a heap.
Over the past 10 years CO2 has increased @2.01 PPM/a. In order to reach 1000 PPM the average increase would have to be 6.7 PPM/a for the next 92 years. What can provide that kind of increase?
IMO 570 PPM is the most probable level by 2100.
Kiashu, that is an excellent response. If I can add one thing, a recent paper by Matthews and Caldiera shows that the rate of emission doesn't matter as much as total amount, because of the very long lifetime of GHGs in the atmosphere. Concentrating on 2100 levels vs those at another date isn't as important as getting the total utilized reserves correct.
This will be a tough number to estimate, and will require estimating the price (measured in invariant units like energy, steel etc..) at which renewables will be substituted for fossil fuels.
Sure. But I think to 2100 is the most we can be expected to do a scenario until, and plan for.
Really I just picked that number because it's the one the IPCC used. They were talking about total emissions by 2100, so I talked about... total emissions by 2100.
I think that price isn't that important. Any glance through a daily newspaper of any major city will show that governments and corporations don't typically choose the cheapest option, their choices are shaped by other factors.
I agree that price isn't important for small decisions, and the entire biofuel industry to date is a "small decision" in the context of the 15.3 terrawatt world power requirement. On a large/long enough scale though, risk and return on investment will the main determinant. So what is the cost of advanced oil recovery methods vs solar and wind? How transferable is ff recovery technology? Or does every miraculous new field (tarsand, ultradeep, arctic, shale) require an equally miraculous and unpredictable new technology and skillset?
OTOH wind and sunlight are pretty much the same everywhere. High-volume production of CSP dishes could soon become cheap and boring. So the question is - at what point on the ff depletion curve does this happen?
Remember when talking about oil vs solar/wind, it's not just their relative costs, but everything associated with them.
Okay, solar energy may be, joule for joule, cheaper than oil, coal or gas at some point. But I can't plug in my car today, nor can Japan Super Steel Corp, the fictional mega steel company, using solar in their coking process for iron to steel.
So just in terms of all the infrastructure, there's quite some inertia in the system. Consider for example how many people around the world have a computer and OS made this year, how many one five or ten or more years old. And a computer is something that in the West costs a few weeks' wages, and can be physically changed over from the old one in at most a few hours.
Now think of infrastructure which is much more expensive, and takes years to build, and you realise how slow change can be.
There's also cultural and political inertia, where people are just used to doing things a certain way. I used to live with a guy who drove 500m to his work, every morning, rain or shine - then came home and wondered aloud why he couldn't lose weight. When he thought of going somewhere, his first thought was of his car. By contrast me, who only got my licence a couple of weeks ago in my 30s, I still haven't used the car by myself - because I just don't think of using it, I think of walking or taking the train.
So these decisions people make aren't just about cost. If they were, here in my town of Melbourne we certainly wouldn't have our 85% or so of trips taken by car, public transport is widespread and relative to cars 10-40% of the cost.
The technology for all the different extraction methods you mention is indeed somewhat different. Or more precisely, the engineering is a bit different. In most cases it's not a matter of a great revolution in science having to happen, it's just years of trying, failing, adjusting or rebuilding your equipment and trying again. It doesn't require a miracle, just years of buggerising about until they get it right.
So really the question is not whether they can get oil out from 3km down in Arctic waters and 3km down into the seabed below that water, but whether they should.
well said and explained.
Comment of the day.
(though with weaker competition than usual)
Since your calculation rests crucially on these assumptions, what is the source?
EIA.
oil reserves, 1,317Gbbl
coal reserves, 998Gt
natural gas reserves, 6,183 T.cu.ft
Woops, they give a higher reserve for gas than I remembered (the figures were from memory).
I know the EIA reserves estimates are a bit scorned around here, but note that in my post above, even if you only burn about a quarter of these stated reserves, adding in other greenhouse contributors, you still get 1,000ppm, or pretty close, probably over with feedbacks.
So even if the "true" reserves are just one-half the EIA version, and even if we only consume half of those by 2100, with other contributions and feedbacks we still whack past 1,000ppm and are in the poo.
I mean, what that last "5% annual decline" scenario was talking about was that in the next 92 years we'll use,
oil, 584Gbbl
coal, 117Gt coal
natural gas, 1,883 T.cu.ft
Which is each year
oil, 6.3Gbbl
coal, 1.27Gt
natural gas, 20.5 T.cu.ft
or about 20% of current consumption. How bad will the drop after peak be? Will it mean that the next 92 years come out to less or more than 20% of current consumption on average? I don't know.
But it seems pretty plausible.
Basically, given a bit under half of emissions aren't from fossil fuels, our fossil fuel reserves accessible by 2100 have to be less than a quarter what we think they are before it even stops us hitting 1,000ppm, let alone 450ppm.
Are fossil fuel reserves less than 25% stated? If not, then we can't rely on peak fossil fuels to save us from climate change.
I went to your IPCC link and what I found there gave me some pause. I noticed that the use of the word "likely" was used in regards to the impacts of warming and to the causes of warming. I am not a Climate expert but the report sounds much less certain than it has been presented to be and I noticed at least one error. In the table of CO2 sources 22.2% of the CO2 comes fromLivestock, rice paddys, NO2, Fert and Manure runoff.
It appears to me as if the total CO2 production by these area is used. A more realistic number would be the increase over a base number before human industrialization say before 1750. Two examples to explain what I mean. Rice paddys emit greenhouse gases but they are genearlly sited in area prone to being wetlands which were historically emitters of greenhouse gases. A second example would be livestock production in the central area of North America. Clearly the livestock produce CO2 and CH4. Before 1750 the area was home to many millions of bison and other herbivores which also produced CO2 and CH4. If the CO2 level was stable prior to 1750 only increases in CO2 and CH4 emisions due to these activities should impact increases in CO2 levels.
In the context of the IPCC and most science, words such as "likely" are all relative. What you have to remember is that a scientist is a person who spends years on a project in a lab or out in the field, then more years analysing the data, then writes it up in a paper and publishes it somewhere - then 100 other scientists come along and tear the paper to pieces in vicious critiques.
So if a scientist were measuring my height, they wouldn't say, "he's about 5'10"," but rather say, "using the tape measure bought from Bunnings, at standard atmospheric pressure and temperature, the subject was found to be 5'10" +/-1/4" in the morning, and 5'9 3/4"+/-1/4" in the afternoon. It can then be said that it is likely that the subject is about five-ten, though further observations are necessary to explain the difference between morning and afternoon measurements, the mechanism of change is not clearly understood yet [it's gravity]."
A normal person would just say, "he's five-ten."
What you saw isn't an error, it's just a summary, so of course it doesn't describe everything. Go download and read the whole report.
Thanks for this reply - which if I read it correctly follows along the lines of the IPCC argument. The problems however lie in the assumptions. One of the interesting things that I found in Dr Stegemeier's talk is the way that he, a guy who knows the oil business, was saying many of the things that are said here.
Among the things that are said here are statements about how rapidly the world is running out of oil and natural gas. If peak oil production is about now (give or take a couple of years) we then start arguing about the decline rate. I commented at the talk that I thought his use of 4% was incredibly optimistic (vide for example the 8% from the head of Schlumberger) - but you comment that
Anyway, given an annual decline of 5% from 2008 on, coal reserves are 881Gt by 2100, oil still has 733Gbbl left, and natural gas 4,191T.cu.ft. I don't know of any scenarios published at TOD which give us over three-quarters our reserves remaining in 2100. But let's take that as an optimistic one for the sake of argument.
And again I will say that whereas you think that a 5% decline in oil production an optimistic view of how fast supply will decline (from a GHG point of view) I think that many folk can tell you from looking into the crystal balls that we build here that that is actually (from the same point of view) pessimistic.
Now where you and I seem to agree (and disagree with Dr.s Stegemeier and Rutledge) is how long the coal will last (although your estimate of the total reserve is fairly close to his) since I expect it to last longer than 50 years, as you appear to, while the other two are suggesting that such is going to be the demand for energy that the coal will be gone by 2050. There are many nations of the world that have no other current resource for fuel, at least to their perception, but that need will, I believe, see more of the coal resource counted as reserve in the future than is considered so today.
Well, as I showed, coal is 76% of our reserves in terms of "potential emissions if everything gets burned". Call it "three-quarters" since we can't be precise about something over the next century.
And even a quarter of all fossil fuel reserves being burned, or a third of coal reserves being burned, in combination with other likely contributions, whacks us up past 1,000ppm and into "in the poo" territory.
So, considering coal-to-liquids and increased use of coal there and in other places are you're suggesting, it seems like that more than a quarter or a third of our fossil fuel reserves will get burned up this century, given a business as usual scenario.
The exact rate of depletion only matters insofar as it affects the total reserves burned.
Will the depletion rate of all fossil fuels, the flow and extraction rate depletion, will that keep us under a quarter of it all being burned by 2100? I don't know of any scenarios saying or implying that. But I'd be interested to see them. A lot of TOD stuff seems focused on looking at whether or not we're at peak today, or exactly when we'll reach it, rather than presenting a global picture of how things might go over the next half-century or so.
How much of our reserves will be available for burning by 2100?
Well this gets to the nub of the argument since, in the absence of oil and natural gas, and with an existing demand for power - whether for cars, industry or the heat for your home - what are people going to use?
The consistent answer that keeps popping up is coal, in some form, and if coal demand goes up, and the price also - as it is - then I argue that a considerable volume of what is now considered only a resource will again become a reserve. Dr. Stegemeier's retort was that he could not see a circumstance where a coal seam one foot thick at below 10,000 ft would ever have any value. And while he might be right there is a lot of coal between that end condition on one hand, and the limits on current economic extraction on the other.
Heading Out,
How can I take the part about natural gas, and shale (the part I know nothing about) seriously when you post something that is so ridiculously wrong about a subject on which I do have a modicum of knowledge?
As I explained above I believe that you and Dr Stegemeier are working from a different set of assumptions - he worked from the point of total replacement, and did not count the other uses that could be made from the by-products. He was looking at total volumes required, using ethanol as the fuel source for all operations - bear in mind that there will come a time when natural gas will not be available for use as the fuel source.
Heading Out, it doesn't even matter. His numbers are Silly to the Nth, Period. They are flat Crazy. It takes approx 8 gallons of diesel to raise an acre of corn. Even if you left the DGs out of it you're still getting 151 bu X 2.8, Or 422.8 gallons of ethanol.
All the other inputs prior to refining - nat gas to fertilizer, drying the seed corn, gasoline for the farmer's car, Propane, and electric for the farmer's house, etc. even without allowing for the fact that you're getting back 40% in distillers grains would only add back about 17,000 btu/gal. These numbers don't change much. They get slightly smaller every year due to increasing yields, but only incrementally. His numbers are off by a Factor of Twenty, or so. It's pure idiocy.
"It's pure idiocy."
It is agenda-driven. Heading Out has no respect for facts.
I still think that you misunderstand what he did. Because, presuming that the energy source can only come from ethanol, he works out how much ethanol must be generated to carry out each of the steps, bearing in mind that you have to grow that much more ethanol to provide the supply. Thus in order to distill the ethanol you not only have to distill the ethanol that is the final product, you also have to distill the ethanol that will be needed to power the distillery, and to provide for the farming, and for the delivery. This is where the large multiplication comes in.
a few comments:
the normal formation pressure is generally equal to the hydraulic gradient 0.433 psi/ft.
your rock pressure may be correct based upon poisson's ratio, but i dont think anybody knows. i have always assumed that the horizontal rock pressure is about equal to the fluid pressure.
some sedimentary basins, the powder river basin and williston basin for example are under pressured, generally about 0.35 psi/ft.
it is pretty well established that these basins are being recharged, hydrodynamically.
one question that arises is why are they underpressured and being recharged. a possible explaination is surface errosion, past and present. the porous rock acting like a giant sponge. at least part of the rocky mountains were burried by miocene era sediments which have been eroded away.
in most cases, drilling is done overbalanced(i.e. the drilling mud weight exceeds the formation pressure).
the hydraulic fracture gradient, for vertical fractures, is generally in the range of 0.7 psi/ft.
in areas where horizontal (hydraulic) fractures occur, the gradient is usually about 1 psi/ft, equal to the overburden pressure. certain areas in the black warrior basin(alabama) have a fracture gradient of about 1 psi/ ft. as far as i know, the hydraulic fractures created there are horizontal. these locations are generally associated with thrust faulting.
forgive me for bringing up the subject, but much has been written recently about the bakken formation in the williston basin. it is claimed by some that the natural formation fractures are horizontal. this is very puzzling, i havent seen an adequate explaination for this.
the hydraulic fractures being created in the bakken are vertical, as far as i know.
oh hell never mind, i thought this essay was about fracturing shale and come to find out it is about melting ice and ethanol.
Exactly. And while HO can technically post what he likes where he likes surely he can see the damage done. Keep it for a distinct post please.
Pity 'cos I quite like ethanol and melting ice - if it's in a glass - Cheers :-)
Yeah,
EXACTLY.
Saw this post and thought it may be interesting to look at since I know a bit about this.
It would have been nice to get into the details re Horizontal Drilling in fractured shales, possibly a bit here and there on Key Seating, Cuttings removal and how to tell the difference between clean drill cuttings and re-worked artifact cuttings due to poor hole cleaning, well-bore stabilisation etc etc.
This site is now thoroughly infested with Global Warmists.
Any chance we can give them a separate playroom?
Or better still a complete new church for their new religion?
"how to tell the difference between clean drill cuttings and re-worked artifact cuttings"
how do you tell the difference ?
Shales:
Vertical wells, with good hole cleaning and mud rheology generate shale cuttings with clean, sharp edges, conchoidal fractures and are usually firm to hard.
In horizontal wells, the big problem is cuttings cleaning especially as cuttings build up can occur at the heel of the wellbore.
Artefact cuttings or re-worked cuttings spend more time in the wellbore than would otherwise occur. The sharpness degrades and if you see pellet - like softer cuttings then it is quite possible that cuttings are staying in the wellbore. The pellets are artefacts. Created by shale rolling around on the low side of the wellbore.
When they reach surface, they are very different from normal cuttings and are easily identified in the field and should be reported to the drill rep. They look and feel like rabbit droppings.
Cuttings build up of course can create serious problems and ultimatel lead to stuck pipe or a parted drill string. While drilling horizontally, the drill string is 'sliding' and not rotating so any back-reaming is limited to near the drill bit.
Then of course key seating is another aspect that can occur where the drill string wears a groove into the low side of the well bore. When pulling back, the proud tool joint jams into this groove and can take some effort to pull the string out. Downward pressure from the drilling fluid can add to the problem.
Sands:
If you get into a sand for any length, you can then run the risk of differential sticking as filter cake builds up and the drillstring embeds into the filter cake and hi-side pressure forces the drill string into the filter cake. This also can loose a string.
Heading Out must be bear baiting me. To end a very good post with a totally ridiculous anti ethanol story throws the whole post in question.
I can only address with certainty the amount of ethanol the farmer would have used to grow the 600 gallons of ethanol. At 150 bushels per acre and a 2.8/bu. ethanol yield it would take about 1.4 acres to produce the 600 gallons of ethanol. I use about 4-5 gallons of diesel per acre to grow and harvest corn on my farm. No way does 7 gallons of diesel equal 600 gallons of ethanol.
The whole anti ethanol story is a complete fabrication. Shame on you for not recognizing it as such and for repeating it. Now I don't know whether cracking shale with horizontal wells is slick or not.
See below re: 'psychological anchoring'. We are REALLY in trouble...
Nate, I'm sorry, but X is right. The so-called "Engineer's" ethanol numbers are totally divorced from reality - To a HUGE Magnitude. The good "Engineer" is the one that's anchoring, here.
X gave Actual, Observed results. I have, repeatedly, linked to tests from EPA, CARB, DOE, USDA, etc. I have linked test results from the Univ of N. Dakota, and the State of Mn. Either ALL of these organizations are rigging their test results, and research to a factor of twenty, or the good "engineer" is Bonkers.
I know which one I'm betting on.
I assumed (and given his prior 500 postings, it was a good assumption) that he meant the whole anti-ethanol story in general, not the one linked above. After looking at them, I have to agree they look a little odd. They don't use ethanol to distill ethanol, etc.
From todays NATURE, Advanced Biofuels Face an Uncertain Future
I don't understand ... from what you are saying, ethanol should be hugely profitable and shouldn't need any subsidy (or indeed any diesel.)
What are you saying that the correct EROEI for ethanol from corn is?
Xeroid, virtually all of the larger tractors have been produced with diesel engines for many years. As a result, farmers are pretty much stuck with diesel/biodiesel for the foreseeable future.
The thing about EROEI is that it's constantly improving. Poet is converting one of their plants to waste wood (Chancellors, In. I think.) Their project Liberty at Emmetsburg will use, virtually, NO NAT GAS. This Project:
http://domesticfuel.com/
will use methane gas from a landfill to replace some of their nat gas. Corn Plus gassifies the thin stillage to replace over half of their nat gas.
It, also, depends on the type of engine you're running the ethanol in, and what the blend is. I could make a perfectly valid argument that, for all practical purposes, the EROEI on the ethanol being produced by Corn Plus, and used in a 20% blend in a flex fuel Impala is Over 5:1. However, the ethanol being produced from a ten year-old plant, and burned in a Silverado in an 85% mixture is probably, just barely over 1. The good news is that GM is starting, this year, to rework their flex-fuels, and they will soon be getting much better mileage on e85.
Yes, flexfuels were, initially, brought out as a CAFE scam. But, times change.
As for the tax credit: Ethanol doesn't, actually, need it to be profitable. It does accomplish two things. It makes/has made it virtually impossible for the oil companies to strangle the baby in the crib (thus, encouraging investment,) and, it takes some of the sting out of the mandates.
Yesterday Gail conveyed to me (from the EIA conference) that Guy Caruso of EIA claimed there was 16 to 21 trillion barrels of oil in place. Another presenter claimed we would be able to ultimately get to 75% recovery rates. Yet read Ace's latest graphics on TOD, and look at oil prices....
The magnitude of disparity between the two oil 'camps' is shocking. Apparently, a similar rift exists in the AGW camps.
Regarding climate change, I am surely no expert, but I do understand human nature, framing, the 'anchor effect', the availability heuristic, etc. which causes smart well intentioned people of all stripes to overexaggerate their own beliefs from time to time, and even often. There is no boundary line between regular people and scientists where this behaviour stops. Climate change, in my personal opinion, is important. What % is caused by humans is also important. Our energy crisis is many times more important because it, if left unchecked, will lead to wars, starvation, etc. If AGW is real and threatening, that gives us one less (large) option in dealing with peak oil (namely, coal-to-liquids, and tangentially more coal electric plants). For this reason, climate issues should be periodically discussed on this site, just like issues about psychology, algae, demand changes, and decline rates should be discussed. The boundaries of 'energy and our future' are getting wider by the day. We have attracted a great amount of smart, thoughtful contributors to the discussions at TOD, both staff, and our regular readers. We all agree on some things, and disagree on others, but the mutually intersecting circle that we all share is that we care more about the future, than the average person watching American Idol and mindlessly oblivious to the larger issues facing mankind. Let's continue a civil, empirical (as best as possible) discussion about the issues.
I have met HO and we have vastly different skillsets and opinions. But I have immense respect for both the man and his mind. Here he contributed an interesting piece on shale and horizontal wells that I learned some things from. At the end he added some short musings on AGW. If he is concerned or interested about something in contemporary science, IMO he has earned the right to use the oildrum as a science-lite catharsis for what he is thinking. In sum, this will never be a climate change site (either for or against it). In fact, we are not for or against anything, other than raising the level of discourse via the internet, on this planet, to effect positive change.
I sometimes wonder if people would care if we just all walked away and resumed our day jobs fulltime... Would there be a vaccum? Or would the non-stop media choices of the modern world swallow up the TOD void within a few days...
We come to TOD for focused, well-referenced and well-argued articles.
Musings and science-lite catharsis are for blogs.
If TOD is going to become people's blog, I don't see it becoming more relevant, useful or popular because of it.
That he mentioned climate change or dodgy wind farms isn't the problem. That it's just sloppily shoved into the rest of the text like an average rambling blogger with two or three regular readers is the problem. It's even sloppier than Hannahan's and Barton's blatherings on nuclear - they were inaccurate and muddled, but at least they stuck to one topic each.
headingout should get a blog and not bother us.
umm.... This is HOs blog - he and PG started it (with SuperGs help) 3 years ago. The other 25 of us volunteered along the way. There is no other model that we can follow that assures a deep queue of highly detailed, empirical, novel and news-worthy posts every day from a group of geographically disparate volunteers whose motivation is that they care about these issues.
Sometimes you get sushi and sometimes you get just rice. (And some actually prefer the rice). In my own posts, I try and stay on one topic, which is sometimes difficult for me...;-) But to put a muzzle on HO is like Apple asking Steve Jobs to stop wearing black clothing. While the site has certainly become bigger than just PG and HO, I think his history here has earned him the right to write whatever he wants. Sorry that his musings, which typically follow his posts, but today hit a hot button, offended you. Go elsewhere if we aren't meeting the standards of your subscription fees.
Perhaps this explanation can preface his posts in the future, so those of us who haven't been here since Day One can be forewarned of this exception.
I didn't know it was his joint. Maybe it's time for a coup? :D
Thing is, our subscription fees are the articles we ourselves write, and the posts we write in response to things. These are entirely voluntary, of course, and some people put no effort into them, and some people lots. But while as Prof Goose said the standard deviation of comments is high, I think that ideally on a site like this you want the articles to be at least as good as the comments.
I mean, the guy quotes some engineer as complaining that the IPCC review board doesn't have any engineers on it. So? Neither does the hospital board, or the library management, or... Bizarre.
I have discovered that when I mention Global Warming that it is very difficult to get a sensible response. (though if you look above you will find that I got one - which is one of the reasons I put the comment in). Very quickly those that comment look at what they interpret as what I said, rather than what I did say.
That statement makes no comparative worth statement between engineers and scientists, nor does it say that there should be engineers on the IPCC.
The intolerance of dissent and the unwillingness to even consider evidence that suggests either that the current climate change in not universal, nor that it might be part of the cycle that gave us the Roman and Medieval Warming periods (where there is considerable evidence that Greenland and the Arctic were warmer than they are now) is to my mind disturbing. Much ado was made about the current administration attempt to rein in Dr Hansen - yet those that are his accolytes seem to have no compunction in exerting an even harsher discipline of their own.
I continue to find this move to suppress dissent and debate very worrying. That is why, from time to time, I will continue to insert evidence (which no one seems to deny being accurate) that points out that there are two sides to this debate.
Straight from the denialism playbook.
Now you are playing games and twisting the subject to make the victim become the guilty party. There is a confusion you are trying to engender between facts and ideas. If there were no facts upon which to base what I was writing, and lots of facts that suggested I was wrong then there is a question as to how far a balance should be set. However when I raise questions (such as the facts that glaciers started to retreat before the GHG started increasing) which appear to raise questions as to the role of those GHG in current climate change, and am shouted down as being "stupid" and the virtual sum total of the discussion is how idiotic I am rather than discussing the meaning of those facts (which has been the general attack on most comments that raise questions on this subject) then it indicates that there is no intention of carrying out a debate.
There is an apparent intent to suppress public debate about some of these issues, you have only to look at the tone of the comments to see that. It is a rather consistent strategy and has worked at least from the time of Galileo and the Inquisition. It will not ultimately work, but in the short term can have some quite negative effects.
More from the textbook!
Of course, Heading Out also says,
That's straight from the textbook, too!
Now Heading Out, let's look over the next step for you. You need a competing "theory" to explain the data, or lack of data, or your orgone theory of the data, or whatever.
Never forget Galileo!
Keep trying, Heading Out. You're doing well, but need to work on it a bit before you can be a Master Denier.
Never forget: you're just like Galileo! Your ideas are going to completely revolutionise science and our understanding of the world!
Of course, this common understanding of Galileo and his relationship to the Church is actually more-or-less entirely backwards.
Galileo was asked by the Pope himself to write a book in which he presented both the Sun-centered model and the Earth-centered model, but not to argue for either, and to include the Pope's views. So you know how you're asking for "balance", letting the climate change denialists be heard? Well, so was the Pope.
In his dialogue, Galileo put the words of the Pope into the mouth of the pro-Earth-centered universe guy, and as is the tradition in Socratic dialogues, made the guy whose opinions he didn't like look foolish. He thus upset his greatest friend and patron, and was tried for heresy.
Thus, Galileo suffered not for presenting an unpopular opinion, but for failing to present "both sides", and for insulting his patron and friend.
And so, in their demand for equal time and respect, climate change denialists resemble the Pope, not Galileo. Note that Galileo never had to demand to be heard; only false ideas have to be pushed forth and helped along by official sanction.
But by all means, please continue imagining yourself to be "just like Galileo", Your Holiness.
Does somebody write a script for you folk. It's beginning to look that way. You certainly have a strange twist on what happened with Galileo, but you are, perhaps deliberately, missing the point. This is not about me having a crazy theory that I can't get accepted. This is more that there are facts out there that those such as yourself would rather deny (see there I go again) than admit cast some question on the role of GHG on the current climate change.
No, it's you that has the script. Denialists use the same approach whether they're denying peak oil, climate change, evolution, HIV/AIDS, or whatever. It's the script of the crank.
It's not a strange twist on Galileo's life, it's the way it happened. The Pope asked him to write a book providing "both sides", and Galileo effectively presented just his own side. That's the facts of history. Sorry.
It's a poor analogy for our times, but if you insist on drawing the analogy, then denialists like you don't resemble Galileo, but the Pope; the Pope demanded equal time and respect for both ideas, even though one of them was rejected by all people who knew any damn thing at all. Galileo didn't have to demand equal time because he was right, and it showed.
This is entirely about your crazy theory, that humans have little or no role in climate change. Which is bollocks.
You're confusing the complexity and nuances of the issue with doubt about the general thrust of it. It is, as I've said, like having some peak oil denialist pop on here to say, "oh well since EIA says production is up 176kbbl/day for January, it will never run out." Well, first we must discover if the EIA figures are right, then we must consider the long-term implications, and so on - but the general point that finite resources don't last forever never changes.
Likewise, while there are lots of complexities and subtleties and nuance and details people can write PhD theses on about climate change, the fact remains that burning lots of stuff warms the planet.
Only an ignorant person would think otherwise. The ignorance may be due to circumstance, the person just hasn't learned the stuff, or it may be due to a decision to be ignorant. Yours is obviously a decision.
If you want, I can spend a week or so providing an example of someone being a believer in abiotic oil, and coming in and trolling every thread about peak oil. It would be annoying and stupid, but perhaps a good example for you. But perhaps you wouldn't learn the lesson.
If you want to stop discussions about global warming, then stop posting unscientific comments straight from the denialist playbook.
For example, the fact that the CO2 level in the atmosphere began to increase after the glaciers began to melt at the beginning of the Interglacials does not say anything about the present situation. Then, the CO2 increase was a result of warming due to slow, natural changes, such as the changes in the distribution of sunlight due to Milankovitch orbital effects. Now, humans are increasing the CO2 by burning FF's. The two situations are not contradictory at all, yet, your comment implies otherwise.
Similarly, the Medieval Warm Period you previously referred to may have been a local event in Europe, not a global change. Attempts to quantify the strength of the warmth of that period have produced little proof that there was, in fact, a much warmer Earth at that time. Yeah, I know that some people claim that the MWP was warmer, but their analytical efforts tend to be flawed. I noticed flaws in one such effort and have a comment out for review on that work as well. Here's a link:
http://www.realclimate.org/index.php/archives/2007/12/past-reconstructio...
Of course, your comments about Galileo could actually be applied to the tactics of the Gee Dubyah crew with their efforts to paper over the AGW problem. I have first hand experience, if you are interested. Send me an e-mail and I'll tell you about it.
E. Swanson
I hadn't looked it at this way before, but you are correct - thanks for pointing it out (although it suggests an interesting systems dynamic - as our readers become more astute and engaged, our post quality has to go up to keep pace?) Must ponder...
I know that I had to improve my own standards as I went from having 2 people read my blog each day to 50-100. I had old JD rip me up for quoting without a reference, turned out the quote was wrong.
So you guys with, what, tends of thousands of readers a day... Well...
A while back I sent Gav an article I'd found about platinum becoming scarcer, and noted it was already having consequences, and might have some more. He asked me to write an article for anz.tod about it, but I said I couldn't. I just don't have the background to do it properly. Now, if it were just my blog I might give it a go anyway, but up here with thousands of readers? I don't dare - some metallurgist or mining engineer or someone would come along and tear me apart :)
Now, I think that my not writing an article on an area I didn't know much about actually helped to keep TOD's average level high. I mean, one of the advantages of the internet is that a reasonably intelligent person who makes the effort can research and then write sensibly about quite a wide variety of topics. And these amateurs will often have fresh and useful ideas.
But still, I think we as writers have to recognise what are our strengths and our weaknesses.
...''engineers on it. So? Neither does the hospital board, or the library management, or... Bizarre. ''
Maybe they should...
I'm confused ... One camp is talking about amounts of oil in the Earth's crust and how much might be recovered at some time (who knows how much are reserves and who knows when or if they can be produced?), the other is talking about profitable flow rates of supplying that oil (Peak Oil.)
So, to me, the two are quite compatible, they are not the same thing at all, peak oil deniers always use the 'world reserves' argument but it has little to do with profits or global flow rates.
I have no doubt that reserves of oil are huge, but the rising prices (and production statistics) tells me that the flow rates are completely inadequate for BAU already.
Ok, when you put it that way, why does one camp care about flow rates and the other not? It continues to boggle my mind that not only arent we getting closer to consensus, we are getting further apart. The facts are certainly supporting one of the camps however, at least so far.
Of course, it's ultimately always about flow rates, especially the volume of exported oil. Not to be too redundant, but the EIA shows the top five net oil exporters dropped by 800,000 bpd from 2005 and 2006 and I estimate that they dropped by a further one mbpd in 2007, on track for approaching zero net exports by 2031.
As I have said about a thousand times, the model and recent case histories suggest that net export decline rates accelerate with time. This would presumably cause an acceleration in the rate of increase in oil prices, and that is precisely what we have seen in the past year, with US oil prices increasing at over 50%/year (which would double prices every 18 months).
The people ignoring flow rates either don't or won't understand our predicament - I suspect it has to do with 'it is difficult to persuade somebody about something if their job depends upon it'.
I think you will find that, in general, the livelihoods of people using 'untapped reserves' as a counter argument depend on there NOT being a peaking of oil supply. They are intelligent people in denial (despite the flow statistics), otherwise it is a personal disaster - it's normal human behaviour - eventually they will move on and accept the situation, just like you and me.
However just because something is inconnvienient doesn't mean it won't happen - especially when like peak oil 'net exports' it already has happened! The human brain is a very strange, complex, and bizarre thing - I know quite a bit about color vision, what we see and what we think we see are often totally different.
Are you people nuts? Here this guy is explaining in simple terms the rationale for taking million dollar risks and you want to talk about feel good ideas that may leave us all cold, hungry, and reading by candlelight. Oh yes, there is plenty of profit when your right, but lots of red ink when your wrong. Unless you have some skin in the game stick to your video games.
Excellent article on drilling in these difficult to produce formations - appreciate your efforts here and I feel I learned a lot.
Wish you had saved your personal bugaboo on AGW - it didn't add to your discussion of drilling fractured shale plays, and in fact instantly raised my hackles for it's rather (ironically considering the level of your preceding discussion) anti-scientific bent. You could have done yourself a favor and saved your denialist carping to respond to an actual post on AGW (there are enough of them here that you wouldn't have to wait long)
the windfarm bit was lightly amusing, but again, largely detracts from the merits of your main article.
Again, I appreciate your taking the time to help me (and all the rest) understand this complicated drilling technique - please continue to contribute informative articles like this
....and please save yourself some grief and post your anti-AGW garbage where it belongs - in threads dealing with AGW
Maybe I'm being over critical but at least to me drilling into tight formations with horizontal wells probably has at best problematic lifetime problems. And correct me if I'm wrong.
1.) You can't really re-complete these wells like you can verticals. If they start to have problems your going to have very expensive problems. Lets say the well fails somewhere along its length etc. So you I feel have a large additional unknown with your 3 million dollar well it can become unusable.
2.) Long term stability of the cracks. Shale is a lot more fluid if you will rock than sandstones etc I have to think that the cracks in shale are not static at the depths and pressures they probably open and close over time especially if you perturb the system by say drilling a hole in it. A worse case example is salt. So I think the long term life times and or production from these wells could turn out to be erratic.
So overall I suspect that unlike traditional wells these will have a higher risk of failure and problems throughout their life cycle compared to more traditional wells. I don't think we know for sure what this is but lets say 1:10 wells randomly fail in any given year at any point in the lifetime. This means you have to up your costs by 10% to cover your statistical loss. And worse as the field is in production you have to be ready to go back and redrill an new well as needed.
So anyway just looking at it as a bit of a outsider its seems intuitive that your failure rate will be high and should be factored in.
I may have oversimplified a bit. But the reason that you inject sand into the crack that you make is to partially fill it and thus to hold it open so that the gas can escape. It requires a fairly skilled set of drillers to get one of these wells in place and to work, and even then, based on data from the Barnett shale, it seems that less than a third of the wells are economic. I don't know if that will be true in these new areas.
Horizontal well stability is becoming an increasing problem, it is one of the issues with the deep wells off Brazil, where the rock is of relatively poor quality, and horizontal wells are needed to make the project economic. And this is also true of these shale deposits, you can't get enough production from a vertical well to make the project pay for itself, you need the higher production from the horizontal well.
Are these shales stable or prone to swelling. As shales frequently are when exposed to water based muds I am assuming they are pretty well stable and easily fractured.
I take it that they are stable and do not require a synthetic oil based mud. Since it is land drilling this would be preffered (not even sure Synthetic OBM is allowed on land these days)
This is timely because the US Geological Survey's report on recoverable oil in the Bakken Oil formation is coming out today.
I am VERY curious as to what its going to say - i keep googling the newswires but am unsure on the timing. A USGS scientist (who is deceased) did a report in 2000 saying there were upwards of 500 billion barrels in Bakken, which of course I don't believe, but any big number is going to shake peoples perceptions up. But the firms drilling there now EOG, Continental, Brigham have met with success but its not earth shattering or anything.
:) It just came out, probably after you hit "Post Comment":
http://www.usgs.gov/newsroom/article.asp?ID=1911&from=rss_home
well, technically then thats an increase of 15% of USAs proved reserves....Pop the champagne.
But at what cost? It says its recoverable using todays technology but is that at $20 a barrel, $100 a barrel, etc? I don't know.
And it's about one percent of the crazy numbers that various people were posting, and the USGS is generally way on the optimistic side.
As I noted over on the Drumbeat thread, if we assume 5 Gb for the Bakken, and if the shale play had been fully developed in 1970, it would have postponed the Lower 48 peak by about six months.
3 to 4.3 billion barrels: http://www.usgs.gov/newsroom/article.asp?ID=1911&from=rss_home
Chris
Thanks for the additional background on shale gas and horizontal wells!
I am not yet convinced that all of these new areas for drilling will save us, and I suspect you feel that way also. I remember well your previous post about some of the cost issues. Cost will be a big issue, especially if the wells do not last as long as hoped.
There are other issues as well. I believe that Barnett Shale is now producing about 7% of US natural gas. Even if we find two or three areas that are equivalent to Barnett, this is still not a whole lot of gas. It will offset some declines elsewhere, but it is not going to give us a huge increase in production.
Gail I posted above but I just want to say I don't think the big issue is how long the wells last but that it will be highly variable and that a well could fail for a number of reasons at any point in its life. This variability if I'm right is a lot worse then some systematic rate. I don't know the answer and I don't think anyone does but you might be able to comment on the effect of erratic well lifetimes vs predictable ones. My view point is it makes the whole situation a lot more risky.
Murphy's law/ And complexity issues is enough to be pretty sure these types of wells will have erratic lifetimes
right you are. developing a section or two of land with one or two wells is a lot riskier than with 4 or 8 or 16 or 32 wells(on 40 acre spacing). i dont think po boy oil co will be in business here very long.
Not only is it just two wells in your example but two high tech wells. Actually now that this has come up this problem is pernicious in high tech extraction. And its probably a big part of the reason that reserve estimates are messed up. We don't have enough information on these wells and people are using traditional horizontal drilling risk and recovery analysis and applying it to unproven approaches.
And like you I suspect a lot of this production is probably not actually profitable overall today it just will take time for the risk to become understood.
I just happen to think that even with todays high prices its still probably to low for this type of extraction process once it becomes common.
Maybe Gail can respond and give us some understanding of the risk levels that are probably not well understood. I mean look at Thunderhorse its a primary example but its permeated all aspects of oil extraction.
HO - a chart showing a lithostatic pressure gradient, and hydrostatic pressure gradient and the concept of over pressure may have been helpful here.
Of course, adding atmospheric pressure gradient and the influence of tides on oil field rft pressure data and the potential this may have on controlling gas - fluid partition between the hydrosphere and the atmosphere may also have been enlightening. But that would be boring old engineering - eh?
It was difficult trying to decide what to keep in, and what to leave out. If I went down any of the avenues very far then I thought I would be making the whole topic too complex for the space. I debated about how much to put in about rock pressure, especially since I have a down-hole picture showing the side-wall collapse and top cracking. I should have put in more about overpressure - maybe that can be another post. (Though I suspect that my next one will have to deal with the ethanol problem calculation - ah, well!!)
For those interested in how slick water frac can improve a plays economics check out these two articles:
Fayetteville Shale
Mr. Burman finds that only 3% of horizontal wells are profitable. It turns out these wells did not incorporate slick water fracture. They are estimated to produce only 0.341 Bcf of gas.
Fayetteville Shale after slick water
He revisits the study after reader feedback and companies providing well data and finds that using slick water most would be economic because total URR would end up 1-2.5 Bcf.
This is interesting for two reasons: First technology is making improvements that are allowing recovery of poorer reserves. And second, that these improvements are just slowing the decline at rather high cost.
I wonder if Mr. Burman could get the failure rate of these wells because of technical problems.
Todays NYTimes
Why We Believe
Appropo for this thread
Trying, and half failing to not write "You're an idiot"
Talk about cherry-picking. Pot meet kettle. Suggest you stop focussing on the flooding issue, and start thinking about the millions who might not have fresh water in a few decades, or the effects of drought, or what might happen if more species continue to migrate polar-wards as is starting to measurably happen, or what it might actually mean to not have an artic ice sheet for one month each year to that biosystem.
The irony of you falling in with those who accuse the IPCC of 'cherry-picking', and give as 'evidence' your absurdly indefensible cherry-picked analysis shoudl have made me laugh - but I was in a grumpy mood already, so apologies for my tone here, but REALLY?!?!
What's ironic is that the peak oil denialists do the same thing.
It's funny how we as humans can be so reasonable and sensible in one area, then become totally stupid in another area.
What startles me is that while peak oil is obvious and Global warming is not, at a very basic level, peak oilers are regarded as the crackpots.
Someone linked to the denialism guide yesterday, and it's brilliant. A bit long, but worth reading through.
I'm trying to keep that in mind as I cruise around these sorts of discussions.
* I added some paragraph breaks to make it more readable, these guys are scientists more than they're writers!
"That kind of well could cost a company $3 million to build, not counting the cost of leasing the land, Engelder said."
When all goes well it may cost this much. I just heard about two horizontal wells drilled with two laterals in each well. The operator was convinced that the drilling engineers who designed the well "knew" how to do this well. The level of knowledge (lack of) was realized first in the first well where they had problems coming in with completion equipment. This resulted in a well cost of $8 million before even fracing etc.
Next the same problems occurred in the second well. Costs? The same as the first, $8 million before even the interesting things happened.
The operator may never recover money sunk into the well as they are sharing production with a huge company which gets 60% of the well before the operator even recovers costs!!!! Bad, bad contract. Makes one wonder who makes such decisions.
re: denialists, that would be a very interesting post for TOD. I've written some ancillary stuff on why people adhere to their beliefs but this is a different angle. Thanks for link.
There's an old saying. Never argue with a fool. Onlookers can't tell the difference.
:)
Jon.
"Nothing really fancy is necessary, for example, to cut one's electricity use by 25% with the right appliances, clothes lines, CFLs, conservation habits, power strips, etc."
I completely agree with this comment. Nothing fancy but we need to start.
The extraction of what is left is rising in cost day by day. day by day more engineers are retiring and those following are not armed with the years of experience to do the best that is needed to KEEP costs down. This is known as climbing the learning curve. Decades ago this was relatively cheap, not so today. How did we get to this problem? Layoffs !!! These resulted in gaps of new people coming into the petroleum industry. Now the harvest of this is coming in at just the wrong moment. Speak to any recruiter in the PE industry to understand this issue !!!
Reading the comments above about who is correct about Climate Change makes me giggle.
I KNOW one undisputable fact, the weather around me is not the same and is not behaving the same as when I was in college or in grade school. This may be very subjective but never the less that is my reality.
Has something changed and feels not right? I THINK IT HAS :-)
Yeah, changes here as well in Scotland
But this article has been swamped by Meusli Spattered Warmists. - All banging their sandals on the table.
AGW? Yeah - so what.
GW has happened several times before in the record , ok, not as fast as now (ahem we are in an interglacial period).
But Peak Energy occuring on a planet of well armed monkeys is a bigger threat.
This site is the oildrum.
Not:
EEK: We have warmed the planet up and must stop all fun , knit our own clothes from leaves and grow beards and follow the Messiah...
Enough.
I'm off to a pub quiz
Hey - what's wrong with having a beard?
Funny you should say that. David Susuki, a few years back, returned to the London Ontario area where he grew up. He said he could tell that the weather had changed since he was a kid, much hotter than he remembered. Someone checked the weather records going back 100 years. Guess, what. Nothing changed. It was the same throughout, with spikes and dips, but over all the same from the beginning of measurements. Check your actual historical records to see if the change is imaginary or real.
Well...
its mostly the arrival of birds, insects, and plants.
But I dont read toooo much into it. We had snow cover most of last week.
It could get warmer, it could get colder (looking at the geological record , this has happened before) and, in more recent, Historical times it could get warmer, it could get colder....(yawn).
AGW is the new secular religion. Marxist/ Leninist political correctness was more or less wiped out for the sham it was exposed to be. The control freak advocates and Nanny knows best types had to find something else to cling on to in order to tell us:
'STOP IT - ITS NAUGHTY!' - (I DONT LIKE IT)
Now I am no fan of 'red in tooth and claw' capitalism - thats just as stupid as Islam, Marxism, Fascism , Born again Christianism or Global Warmism. All of these are about control and always the control of the many for the benefit of the few.
Lets see Al Gore lead from the front and live in a 3 up 2 down shack in Tennessee. Or Sting staying at home, Or Ken Livingstone aplogising for fornicating 5 Carbon-using bastards out on to the world.
You wont see it. It's: ''DO AS I SAY , NOT DO AS I DO!''
Now enough of this global warming crap.
Seriously: 6.5 billion heavily armed , nuclear tipped monkeys under immediate energy and food stress are a much larger problem than global warming will ever be.
What else have you got on these Shales, and can it work in the Bakken?
And is it viable, and if so at what price per barrel?
Otherwise all the above can , I am sure, go to realclimate.org where they can all vociferously agree with each other.
Man, I wonder why that's the only place that isn't warming up. Is there a lake nearby or some other explanation? I don't know any place that isn't getting warmer that anybody I know lives.
London, Ontario lies in the middle of a continent in a relatively flat area, and between a couple of lakes, with a cold plain and Lake Huron to its north. Its weather is very changeable, with hot humid summers and snowy winters, and lots of storms. Amid all that changeability, spotting long-term trends is difficult, compared to somewhere more temperature like my own Melbourne.
So both Suzuki and his critics are wrong. His critics are wrong because global warming is neither proved nor disproved by the trend at one particular place. It's like me at the casino breaking even on the blackjack table and saying, "look, nobody at the casino is losing money!" You have to look at the world in general, trends over decades, and also consider local effects like the presence of glaciers, predominant air and sea circulation, etc etc.
Suzuki is probably just a victim of confirmation bias. If we have some idea about the world, we tend to look for and remember evidence to confirm it. For example, here in Australia there's some racism against Asians. So when an Anglo-Saxon driver is cut off by an Asian, he remembers the Asian face. If he's cut off by another Anglo-Saxon, he doesn't remember the face, it makes no impression. He looks for "evidence" to confirm his bias that "Asians are bad drivers."
Likewise, Suzuki has a bias that the world as a whole is warming, so maybe when he visited the winter really had come late that year, or it wasn't snowing, or something. Just as a racist Anglo driver forgets all the Anglos who cut him off and remembers all the Asians, Suzuki probably remembered all the cold snowy winters he had as a kid, and forgot the dry ones, then compared it to some non-snowy day while he was being interviewed.
That's why science isn't done by having casual observations and interviews with blokes in their seventies, but by careful observation and measurement.
And of course, Suzuki also forgot that any single particular winter and its snow or no snow in a particular city neither proves nor disproves a global trend. Again I point to the gambler in the casino; how he as an individual is doing does not necessarily have any relationship to the customers in the casino as a whole.
The global trend is of warming. But that does not mean that every single spot everywhere in the world will be warming.