| The Energy Return of Nuclear Power (EROI on the Web-Part 4) | The Oil Drum: Net Energy | Wave/Geothermal - Energy Return on Investment (EROI) (Part 6 of 6) |
The Energy Return of (Industrial) Solar - Passive Solar, PV, Wind and Hydro (#5 of 6)
Posted by nate hagens on April 29, 2008 - 10:00am in The Oil Drum: Net Energy
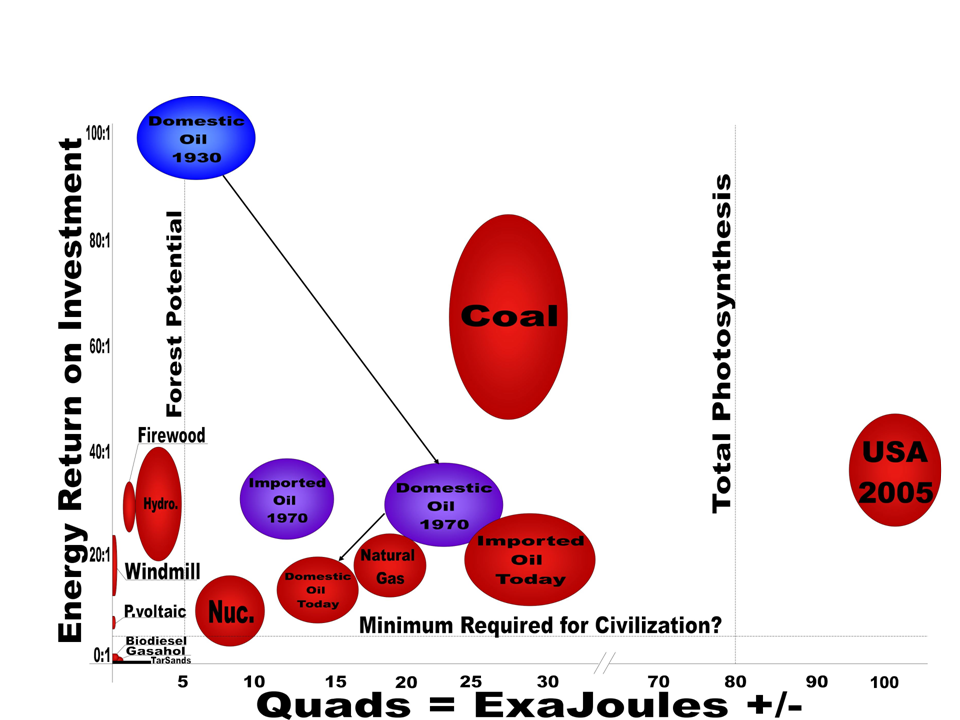
Below is 4th in a series of installments by Professor Charles Hall of the SUNY College of Environmental Science and Forestry and his students attempting to update the 'balloon graph' of EROI x Scale for fossil and renewable energy sources with help from theoildrum.com readership. Todays post deals with solar energy, specifically: Hydropower, Passive Solar, Photovoltaic, and Wind energy. Next will be Geothermal and Wave energy systems.
Previous articles/commentary from this series:
At $100 Oil, What Can the Scientist Say to the Investor?
Why EROI Matters (Part 1 of 6)
EROI Post -A Response from Charlie Hall
EROI Part 2 of 6 - Provisional Results, Conventional Oil, Natural Gas
Unconventional Oil: Tar Sands and Shale Oil - EROI on the Web, Part 3 of 6
The Energy Return on Nuclear Power
Introduction to Solar Energy
(Charles Hall)
The sun is of course the main source of all of the energy that humans depend upon. Most importantly the sun runs the great systems of climate, hydrology and ecosystems that define and create the conditions within which the human economy must operate. In the distant past, solar energy generated fossil fuels and much of the mineral concentrations that we depend upon. In a beautiful book "A Forest Journey", John Perlin traces the historical dependence of emerging human civilizations on forests as well as the crashes of civilizations that commonly followed the over-exploitation of forests and the soils they made. At issue on TheOilDrum today is the energy return on investment for the production of "industrial energy" from modern solar energy. By 'industrial' we mean electricity and heat more or less equivalent to what we get today mostly from fossil fuel. The five main sources of such "industrial" solar energy are usually thought to be hydroelectric power, passive solar, photovoltaics, wind and various types of biomass. We examine the first four of these in todays oildrum posting, and biomass at a later date. Since the EROI of wind has already been analyzed (and I might add more throughly than we have found possible for what we give today) by Cleveland and Kubiszewski, we present results for hydropower, photovoltaics (briefly) and passive solar. As usual we are doing this to seek additional references to bolster our analysis.
APPENDIX G.
HYDROPOWER SUMMARY
Billy Schoenberg, SUNY-Syracuse
Definition: “The electric current produced from water power” (Gulliver and Arndt, 2004). Because the sun evaporates water, mostly from the ocean, and through winds carries the water vapor up into the atmosphere and to the mountain tops where much of the world’s rain falls, hydropower is most properly considered solar energy. It is different from other solar energy in that it is relatively easily captured and turned into mechanical or electrical power, and relatively easily stored as elevated water behind a dam.
Hydropower currently accounts for approximately 6% of world energy consumption. Hydropower projects may be large or small scale (usually 5MW or less capacity), and may involve either construction of a dam, reservoir and/or tunnels to hold back and reroute water through a turbine reservoir (the usual), or “run of the river”, which does not involve the construction of large dams or tunnels. Large scale hydro projects, usually involving reservoirs, are the most well-researched.
Resource base
Hydropower has the technical potential to provide up to 3800 GW of power globally, but only ~2500GW is considered economically feasible. Of that only 720 GW are currently installed worldwide. Thus globally, there are many undeveloped dam sites with hydropower potential although in the US the majority of the best sites are already developed. Much of the remaining technical potential is small-scale hydro which can be placed in most streams or rivers of at least moderate size and flow. Theoretically, hydropower at some level could be accessible to any population with a constant supply of flowing water. In practice the low price of fossil fuels, particularly the low investment cost, and the environmental and social costs of dams, has meant that fossil-fueled projects are much more common.
EROI
The EROI of hydropower is very site-specific. Because hydropower is such a variable resource, used in a multitude of different geographical conditions, and involves such different technologies, one general EROI ratio is not applicable to describe all projects. Reported EROI values range from about 11.2 to 267 (both quality and not quality corrected for the fact that the output is electricity and the input is mostly oil or other fossil fuels) (Cleveland et al., 1984) and (Gagnon et al., 2002). For specific favorable sites in Quebec EROI has been reported at 205:1 (for a reservoir type) and 267:1 (for a run of the river type). It is not known if these values are quality corrected, if quality corrected these numbers, would be three times as high. Thus the EROI for favorable or even moderate sites apparently can be very high, especially if the environmental or social effects are not included.
Economics
Hydropower differs from many other energy sources in that the major investments of energy and dollars occur when the plant is constructed, and there is little energy used in maintenance and operations. In general, hydroelectric power is cheaper than other sources of electricity (about 4 cents per KWh in 2000 vs. two to three times that for electricity from other sources). Since hydropower technology has been mature since the 1930’s there are probably not large changes in EROI over time except from the decreasing quality of sites used as the best ones are developed, and from small incremental changes in turbine design.
Environmental impacts
There is a large divide in the literature as to the costs and benefits of hydropower. On one side of the debate there are those who see hydropower as a clean, renewable source of energy, with only moderate environmental or social impacts. Others see hydropower as a scourge to society with environmental impacts that can be as large or larger as some conventional fossil fuels. The proponents of hydropower speak of its minimal emissions (especially CO2), renewable nature, and its contributions to water supply and irrigation. In addition they say the impacts on people and fish can be minimized when planned properly.
Hydropower’s detractors cite the effects it has had on migratory fish such as salmon, the contributions reservoirs make to greenhouse gas emissions and the harm it has done to displaced people, especially in the third world. The global effects of hydropower center around its carbon emissions and its potential to contribute to global warming, while the regional effects are centered around reservoir creation, dam construction, water quality changes, and native habitat destruction. Much of the debate centers around hydropower’s effects on people and whether or not a constant supply of water for power, irrigation or drinking is worth the relocation of millions of individuals. Nevertheless most analysts agree that there is a place for additional electricity produced from hydropower in the future.
The majority of environmental impacts upstream are due to the flooding of the river valley and creation of a reservoir. The reservoir completely destroys any terrestrial ecosystems that were once present in an area. In addition sediment and nutrients get trapped behind the dam causing the dam to become less efficient over time and the potential eutrophication of the reservoir if the dam and watershed are not managed properly.
Environmental impacts also occur downstream. The alteration of the river flow and the increased erosive power of low-sediment water cuts new channels into the riverbank sometimes causing massive amounts of erosion. Or in some cases the dam will completely dry up the river below, killing all aquatic species and forcing any terrestrial organisms to migrate in order to find water. In addition some hydropower facilities operate on irregular schedules creating very un-natural pulses of water through the ecosystem, which most strongly effect the aquatic species especially the invertebrates. In addition to these concerns there is the occasional supersaturation of gases downstream of dams causing a “bends”-like condition (e.g. nitrogenembolism) in fish and other aquatic organisms.
The amount of carbon emissions produced is very site specific, varying by as much as 500 times and correlated mostly with the latitude of the construction site and the density of vegetation that was found in the flooded area. The highest producers of carbon emissions, generally methane, appear to be those in Brazil or places closer to the equator so that the majority of the best large-scale sites remaining are most likely to be large emitters of CO2 from reservoir construction. A range of carbon emissions per kilowatt hour produced are available and those numbers range from 1 to 34 g CO2/kWh with more usual numbers in the range of 2 to 9 g CO2/kWh. This is substantially lower than fossil fuel sources
Social Impacts
Large dam construction almost inevitably comes at the cost of the relocation of people who live in the river valleys upstream which get flooded during reservoir creation, or sometimes for those who live in the flood plains downstream. Some 40-80 million people have been relocated and otherwise impacted by the various associated general, gender/class and health effects. For example, men are hired for several months or years to work dam construction which forces families apart, and relocation often forces women to leave not only their land, but their husbands, sons and fathers. The largest health effects come after the dam is completed, often generating a perfect habitat for many parasites or vectors for those parasites in the suddenly still water. A second category of post construction health risks is dam failure or collapse. This risk is largest in China, where dams that were constructed rapidly from 1950-1980 without much planning or good engineering, killed up to 250,000 when a few failed.. The risk of failure is always present at the rate of about 1 in 10,000 per year.
In summary dams can have very high EROI and have the potential to produce a moderate amount of additional, high quality electricity in the developing world, but are often associated with extremely high environmental and social costs. Many authors see run of river hydropower as the future because it does away with massive relocation projects, minimizes the effects on fish and wildlife and does not release any GHG emissions (because there is generally no reservoir) while retaining the benefits of a clean renewable cheap source of energy. On the other hand the relatively low power density available in run of the river projects relative to the high heads made possible with a dam limits the potential of this approach.
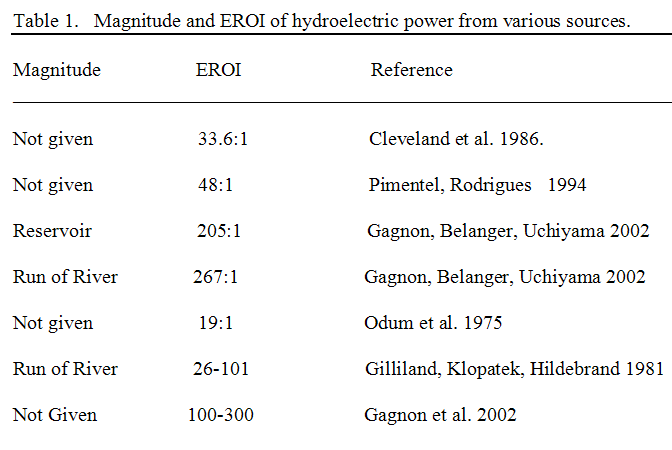
Table 1. Magnitude and EROI of hydroelectric power from various sources.
Click to Enlarge.
Adams, W. 2000b. Downstream impacts of dams. University of Cambridge, UK. Contributing Paper, Thematic Review I.1: Social Impacts of Large Dams Equity and Distributional Issues. WCD Website:http://www.damsreport.org/docs/kbase/contrib./soc195.pdf.
Brookshier, P., Hydropower Technology. Encyclopedia of Energy. ED. Cutler J. Cleveland, Elsevier United States. 2004 333 – 343.
Cada, G. , Sale, M. , Dauble, D. , Environmental Impact of Hydropower, Encyclopedia of Energy. ED. Cutler J. Cleveland, Elsevier United States. 2004 291 – 301.
Cleveland, C. J., Costanza, R., Hall, C. A. S., Kaufmann, R., 1984. Energy and the U.S. economy: A biophysical perspective. Science. 225, 890-897.
Denholm, P., and Kulcinski, G. L. (2004). Life cycle energy requirements and greenhouse gas emissions from large scale energy storage systems. Energy Conversion & Management. 45, 2153-2172.
Edwards, B. K., Hydropower Economics, Encyclopedia of Energy. ED. Cutler J. Cleveland, Elsevier United States. 2004 283-291.
Gagnon, L., Belanger, C., Uchiyama, Y. (2002) Life-cycle assessment of electricity generation options: The status of research in year 2001. Energy Policy 30: 1267-1278.
Gilliland, M. W., Klopatek, J. M., Hildebrand, S. G., 1981, Net energy of seven small-scale hydroelectric power plants Oak Ridge National Lab., TN.
Gulliver, J. S. , Arndt, R. E. A. , History and Technology of Hydropower, Encyclopedia of Energy. ED. Cutler J. Cleveland, Elsevier United States. 2004 301-315.
IEA, 2002. Environmental and health impacts of electricity generation. A part of: Implementing agreement for hydropower technologies and programmes.
Kaygusuz, K., 2002 .Sustainable development of hydropower and biomass energy in Turkey. Energy Conversion & Management. 43, 1099-1120.
Montanari, R., 2003. Criteria for the economic planning of a low power hydroelectric plant. Renewable Energy. 28, 2129-2145.
Odum, Kylstra, Alexander, Sipe, Lem, Brown, Brown, Kemp, Sell, Mitsch, DeBellevue, Ballentine, Fontaine, Bayley, Zucchetto, Costanza, Gardner, Dolan, March, Boynton, Gilliland, Young 197? Net Energy Analysis of Alternatives for the United States
Pimentel, D., Rodrigues, D., 1994. Renewable Energy: Economic and Environmental Issues. Bioscience. 44-8.
Ramage, J. Chapter 5, Hydroelectricity, Renewable Energy. ED. Godfrey Boyle Oxford University Press. 2004 148-192.
Sleigh, A. C. , Jackson, S. , Resettlement Projects, Socioeconomic Impacts of ydropower, Encyclopedia of Energy. ED. Cutler J. Cleveland, Elsevier United States. 2004 315-325.
Sommers, G. L. , Hydropower Resources, Encyclopedia of Energy. ED. Cutler J. Cleveland, Elsevier United States. 2004 325-333.
Schilt, C. R., 2007. Developing fish passage and protection at hydropower dams. Applied Animal Behaviour Science. 104, 295-325.
UNEP, 2007. Dams and Development: Relevant practices for improved decision making. UNEP, Narobi Kenya.
Weisser D., 2007. A guide to life-cycle greenhouse gas (GHG) emissions from electric supply technologies. Energy. Article In Press.
APPENDIX G-1
PASSIVE SOLAR
Kallistia Giermek SUNY ESF
Introduction
Definition: “The use of solar energy by passive means to reduce the heating demand of a building.”
A passive solar building is designed to capture and optimize the heat and light available daily from the sun. To qualify as a passive solar system means to accomplish this without use of any collectors, pumps or mechanical parts (Cleveland 2006.) The only difference between a conventional house and a passive solar house is design. When building a passive solar house there are two main design points to take in to account: one, to maintain comfortable average equilibrium temperature by balancing heat gains and losses and two, to minimizing temperature fluctuations both for 24 hours and over the year (Wayne 1986).
Passive solar architecture is much easier to execute when designed into a house rather than added on after construction. In general but not necessarily, passive solar homes take more time, money and design effort to build. Over time these extra cost will pay for themselves with energy savings (Smith 2001). At this time it does not seem possible to give the number of houses that are building a substantial amount of passive solar into the design but it cannot be very large.
History Time line of Passive Solar Energy:
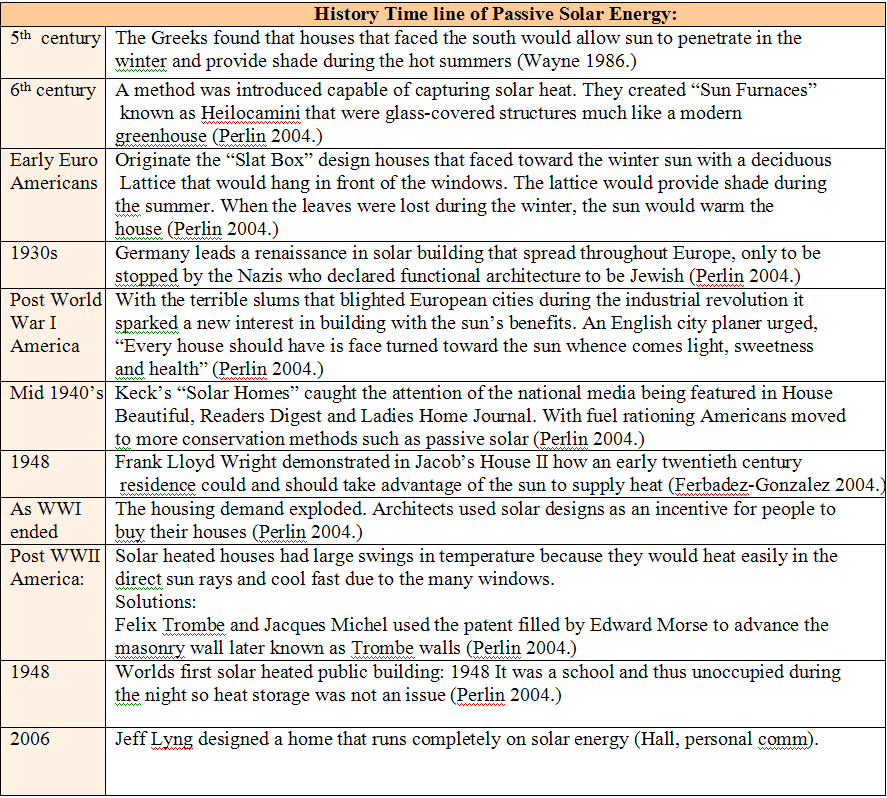
History Time line of Passive Solar Energy
Click to Enlarge.
Techniques
:
Passive solar heating: While passive solar designs and techniques vary by location and regional climate, the basic styles remain the same. The three basic techniques include direct gain, indirect gain and insulated gain. Each of these techniques utilizes different aspects of the fundamental laws of heat while all have one common factor, general construction elements which are :
1) Large areas/volumes of concrete or other thermal mass. This is necessary because during the winter concrete floors and walls act to hold heat in and radiate it during the night when the temperature drops. During the summer the concrete serves to absorb excess heat.
2). Windows with high thermal resistance such as highly efficient glazing.
3) Air tightness to avoid overheating in summers. Studies have shown that if designed properly the need for mechanical cooling can be eliminated. Proper ventilation is key. Moveable shades can also be added to reduce to cooling loads. (Smith 2001)
4) Natural ventilation.
5) Shading by use of an overhang or movable shutters. Because the summer sun is higher in the sky relative to the winter sun, overhangs can provide shading during the hot summer months. The overhang should be built to intersect the angle of the summer sun (United States DOE 2000.)
6) Orientation of the long axis of the house east to west.
7) Large glazed areas on the south facing side and fewer windows on the northern side (Smith 2001). Although true southern exposure is preferred, it is not mandatory. If the building is oriented 30º of due south (in the Northern Hemisphere), it will still receive 90% of the optimal winter sun.
Incorporating Active components:
Often the addition of a few active components can greatly increase the energy gained for a specific passive solar design. Fans and pumps and properly designed heat exchangers can be used to circulate air and heat to reduce indoor pollution
The three dominate forms of passive solar heating include:
Direct Gain: Direct gain is the simplest of the passive solar designs. Sunlight enters the house through the aperture (a large glazed surface) – usually on the southern facing side. This sunlight then strikes a source of thermal mass (walls and/or masonry floors) which is then stored as solar heat. To best absorb solar heat, the surface of the floors is usually dark and carpet should be avoided. As night approaches and the temperature decreases the heat stored in the floors and walls will radiate into the room (United States DOE 2001.)
To avoid overheating during the summer some form of shading is very important. Overhangs are a very popular method of avoiding over heating. Other methods include deciduous plants and/or trees covering the southern windows that would shade during the summer and lose their leaves during the winter to allow the sun in.
Pros: Very simple, does not require extensive planning or design and it is possible to utilize direct gain and day lighting with the same design.
Cons: Increased glazed area leads to greater heat loss and so greater fluctuations in household temperature. Direct gain has the largest temperature fluctuations of any of the passive solar techniques. (Ferbadez-Gonzalez 2004). Without proper shading method overheating during the summer is very common. Direct gain works only in areas where southern exposure is available, so it would not work in dense poorly planed cities or densely forested areas (Perlin 2004).
Trombe Walls: Passive solar houses tend to have temperature fluctuations greater than the average conventional house and 75% of heat energy is needed at night (Wayne 1986). To compensate for this temperature fluctuations different heat storage technologies such as the Trombe Wall have been developed (Everet 2004.) A Trombe Wall is a thick wall with a very high thermal mass. It is usually concrete, masonry or wallboard. It can even be water placed between a window and the living space leaving about a one inch area between the window and the wall. Heat penetrates through the glass and is stored in the Trombe wall. Sometime slits are cut into the Trombe wall to increase circulation of warm air when the indoor temperature falls below the temperature of the wall, the heat will begin to radiate into the room. Heat will travel through a masonry wall at the rate of 1 inch per hour. Therefore the heat that was absorbed in an 8inch wall at noon will enter the room at eight o’clock just in time to replace the heat lost from the sunset. An overhang much like that of the direct gain method is also beneficial to the Trombe wall system (Everet 2004.)
Pros: Heat it stored for the cooler hours of the night.
Cons: Trombe walls often block out most of the potential direct gain heat and daylighting and are very hard to add into a preexisting house.
Insulated gain (Conservatories): Also known as a sunspace, solar room or solarium (United States DOE 2001) a conservatory is essentially a green house attached to the south facing side of the house. It consists of a large open window on the house side to circulate the warm air throughout the house. Conservatories, due to their large glazed surface, experience a great deal of heat gain and loss. The use of thermal mass and low emission windows can control these fluctuations. Heat is stored in the house itself and in any source of thermal mass such as the back wall of conservatory, floors, etc.
Pros: Conservatories can be built as a part of an existing house or a new home. (United States DOE 2001), and the large heat gains in sunspace can be moved to other parts of the building easily with a fan
Cons: Worst overall performance of all the strategies (Ferbadez-Gonzalez 2004)- i.e. has a high heat loss
Other uses of natural energy in buildings:
Passive solar cooling: Saving money and conserving energy by heating with passive solar during the winter is best complemented by passive cooling during the summer. In many climates opening windows during the night helps to flush out heat and bring in cool fresh air, an aperture that can be opened at the top can be very helpful in doing this. To keep this cool air inside it is best to close the windows and shades in the morning to prevent further heating from solar energy (United States DOE 2000.)
Daylighting: The use of various apertures to let in sunlight to building interiors is as old aas architecture, but before the twentieth century replacing daylight with artificial light was very expensive. Today with cheap electricity daylighting has been vastly neglected despite its positive attributes. Most modern office buildings and schools are built to rely heavily on artificial light. The primary daylighting strategies are location, large glazed areas and orientation. Daylighting is most widely used in lower level schools. This is because schools are most heavily used from 8am – 4pm when the sun is out and ready to be used (Hastings 2003, Everet 2004).
Pros: Obvious savings in energy cost. Increased performance and increase test scores in students have been reported. Natural heat and light promotes better health and physical development (Plympton 2000).
Cons: Site specific.
Limitations:
Location: clouds diffuse solar energy making less readily available. For temperature, Passive solar heating alone cannot heat a home to comfortable temperatures where harsh winters are the rule (Smith 2001.) Available southern exposure limits the number of houses that can be so constructed since a house on the northern facing slope of a hill cannot absorb the strongest sun which comes from the south. Daylighting can work at any latitude although obviously in the winter it has less utility in Northern areas.
Air tightness: The most successful passive solar homes are airtight, however, if the house is airtight the threat of pollutants becoming trapped inside increases (Everet 2004.) This can be overcome by the use of fans and pumps to circulate air around the dwelling. This would lead to a hybrid passive/active solar design.
Net Energy
Because passive solar design is incredibly site specific it is very difficult to determine just what the EROI might be. Rarely does an architect get quantitative feedback on the system, finding a numerical Energy Return on Investment (EROI) is nearly impossible.(Lyng 2006, Spanos 2005). Nevertheless if various passive solar designs are built into the house from the beginning then fairly large energy gains can be obtained with little or no investments. In other words it may cost little to put most of the windows on the south side, although that may greatly increase the gain.
An EROI could be calculated for a case specific location by dividing the energy saved each year over the energy inputted to make that house passive solar. The EROI for a passive solar would be very high because building passive solar is a one time expense and houses last half a century or more. Studies have shown that the energy savings can range anywhere from 30-70%, this would cause the EROI to change vastly from case to case. If the payback period is five years and the house lasts for 50 then the EROI would be, apparently, 10:1.
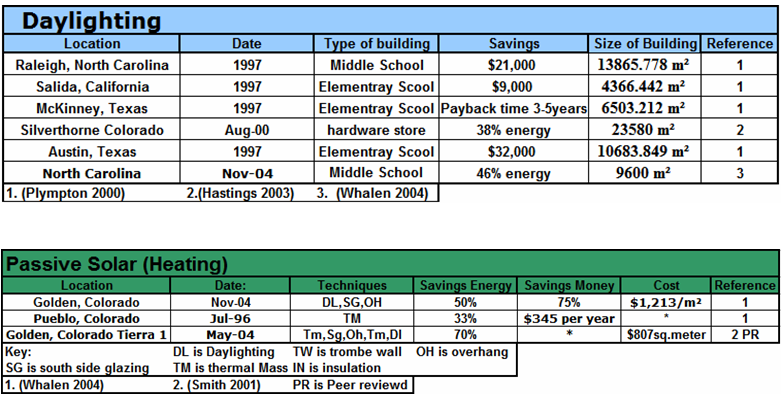
Table 1.(blue) Energy Savings from daylighting -
Table 2.(green) Energy Savings for Passive Solar Energy
Click to Enlarge.
Economics:
New Buildings: Some studies have shown that the prices for building a passive solar home are the same or less than other custom homes. Other studies say passive solar homes have an average of 3-5% added cost. Over time these added costs will pay for themselves in energy savings (Pimentel 1994.) After 16 years, the Tierra I house built in Colorado saved $2000 for every extra dollar spent to make the house passive solar. (Smith 2001.) While this example highlights a potentially high energy return from passive solar, it also shows that there is an upper limit to its scalability. One cannot use ones house as a vector to create Gigajoules of extra electricity, but only the heat, and perhaps some extra, that the occupants of the house require. But if used on all new houses, the overall scale could be quite large in replacing other fuels.
Adding on to preexisting structures: Installing a passive solar system into the design of a new home is generally cheaper then fitting it on to an existing home. Saving can still be accomplished but prices are generally higher and savings are lower. The easiest method to attach on to an existing home is a conservatory which is also the least efficient method of passive solar heating (Pimentel 2001.)
Environmental Impacts:
Positives: The design and energy efficient construction for passive solar homes decreases cooling loads and reduces electricity consumption which leads to significant decline in the use of fossil fuels. For example, in Colorado 94% of electricity consumed is produced by coal fired generation power plants. Estimates show that at 4218 kg of CO2, 14.5 kg of SO2, and 13.6 kg of NO2 can be avoided in a single Colorado home with passive solar technology (Whalen 2001).
Negatives: In order to utilize the sun to its fullest potential, a passive solar home must be free of any obstacles that block sunlight, such as other houses or tree. Passive solar homes work best in lightly populated areas making them more land intensive. Thus a series o f solar homes all facing south would presumably take up more land area then if they were oriented randomly.
Social Implications:
Daylighting:
Most of the modern workforce is based indoors with artificial light. In most cases workers feel uncomfortable leading to a rising trend or complaint amongst works in the idea of sick building syndrome, making people uncomfortable in their workplace and hence less productive. Passive solar buildings can provide a healthy and therefore more productive building. (Currie 2002).
In conclusion, it is obvious that designing buildings from the start to take advantage of natural heating and lighting, and to use more insulation and solar mass, have a tremendous possibility to reduce energy demand in the future. The “Green buildings” program is a very active and interesting field. But it should be realized that each new building, no matter how green, increases the energy that we use to make and in buildings, except in the sense that as the housing stock turns over we have an opportunity to replace it with less energy intensive buildings. Probably all possible decreases in the energy intensity of buildings are more than made up by increases in square footage per person (Jevons Paradox). Probably population growth and the broad economic patterns we have experienced in recent years of building and then overbuilding real estate has had far more impact on our energy use in buildings. These issues need to be on the “green building” agenda.
Annotated Bibliography:
Cleveland, Cutler J. Morris, Christopher. “Passive Solar Energy” Dictionary of Energy. Oxford: Elsevier, 2006. pg. 322- 323.
Currie, Robert, Bruce Elrick, Mariana Ioannidi, and Craig Nicolson Nicolson. "Passive Solar." Renewables in Scotland. May 2002. University of Strathclyde. .
Everet, Bob. Boyle Godfrey. “Solar Thermal Energy” Renewable Energy. The Open University: Oxford. Second Edition. 2004 pg 18-53.
Ferbabdez-Gonzalez, Alfredo. Analysis of the Thermal Perforamce and Comfort Conditions Produced by Five Different Passive Solar Heating Strategies in the United States Midwest. ASES Solar Conference, 2004, Solar Energy. .
Lyng, Jeff. 2007. Governors Energy Office, State of Colorado, Personal communication.
Hastings, Sara. Daylighting Analysis in the BigHorn Home Improvement Center. National Renewable Energy Labortoary. Golden, Colorado, 2003. pg. 1-22. .
Perlin, John and Cleveland, Cutler. “Solar Energy, History of.” Energy Encyclopedia, Oxford: Elsevier 2004. Vol. 5 pg. 607-622
Pimentel, David, G. Rodrigues, T. Wang, R. Abrams, K. Goldberg, H. Staecker, E. Ma, L. Brueckner, L. Trovato, C, Chow, U. Govindarajulu, and S. Boerke. "Renewable Energy: Economic and Environmental Issues." BioScience 44 (1994): pg. 536-547. .
Plympton, Patricia, Susan Conway, and Kyra Epstein. Day Lighting in Schools: Improving Student Performance and Health At a Price Schools Can Afford. American Solar Energy Societ Conference, 16 June 2000, National Renewable Energy Laboratory. .
Smith, Michael W. Analysis of the Thermal Performance of Tierra I -- a Low-Energy High-Mass Residence. National Renewable Energy Labortoary. Golden, Colorado, 2001. pg. 1-79..
Spanos, Ioannis, Martin Simons, and Kenneth L. Holmes. "Cost Savings by Application of Passive Solar Energy." Structural Suvey 23 (2005): pg. 111-130.
.
United States. Department of Energy (DOE). Passive Solar Design: Technology Fact Sheet. Dec. 2000. .
United States. Department of Energy (DOE). “Passive Solar Design for the Home”. Feb. 2001. 30 May 2007 .
Wayne, Gary, Hall, Charles, Behler, David. “Solar Energy.” Chapter 12 in Hall, Cleveland and Kaufmann. Energy and Resource Quality: The Ecology of the Economic Process. John Wiley & Sons: 1986 pg 285-305.
Whalen, Peg. "Daylighting in Schools Reduces Costs, Improves Student Performance." Caddet. 24 Nov. 2004. National Renewable Energy Laboratory. .
APPENDIX G-2.
Photovoltaics
.
It was not our original intent to undertake an analysis of Photovoltaic (PV) Systems because we were to leave that analysis in the hands of a colleague more competent for that analysis. However that analysis has not been made available so we are presenting a brief summary of our own.
EROI
Explicit net energy analysis of photovoltaic (PV) energy appears to be nearly non-existent. However several studies report the time required for “energy pay back,” and if we know the lifetime of the module or system, an EROI of sorts can be calculated. A typical life-cycle analysis is from Battisti and Carrado (2005) for a reference system (of) a multi-crystalline silicon (mc-Si) PV system, grid connected and retrofitted on a tilted roof in Rome. The assumed efficiency of the cells is 10.7 percent and the materials required are 12.6 kg/m2, with a mean output of 0.106 kW/ m2. No storage device was included. For this they estimate the energy costs associated with producing silicon in the form required as well as the structural aluminum, steel, glass and so on required, including the energy required to transport, install and eventually landfill the materials. Their results are typical: “All the analyzed configurations are characterized by environmental pay back times one order of magnitude lower than their expected life time (3–4 years vs. 15–30 years).” From this I calculate an EROI of 3.75:1 to 10:1, which is similar to other estimates I have heard, although I have also heard estimates that vary from 1:1 to perhaps 20:1, with much higher ratios “projected.” The following table lists a similarly calculated EROI based on life-cycle analyses for a range of systems, from commercially available to theoretical:
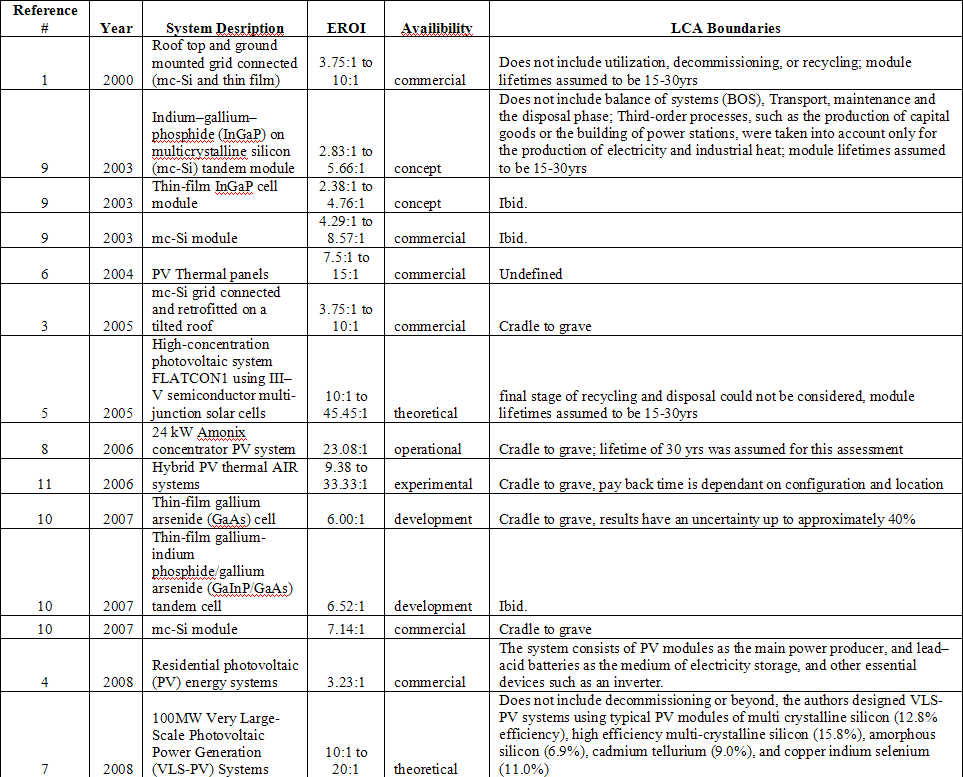
PhotoVoltaic EROI Table
Click to Enlarge.
However, these values are not static. As research and development continues, it is likely that the EROI for some of the systems mentioned above will change. Another factor affecting EROI trends is material flow into the industry. PV production employs the use of many metals attractive to a number of high-tech industries. For example, some 76 percent of the energy required to generate the silicon module is that which is required to make the raw silicon. These and other authors indicate that at this time the principle source of silicon for the photovoltaic industry is scraps from the computer chip industry. If the industry is to expand greatly other dedicated sources of silicon must be generated, with presently unknown effects on the energy cost.
Finally, there is the affect of intermittent energy from the sun and also energy storage issues. As sunlight is not constant 2 sites might be necessary to keep a constant flow of electricity to society in one area. This is thought to lower EROI by at least as much as ½. The energy cost of electrical storage in the form of a battery is also an issue which would lower the expected EROI of a PV system. At present lead-acid batteries are typically used for photovoltaic systems, but other storage systems include pumped storage (i.e. pumping water up hill for later generation of electricity), compressed air and flywheels. Many of these systems are quite promising, but would require considerable development.
The Future
Given that presently despite the enormous growth of PV energy the annual increment of oil, gas or coal is usually greater than the total of all photovoltaic production of energy, the increase in capacity needed for photovoltaic energy to make a large difference is enormous. A particular concern is whether there would be material shortages with a very large and rapid growth. For example, gallium arsenide is currently more or less the material of choice for a doping material to apply to silicon. Curiously, or not so curiously, this material has the same absorbance spectra as chlorophyll. A glance at the periodic table shows this element to be under aluminum, and the principal source is aluminum mining and purification. But if the industry were to increase by a factor of ten other sources would have to be utilized, and, presumably, its cost would increase dramatically. Likewise if we were to attempt to replace liquid fuels with electricity an enormously greater amount of copper would be needed. The price of copper is already escalating sharply under pressure from the construction industry of China and it is not clear what a greatly increased demand might do. Similar issues would apply to the many other elements that might be needed to obtain higher efficiencies in the industry.
Currently, Cadmium-telluride (CdTe) and Copper-indium-gallium-diselenide (CIGS) PV modules are thought to have the highest potential for low cost electricity. However, beyond the year 2020, each is expected to suffer material restraints (Andersson 2001). Indium and Tellurium are recovered as byproducts of copper and zinc respectively, of which we may run out of this century. Ultimately, PV production may be constrained by available stock of materials and/or by the rate at which materials are recovered; and possibly by competition for metals for other end uses.
References
[1] Alsema, E.A. Energy Pay-back Time and CO2 Emissions of PV Systems. Prog. Photovolt. Res. Appl. 8, 17-25 (2000).
[2] Andersson, B.A. Material Constraints on Technology Evolution: The Case of Scarce Metals and Emerging Energy Technologies. Thesis for the Degree of Doctor of Philosophy. Department of Physical Resource Theory Chalmers University of Technology and Göteborg University, Göteborg, Sweden 2001.
[3] Battisti, R. and A. Corrado. 2005. Evaluation of technical improvements of photovoltaic systems through life cycle assessment methodology. Energy 30: 952–967.
[4] Celik, A.N., T. Muneer, and P. Clarke. Optimal Sizing and Life Cycle Assessment of Residential Photovoltaic Energy Systems with Battery Storage. Prog. Photovolt: Res. Appl. 2008; 16:69–85.
[5] Gerhard, P. and F. Dimroth. Energy Payback Time of the High-concentration PV System FLATCON Prog. Photovolt: Res. Appl. 2005; 13:627–634.
[6] Helden, W.G.J. van, R.J.C. van Zolingen and H.A. Zondag. PV Thermal Systems: PV Panels Supplying Renewable Electricity and Heat. Prog. Photovolt: Res. Appl. 2004; 12:415–426 (DOI: 10.1002/pip.559).
[7] Ito, M., K. Kato, K. Komoto, T. Kichimi and K. Kurokawa. A Comparative Study on Cost and Life-cycle Analysis for100MW Very Large-scale PV (VLS-PV) Systems in Deserts Using m-Si, a-Si, CdTe, and CIS Modules. Prog. Photovolt: Res. Appl. 2008; 16:17–30.
[8] Kim, H.C. and V.M. Fthenakis. Life Cycle Energy Demand and Greenhouse Gas Emissions From an AMONIX High Concentrator Photovoltaic System. National PV EH&S Research Center Brookhaven National Laboratory Upton, NY 11973. 1-4244-0016-3/06/$20.00 ©2006 IEEE.
[9] Meijer, A., M.A.J. Huijbregts, J.J. Schermer, L. Reijnders. Life-cycle assessment of photovoltaic modules: comparison of mc-Si, InGaP and InGaP/mc-Si solar modules. Prog Photovolt: Res Appl 2003;(11):275–87.
[10] Mohr, N. J., J.J. Schermer, M.A.J. Huijbregts, A. Meijer and L. Reijnders. Life Cycle Assessment of Thinfilm GaAs and GaInP/GaAs Solar Modules. Prog. Photovolt: Res. Appl. 2007; 15:163–179.
[11] Tripanagnostopoulos, Y., M. Souliotis, R. Battisti and A. Corrado. Performance, Cost and Life-cycle Assessment Study of Hybrid PVT/AIR Solar Systems. Prog. Photovolt: Res. Appl. 2006; 14:65–76.
APPENDIX G-3
WIND
Recently an excellent meta-analysis on the Energy from Wind: A Discussion of the EROI Research was completed by Ida Kubisewski and Cutler Cleveland. The details can be reviewed in theoildrum.com's link above. Here is the salient table showing the EROIs of various studies and conditions:

EROI From Wind - Meta-analysis
Click to Enlarge.
The average EROI for all studies (operational and conceptual) is 24.6 (n=109; std. dev=22.3). The average EROI for just the operational studies is 18.1 (n=158; std. dev=13.7).
CONCLUSION
We find in solar (industrial) energy a very large potential but a rather small application (so far). The greatest use is traditional biomass (perhaps about 5 percent in the US) and hydropower. In general high EROI sites in the United States were developed by the middle of the last century and a further expansion is probably limited by environmental considerations. (Globally the potential is much more). In the United States existing wind power seems to have a rather good EROI (18:1) although that is likely to be decreased substantially if issues related to storage are factored in. Present generation photovoltaics have a moderate EROI (around 8:1 but with great variability and uncertainty). Both wind and photovoltaic systems appear to have a large potential for improving their EROI. The greatest potential, however, is for passive solar, although this issue seems not to have been analyzed very often using EROI explicitly. There are many reasons to favor a solar future and it is probably quite possible to get there, but we need a much more comprehensive analysis of the issues of availability and storage if applied on a very large scale.
The Energy Return of (Industrial) Solar - Passive Solar, PV, Wind and Hydro (#5 of 6)
PDF version
199 comments
The Energy Return of (Industrial) Solar - Passive Solar, PV, Wind and Hydro (#5 of 6)
PDF version
199 comments
Contact
- theoildrumeroi at gmail dot com
Personnel
Archives
- October 2010 (1)
- September 2010 (1)
- August 2010 (1)
- July 2010 (1)
- June 2010 (1)
- April 2010 (1)
- March 2010 (2)
- January 2010 (1)
- July 2009 (1)
- June 2009 (1)
- May 2009 (2)
- April 2009 (1)
- March 2009 (1)
- February 2009 (1)
- January 2009 (2)
- December 2008 (1)
- November 2008 (1)
License

This work is licensed under a Creative Commons Attribution-Share Alike 3.0 United States License.
Prof,
Excellent series of posts.
I think that you have decisively debunked one of the main tenets of the dieoff religion.
That is: every other alternative to oil is negative or too low EROEI.
It seems that we have plenty of options as long as we actually build them.
Please correct me if I'm wrong but it seems that our best approach should be to build proportionately in this order based on EROEI:
Hydro
Wind
Nuclear
Solar Thermal
Photovoltaic
In any event, great work.
Applause.
A very good overview for renewables/alternatives and their related challenges. I would like to add a few bits that appear to have been overlooked. Certainly not the fault of the researcher as it is a very broad subject area:
1. Solar generation here is primarily broken down into passive solar (solar architecture) and photovoltaic. When taken in total, it's actually a small picture of all of solar energy. On the one hand, solar architecture could be considered an added efficiency as it generates no net energy in itself but reduces or eliminates the need for outside heating and cooling inputs.
a. Solar photovoltaic itself can be broken down into numerous segments.
1a. Traditional photovoltaic energy using silicon.
2a. Thin film photovoltaic energy using silicon.
3a. Thin film photovoltaic using other common materials.
4a. Thin film photovoltaic using nanotechnology materials.
GALLIUM NOT USED IN SILICON CELLS
It's important to note that gallium is NOT USED in silicon solar generation. Gallium is only used as part of second generation thin film photovoltaic technology. So far, only silicon production has proven to be a limiting factor in photovoltaic production. As there has now been a massive overbuild in silicon production to support the solar industry, this is not likely to be a problem for at least the next few years.
DIVERSE MATERIALS BASE
Cadmium, telluride, and carbon nanotubes are all substances that have been used for solar energy generation. In the realm of photovoltaics alone, the materials base is quite diverse and options are continuing to expand.
2. CONCENTRATED SOLAR POWER (CSP) is not addressed in the above article. CSP is a form of electricity generation that uses mirrors and lenses to reflect and concentrate solar radiation onto boilers, towers, or specially designed heat engines that collect the energy and, through mechanical process, turn it into electricity. Though not as large a production base as photovoltaics and primarily useful only in very sunny parts of the world, very large CSP power plants have been build and are under construction in areas like Arizona, California, and Spain.
MATERIALS FOR CONCENTRATED SOLAR POWER are common and do not require exotic inputs.
3. STORAGE FOR SOLAR POWER ALSO INCLUDES MOLTEN SALT and non-lead acid battery storage. An ongoing revolution in battery technology is providing a number of high capacity, high cycle, batteries for energy storage and for the automobile industry. Ferrus Iron batteries made by BYD systems for cell phones can cycle more than 3,000 times and offer a much higher charge density than lead acid batteries. Lithium Ion batteries with carbon nanotube storage are also being designed for the Chevy Volt and are now in use in Prius after market plug in electric upgrades. These batteries, designed by A123 systems, can cycle over 8,000 times and have an even higher charge density than BYD's offering.
RAPIDLY GROWING, BUT SMALL, PRODUCTION CAPACITY FOR SOLAR ENERGY.
The current 'nameplate' production capacity for the world's solar industry is about 13 Gigawatts -- including CSP but not including efficiency designs like solar architecture. If the entire 2008 market were to be utilized on a year on year basis, it would take 1000 years to build enough generation capacity to power the entire planet. That said, 2009 production capacity is expected to reach 18 Gigawatts, and 2010 capacity is expected to hit 24 Gigawatts. This approximate doubling every few years will have a massive effect come around 2015-2020 where new solar energy builds could represent 2-3 percent of world capacity EACH YEAR if the current rate of expansion is maintained.
CURRENT SOLAR ENERGY GENERATION CAPACITY IN THE UNITED STATES IS 3.8 GW. This represents enough energy to power 2.4 million households or about 2% total electricity demand. Figures on solar energy production have lagged while the industry has surged. Average growth rate in the US alone is 48% year on year since 2002. At the current rate of growth, solar energy will represent 10%+ of total US energy use within ten years.
CHALLENGES
Materials supply chains need to be built and expanded to support solar infrastructure. New materials will be needed to increase grid capacity as loading increases from new solar systems. New energy regimes will have to be established as states begin to share or build capacity across borders. For example, Virginia is currently building wind generation capacity out of state for in state use. They are paying to have the electricity transported via grid but this is still less expensive and politically troubling than building a massive number of new coal plants. I think, in the future, power sharing arrangements will also be made with sunny states and states that lack solar generation resources. Solar energy generated in Spain, for example, could help keep the lights on in other parts of Europe. As transportation moves increasingly to grid support, you will have to have a considerable overbuild in multiple generating areas -- solar, wind, nuclear + other. Storage will add some costs but result in net energy costs much lower than those for current transportation systems. In the end we could have a much better and more democratic energy system than the one we started with. But getting to that point is going to take a lot of ingenuity, resolve, and creativity. Greed will not get us there and we may well have to allocate FF resources to build the new infrastructure while rationing its use by consumers. In an orderly society this is certainly possible. But in the absence of salient leadership, things can break down very fast.
My additions on solar are not meant to divert from wind, nuclear or other energy sources. It just seems I had more to add in this area.
http://www.nextenergynews.com/news1/next-energy-news12.28d.html
http://en.wikipedia.org/wiki/Solar_cell
http://www1.eere.energy.gov/solar/csp.html
http://www.sciam.com/article.cfm?id=solar-power-lightens-up-with-thin-fi...
http://www.wired.com/science/planetearth/news/2005/11/69528
http://www.salon.com/news/feature/2008/04/14/solar_electric_thermal/
http://solar-in-china.blogspot.com/2007/12/qiangsheng-to-invest-400-mill...
thank you - CSP definitely has to be added to the mix.
CSP - Look at http://www.redrok.com Dwayne Johnson.
Good comment.
I'm surprised CSP / solar thermal power isn't covered, given that is likely the single largest form of power generation we will have 100 years from now.
And like you say, it doesn't require any exotic materials.
http://anz.theoildrum.com/node/3791
I don't think that the installed solar generation capacity for the US (3.8 GW) is correct and I can't find a reference in the links. For PV alone, I think that we may be approaching a GW installed about now: http://www.seia.org/Year_in_Review_2007.pdf
There are about 4 GWe of CSP in the pipeline for the US, but I don't think that we've quite broken half a GW of capacity so far. I would guess that we have 1.2-1.4 GW nameplate capacity today and we'll likely get to 3.8 GW nameplate late in 2010.
Chris
SWING and a miss.
Hydro. It's great. Honestly, it's the cleanest highest return cheapest power we use. But basically it's not possible to significantly expand it, all the good sites are already in use. That means that the sites that are still available for development are the poorer sites with the lower EROEIs. Look for no help there.
Wind. It is also good, it is however the definitive way to crash your grid. Over installation beyond 10-15% of total usage in wind and you have to keep spinning reserve which must be factored into the cost and eats into that pretty EROEI. Spinning reserve BTW, is a power plant that is *currently burning fuel* and producing no power. Still develop it for all it's worth, just remember that its worth is limited.
Nuclear. All for it, build it, love it, use it.
Solar thermal. Great where it works. Don't expect it to take a major portion of energy anytime in your lifetime. It involves major realignments of physical infrastructure, and that just isn't going to happen in a shrinking economy. It's *really* hard to turn a building 90 degrees to face the sun :P.
PV. The EROEI stated above fails to account for the grid synchronous inverter. That is both the most expensive and least reliable portion of a PV system, and it drops the EROEI down to around 2:1. Look for no help here at this scale until CIGS PV hits the market.
Lot of broad strokes there, Ford. Sounds like they call for some links to back them up.
Solar Thermal.. You don't have to aim the house, you can aim Evac Tubes lying flush to the roof of the house, or any of a few dozen other ways to grab that heat. Tracking mirrors, etc. Great where it works, being what? Where the sun is shining? There's a laundromat a block from here on the Maine Coast that heats its water with Solar Evac Tubes. The Strip from here to the equator surely has an abundance of potential sites.
Need some stats on your Grid-sync Inverter claim, too. Which brands/models are falling apart? How do they kill the EROEI? Calcs, please.
Wind argument. 'Grid Crasher?' When, from that one German event two yrs ago? Didn't a boat hit some transmission lines, after all was said and done?
A lot of blanks to fill in.
Bob
There was a period recently where more than 40% of Spanish generation was coming from wind.
The idea that you need to limit it to 15% is laughable.
The main issue is making sure you have good enough data to be able to monitor shifts in wind intensity so that you can dispatch alternate forms of generation when the wind power jumps or falls - and if you build enough storage you don't even need to do this...
You'll need a cite on that. Note that the 15-20% as stated was intended as a total of generated electricity, not nameplate capacity. so *if* you got lucky and on a specified day produced 40% of your energy with wind, it would still not necessarily have met the conditions for 15% penetration. Wind installations have a typical capacity factor of 25% so to get 15% total energy, you'd have to install 60% of your nameplate capacity.
In addition to that, europe has an overarching grid, in which the fraction that is wind is *far* below the 15% threshold. to point at germany or spain is comparable to stating that nebraska generates X% and neglecting the cross-border flux.
You're wrong about "the main thing" too, the data is important, yes, however you need to *have* the backup generation capacity and the grid capacity to carry the overage/underage from production to load. To fail to factor for that is to lie about the realities. It's true that below certain thresholds, you have no need to factor for those, but that's where the 15% comes in (which is still more than 10 times current world installed base, so there's obviously no need to put the brakes on anytime soon).
Well, here The Age mentions a 27% period for a week, though,
And here we see that on April 18th this year they managed 32%.
You speak of getting "lucky" and having days where the generation fraction is high, but it's not luck. It's about putting the turbines in the right place and having accurate weather forecasts. It's like saying that being a good commercial fisherman is "luck" - it's not, it's knowledge and experience and judgment combined with some forecasting.
Once again, overall penetration is 9 percent, which means that spain is still far below the 15-20% threshold. It also means that on the "jackpot" hours, wind should provide something in the neighborhood of 36% of spot energy. That is in fact *exactly* my point.
If you were to install 20% then on a jackpot day you'd be generating 80% and would need to either shed load or idle some older baseload plants that are unlikely to respond well to being power cycled. In addition, the German windfarms have effectively proven that you would still need to have schedulable plants and fuel reserves capable of meeting the full demand assuming that you are getting exactly 0 from your windmills. Those days will happen too, statistically, for every second that ALL your windmills are generating at full, you will have a second where none of your windmills are doing anything. Taking the jackpot moments as cases of the strength of wind power is to neglect the bust moments, and those are just as critical.
Your insistence that it's all information is simply wrong, it's information and infrastructure, and as total wind penetration grows, the infrastructure needs grow with it. Now, an HVDC line running from northern Norway to southern Spain via Germany *might* allow penetration all along that corridor in excess of the 15-20%, due to the geographic diversity, but simply taking spain in isolation and neglecting the subsidy from french nuclear is seriously biased math.
It's also worth noting that the equivalency is 1000, 4 mw wind turbines for each 1 gwe nuclear plant. Since I have never seen a windfarm containing more than 10, 4 MW turbines, that means that you will need 100 mountaintop style sites (or an offshore rectangle 8 miles on a side at 1/4 mile separation) to replace the energy produced by the Nplant.
Great where it works being obviously southward facing homes that require heating *but have good sun* a significant fraction of the year. So basically it's useless in for example upstate NY where I live due to poor sunlight in the winter. As for the evac tubes, panels, etcetera, (not addressed in the original post) I ran the math on it, and discovered that in order to provide heat for a modest sized house (looking for 30,000 btus/hr) would require (30,000 btu = 8.8 kw = 8.8m^2 * 2 (winter sun is weaker than full summer) * 2 (inefficiency)*4 (8 hour day)) 140M^2 of collection paneling. That's larger than the typical modest house. In addition to that, it says nothing at all about the storage of that heat for the overnight.
I never said that the inverters were "falling apart" I said that they were the most maintenance intensive portion of the system, which they are. As for how they kill the eroei, well, off the cuff, they lose 5% of the energy that hits them, after that, the energy involved in manufacturing them and delivering them MUST be taken into account when calculating the eroei of the system. To fail to do so and just account for the energy in the panels themselves is simply to lie.
Look, when I am looking at eroei, I find it simplest to simply look at the finances. Anything with a 25 year amortization does *not* have a 10:1 eroei, to claim that it does means that the accounting of the energy inputs has been done incorrectly. Taking the meter turnings at the factory that produces the panels will always produce high eroei numbers. Mining the copper to make the inverter takes energy, as does the labor of the chinese guy who winds the inverter. frankly, there is no sink of money that isn't energy based, so the simplest and most accurate way to calculate eroei for anything wil be to look at the economics.
(30,000 btu = 8.8 kw = 8.8m^2 * 2 (winter sun is weaker than full summer) * 2 (inefficiency)*4 (8 hour day)) 140M^2 of collection paneling.
These numbers appear to be pulled out of a hat. You need to provide engineering substance to your above claim. Bald assertion does not do so.
Note most passive solar homes are very energy efficient, so comparisons to ordinary non-efficient homes is a case of apples and oranges, unless you are limiting your discussion to passive solar retrofitting of an existing home, where increased energy efficiency (insulation, airtightness) is normally implemented anyway.
I said that they were the most maintenance intensive portion of the system, which they are.
How much maintenance are you claiming they need? Mine has needed zero in the last 8 years. Of course, since PV panels really require no maintenance (mine have needed none in the last 8 years), your statement doesn't amount to much anyway. Please supply current data to support whatever claim you make.
In contrast to the vast supporting documentation you have posted? Seriously, I just browsed your last 50 posts and failed to find anything of substance in any of them. Even your own experiences with your PV system are biased anecdotal unscientific worthless tripe.
As for the numbers I was using in the 30kbtu example, they were highly optimistic numbers from one end to the other. look it up yourself.
As for the solar design necessitating the more energy efficient home design, I call BS on that, you are comparing apples to grapes if you compare the heating requirements on a brand new high efficiency home to that of the average US or European home. Simply put, that's cheating.
Just as an example of exactly HOW generous I was being with my numbers in my 30kbtu example, in upstate NY, december insolation is only *2* kwh/m^2/day.
http://rredc.nrel.gov/solar/old_data/nsrdb/redbook/atlas/serve.cgi
In my example, I gave it 4. you will also find that no passive solar collection panels or evac tubes on the market can come even close to the 50% efficiency that I allowed. If you're going to demand specific math, it's going to get *very* bad for your case very fast.
This all pertains to existing houses, new houses can easily enough improve in many ways. However, that's what I meant by "not in your lifetime" the average age of a residence in the US is something in the neighborhood of 25 years so if we were to start now mandatig that *every* new home were to be high efficiency, it would take 25 years to replace half the homes currently in use with the newer designs. That is entirely too slow to constitute a noticeable impact.
I also looked up MTBF for grid tied inverters, and I found that most manufacturers have 10 year design life as a "goal". this means that you can expect to be replacing the single most expensive single component of your "low maintenance" system every 10 years on average (I am making the assumption here that the panels themselves are modular and can be swapped out individually.)
The importance of energy efficiency is reflected in the amounts of energy that are available. For example, in Germany, with even less solar energy than your upstate New York location, PassiveHaus designs are able to utilize solar energy for
Indeed, PassivHaus homes cannot use more than 4746 btu/ft² per year in non-renewable heating energy.
From http://www.cepheus.de/eng/index.html;
"Cost-optimized solar thermal systems can meet about 40–60% of the entire low-temperature heat demand of a Passive House. The low remaining energy demand moreover makes something possible which would otherwise be unaffordable, and for which available supply would not suffice:
Over the annual balance, the remaining energy consumption (for space heating, domestic hot water and household electricity) is offset completely by renewable sources, making the Passive House fully primary-energy and climate neutral. This is being achieved in the CEPHEUS housing development in Hannover-Kronsberg"
Homes meeting the PassiveHouse requirements have been built in the US, such as this one near Chicago;
http://www.e-colab.org/ecolab/SmithHouse.html
So solar energy can be used for home heating needs when attention is paid to energy efficiency.
Once again, if it involves changing out the actual home, then you can look for no help here in your lifetime. I never said that you couldn't build a home capable of being heated by passive solar, I said that if you wait for passive solar to make significant inroads into the energy picture, you're going to be waiting a LONG time. It's great for individuals building single new homes on large lots, basically useless for anything else, and will have no impact on fossil fuel demand for decades at a minimum.
It's great for individuals building single new homes on large lots, basically useless for anything else
Wrong yet again;
and will have no impact on fossil fuel demand for decades at a minimum.
Unsupported assertion.
Nice developments. Makes no difference to the point though. I have explained time and again that the average age of a dwelling in the industrialized world is 25 years, and that therefore if ALL new homes were built to this standard, then half the homes would have been replaced in 25 years, Since residential heating represents 10% roughly of fossil fuel consumption that would give us an overall improvement of 0.2% per year IF we instituted a crash project to institute Passive solar construction. This is assuming that there is exactly zero growth in population AND that each home uses zero fossil fuels. neither of which is the case.
So like I said, totally useless. Being pigheaded about it serves you poorly.
There's no one following this but us now, so you can drop the posturing and derogatory language, which only weakens your argument anyway.
You made some overly narrow assumptions in your math.
First, don't assume that solar technology will be implemented in a vacuum; other aspects of home energy use is also dropping, like high efficiency refrigerators, CFL, lower energy computers, etc., etc, as shown in the PassivHaus examples above. So the 0.2% becomes at least 0.3%
Secondly, as building energy consumes 1/3 of US energy consumption, commercial and industrial building also can take advantage of passive and active solar. And they tend to renovate much more often than every 25 years. So instead of 10%, we are looking at 33% and the the 0.3% becomes 1%.
http://www.eere.energy.gov/buildings/database/mtxview.cfm?CFID=22259466&...
A yearly 1% reduction in energy use provides positive impacts right from the start. Add in energy efficiency improvements to the other domains, such as transportation and industrial processes, and quite a bit of progress can be made.
Well, you're still here, and the conversation has finally come around to a 2 sided discussion of math, so we're finally at the point when you deserve better treatment than insults (you have to admit that your "long on opinion and short on substance and accuracy" is a statement deserving of the contempt I gave it, particularly since I was right in every aspect of the post). So okay, lets go from there.
The other efficiency improvements you mentioned fall outside of this discussion really, CFLs are quite unrelated to passive solar construction. In fact, these things go to prove my point, CFLs and efficient windows are being installed as fast as sylvania anderson can make them, despite which, residential energy demand is still increasing.
As for passive solar and efficiency tweaks on commercial/industrial structures, I think you can look for very minimal improvements there, industry is usually pretty well on top of the efficiency curve, for example, it's a long time since I have seen an incandescent bulb in a commercial or industrial building, they've pretty much been fluorescent for the last 30 years. Also, industrial applications are far less able to be successfully met with passive solar. Sure, you may be able to heat the building with passive solar, but you won't be able to provide process steam or run machinery on it, so at best you're looking at maybe 1/4 of the energy that enters an industrial/commercial site being able to be met with passive solar (yes, I did just pull that 1/4 out of my butt, feel free to find a citation if you dislike that number).
Now, as regards the total fraction of energy that we're working with,
https://eed.llnl.gov/flow/pdf/USEnFlow02-quads.pdf
Shows that only very small amounts of oil go to either residential or commercial applications. In the residential applications we are therefore primarily looking at savings of natural gas and coal electric. That makes this really not about peak oil at all, but more about climate change and carbon reduction. Just wanted to have that said.
Now, is passive solar useful for cooling? No, not really, about the best it can do in most climates is a reduction in A/C energy. In most climates that require heating can it totally replace heating energy? Not really, they can significantly reduce it, yes, but never eliminate. Can you cook with passive solar? no, not really, you still need natural gas or grid electric for that. Can they eliminate the need for lighting? no, not really, at best they reduce the need to nights and cloudy days. so once again, I was being very generous in my 0.2% assessment. Really, if we were to figure that a good passive house uses half the outside energy compared to a traditional house, we'd be pretty close, hyperbole notwithstanding.
passive solar isn't junk, it's great where it works, and I see no reason not to encourage deployment of it to all degrees possible, but it isn't going to make a difference to peak oil or climate change on anything except the very long term, it's just another too little too late type measure.
As for "active solar" (PV) the emergy doesn't work, it's still a loser. This is reflected in the financial math. There's just no real point in installing them yet. An honest and full accounting of all the energy that is involved in gettin gthem in operation on your house will show that they are an energy sink, not a source.
TBH, it's fair to compare passive solar to hybrid cars, yes, they are a good technology, and there's no reason not to pursue them, but the problem is several orders of magnitude too large for them to have enough of an impact. You're trying to put out a housefire with an eyedropper.
SWING and a miss
High on opinion and devoid of substance and accuracy.
So, after an abundance of comments swapped and bantered, your claim that my original comment lacked accuracy was the most inaccurate thing said to date. I was correct about the possibilties of passive solar (worthless as a retrofit and entirely too slow to have an effect using new construction), correct about wind (15-20% total energy production without starting to lose EROEI), correct about hydro (tapped), and correct about PV (inverter makes it a loser at this time). I'll accept your apology anytime you care deliver it.
I was correct about the possibilties of passive solar (worthless as a retrofit and entirely too slow to have an effect using new construction)
Still an unsupported assertion, see above.
correct about wind (15-20% total energy production without starting to lose EROEI)
Still an unsupported assertion. What you said, btw, was "Over installation beyond 10-15% of total usage in wind and you have to keep spinning reserve which must be factored into the cost and eats into that pretty EROEI."
You completely ignored existing (or future) hydro (or CAES) that can be used as storage, and you changed your percentages.
correct about hydro (tapped)
The US alone has 300 GW of additional hydro potential.
http://hydropower.id.doe.gov/resourceassessment/
correct about PV (inverter makes it a loser at this time).
You have yet to substantiate anything on this subject.
I'll accept your apology anytime you care deliver it.
I'm sorry you're having so much difficulty on this subject.
The EROEI value for solar PV should probably be taken at around 30: http://www.nrel.gov/pv/thin_film/docs/lce2006.pdf and it is not clear that we should count storage against EROEI until we surpass about 0.5 days of storage of total energy use since electrification of transportation provides this in any case: http://mdsolar.blogspot.com/2007/08/roof-pitch.html while improving the energy efficeincy of transportation.
20 to 30% penetration of the grid (individually) by wind and solar require no storage other than what is intrinsically available in the grid through hydro and gas. Thus, storage may take care of itself to a large extent and when it is needed, the improving EROEIs of solar and wind should more than compensate.
Passive solar is perhaps the most important things we need to be pushing for through building codes. New construction should be easy with new glass that achieves R-12: http://www.buildinggreen.com/auth/article.cfm/2008/2/3/Revolutionary-Vac... and retrofitting should also benefit greatly. We still need better solutions for retrofitting for insulation for walls and roofs though.
Chris
Thanks Chris,
Just as Hirsch pointed out that the average vehicle fleet would need on the order of 17 years to turn over to some type of electric or renewable powered vehicle, has there been an analysis on the timing/scale and impact of passive solar on the economy in aggregate? E.g. new homes could be mandatorily built with passive solar plans at large energy gains (in the future), but wouldn't that be a very small % of the total homes in the country? Are there small changes that EVERYONE could make? Not something I know much about but clearly new homes should incorporate these ideas as best as possible -seems like a no-brainer.
Building codes have incorporated fire safety for a while now to pretty good effect, but it does take time for building code changes to convert the housing stock, and much longer than, say, CAFE standards take to affect the fuel efficeincy of transportation. Architecture 2030 aims to make new buildings carbon neutral by 2030: http://www.architecture2030.org/
but we also need ways to make existing building carbon neutral as well because of the slow response time.
Changing windows is something that a lot of people do but they are usually going from about R-1 to about R-2.85 to get to EnergyStar specs. Getting to R-12 will be huge I think. I think there are also opportunities for thermal mass in existing structures that may not take too much trouble or space. The difficulty is in the thickness of walls which limits the amount of insulation that can be added to existing buildings. I'm trying to work up a prototype now that can get much more insulation for a given thickness at low material cost. It is a little tricky though.
Chris
This year the world's population became a majority urban. The UN projects that over the next 20 years the number of urban dwellers will grow to 60% of world population or from 3 billion to 5 billion. Unless you believe Kunstler's prediction that cities will contract, the addition of ~ 2 billion dwellings will have an enormous impact on the energy demand of cities. Therefore, it is important in my view to put in place regulations to maximize the energy efficiency of urbanization.
While rail transit will be important, building codes and land planning will be also - re-incorporating passive solar techniques into real estate development by making them mandatory codes, is worthwhile. The problem with large scale passive solar design is that street patterns dictate the solar potential and orientation for neighborhood blocks. To address this, The National Renewable Energy Lab is currently developing software called SEAT(subdivision energy analysis tool) that models solar gain and PV potential at the neighborhood scale.
For individuals, there are a number of small things we can do to take advantage of the sun. Adding overhangs, shutters and landscaping to block summer sun and let in winter. Programmable thermostats, Air sealing. Adding insulation. Window replacement - if too expensive, taping in bubble wrap has been shown to double the R-value of windows. Ripping out carpets and leaving exposed concrete near south facing windows and placing heat absorbing/radiating furniture in these areas will help too.
Just to bring you into the real world, why don't you Google "shanty towns".
You will instantly understand where the increase in city populations is taking place.
For starters look at Rio, Mexico City, Sao Paulo, Kenya and India. That is the future.
Do a Google Earth.
Does anyone think that there will be any solar panels on those shanty roofs.
You think only of your cosy little neck of the woods, do you suspect we have a world-wide problem?
Singapore is getting a 1.5 GW solar panel fabrication plant to serve India and other nearby countries. I would not be at all suprised if their panels ended up in places where electric service is too difficult to provide such as slums or remote villages. About 4 years ago, the second-hand/broken/seconds market for solar cells in the US dried up as NGOs began teaching people abroad how to rig up their own panel and battery setups. Now you pretty much have to buy new in the US but more and more children in the third world are able to read a little at night. As the US falls further and further behind in manufacturing I'm not sure how much of the seconds will still go in this direction as a fraction of total production, but NGOs, micro-credit and solar are moving together now in an important way.
Chris
Is that supposed to allay my concern? "1.5GW for India and nearby countries". Will they be grid connected?
Is that in addition to what they already use or set to ramp up their industrial might and power their fertiliser factories and motor vehicles.
Maybe a light powered by a solar panel will be all they need to live long and prosperous.
As usual you won't die not hoping.
You seemed to be worried that there would not be enough to go around and so solar would only be used where incomes are high. This is not the case. There is not enough to go around, but it is still getting to the very poor. 1.5 GW of manufacturing allows for 0.5% annual growth in India's electricity consumption without the need for other generation, an interesting figure for just one factory. What appears to be needed for long life and prosperity to educating women through high school. Having a bit of light at night sure helps with that.
Chris
Having traveled quite a bit in Brazil and India (my father in law is from Mangalore) trust me, I am sympathetic to the cynicism. No doubt, urbanization could be a great opportunity or a great tragedy. There is some signs of hope however. India is reducing poverty, albeit slowly. And while their government is still battling corruption, they have recently passed a national urban renewal law that allocates billions of dollars to urban infrastructure and policy reforms. There is an intense focus on sustainability and efficiency with these projects. About a dozen cities have changed building codes for mandatory rainwater harvesting for example. The implementation plan is also netting private international investors. For example, this week Deutsche Bank announced it will be investing $1 Billion in Indian infrastructure.
I have personally walked around in a Rio favela - a truly eye opening experience. Again, we have seen unprecedented progress in the effectiveness of Brazil's government in getting some positive things done quickly. Their elimination of foreign oil dependency is one example. I think if they can accomplish that, there's hope that they can improve the housing/infrastructure situation going forward as well.
Here's a link to a description of how we reduced the electrical usage in our home from 56 kWh/day to 9kWh/day largely via retrofitting passive solar: http://ncuc.commerce.state.nc.us/cgi-bin/webview/senddoc.pgm?dispfmt=&it...
It's not actually that hard (highly dependent on site specifics, of course) and as you say, absolutely a no-brainer. But so few do this sort of thing...
That is a beautiful letter.
Chris
Thanks, Chris.
"the average vehicle fleet would need on the order of 17 years to turn over "
That's misleading. 50% of vehicle miles are driven by vehicles less than 6 years old. That % could be expected to increase if new vehicles were significantly better than old ones, which hasn't been the case for many decades.
When you build a nuclear or hydro power plant you can dismantle a coal plant and assign the land and people to other jobs.
When you build windmills and solar cells you can burn less coal, but the plant remains. The cost, energy and emissions associated with backup power should be included in the analysis of wind and solar.
This does not seem to be the case. Adding nuclear plants in France kept the level of coal generation constant though oil was displaced. This is because nuclear power is more expensive than coal. Nuclear can't even be built without extreme subsidies. Wind is getting to be competitive with coal and solar will be less expensive than coal around 2017 so they have the economics to replace coal while nuclear does not. Generally the backup for wind and solar will be batteries so long as transportation is electrified so there would be no need to retain coal plants though initially fossil fuel use would be shifted towards gas and away from coal as wind and solar get to 15% or so penetration each. Thus, in the 15 years it takes to bring a nuclear power plant on line, wind will have displaced much more coal burning and will have covered for nuclear plants that have to be retired as well.
Chris
mdsolar:
Your assertion that nuclear didn't displace coal is only valid if you contend that none of the 3.5 times increase in electricity demand from 1971-2005 would have been provided by coal in the absense of nuclear power. Given France's lack of indigenous sources of gas and oil this seems unlikely.
mdsolar:
Hmmmm, France decides to go nuclear big time in 1973 and in fifteen years is producing more electricity via nuclear power than its entire grid was initially. Best avert your gaze from the chart, eh Chris, lest it dent your anti-nuclear fervour. I know, why not try to find a similar trend for a non-hydro renewable?
It is a very sad chart as we see contamination from waste beginning to affect the butter from Normandy: http://www.ens-newswire.com/ens/may2006/2006-05-29-02.asp
The chart shows how France will no longer be France as the champagne is also contaminated: http://www.commondreams.org/news2006/0530-03.htm
One feels sorry for the loss.
Chris
Could we please have ONE SINGLE DAMN THREAD without the pro-nukers pushing their little glowing cart?
It's an article about renewables and their EROI. Can we talk about that?
It would seem unlikely while those who advocate renewables believe that this must necessarily entail opposing nuclear (as in the comment by Chris above, where drinking the 'contaminated' champagne would result in a dose of radioactivity roughly equivalent to eating a banana).
It does solve France's nuclear waste problem though, just mix the waste with the wine and export it. No wonder they are so testy about the champagne brand. It is a secret weapon ;-). Still, there are alternatives and those concerned about their health may want to avoid French products. This is what is done with English mutton as a result of Chernobyl.
Chris
It looks to me that mdsolar was the first to raise the issue of nuclear vs renewables. Using the apparently false claim that "adding nuclear in France did not replace coal". Just one look at the graph above shows that's simply not the case.
I'd appreciate if you kept to the more civilized tone this discussion had, at least until now.
You sem to be unable to read either words or charts. I was responding to an erroneous statement about nuclear power. If you look at the chart, both hydro and coal remain flat. Why? Because they are cheaper than nuclear power.
Chris
I'm sorry but one of us seems to have vision problems and I think it is not me.
Both coal and oil (individually and combined) are on the rise from 1970 to 1980 and then go into decline, displaced by nuclear. The difference between their peak around 1976 and 2005 is more than three times. Hydro's contribution is flat.
But what you miss from the picture is the rising demand which has been overwhelmingly met by nuclear. If it was to be met by renewables, every newly build wind mill or solar panel would have to be backed up by additional conventional capacity, so both would have increased in lockstep, not even remained flat.
Of course the situation is different if you have large existing conventional capacity and small contribution by renewables, when they would make sense as fuel savers. The bottom line is they can not do what nuclear did - they can save some fuel and limit FF growth but not displace them or meet rising demand by themselves. And it makes perfect sense - the whole idea that renewables can completely replace something (fossil fuels) which they require (as a backup) is kind of a nonsense, isn't it?
I don't see renewables needing backup in that way and this seems to be a fundemental error in your thinking. Storage is part of renewable development and when the time comes, coal plants will be retired. With nuclear they won't be, as the chart shows.
Chris
Efficient and cost-effective large scale storage is still a pipe-dream. You counting on is counting the the chicken before they hatch. But I would submit that for the time being it is not such an issue and while penetration is low renewables deserve all the support they need (up to a certain point of course).
All the graph shows is the end numbers, it is not proving any type of casuality. Coal was obviously not retired completely because it was not deemed economical to do so. This is the most straightforward conclusion, not the one that it "can't" be done with nuclear. Within the grid they are performing the same functions, so there is no technical reason not to do it if they decide to.
Agreed that it makes sense to keep support for renewables for a bit. I don't want to see it continued to the point that nuclear has though. Loan guarantees and free insurance should not be offered to an industry that is losing market share. Nuclear power has failed and what we are doing now just prolongs the agony.
Chris
Nuclear power has failed... tell that to the Chinese, planning for 130GW of nuclear capacity by 2030. And unlike us they have the record of keeping in to their plans.
But if you insist on putting the things in that perspective I will agree with you - drop all supports and subsidies! For renewables, nuclear, oil, coal etc... Let the invisible hand sort it out.
Another (perhaps temporary) convert. So, you agree to the repeal of Price Anderson and the ridiculous loan guarantees in the energy bill? Charles supported this position until he realized that all the nuclear plants would have to close and then he wanted the government to be the insurer of last resort. Perhaps there is a compromise position. The government acts as broker to share out portions of the risk to a range of private insurers. In the end, I expect that the rate comes to about $0.08/kWh. Getting rid of the loan guarantees probably changes the cost of money by 50% or so
if the banking sector sees the nuclear industry getting responsible about insurance.
Take that together with a $100/barrel-level carbon tax (with tax shifting) and some efficiency mandates and we should get ourselves headed in the right direction.
Chris
It is a debatable question which will be hurt more from removing all supports - nuclear or renewables. Nuclear support at least cost nothing to taxpayers and are aimed at reducing risk; while direct subsidies cost real taxpayer money. My bet is that nuclear will win out - the Price Anderson act can be replaced by a joint insurance by the nuclear industry, while loan guarantees are about equally distributed between renewables and nuclear (despite nuclear producing more than 10 times their combined energy) so they should be neutral. OTOH I don't see how reneawbles would survive the removal of direct subsidies and mandates - just watch the history of wind in US, Spain or elsewhere.
In the absence of carbon tax I am absolutely sure of just one thing - I know who will win if what I (tongue-in-cheek) proposed - the fossil fuel industry.
Actually, Price-Anderson and loan guarantees have the effect of increasing risk. We counter that with regulation, but the regulators also still seem to see themselves as industry promotors, so the system ends up broken. Involving actuaries would tend to close down the riskiest plants such as Indian Point and thus reduce overall risk. Ending loan guarantees would promote greater scrutiny of the relative commercial viability of projects. Some state regulatory bodies are trying to include this more in their reviews, one reason FPL's nuclear proposal ran into difficulty, but this sort of review would happen at the bank level without the guarantees and less time would be wasted.
Price Anderson and loan guarantees also end up costing tax payers money because of the need for subsidies for renewables to overcome the nuclear subsidies.
I think the current federal renewable mandates are really a matter of national security and so I don't see a reason to remove them. Similarly, nuclear powered navy ships are not really energy policy.
Chris
"Price Anderson and loan guarantees also end up costing tax payers money because of the need for subsidies for renewables to overcome the nuclear subsidies."
This must be the funniest thing I've read recently. So, a legislation that costs zero dollars justifies billions of taxpayer money to be spent on something else, so to make things even :) I hope you see the flaw of this logic, and I hope you realise that you are shooting yourself in the foot with the things you propose.
Renewables would be dead without subsidies and mandates (which is another type and even bigger subsidy). Never would have been born actually.
The federal renewable mandate is not a big part of the market and is fairly recent as well. I agree that federal research support has been important, but it has been much much less than for nuclear with, evidently, a much greater return. We had been discussion production subsidies. Let's work first on repealing Price-Anderson and we can get to the rest after that.
Chris
Let's work first on repealing Price-Anderson
The pro-nuke people can not do that. Fission is too unsafe.
Let the invisible hand sort it out.
http://www.econlib.org/library/Smith/smWN13.html#B.IV,%20Ch.2,%20Of%20Re...
An EROI of 30 seems high. If coal electricity EROI is 9 average, and solar PV is the most expensive generating option, then the EROI is likely to be below 9.
There must be a hidden cost between the creation of the cells and the value of the electricity. And it would have to be a huge cost. Any thoughts on what could have been left out of the EROI study?
I will read it over and see if I can spot anything obvious.
The main thing is growth. The cost to refine silicon in much less than the price of silicon. There are some solar cell manufacturing plants that are not running at full capacity because of this so one might think that the extra cost of making cells from refined silicon would not be inflated all that much, but people are using the extra profit to reinvest in fabrication as well. The demand is high enough at the current price point that prices are supported even as manufacturing costs plummet. This is how the growth is being sustained around 50% annually. http://www.earth-policy.org/Indicators/Solar/2007.htm
When you buy a solar panel today, you are paying for the plant that refined the silicon, the plant that made the panel and the plant to refine tomorrow's silicon and make tomorrow's panel.
Chris
One thing that is left out of solar voltaic costs is the cost of installation on rooftops. This adds considerable costs, and brings the EROI down. This is probably not the difference you are thinking about, however.
Installation overall for my 2kW PV system was $2200, the rooftop installation being about 1/2 that. In terms of EROEI, the energy required to move the panels to the roof was arm-power.
Okay, that gives us a baseline. On your system, energy payback *on the installation alone* is 7.5 years roughly. $2200/(2kw*4 hours per day average peak sun*$.1/kwh). Figuring anything else is LYING! Money IS energy in the current world.
Let's not confuse monetary ROI with EROEI. And please state the source of your sun-hour assumption, and where is is considered to be the norm for year-round averages.
http://rredc.nrel.gov/solar/old_data/nsrdb/redbook/atlas/serve.cgi
This does not answer the question. I'll assume you made up the number, unless you provide justification.
the average annual solar energy incident on a latitude tilted flat plate for the bulk of the continental united states I was looking at maine specifically, because a different poster commented about a laundromat using evac tubes and I had thought it was you. From that map over most of the nation, the insolation average annual is the 4 kwh/day that I used above. At BEST it is 6-7 in Arizona, so you're quibbling and really reaching here.
When are you planning to post some substance or address the realities of the situation?
Using Maine as a solar energy data point representative of the US does not provide us with a realistic scenario.
I supply references to support my claims, and merely asked you to do the same. Indeed you asked a poster above for a cite to support their claims, so I assume the same rigor in supporting claims applies to you.
It does. The only thing is that I have not in any post by you in the last 3 months seen even one citation. You are therefore using a double standard.
As for the solar map, you are correct, Maine is an inappropriate baseline for solar in the US, it IS however the same collection over greater than 50% of the land mass of the continental US, there are only very small (relatively) pockets that do significantly better than that. For example, significant parts of Texas are in the same range, all of Washington state, all of Louisiana, MD, VA, Etcetera, etcetera, etcetera. It therefore IS fair to assume that you live somewhere within the 4 kwh/m2/day zone as it is by far the largest and most populous. In addition, it's only 50% improved if you are in phoenix Arizona, so for a number to work with in a home installation, it's a perfectly viable one to use.
These are all of course "back of the envelope" calculations, and since we are having a conversation here, not actually betting the fate of the world or even any significant money on the accuracy, that should be acceptable to any reasonable human. If any of my numbers differ wildly from industry accepted standards, then by all means feel free to challenge them (as I did with the 40% claim), but when I am simply stating that which is known to anyone who has done even the slightest research, it's shockingly stupid to demand that everything be specifically cited. However, back of the envelope calculations are fine when something is as clear a case as, for example, the efficacy of ethanol, the uselessness of PV, the difficulties of replacing oil, or the ineffectiveness of passive solar.
Money IS energy in the current world.
I believe you have summed up this claim already.
LYING!
Yes. That is what you are going.
Because I can show that you are wrong via fractional reserve banking and fiat currencies. "Money" is "created" into the system.
Energy on earth is the result of photon processing or long ago stellar bodies.
A stroke of a pen, or a press of a key on a computer can 'create' new money.
the creation of which will devalue all existing money and alter the dollars to kilowatts ratio. Financial accounting is the only honest way that exists of accounting for all the energy inputs in a given thing.
So here's the question, if a device costs $100 and the meter turned 10 kwh to manufacture it, where did the OTHER $99 go? The answer is simple, every penny of it went directly to energy, do not pass go, do not collect $200. There is quite simply no other place for it to go in the current world economic system. It may take as much as 3 steps to get there, but get there it does.
Expensive energy = bad eroei. Simple as that.
So you admit that money is not energy.
You are welcome that I was able to clear that up for you.
Condescending obfuscation noted. Doesn't change the point that there's nothing to spend money on other than energy and that therefore a bad financial ROI = a bad EROEI in any honest total accounting regimen (admittedly there are exceptions, for example, purchasing food from the Amish).
Not a single bit of obfuscation - that is what you are attempting. And again, you are welcome that I can clear that up for you.
I'll also point out how your example helps to prove my point - you reference the game Monopoly. Where part of the gameplay is all about creation of money out of thin air within the game. $200 is injected per cycle, per turn.
But do feel free to come back with actual proof that money actually equals energy. Do show how energy can be created "from nothing" - for that would solve "peak Oil". I've already shown how the money system 'creates' money 'from nothing' via fractional reserve banking.
But here's a link showing money created from debt.
http://www.webofdebt.com/excerpts/introduction.php
Well, actually, I never referenced the game monopoly.
I also never said that energy could be created from nothing. I DID however state that real money cannot. Only inflation can be created thusly. The *fiction* of money can be created from nothing. The stroke of the pen creations do not create money, they create inflation and simply alter the units used in exchanges instead of .001 troy ounces of gold converting to $1 converting to 10 kwh, you then have .001 troy ounces of gold converting to $11 converting to 10kwh. Gold pegged for example, there has been effectively no change in the price of oil since 1995. It is only in the imaginary currencies like the dollar and the euro that this has taken place.
Well, actually, I never referenced the game monopoly
http://www.theoildrum.com/node/3910#comment-337148
So "do not pass go, do not collect $200" comes from where if not Monopoly's rules?
I also never said that energy could be created from nothing.
Yes you did:
The 'current world money' is fiat currencies. You admit this. You even call the dollar (whichever one) and the euro "imaginary" - a quality that energy does not have - being imaginary.
I note how you are backpedaling, rather than accepting that you were wrong. And while gold has acted as "money" in the past, you did say "current world". In the "current world" one can not go to, say, the IRS and pay your taxes with Gold, Silver or even Federal Reserve Notes. And where you claimed to offer a rebuttal - the units were $ and kWh, not oz of gold.
Oh, and it takes the same amount of energy to take ice from 0C to 100C boiling as it did in 1908 as it does in 2008. Yet, the amount of 'money' to buy various things has changed. So yet another reason "Money IS energy" is wrong.
So again:
Your statement of "Money IS energy" is still wrong.
And you are more than welcome that I was able to provide you with an education.
mmm. Okay, I accept that my "energy is money" statement was incorrect. This has no effect whatsoever on my point, that being that a bad financial return means a bad energy return, nor does it have any effect on my statement that there is no other destination for money other than to be spent on energy.
I will also acknowledge here that you are the better debater. Your ability to use rhetorical tricks to win the debate regardless of the accuracy of the point you are making, the relevance to the overall topic, or the more significant thrust of the subject under discussion surpasses mine. So congratulations, seek work in politics or law.
Your ability to use rhetorical tricks to win
Sad that you consider truth to be a 'trick'. Its no wonder that a humble web poster has to go out of his way to teach you. But you are welcome.
seek work in politics or law.
Truth is not in high demand in either of these fields. So I am here, helping others find the light of Peak Oil. You are, of course, welcome.
http://100777.com/node/189
To continue your education on money and energy - Jay Hanson is someone you should read.
http://www.warsocialism.com/physiocrats.pdf
And yet again, you have missed the point totally. Do you just completely lack reading comprehension or what?
You are quite a delusional narcissist if you think that you have done anything other than proven yourself to be an utterly useless quibbling debate-whore here.
As for the realities of peak oil, I am fairly confident that I know more about the central issues than you ever will. I can state this simply based on you demonstrated ability to ignore substance and zero in like a laser on any irrelevant and meaningless aspects in which you can practice self-aggrandizement by exposing an "error" that makes no difference whatsoever. All the while ignoring the fact that an absolutely critical point has been made. It's a pity, because if you were less of a small-minded creature, your debating tactical prowess might be useful, but as it stands, feel free to seek self-satisfaction in annoying those who are engineering REAL solutions.
And yet again, you have missed the point totally.
Really?
Lets see:
On your system, energy payback *on the installation alone* is 7.5 years roughly. $2200/(2kw*4 hours per day average peak sun*$.1/kwh).
You are the one claiming 'energy payback' - then jump to $ not to mention how you are somehow assigning energy payback to installing. Energy is things like BTUs or watts. To calculate the ENERGY payback you'd need to know the watts or BTU's used to create the PV system, then show the watts/BTUs produced.
http://www.nrel.gov/docs/fy04osti/35489.pdf
So lets see: the NREL says 4 years and someone who calls others liars claims 7.5 years. Who to believe?
As for the realities of peak oil, I am fairly confident that I know more about the central issues than you ever will.
Why don't you show us how much you understand by explaining the 'central issues'? Because for years the 'central issues' and effects of Peak Oil have been discussed on the Internet and here. Its good that *YOU* have it all figured out.
Try not to mix up EROEI, money, gold and dollars. Be sure to determine if CO2 in the air, the lack of functioning credit markets, the US dollar is collapsing VS oil price rising, oil just stops getting pumped from the ground, a lack of PNK, overpopulation, or a fine global war as the 'central issues'.
In fact a clear whitepaper on the 'central issues' should be able to make the front page of TOD.
those who are engineering REAL solutions.
Such as? A thumb for hitchhiking on vogon ships? Or do you work on projects SO much more advanced that *YOU* have better knowledge than the NREL on PV? You now understand that money is not energy - so whatever you are engineering will be even better! So again - you are welcome!
Finally!! now we can actually start discussing things of substance rather than all the semantics crap from before.
Okay, the energy invested in the installation comes in the following forms, gasoline to bring the installer to the site, energy to make and maintain the service vehicle and tools (both in the forms of direct energy in the mining refining and machining of the raw materials AND the energy embodied in the labor of the factory workers), the food (both the diesel to farm the land and the energy to make the fertilizers) that the installer (and in all probability his children/wife) ate that day and 1 other day because the average person works a total of half the days from when they are born to the day they die), the HVAC energy at his house, the installers water and sewer bills (purification and treatment of the water), insurance premiums paid by the installer (energy spent by others who did that job and either were injured or sued for having done so), the installers house payments (delayed payment for the energy involved in constructing the house), the taxes paid by the installer (the energy used by the government employees who will be paid with that money). The most accurate way to get an understanding of how much energy was involved in getting a team of roofers and electricians to his house, where they spent a day installing the system, eating lunch, etcetera, is to count the money, the most accurate way to determine the overall energy balance for his system is similarly to count the money. The NREL way is to just ignore all of that, but that is unacceptable, that energy is invested, every dollar of that $2200 was spent on energy to get those men to that place at that time doing that job.
I do not think that I know more about PV than does NREL, I think that NREL is falsely reporting the EROEI of PV. NREL takes into account in its statements regarding EROEI *only* the actual meter turnings at the factories that produced the panels and 1 generation of the supply chain (the silicon refiner), they totally ignore the embodied energy IN the plant, the energy consumed by the workers in the plant, The fabrication of a high precision wire-saw, waste disposal energy, the replacement of the factory roofs, the repaving of the parking lot, replacement of the delivery trucks... the list is absolutely endless! Were it all accounted for, then the EROEI would come very very close to matching the financial ROI (in the case of PV, slightly negative, but improving fast!).
So, where does one go for a full accounting of the energy that goes into a product? It's VERY simple, count the money. That will give you a fully factored and accurate representation of the quantity, type, and quality of energy that went into that endeavor. On the open market, a product will sell for the price of the energy that went into creating it. Even profit is energy invested, whether the factory owner spends it on his yacht, or on a new bigger factory, the energy represented by those dollars (or yen or whatever) effectively is expended in the creation of that PV panel you just installed (had you NOT just installed it, he wouldn't have been able to afford that yacht).
You will note that, for example coal with an EROEI of 8 has an electricity production cost of approximately 2 cents/kwh (one can reasonably assume that that number will be increasing as the co2 aspect enters the accounting system). Nuclear same, wind awfully close to that. Hydro and geothermal (where the getting is good), with their very pretty EROEIs costs even less per kwh. So perhaps then you can explain why it would be that only PV breaks the model? Perhaps you can explain why every other technology with a very high eroei delivers energy cheaply, whereas only PV fails to do so? I'll give you a hint, it is HONEST ACCOUNTING. Honest accounting takes into account the entire supply chain in the production line, including profits, taxes, installation, lines, losses, paying the janitor, and any other moneys that need to be disbursed in the delivery of the finished product to the customer. Honest energy accounting takes into account the energy to manufacture all the equipment that is used in the production chain, all the energy that is used by the employees of the industry, all the energy in site remediation, etcetera. That is what has been done for all the other technologies where EROEI matches ROI, but has not been done for PV. This is due to systematic bias, NREL and many other organizations want very badly for PV to work, for PV to be installed and used, so they bias the numbers to make it more attractive They do this by taking an extremely narrow view of the energy invested.
Do you not think it odd that 5 technologies with EROEIs greater than 5 can deliver energy at highly competitive wholesale prices, and *1* technology at the same EROEI cannot even compete with high end retail? Even a nuclear plant, with an 11 year financial payback at 2 cents/kwh delivers cheap energy, but a PV panel with a 1 year payback can't compete at 10 cents/kwh? It should be *very* obvious, even without engineering or economics degrees that something is seriously wrong with THAT picture!
Now, is the financial model of EROEI perfect? NO. A can of tuna did not take less energy to deliver the day it went on sale than it did the day before. SOME small percentage of money spent is spent on things other than energy, it's spent on life expenditure (easily counted by savings rates), it's spent on... yeesh, I really can't think of anything else! Perhaps you can help me out here, what are a few other non-energy places money can go? Point is, that as imperfect as the financial accounting of energy is, it is far far closer to reality than you're like to get from a study by a biased government organization whose only purpose is to promote the use of the product under discussion.
Now you may begin to have a comprehension for why I said that money is energy. I obviously didn't mean that a 1 dollar bill could magically become 10 kwh and didn't assume that anyone here would be stupid enough as to think that I either meant or thought that. However, there is a very very strong relationship between ROI and EROEI if both accountings are done correctly and inclusively. In the current world, the two are inextricably tied, regardless of whose picture is on the paper you pay with. In Amish circles, money probably all goes to time or land or something, but we aren't Amish so it goes to energy.
The can of tuna is a good thing to consider. If a solar power system moves you from Tier 5 to Tier 1 in a rate structure, how should we count its value? http://www.sce.com/CustomerService/UnderstandingTieredRates/
In this case, the payback time on the labor might be seen as quite a bit less. The point of working in energy units is to avoid the sort of confusion you've introduced by insisting on working in dollars.
Chris
Well, in those cases, the rate tiers reflect the energy that goes into maintaining extra lines, transformers, rights of way etcetera, all the way to the power plant. Therefore, the energy payback legitimately is faster if it tier jumps you. The tier jumping allows the utility to service additional homes without spending large quantities of energy upgrading transmission lines etcetera.
The reason for working in dollars instead of energy units is that not all energy units spent on a project are easily apparent, but they WILL be reflected in the dollar cost. How would you factor the gasoline that the installers wife used to go grocery shopping that day in any other way? Would you ignore it? But the installer and his wife hadda eat that day, and the money that you paid him purchased that fuel, so it's inappropriate to just ignore it.
Emergy is also a viable relatively inclusive accounting method, but an emergy study is not exactly readily available for Will's rooftop PV installation, whereas a pricetag is.
My problem with the NREL EROEI is that they neglect literally everything except the energy it takes to run the fab shop. I can see no other way to look at that other than as a straight and simple lie.
Doing the accounting in dollars really does not confuse the issue, it in fact profoundly simplifies it, as well as improving the accuracy and stripping away the biases without necessitating spending the time to perform a full emergy analysis, while producing the same results in the end (give or take a few percent). It clearly isn't perfect, and we can quibble about a percent here and a percent there, but the overall results will closely match the emergy analysis.
http://www.eroei.com/eroei/evaluations/net-energy-list/
Look at the emergy chart and you will see a very clear and distinct matchup between the emergy return and the price of the finisned energy. Anytime there's a significant bust between the EROEI and the ROI, it is because either politics have increased the price, or someone is lying about the EROEI.
I think it is worth looking at what the numbers mean for the price of electricity. The price rises more slowly than inflation, but we can be fairly sure that coal, for example, is being mined further from the power plants where it is used on average. EROEI is probably declining a bit. Why is that? A portion of the price of electricity is set by repayment of money borrowed prior to inflation. When you are calculating what the pay back time is, you should probably cost out electricity as though the infrastructure were also built today. Perhaps the tiered rates manage to do that a little.
As it happens, with PV, most of the energy really is in materials so the energy accounting aproach works quite well. It avoids issues of comparing old money with new money and temporary scarcity pricing.
Chris
The reason for working in dollars instead of energy units is that not all energy units spent on a project are easily apparent, but they WILL be reflected in the dollar cost.
You've made a claim that energy units are reflected in 'pricing'.
So prove it.
ivory type.
Instead of tossing out racism.
Finally!! now we can actually start discussing things of substance rather than all the semantics crap from before.
When one confuses money (is it gold? FRN's? 5 chickens?) with energy - best to get that sorted out. You are still confused. My posting is not to convince you (upthread you said you understood that Money is not energy, then you keep confusing 'em) but to make sure that others with open minds examine the relationship.
The most accurate way to get an understanding of how much energy was involved in getting a team of roofers and electricians to his house, where they spent a day installing the system, eating lunch, etcetera, is to count the money,
No it is not the most accurate way. It happens to be a quick way to 'use the cost'. This is the part you seem not to have understood yet.
I do not think that I know more about PV than does NREL,
Go on.
So, where does one go for a full accounting of the energy that goes into a product? It's VERY simple, count the money.
Let me educate you further. eMergy. Howard T. Odum.
What one charges for something != energy embedded in the item. Grade 25 51200 chrome coated carbon steel bearings. One vendor $.15 a bearing. Ebay assortment $.058 a bearing. Is one bearing 'magically' less energy-containing than the other? Or is the local distributor overcharging? (Hint: The $.15 for 3/16 inch bearing said 'oh, as you have never bought from us before and have no buying history that is our quote. But I can talk to my manager and see about a price reduction.')
That will give you a fully factored and accurate representation of the quantity, type, and quality of energy that went into that endeavor.
Another....oh what did you call it ..... LYING statement.
This web site runs on open source software. A whole lot of effort has gone into the unix OS (not UNIX (TM)), the database, the web server, and yet the cost is $0, Microsoft charges money for their OS, database and web server. Yet last week over 1/2 a million web servers running Microsoft's products were attacked and trojaned (including homeland security)
For your money = quality argument to be true the $0 nature of open source would have to show that open source software would have to be worse than the pay alternative.
On the open market, a product will sell for the price of the energy that went into creating it.
Now you are claiming that there is an 'open market' in goods? What's next - that goods have an honest and accurate accounting?
You will note that, for example coal with an EROEI of 8 has an electricity production cost of approximately 2 cents/kwh (one can reasonably assume that that number will be increasing as the co2 aspect enters the accounting system)......I'll give you a hint, it is HONEST ACCOUNTING.
I've excerpted this not to educate you, but educate other readers. You destroy your own argument. You speak of 'honest accounting' - yet you also note that CO2 is not being counted in the accounting. So - how does an 'honest' accounting have something 'enter' the accounting system?
Now, is the financial model of EROEI perfect? NO.
But you destroy your own argument here. Upthread:
The most accurate way ... is to count the money and Perhaps you can help me out here, what are a few other non-energy places money can go?
No where in your 'counting the money' idea do you at all include the interest (How does the bank's interest rate figure into the wattage consumption or production of the panel??!?!?) the inflation of the money supply, the costs of governance?
Not that I expect you to feel at all helped by me pointing out inflation or interest.
(I just can't seem to work in sub-prime markets, carry trade or derivatives as other 'places where money can go'.)
it is far far closer to reality than you're like to get from a study by a biased government organization whose only purpose is to promote the use of the product under discussion.
(so you don't as much about PV as NREL - yet you can claim they are wrong?!?!)
The only purpose of the NREL is to support PV?
http://www.nrel.gov/overview/
Now that sounds a tad broader than your claim.
It is obvious that you need to spend time here:
http://www.nrel.gov/learning/
where you can be exposed to information that will hopefully remove your veil of ignorance on the topic of what the NREL does.
If you can't get basic ideas right (money is energy), make claims that are out right wrong (NREL only does PV), and 'wonder' about 'where money goes' (when money is the way *YOU* want to do energy accounting) I gotta say - you have no credibility. I leave it to the readers to apply their own level of credibility to your statements.
Get it straight, I have *never* "confused" energy with money, I have mixed the terminology because in the current world money represents energy, nothing else.
As for the rest of it, If you can't get the concept that nrel is biased, that ALL the energy investments must be considered in EROEI, and that as it stands, money is the most efficient way to do that, then there's just no hope for you.
Pity, you're obviously not stupid, just clearly an ivory type.
a
And yet again, you have missed the point totally. Do you just completely lack reading comprehension or what?
You are quite a delusional narcissist if you think that you have done anything other than proven yourself to be an utterly useless quibbling debate-whore here.
As for the realities of peak oil, I am fairly confident that I know more about the central issues than you ever will. I can state this simply based on you demonstrated ability to ignore substance and zero in like a laser on any irrelevant and meaningless aspects in which you can practice self-aggrandizement by exposing an "error" that makes no difference whatsoever. All the while ignoring the fact that an absolutely critical point has been made. It's a pity, because if you were less of a small-minded creature, your debating tactical prowess might be useful, but as it stands, feel free to seek self-satisfaction in annoying those who are engineering REAL solutions.
Die-off scenarios have nothing to do with low or negative EROEI's but on the fact that we've overshot the carrying capacity of the world. We're not growing enough food (drawing down grain reserves), we're drawing down the aquifers, we're destroying the soil (loss of organic matter as well as salination) and we're highly dependant upon using soil as a growing medium which is infused with chemical fertilizers.
There is much that can be done - but what do you do when in surburbia homes are laid out according to arbitrary roads. In the case of my home there is no south facing glass at all - windows face E and W primarily as well as north. The home is a semi-detached and my neighbour has but one window facing south! The homes are made to look good from the front - everything else be dammed. Nearly every home I see with south facing glass has no overhangs and so the windows are shuttered, aluminized or somehow shaded on the inside. They don't have the thermal mass to soak up the heat and in the summer it's worse.
At least in the last 15 years this has happened:
1) T12 fluorescent technology is nearly banned (replaced by T8) and CFL's (T5 technology) has taken off.
2) low-E glass is now required by the building code in my province (TiR has become readily available)
3) insulated, above ground foundations, are required by the code (My living room slab is 12C in the winter at the edge!)
4) The moronic belief that halogen lights are more efficient is hopefully going out the window while LED lights hit the market.
Still it's only $350/winter to heat my home with natural gas. Oh - there is also a $200/yr connect fee. If I build my straw bale, passive solar home, then my energy costs will increase (smaller more efficient home, but no shared wall with the neighbour).
The only way forward is:
1) power down - get used to living on 1/5 or less energy than a typical person in the west
2) reduce the population
3) local production, and consumption, of food
4) enjoy local transit - or your bicycle, cars will not be an option for long
5) don't waste time with techno-fixes such as homes with elaborate HRV's and fancy toys to save energy. Just do without.
At least this year at the energy expo around here; they didn't have one particular company saying that you could stick wind turbines on your roof and power your home.
Solar PV is still a dead duck as long as it costs around $4k for a grid inter-tie inverter. Both wind and PV are investments which are best done on a large scale.
Solar water heating, in my part of the world, is also a dead duck. It's so much easier to just do without the hot water. If we installed a solar DWH system it would cost between $4k and $5k - and possibly save us $20 to $25/yr. We'd still need the electric water heater, and we'd loose lots of basement space to storage tanks that would fail within 15 years - and need expensive maintaince. That is a technofix solution. One can make due with a lot less hot water.
I don't see why a $4k inverter makes PV solar impossible? We have $0 down financing for cars which is truly insane promotion of a dying industry.
We need a 'Marshall Plan' emergency investment in a transition to a powered down energy/transportation infrastructure. Use the military money & the DoD budget--gut all of that and use it for the transition. Turn to 'victory gardens' and tear up lawns. Survival will make these ideas more urgent as we slip down the steep slope of FF decline.
Let's promote the change we want, avoid fatalism and the 'bystander effect' and get involved in things we can change, but argue for the social changes that must happen for a world to be possible...
Too many mistakes and bad sources in previous articles to take anything posted by this user seriously.
Editorial reminder- Charles Hall has dozens of peer reviewed papers on energy, many of them seminal. However, the objective of this series, from the start, was to supplement the work of students in his EROI class with additional data and sources provided from the readership of this site. This is not meant to be a demonstrative, final analyses, but a public request to improve a draft series of papers by his students for eventual publication. Thanks for your specific help and recommendations.
Nate,
I'm not going to spend time on someone whose previous posts have been shredded.
Robert and Jeffery don't always agree, but it is because they disagree about how to interpret the data they present, not because one of them picks data from discredited sources.
You can get offended if you want, but this series does not deserve to pass the Oil Drum Editors and I am shocked that it continues.
well part of the reason for asking for help on a draft is to point out the bad sources, especially when you are working 18 hour days and your brain is the same size as the other 6.7 billion, e.g subject to same cognitive limitations.
+1
Hey, some of us took the trouble to rip up Hannahan and Barton's nuclear pieces (again, Skip was unfortunate to be put in with them) just as they were dissing TOD on their blogs - if there are faults in the piece, either point them out, or be silent. Don't go, "oh my God it's so full of holes but I can't possibly say what they are." That's useless to anyone except perhaps your own ego.
I mean, anyone could post "this article is wrong but I won't say how" to any article. What's the use of that?
For the latest in solar inovations that are actually being built , follow the Solar Decathlon
http://www.solardecathlon.org/
Again ...to be Sustainable it needs to be Economically Viable
We need affordable passive dwellings for the masses , not solar Mansions just for the wealthy
This is an overlooked point. There continues to be a widening of the gap between the rich and poor. Setting aside the impacts of the credit crisis for the moment, as available liquid fuels become scarcer and more expensive, they will act as a regressive tax, and accelerate the GINI coefficient. At some point this will lead to a larger % of the population unable to afford the 'transitional' infrastructure of hybrid cars, solar panels, passive solar, etc. In very real ways, social equity has to be addressed in future energy plans, otherwise the new energy infrastructure won't be able to built or maintained.
Nate,
I think this is a very fundamental point because I think that in the case of for example, personal installations of PV and electric vehicles we might already be at the point that neither of the two of them will be feasible as we go further into recession.
My biggest concern currently is that the banks may not make the necessary loans to allow people to overcome their indebtedness right at the point when we need to make major investments.
Consider: Huge numbers of people at the lower end of the middle class are simply tapped out and cannot afford extra payments and even less higher and higher gas and food prices.
They are not going to be able to come up with any kind of surplus.
Thus, logically, without a loan of some kind these people are going to end up taking mass transit to get to work and be unable to pay for power or heat.
How to solve this? I think that given the negative EROEI problem isn't so much of a problem the main issue we have is how to get funding to replace all the infrastructure and vehicles with corresponding infrastructure and vehicles that do not use oil.
For me it now comes down to hope:
Wind power as an example is growing at a 30% clip per year. That's a doubling of installed base every two years. If electric vehicles or PHEVS can achieve that rate of increase of manufacture we may have a slight chance of being able to outrun the depletion curve.
CH4 emissions from anaerobic decomposition in the sediments of the reservoir contribute more heat capacity to the atmosphere than an equivalent MW coal fired powerplant does. Hydropower contributes more to AGW than equivalent scale CO2 emitters do.
At the present time CO2 levels are over 200 times larger than methane levels(380 ppm vs 1.8 ppm). At these proportions methane provides only 10 to 12% of AGW. As the author stated the methane production is very site specific. Methane has always been generated biologically in swamps and bogs and other wetlands which are disappearing. Could the disappearance of wetlands balance out the alleged methane from hydropower ponds?
CO2 levels are over 200 times larger than methane levels(380 ppm vs 1.8 ppm). At these proportions methane provides only 10 to 12% of AGW
That doesn't negate d-dog's point, however. First, of the CO2 and methane levels given, what proportion of those are emitted by human sources each year? For CO2, we're raising the level by 2-3 ppm/year now, so it's that increment that must be compared to whatever it is for methane. Let's assume that the 10-12% ratio you give for the levels holds as well for the emissions. The reason that methane is so relatively small is that the scale of fossil-fuel use is so large. But on a MW-MW basis, the methane has a much greater impact on GW. So every MW generated by hydro power causes more GW than does a MW generated by FF. Now, don't misunderstand me to be for FF fired electricity. Quite the contrary (see my testimony to the NC Utilities Commission posted above with regard to passive solar retrofit). What we need to do is powerdown. Of course, as a doomer, I think this is going to be organized for us in the most harmful way possible, PO leading to economic contraction, meaning less ability to afford investment in saner, cleaner systems. In desperation we will turn ever more to coal, thence to burning everything in sight, creating beaucoup CO2 emissions even while 'the economy' crumbles before our eyes. There ain't no technofix to our dilemma, because there always seem to be unforseen consequences, the methane emissions of hydropower serving as a nice example. If one can call collapse, 'nice'.
The figure of 23x for the greenhouse potential of methane over CO2, is really the net effect of an incremental molecule over a century. Atmospheric methane has a lifetime of perhaps a decade, whilst the CO2 is roughly a century (some is absorbed within a few years, and some lasts for centuries, i.e. the CO2 reabsorption curve isn't a simple exponential). What that means is that a single molecule of methane cause much more warming than a single molecule of CO2 -I don't remember the number, but it is something like 100-200 times, but because it won't be in the atmosphere as long it doesn't score that high. If they had choosen a longer integration time than a century, the mathane to CO2 GW potential ratio would be much lower than the current 23times. In any case the bottom line is that the current methane contribution to GW is several times greater than your estimate (but still less than the CO2).
That doesn't change the fact that methane's contribution to GW is proportional to the speed it is created (averaged trough a decade or two), while the contribution from CO2 is proportional to the total amount ever emmited.
Don't forget Stirling motors.
http://www.stirlingenergy.com/technology/tech-faq.asp
25 KW stirling motors producing 50000 kwh per year, 8 dishes per acre, 640 acres per square mile will produce 256 Gwh per square mile. 250 square miles would generate ~64000 GWh per year.
The current estimated cost is about $3000 per KWpeak so $400 million dollars would cover 1 square mile, so $96 billion would cover 250 square miles(16 miles by 16 miles producing 42% of Three Gorges).
China's Three Gorges Dam which costs $25 billion will produce 18.2 GW(150,000 Gwh) and flood 250 square miles of prime farm land. Of course only one Three Gorges Dam is possible.
Solar/wind IMHO is best compared to hydroelectric, not fossil fuels or nukes. It may be more expensive than hydroelectric but the resource is much larger.
Thanks for the order of magnitude calculation. If your numbers are reasonable, the difference between building a huge hydro/irrigation/flood control project and building a large passive solar generation system is shocking to say the least.
Using your calculation to produce the power of TGD would require $228bln. worth of Stirling engines - more than 9 times higher price tag than the dam. In addition you get electricity output which you can not regulate and it depends on the natural cycle of day/night/summer/winter/clouds etc. So you will have to complement it with another energy source, or store the electricity which is almost as expensive. Good luck trying to sell that to any utility.
Solar or wind should be properly compared to run-on-the-river hydro. From an utility viewpoint they are all similar in being not dispatchable, e.g. not being able to deliver power when requested (as opposed to when available). This makes them good as complementary sources, to "save fuel" so to say, but something else must balance them out.
Yes, at present prices 9 times seems about right, so what? There can be only ONE TGD dam. It took a huge effort by China to build it, but we are much richer than China. Rather than a single huge project you can break it up into smaller units placed on small tracks of a couple square miles. I agree that we will need a complementary peaking energy source but we need complementary sources anyways: I like IGCC-CCS(which makes storable synthetic 'natural gas'), we have a couple hundred years of coal lying about and we have plenty of old oil and gas
fields to sequester CO2 in.
The utilities are being run as independent operations, that has to change. Utilities should be forced to buy renewables and work them into their generation mix. They should also be given authority to load shed to balance the system. It will be hardwork for the utilities to upgrade their systems so WE(voters) HAVE TO MAKE THEM DO IT and pay higher rates.
If all you want is power at your figure tips buy a home gasoline generator.
Stirlings are a fine idea.
Alas, Idea is where they are at. Omcharon isn't making/shipping their Nitrogen charged, press metal $90 1 hp engine. Dean Kamen isn't shipping his.
Whipsergen is still expensive. (but down for the $35K a few years ago)
When Solo is shipping its 10kw disk for $15 K - lets talk!
Thanks, Prof. Hall -- an excellent survey from my layman's perspective.
When I hear the word PV I reach for my bullshit detector. So allow me to go into Scrooge or 'wet rag' mode. Honest guys I'm just playing at being difficult so don't eat me alive.
When will PV companies start putting their money where their big mouths are? Because they are certainly a dab hand at placing other people's money.
As a hardhat tightwad, I am willing to invest in PV under the following conditions:
The PV firm doesn't sell me their PV product -- I'm one of those wary old fogies who doesn't like to buy a pig in a poke. Rather, the firm leases their product to me on (say) a 5-year basis. Let's call that firm Avis SolarCentury. AvisSolarCentury not only installs the solar panels –it provides maintenance and repair all-inclusive. If the system breaks down – wuppdiwupp – I press an emergency button and they send a guy over within 1 hour to repair or replace it. Just like if my leased car had broken down on the motorway. Oh, and I pay for every watt I consume – if the sun doesn't shine as much as Big Mouth Avis SolarCentury said it would, Big Mouth Avis SolarCentury doesn't get paid for the missing watts and my monthly instalment heads south. Big Mouth Avis SolarCentury might even go bankrupt. The market is a hard mistress.
I can then compare the cost of PV electricity with the cost of grid electricity. If the PV guys are as smart as they claim they are, the former will cost less than the latter. I spent several years at Idontgotoa University. So I don't know a lot about EROIE but I know what I like: value for money.
If after five years, I am fed up (for good reason, bad reason, or no reason at all) I simply do not renew my contract. I instruct Big Mouth Avis SolarCentury to drop by and dismantle the PV system. ASAP.
Does any such firm exist? I don't think so but I hope I'm wrong. If the PV business is so smart, why aren't they plugging leasing arrangements? If they're so smart, why aren't they a lot richer than they are now?
"Does any such firm exist? I don't think so but I hope I'm wrong. If the PV business is so smart, why aren't they plugging leasing arrangements? If they're so smart, why aren't they a lot richer than they are now?"
Yes it does. It's pretty new but it does exist. I may have read about it here on the oil drum.
It goes something along the lines of the company installs the PV system at their cost and you sign a contract to pay the company a per watt amount of money for the lifetime of the contract. The company repairs the installation as needed.
This may be the solution to the tapped out consumer not being able to fund new PV installations.
Do any other posters recall the name of the company?
Maybe like this one ...http://www.citizenre.com/web/index.php?p=home
PV systems are like the Prius .... great that we should all be using them but we cannot all aford the new technology so what good is it ?
I'm involved in this and the deal is pretty much what is requested, but the company has not yet built its factory and thus does not anticipate being able to install systems until 2009. There is no cost to sign up, but just now I'm advising people to also look around and see if a local installer can help with financing in a way that would work. You can find certified installers here: http://www.nabcep.org/
My sales site is linked though my blog at the right under affordable solar power: http://mdsolar.blogspot.com/
Chris
Chris: 2009 now for CitizenRE? I hope that is just a setback - or something more ominous?
I didn't want to post CitizenRe because they have a multilevel marketing business plan. Having said that, I'm not sure the company that I did reference is any more reliable. There are company that lease PV systems and only charge for the electricity you use, but I think their current business plan is geared for corporate customers. More dollars per sale for the same amount of paperwork.
In the state of the company call back in February, the problem was that the financing included hooks that would take the company public sooner than the CEO wants. I can kind of see the point since maintaining market share is going to require heavy reinvestment and that means lower short term profits than is usually acceptable for public companies. But, on the other hand, maintaning zero market share only requires dithering and the opportunity is past. In 2009, the silicon shortage should be ending and the advantages of vertical integration may be less crucial at this price point. Others may be able to offer the same deal just buying panels wholesale and will certainly be able to do it in some markets as we are already seeing. So, a 12 to 18 month delay seems a bit ominous to me just because of what is around for competition. Morgan Stanley is backing a deal in some markets with tiered rates that is pretty close though is has a price escalation of 3.5%/year.
People who have signed up are not under any obligation, so if a more suitable deal comes up, it is best to take it I think.
Chris
http://www.solarchargedoption.com/
Rent a PV system.
Thanks for the link. Any hope of these entrepreneurs opening an office in central Europe? I'll be the first to queue up.
SolarCity is a credible & fast-growing company, whose CEO I've met, and many of whose installers I've talked to - they gave our little town a deal if we did a mass buy, and for a month or so, I saw their installers at the local deli. They seem especially aggressive in thinking about the non-tech issues of installation and financing costs, as opposed to the materials-science side.
Here's their Lease Program, which (I think) was partially generated as a response to City of San Jose.
Caveat: this is California, with its unusual PUC rules for utilities.
Honest guys I'm just playing at being difficult so don't eat me alive.
So is that why you do not answer direct questions when asked? You are 'just being difficult'?
http://www.theoildrum.com/node/3877#comment-334667
I'm one of those wary old fogies who doesn't like to buy a pig in a poke.
Naw, sounds like you are an old fogie who is used to getting your electricity as a 24/7 'always there' option.
press an emergency button and they send a guy over within 1 hour to repair or replace it.
So somehow, in an energy constrained future - you want someone to be at your call in under 1 hour when something breaks? Exactly how much energy do *YOU* think is going to be 'spare' "in the future"?
Say, do you get that kind of service from your present electrical vendor? The always have the lines fixed in under an hour? I'm betting you told the power company right where they could go when when they didn't have that power back in an hour - right? When they failed to deliver in under an hour - did ya show them by stopping to be their customer?
Just like if my leased car had broken down on the motorway.
You DO realize you are on The Oil Drum - right? This is a place where the idea of the 'personal car' and 'motorway' is up for grabs - with many posters thinking that such just might not exist in the near future right?
So, somehow in an energy constrained future - YOU want YOUR gratification right now.
The market is a hard mistress.
'The Market'? Is this the same 'market' that has the UK government giving bank bailouts under the cover of the official secrecy act? Strikes me that the mistress has favorites.
Avis SolarCentury. AvisSolarCentury Big Mouth Avis SolarCentury Big Mouth Avis SolarCentury Big Mouth Avis SolarCentury
Hrmm, from Avis SolarCentury to Big Mouth Avis SolarCentury. Any reason you opted to rebrand them? (Your bias is showing Dud3)
As a hardhat tightwad, I am willing to invest in PV under the following conditions: ....the firm leases their product to me ...
Invest: investing: the act of investing; laying out money or capital in an enterprise with the expectation of profit
So 1st you say you are "hardhat tightwad" looking for an expectation of profit - then you are off talking about a lease? How do you plan on obtaining ownership of 'the lease' so you can re-sell it at a higher amount so you profit and have pleasure thereby?
Or is this one of "The Market" things involving a harsh mistress?
If the PV business is so smart, why aren't they plugging leasing arrangements? If they're so smart, why aren't they a lot richer than they are now?
What other childhood schoolyard taunts will you break out next? "If you are so smart, why aren't you The President of the United States?"
Please go ahead and show the universal truth that 'rich' is equated to 'smart' - that way your attempting linkage has meaning VS just being a petulant child whining. I'll take your evidence by the local Mensa chapter - I'm sure they'd like to understand why they don't rule over a drop out from "Idontgotoa University" and why their brainocracy has not come to pass.
Eric, just logged in and read your comment. Actually in real life (when I take off my Scrooge mask), I'm a Georgescu-Roegenist, or perhaps a Cattonite or a Dalyist. Apologies too for not answering that question on nuclear safety but there is so much stuff on this site I find it hard to keep track of everything.
I was trying to put myself in the shoes of 99.9% of the human race – the people who haven't read the eco-classics, so to speak.
The fact remains that there is an awful lot of hype on the PV front – not as much perhaps as in the bioethanol department, but quite a bit. That's what bugs me. Here's an example I already posted some days ago (forgive duplication, can't avoid it here:). It's from Jeremy Leggett's 'Half Gone' (which as far as peak oil goes is summa cum laude, BTW):
[page 201 – my italics]
Sounds too good to be true, but it's the endnotes that reveal all:
251. I first heard this from Roger Booth, when he was Head of Renewables at Shell, in the mid-1990s. Roger subsequently joined me as a director of solarenergy in 1999, and he remains a key adviser to the company to this day.
253. "solar energy: brilliantly simple", BP pamphlet, available on UK petrol forecourts.
Eric, do you get my point? Do you consider Shell or BP to be an authoritative source of information on solar power? Are you surprised that so many people are skeptical of the blessings of PV?
I'll try to answer your other questions later on. Now it's back to Down and Out in Paris and London (audiobook -- strongly recommended)
Georgescu-Roegenist, or perhaps a Cattonite or a Dalyist.
And that word salad is supposed to have meaning?
The fact remains that there is an awful lot of hype on the PV front
So somehow counteracting 'the hype' with bulls hit 'arguments' like 'if you are so smart' somehow adds light and helps expose the 'hype'?
Come on. Give data.
Eric, do you get my point?
That you don't like PV?
Yea - got that.
Do you consider Shell or BP to be an authoritative source of information on solar power?
Considering that Shell Solar and BP Solar makes and sells PV - they are far more authoritative than random people posters on TOD.
Are you surprised that so many people are skeptical of the blessings of PV?
So somehow sales people for PV make a statement that turns out to be optimistic is a shock?
What part of 'sales people lie' is a news flash here?
Eric, I'm back. Clearly, hell hath no fury like a PV-lover scorned.
I am willing to change my mind when driven by the data, so to speak. I am not saying that PV is a bad thing, just that it isn't as good a thing as some of its proponents claim. Naturally, the fact that there are bad arguments in favour of PV does not refute the good arguments which you and others have made.
So, just out of interest, what do you think of Jeremy Leggett's stuff? I went to the trouble of checking his footnotes. He made extraordinary assertions on the basis of pretty trivial sources. When footnote-meister Lomborg did the same in his 'Skeptical Environmentalist', he was rightly dismembered by the scientific community.
I repeat:
According to Saint Jeremy:
Even in the cloudy UK, more electricity than the nation currently uses could be generated by putting roof tiles on all suitable roofs.
That's an extraordinary claim. It requires extraordinary evidence. JL's source a BP pamphlet entitled 'solar energy - brilliantly simple'. Sweet suffering Jesus ...
More later.
Eric, I'm back. Clearly, hell hath no fury like a PV-lover scorned.
If that is the way you interpret things....it is not like I can change your view.
So, just out of interest, what do you think of Jeremy Leggett's stuff?
Calls for Microgeneration, distributed generation? That burning fossil fuels is a bad idea?
What of his 'stuff' are you speaking of?
ven in the cloudy UK, more electricity than the nation currently uses could be generated
The key is COULD. As I do not know the roof area in the UK or the light levels when the UK is cloudy - I have no idea what level of PV panels are needed. But rather than say 'I don't think so' SHOW how, on the basis of photons hitting roofs it can't happen. LAter you can move to the more interesting and compelling claims about how much metal and materials that have to be used to make all the PV and mount it.
Eric, I come bearing peace.
You are wearing me out. I mean of course the 'stuff' I quoted. Jeremy Leggett's book is actually very good on peak oil, but it's a curate's egg on other topics.
What part of the word 'could' is it that you do not understand?
I'll leave it at that for the moment.
Could is a fine weasel word.
Well,
At least we agree on something. :-)
I had fun trying to put some numbers on this debate.
Fortunately I already had quite a bit of the info on file.
There are around 24 million households in the UK.
They have an average of 48sq meters of roof:
http://www.energy.soton.ac.uk/publications/bepac.pdf
bepac.pdf
Around 40sq meters can generate the average electricity requirements for a family:
http://www.energyenv.co.uk/SolarGridConnect.asp
Solar Grid Connected
Job done?
Not quite!
Most of the homes that install a big and expensive solar system have a considerable roof area, so they can put the collectors on south facing areas.
If you don't site the tiles on the south facing areas you only get around 60% of the potential.
Assuming the average roof is half and half, but covering the entire roof area, you would get around 0.72 of the average power output.
You can also see from the figures in my last link that you get around 7-800kw/year per kw of nominal output installed.
That is 7-9% of nominal, as it is dark sometimes, and cloudy and so forth.
The efficiency this assumes is around 12.5% (40sq meters/rated 5kw =8meters kw), so it is crystalline silicon rather than amorphous that is assumed.
Amorphous silicon is really the better bet in the UK, as it does a lot better in cloudy weather:
http://www.solarvoltaic.com/images/doc/solar%20abstract.pdf
solar%20abstract.pdf
That is only around 5% efficient though.
Of course, we have allowed nothing for other roofs like garages, factories and offices and so on, but OTOH we have not taken anything out for flats, or allowed for industrial and commercial use of electricity.
The real killers though are twofold:
If you have a fixed mount system like rooftiles you can't track the sun at all, and in the winter you only get a fraction as much power as you get in the summer in the UK - just when you need it most.
The second killer is the cost - check out the pdf I referenced - around £15-20k!
So the answer to the question posed seems to be that rooftops are indeed of a similar order of magnitude to electric use, but going from there to say that you can supply most of the electric by these means is a heroic stretch using technologies we don't currently have.
You would need something like this:
http://www.sunrgi.com/
Sunrgi :: Solar Energy Systems
Which is much more space-efficient and tracks, but is not on offer at the moment.
With current technology, the solar power we should be using in the UK is residential solar thermal, which could provide most of our hot water and does not involve losing energy by converting from heat to electricity, or back again where you want hot water.
I hope that these figures at least contextualise the debate, and you find the links interesting!
There are around 24 million households in the UK.
They have an average of 48sq meters of roof:
http://www.energy.soton.ac.uk/publications/bepac.pdf
bepac.pdf
Around 40sq meters can generate the average electricity requirements for a family
See, how hard was that? If 1/2 the roofs face the wrong way, then the claim is question is going towards "no".
If it was that easy, presumably you would have found it yourself.
Actually, finding all the information I have provided here took several hours work, most of which I had done previously.
If it was that easy, presumably you would have found it yourself.
The validity of the statement was not my dog in the fight. Sorry if you think it was.
Actually, finding all the information I have provided here took several hours work, most of which I had done previously.
As is many of my references. The person who was calling Legget's work bunk would have been best served by doing exactly what you did - coming up with the households and roof area.
Except that BP sells a 16.5% efficient panel and is a partner in research that hold the current record of 42.8% efficiency. So, it is not too surprising that when Dave lowballs the efficiency he gets the answer he is looking for while BP's claim would tend to hold water.
Chris
My, look who's popped up!
The fella who called me a liar because I forgot to put in a link to a reference I made, and then has not got the manners or the guts to apologise!
As usual you are incapable of actually reading what has been written, as I clearly stated and referenced a system by Sungri which has higher efficiency and would meet those specifications.
Since you do not engage in normal debate and actively seek to mislead, I would be grateful if you would not respond to my posts, as I leave your prejudiced rants to fail based on their own lack of merit.
David,
What you were were doing was a lie, I was only mistaken as to the manner and only then because you took so long to respond when I had been very polite in my persistent efforts to get you to conform the the ground rules here. As it turned out, you were deliberately quoting out of context to make a false claim. Again, an apology would be needed from you I think. You will note that I did not reply to your post, though it is silly to ask me not to on a public forum. Just a bit of silly posturing from the discomfited I suppose.
Chris
As usual when confronted by the facts you seek to confuse the issue.
You specifically alleged that I invented a quote.
The reason I did not reply sooner was because I do not usually bother to read your posts.
You then seek to switch grounds by claiming that the quote which I gave accurately was out of context.
I would never have accused someone of lying on such a foolish and ill-considered basis in the first place, but you are still not man enough to apologise.
The sad thing is that you genuinely do not realise how contemptible your behaviour is.
You are once again up to your usual tricks, I find, simply ignoring those parts of a reply which are inconvenient.
You have just clearly stated that I was seeking to prejudice the debate by not mentioning high-efficiency solar panels.
For a start the debate was actually about roof tiles, not solar panels, and secondly as I have just re-iterated I nevertheless referenced a high efficiency system.
If you really want me to reply to some of your ludicrous and delusional posts, fine - I find particularly amusing your 'worry' about rising sea-levels overwhelming nuclear reactors, whilst not noticing that on your figures the whole of London is underwater anyway.
I suppose your delusions add to the gaiety of nations.
I just don't find ill-mannered ideologues' delusions consistently amusing.
David,
As is the case with so many of your posts, you are twisting things. You replied to two of my posts asking for a link to your quote, and, out of concern for your apparently unstable state of mind, I made one of those requests so brief that you could not have missed reading it when you replied. No, you were not unaware that the validity of your quote was in question, you just delayed.
Chris
Which bit is too difficult for you to understand?
I did not read your post.
I have a life.
Perhaps you might consider getting one.
You are up to your usual ill-mannered tricks - I note that you still have not addressed the fact that you wrongly said in the present thread that I did not refer to other technologies that would meet the criteria listed.
The only person you are fooling is yourself with your pusillanimous refusal to admit error - that is what is really sickening about dialogue with you, that when caught out you try to change the subject, and hope that no-one notices.
Did I reference other more concentrated forms of solar power or not?
duplicate post
Ahhh - but 100% conversion rates would not seem to matter.
There are around 24 million households in the UK.
They have an average of 48sq meters of roof and one needs 40 sq meters
If 1/2 the roofs are pointing the wrong way (e/w VS n/s) - the 48 sq meter average becomes 24 sq meter useful. Then subtract out shaded roofs et la.
100% conversion would require 5 sq meters.
Chris
But does that change the 24 million households, the 48 sq meters of roof or how less than 48sq would be useful for roof mount PV?
The goal of the guy was to debunk the leggett claim - going after the surface area of the roofs would be the best bet.)
(Ignoring the material needed to do all that PV or how perhaps solar hot water should be the 1st consideration)
In my previous post I said:
I have noticed that my arithmetic was in error, and that you would get around 0.96 of the average power output given the assumptions made, not the 0.72 I erroneously computed - however, that is just mathematics, and in practise the whole roof would not be covered seamlessly with collecting area.
Presumably though that is the sort of calculation that the people who said that you could generate all the power from rooftops were looking at, so the statement does seem to be in the right ball-park.
To generate enough electricity to cover needs in the winter you would need to go up to the level of efficiency the Sunrgi system, which operates at 37.5% instead of 12.5%, and would mean enormous surpluses in the summer.
Two factors to consider;
1. The claim does not refer to temporal aspects of the power generation (i.e., day/night),
2. PV panels still generate electricity under cloudy conditions.
http://ieeexplore.ieee.org/iel5/60/1859/00050805.pdf?arnumber=50805
Dang!
Eaten alive by Eric Blair! What a fate!
Snapping fangs aside, I agree with everything Eric is saying. Carolus, the point behind PV is NOT that a manufacturer is going to guarantee you a sunny day, and reimburse you for the cloudy ones. It is that this little string of Diodes/DiElectric Junctions IS going to give juice whenever there is sun hitting it.
A lot faster than that $120/hr service tech can get to your house, those panels will be producing the SECOND that the clouds pass. If Climate Change somehow leaves us with 'Permaclouds', then forget it, we're done for anyway. But these simple items, with no moving parts, no water needed, no monthly contracts, about an inch thick, no noise, no lubrication, no tracking (necessarily), no startup protocol.. etc.. WILL simply produce a DC Current in the presence of light. They don't solve all problems, but their Portability, Toughness and Long-term Reliability make them an incredibly useful and versatile tool as we face this challenge.
You don't HAVE to grid tie them. Your Desk Calculator doesn't, and if you use that Calc much, the payback against button cells was probably less than a year. You can run isolated loads in your house just on DC directly from panels and/or batteries, taking them OFF the grid power, and reducing your 'outside dependence' that way instead of dealing with a BuyBack deal with the utility, you just shift as much over to 'Plan B' as your panels/batteries can handle, which leaves you with a completely independent system that will keep certain circuits available, oblivious to grid availability and expenses..
I'd be cautious about the lease deals. What you gain in 'hassle-free', you may very well be paying for, making the economics Worse than what I've described.
Bob
Gallium arsenide for PV, copper for the all-electric economy and so it goes with the approach of an ever larger wave of Leibig's Law of the Minimum. The underlying reason for a rapidly increasing incidence of LLM is, of course, population. Fans of each respective energy producing industry, whether it's PV, wind, nuclear, geothermal or whatever, almost always talk about 'rapidly ramping up' the industry, sometimes with government mandated 'Manhattan Project' style marshallings of resources. Even the 'ramping up' of a single industry is causing shortages in other critical areas. I don't see any possibility of addressing the supply side of energy in a realistic way unless the demand side is radically 'ramped down.'
"I don't see any possibility of addressing the supply side of energy in a realistic way unless the demand side is radically 'ramped down.'"
Efficiency and substitutes.
For example: replace your light bulbs with CFL's. That cuts power usage for lighting by 70-80%. Quite significant.
Washing Machines and Tumble Dryers are huge electricity hogs: Wash your own plates and let the plates dry in the air. Likewise clothing. Instead of turning the heating up and wearing shorts and a t, turn the heating down and put on track pants and a sweater.
These are just some examples, there are more. If everybody implemented them we could get more out of what we already have.
There are many solutions to liquid fuels usage also that have scope for reduction in usage without too much impact.
These are all good ideas, but I fear they are but drops in the bucket. Already people are switching to CFL's in pretty large numbers. I don't see any effect from that (Jevon's paradox?).
My own seat-of-the-pants guess is that we (the USA) need to cut overall energy usage by 50% - 75% in the next 5 years or so in order to handle the decline in fossil fuels and all the knock-on effects this will have. I just don't see how this is possible by turning down the thermostat and screwing in new CFL's. With a congress that won't even consider stricter CAFE standards, what hope is there for top-down mandated changes? "If everybody implemented them" is always a non-starter. The overwhelming majority of people will react after the fact and it will likely be very messy and painful. Sorry, I'm having a bad morning.
People often cite Jevon as a reason NOT to pursue efficiency, i.e., when something useful gets cheaper, people use more of it.
However, we'll see if that holds up under the circumstance:
something useful, on which one depends, faces increasingly shorter supply and is going to get more expensive.
Well I am certainly not citing Jevon's paradox as a reason not to pursue efficiency. I just don't see that efficiency gains on the order of switching to CFL's or putting in extra insulation are going to be but a drop in the bucket compared to the powering down we really need to do. By all means, pursue efficiency. Just beware of the illusion it will make a big difference.
Spot on. And note that quite a lot of people have in fact turned down the thermostat and some have opted for CFLs. It's chiefly a question of people's rational, utility-maximising behaviour at individual level. Some will be willing to don a jumper and tolerate a living-room temperature of 15 degrees Celsius, hence saving enough moolah to buy a new iPod (or whatever); others will sacrifice the iPod and turn the thermostat up to 20 degrees Celsius. It's a question of consumer preferences and relative prices. Ask an economist.
It's important not to put the cart before the horse. It is not consumer behaviour that will affect the availability of energy. It is the availability of energy that will affect consumer behaviour. So don't worry. When the price of energy goes up, consumption will go down anyhow – and there will be no more need for moralistic, preacherman exhortations as to what you should do with your thermostat and your light bulbs. A small blessing, though.
BUT will they drive 55 ??
Missing in this article is any discussion of solar water heating. This is a mature, well-proven technology, deployed around the world. The EROI must not be too bad for it.
Even in the tropics, people still need hot water. Indeed, the tropics are the BEST location for solar H20 heating, because the sun is overhead year round, and because water doesn't freeze allowing for simpler systems. This may, perhaps, be a major reason why solar water heating is such a widespread solar energy application.
WNC Observer,
I had precisely the same thought -- but the question was so simple I was afraid to ask.
Yes, let's get the PV promoters to compare fancypants PV with good, ol'-fashioned home-made solar water heating, not with nuclear energy or fossil-fuel plants. Pricewise, EROEI, environmental impact.
Any offers?
Yes, let's get the PV promoters to compare fancypants PV with good, ol'-fashioned home-made solar water heating,
So let me get this straight.
You want to take something as 'useful' as electricity and you want to heat water with it?
Any offers?
Its a bad plan, taking photoVOLTAICS and making hot water.
Very true that taking PV and making hot water is a very bad idea.
But taking the sun that hits your roof and making hot water is a very good idea.
Space and funds allowing, both should be done, but thermal first, IMO.
Eric,
See clifman's reply. What I would like to see is a comparison of the EROEI for PV-generated hot water with that of solar water heater-generated hot water.
What I would like to see is a comparison of the EROEI for PV-generated hot water with that of solar water heater-generated hot water.
So you want to see a stupid idea compared to a good idea.
Why? What possible mental reason could a rational person want to do that?
Tell ya what. I'll do the math after YOU answer my question you failed to answer last week. We'll see how badly you want an answer.
They'd be really easy to compare, too, since a great many people who install either PV or Solar Hot Water will also install the other if they get the chance. It's not an Either/Or.. and now, it can be BOTH. I just saw the new Hybrid Solar installation of Ascendant Energy at the Chewonki Foundation (An Environmental Education Center in Maine with a Sustainable Energy Program), with a 3.4(?)KW PV array that also grabbed the Waste Heat from the back of the panels to work with the Building's Heating system. This has the compounded benefit of Helping Cool the PV circuits, which reduces their resistance and improves their energy output.
They are also working on a concentrated version that relies on Less PV and generates more Heat and Wattage.
http://www.ascendantenergy.com/
http://www.chewonki.org/pathways/default.asp
Best,
Bob Fiske
I agree. Not only that but with reasonably competent DIY plumbing skills a decent system can be installed in 2-4 days. Last summer I installed a 20 tube vacuum tube system wit a retrofit coil plumbed into my hot water cylinder. Total cost - £600 ($1200). Its now late April and even on overcast days the panel is reheating the ater from 2 showers in the morning. Without heating my gas usage is down to 3-4kwh a day.
I reckon the system delivers about 1700kwh of energy pe annum. Not bad for he UK climate.
This series has been very interesting! Thanks for posting it.
One concern I have is that the US electric grid is in very serious need of upgrading. Some talk of changing from an analog grid to a digital grid. The grid was not designed with the idea of buying back power from small solar producers, and it was not designed for long distances and intermittency of wind power. Once source claims the average age of transformers is 40 years old, which is the average lifespan of transformers. There would be a major need for upgrading and replacement, even if solar voltaic buyback and wind were not added, but adding them makes the need even more extreme.
At this point there is no coherent plan for upgrading the grid. There is no one organization that could design an appropriate new grid, collect the revenue to fund the upgrades, and actually make it happen. This is a major reason a major upgrade most likely won't happen.
My concern is that adding wind and solar voltaic will simply push forward the date when we have to cope with massive grid failure. I am sure this is outside of the boundaries of your study. This is a chart from a talk at the EIA conference earlier this month, showing the problem with increasing line congestion in one part of the US:
These are a couple of other references:
http://www.renewableenergyworld.com/rea/news/story?id=50777
http://energycentral.fileburst.com/EnergyBizOnline/2007-5-sep-oct/FA_Rea...
There is also material on the website of the North American Electric Reliability Council.
From an EROI analysis point of view, it would seem like it would be worthwhile to at least estimate the direct grid impacts of the new fuel sources - the cost of the new wires and line loss for wind, and the cost of the wiring to sell the solar voltaic back to the grid.
Gail,
Solar PV takes pressure off the grid since it reduces transmission capacity requirements. There is no additional cost for wiring in net-metering setups. The same wires that bring electricity to a house, also take it away. The main extra cost is anti-islanding electronics, which customers rather than utilities pay for.
Chris
This is what the North American Electric Reliability Council says (large PDF) about wind and solar:
It may not be the peak load that is the problem. It is all of the other issues related to the variability and numerous small entities acting as power generators.
We are seeing solar thermal with storage coming in as "remote" generation so I'm not sure they have quite caught the essence there. PV tends to be local though there are some farms as well.
Chris
I look at the grid differently.
In the early stages wind and solar should be integrated to suppliment fossil fuel production. For example, when the wind comes up, you shut down natural gas or coal generation saving 'cheap' fossil fuels.
We don't suffer from a shortage of electricity generation, just electricity generation of the wrong kind(baseload).
It's true that 'stranded energy' will require power lines to bring electricity to market but that doesn't effect most of the grid.
I would say baring plug-in hybrids exploding everywhere electricity consumption should decline near term.
When natural gas goes into depletion, I imagine that NG heat will be replaced with new tech heat pumps which are roughly the size of existing AC units and obviously we have the generation capacity for that load now.
A problem with the kind of nuke, coal plants we have now is that they are baseload types and so peak loading has to be handled mainly by hydro and natural gas. IGCC, which produces syngas can like natural gas generating plants act as peaking generation units.
When you do integrate wind/solar with fossil plants you save a great deal of fossil fuel--50% or more as have been shown by studies like Hybrid 2. When we get to the point where +50% of our total generating capacity(in 100 years) is by solar/ wind and we run out of IGCC-CCS coal then we will have to store excess renewable as hydrogen or in batteries,etc. But short run things are managable in the US.
The goal now should be to maximize renewable electrical generation and peaking generation capacity--we have almost too much baseload power.
Solar has the advantage in some areas in aligning with typical grid demand, if it can (like solar thermal) smooth over minute-to-minute variations in site insolation. Wind does not have this benefit, because windy periods are not correlated to electricity demand. Solar can be regarded in typical usage as load-following, so reducing the variability of electricity supply requirements. Wind has the opposite effect - it increases the variability of electricity supply requirements for the remainder of the power sources. Wind is "peaky" power but it's absolutely the opposite of "peaking" power. Only when coupled with a deep source of highly dispatchable power - and hydro is the only non-carbon source I know of for this - can wind be regarded as a power source that assists a transition to a non-carbon future.
I totally disagree that we have too much baseload, or even "almost" too much baseload. If ever electricity becomes ridiculously cheap at night, you'll know that we have too much baseload - and that will represent an opportunity, not a problem, in my estimation. As it is today, there are still "baseload" gas turbines running.
I think the issue is with transmission, rather than baseload vs peaking. I agree we need more, not less, baseload. Wind and solar are not baseload.
Regarding transmission, one article said:
It is somewhat like having a house wired when it was built in 1960, and wondering why it won't accommodate all of the fancy new appliances we are adding now. We built our grid way back when, have extended it in a piecemeal fashion, and now are adding fancy new types of generation to it and have ideas about smart metering and plug-in hybrids. We really need to a rewiring job that will accommodate all of the new technology, but pieces of the wiring have many different owners, and there is no coordinated plan.
Rebuilding the grid transmission system is absolutely one of the major tasks to do in the next couple of decades. It needs doing; I sincerely hope it will be done intelligently. Some long distance HVDC lines would be well used, I'm sure, but there is a huge amount of detail work to be done.
Some of the challenges that arise from updating an established (if creaking) system are good challenges. Starting from a blank sheet, the temptation is to design monolithically; but knowing that the grid update has to happen on a grid that is running, without stopping it, (like changing the wheel on a car in motion) pushes the process towards a flexible and updatable concept.
I disagree.
There is little new technology in transmission since Tesla and Westinghouse. It's really a very simple system.
The power utilities do monitor transformers for loading and correct for power factor with capacitors or condensers. Good old fashioned fuses do a fair job of coordinating cascading failure but slow-acting circuit breakers are a big danger. Another problem is that the conductors themselves have to be replaced due to age and use, but again this is exactly what the utilities are supposed to be doing now.
On the demand side, people are looking for cleaner power and that's a separate problem. Smart metering is just another meter with an antennae on it and is used to adjust the bill to deduct for the owner's renewable power. It's not rocket science.
Utilities HATE local generation like solar and wind or even gas generators because if they short out they could bring down the grid. It's better to MANDATE that the utility use a given percentage of renewable power from their wind or solar farms. Private owner should be (mainly) off-grid with his own renewables.
Some power generation solutions might be very local, and not utilise transformers but provide power at 20V not 11,000:
http://www.nanosolar.com/blog3/2008/04/16/municipal-solar-power-plants/
Nanosolar Blog » Municipal Solar Power Plants
2-10MW solar plants are envisaged here, ground mounted to save further costs.
They would match well with peak power requirements in hot areas, and in many areas of the US could be combined with wind turbines and the production of biogas in an integrated system such as the Germans provided in this experiment:
http://www.treehugger.com/files/2008/02/germany_gets_cr.php
Germany Gets Creative with Renewables : TreeHugger
For much of small-town America, this would seem to provide adequate power, with many of the costs off-set by savings on transformers and lines.
It should be noted that biogas can be got from all sorts of waste, and where agricultural residues are used it requires much less land than corn ethanol:
http://biopact.com/2007/12/biomethane-presented-as-most-efficient.html
Fuels compared
The use of such systems would seem to offer the potential to take pressure off the grid, although it should also be noted that wider connectivity would help to even out intermittency.
re: transformers
Inefficient transformer standards are the subject of yet another California lawsuits, although this time, it's the DOE, not the EPA. If many of them need to be replaced, it would be nice to use better technology.
If the utility companies are in favor of more efficient transformers, why do we need regulation? Can't they just buy 'em.
This is a minor detail, but the percentage of electricity generated from coal will vary quite a bit, depending on when the study was done. In general, the older the study, the higher the percentage of coal.
You say, "For example, in Colorado 94% of electricity consumed is produced by coal fired generation power plants." If you look at current EIA data you will find that in 2007 a total of 52,954 thousand megawatt hours were produced in Colorado. Of these 36,067 were produced from coal. Dividing these numbers produces a coal to total ratio of only 68%. I expect that in 2008, the percentage will be even lower than 68%, because of increasing use of natural gas.
I'm a bit puzzled about the Passive Solar entry. This analysis seems to take the very 'narrow' view of what passive solar is, i.e its more about catching sunshine than minimising the overall fossil fuel demand of the building in a cost-effective manner.
IMHO it's better to take the wider view and define 'passive solar' as solar energy plus airtightness plus decent wall and roof insulation (which seems to have been left out of the list of features).
It's nice to see that my book chapter in the Open University 'Renewable Energy' book has readers. Our experiments in the UK in the late 70s led to the conclusion that the insulation was the major factor in saving energy.
So I have to ask 'will there be a separate EROI entry for 'Passive House'(i.e.superinsulated) design?'
For example see
http://en.wikipedia.org/wiki/Passive_house
EROI analysis of wall and loft insulation thicknesses for houses in the UK suggests very healthy results. It all depends on how thick you want to make it. I'd expect EROIs in the range 20-100. Insulated glazing is likely to have lower figures. Also it's not just about new-build (which is pretty non-existent here in the UK) its more a matter of retrofitting the existing stock (as the Germans are doing).
Herman Daly pointed out that the truly sustainable use of fossil fuels is to provide an equivalent flow of renewable energy after it has gone. I would extend that to say that you should use fossil fuels to insulate the building stock so that you don't need to keep shovelling heat in.
According to the EIA stats, US residential space heating energy use in 2001 was 4.6 quads. I would guess that half of that, 2.3 quads, could be saved with a vigorous application of retrofit insulation.
I make that about 1 million barrels of oil equivalent per day (every year for the life of the buildings) though this will probably be taken in reduced gas consumption.
It seems a lot simpler than drilling endless holes in 10,000 feet of sea to find some more.
There was nothing about the EROI on solar domestic hot water. From a $ standpoint, this usually has a higher ROI than PV.
For the arguments of the detractors of Hydropower you did not make it clear that fossil CO2 emission also comes from the manufacture of the cement used to construct a dam. Does the biosphere carbon released from flooding and killing plants greatly exceed the fossil CO2 emission from manufacturing and transporting the concrete?
Passive solar homes lack privacy because people can easily see in through the windows. All but the most dedicated homeowners install blinds, curtains, awnings or grow plants in front of their windows to solve the privacy issue. Look in the photo gallery of The Solar Settlement (Solarsiedlung) in Freiburg, Germany to see what people do to block the view. A Trombe wall can create a room dedicated to solar heat storage on the south side of the house solving the privacy issue.
Low-E windows are currently a high priced, high tech and low performance solution. Their thermal resistance declines as they age. Infrared reflective coatings are warrantied for 10 years making me suspect they do not last any longer. Argon between to panes of glass invariably leaks out. A more cost effective and durable method is to install insulated shutters or manually place insulated inserts into windows at night and remove them during the day. Inserts can be made from cardboard, paper shopping bags, staples and a little paint for durability and aesthetics. Would a R-10 window actually provide that much insulation over the 100 year lifetime of a house?
R-12 windows make even north facing windows energy positive. The annual energy savings for converting US homes is about $15 billion/year: http://www.nextenergynews.com/news1/next-energy-news2.27b.html
I agree that drapes or shutters make sense presently.
Chris
Somewhat on topic, my colleague Kenneth Mulder and I had the lead article in this months AMBIO - Journal of the Human Environment
"Energy Return on Investment - Towards a Consistent Framework".
I also wrote the editorial for the issue and we chose the cover photos(a montage of oil sands and Athabasca River images). I think you need university access to read the paper - when/if I have time I'll write a summary here.
The fundamental problem with a Consistent Framework for EROI is that it would be a consistent framework for an abstraction that does not reflect the real world. It would be like a consistent framework for Metal Return on Metal Invested. It is useless.
I have often cited the case of MROMI for a gold mine. Suppose that 10 pounds of iron are used for shaft supports and such for each pound of gold produced. The MROI is negative and no gold should be produced according to MROI logic. This is nonsense. The same applies to EROI.
There are important highly relevant factors outside the data set of EROI. Ignoring them is stupid, but that is what a simple minded approach that measures one characteristic of an item and then generalizes and compares to all items in the data set regardless of differences does. This is a gross error of logic. No valid conclusions can be reached.
Just as ignoring the price of gold in the gold mine makes MROI into nonsense, so does ignoring the price, utility, renew-ability, locality and environmental impact of various forms of energy make EROI into nonsense. Perfecting measuring the weight of iron and the weight of gold, does not make the nonsense of MROI less. It is still nonsense only more perfectly measured and compared.
This fallacy seems to be beyond the reach of academia, especially engineers and those who are numbers and data fixated. EROI is a simple minded fallacious approach. It can only help is tightly controlled comparisons where factors like price, utility, renew-ability, locality and environmental impact are very similar and therefore not a consideration.
Using EROI only to allocate resources is beyond stupid. It is malicious.
If you had actually read my paper, you would have seen this was exactly the core premise.
My next post is going to be on cognitive dissonance, self-deception and why people don't learn but stay ensconced in their own world belief despite facts. You still don't get it. I have never advocated using EROI to make decisions. What I have said is that a)the negative externalities of biofuels are far greater than conventional oil production, b)we can't replace a 10:1 liquid fuel with a 1.3:1 liquid fuel unless the main energy input is of extreme abundance and low quality (diesel, natural gas and electricity in case of corn ethanol), and c)as oil depletes, we are going to have a Henry George type increase in economic rents on land. Since you are a landowner, you are going to win whatever best use science/politics comes up with for land. Corn ethanol for certain counties in Iowa, etc. may be a great idea. For a nation or a world its a terrible idea. Malicious even.
Remember, we are not addicted to foreign oil. We are plain addicted to oil
Energy Payback of Roof Mounted Photovoltaic Cells, Energy Bulletin, Colin Bankier and Steve Gale, June 16, 2006.
The document contains a table listing the ranges of EROEI for PV systems from various authors. The best payback time is .7 years, and the worst is 25.5 years.
And out of 32 estimates, only 5 were over 8 years.
What part of the analysis does the costs consider? PV units manufactured in factories? PV units delivered across the country to customers, and installed on rooftops of existing homes? PV units installed in large installations commercially?
My guess is that they are mostly EROIs of PV units manufactured in factories without all the add-on costs and expenses. If a lot of the units are made in China (and I don't know that they are - this is a question of fact), the low cost could reflect low Chinese labor plus the low cost of Chinese coal for production.
Gail,
China will likely become the largest producer this year.
In terms of energy delivered per unit mass, silicon is about 200 times better than coal so most of the extra energy is in the balance of the system (materials) rather than in transportation or labor. Shipping silicon is about the same in relative energy cost as shipping uranium.
Chris
These various sophisticated forms of alternative energy production are great. They provide methods of energy generation beyond fossil fuels, which may help a developed country's infrastructure on the local level to sustain technilogical advances like computers, microwave ovens, lighting, etc. However they probably will not be sufficiant to save the billions living on a few bucks a day. Oil made that possible, so unless a substitute is developed to support those masses with cheap energy, their time ahead as oil descends from peak will be more and more challenging.
Does anyone here have a handle on oil substitute's beyond food based ethanol, like algae ethanol or ecoli synthesized fuel? Seems like we need to scale up for mass production of a substitute form of oil, and I know efforts are underway to accomplish this, however what seems like an unknown for many is how potentially viable they are. Anyone here versed on this area of R&D and how it is progressing? Does it hold promise?
I would think that each wind farm should have a local power buffer to smooth out the load going into the grid. I think a flywheel system would be ideal for this application. I have not seen anything that is being developed for this application. Flywheels are not as efficient at storing electricity for long term use, but they should be very effective for the ups and down of wind energy
This is being done in the Azores: http://www.pcorp.com.au/index.php?option=com_content&task=view&id=37&Ite...
With a more diverse distribution of wind sources, such fast response is probably not needed. The big problems with speed come from the nuclear power plants which are intrisically unsafe and thus will go off line with no notice to deal with recurrent emergencies. In those cases, you need both a fast response and a big response. Superconducting magnetic storage may be able to help there though presently it is only scaled to handle loss of load from manufacturing plants.
Chris
This article does not seem to take into account another form of solar climate control called Sun Lizard at TreeHugger.
Sun Lizard home page.
Depending on where you live you could also consider connecting the cooling vent to a series of buried pipes that will be cooled by the earth and remain at a constant temperature...
Ground Source systems do the above -looks like they are trying to provide a slightly cheaper option.
Nick.
Panel solar photovoltaic comes with the grid "built in", unlike concentrating solar where you have to shove the electrons down the same overcrowded power lines being used for coal, nuclear, hydro, and gas turbine power.
This is a really important feature of panel solar vs concentrating solar since most of the cost of electricity is distribution and not generation.
The load on the distribution system is maxed at the same time as the load on the generation system. Solar power would have avoided all the major blackouts of the last thirty years, and at less cost than the financial consequences of the blackouts.
Why not use the solar power to convert CO2 to gasoline? Companies would pay to get rid of their CO2. Wouldn't gasoline or jet fuel be a more valuable storage solution?
Please explain how Gasoline or Jet fuel would be a CO2 storage solution.
Nice to see this all attempting to be put under a consistent framework here. The large EROI's for hydropower now suggest strongly that there could actually be much larger potential than is typically assessed (the 2500/3800 GW number) if we were willing to go to considerably lower EROI's.
For example, instead of using natural valleys with narrow outlets as locations for dams, if some relatively inexpensive way could be found to reshape the landscape in a suitable high-rainfall area (after all, we're blowing the tops off mountains to get at coal now!), considerably higher total gravitational potential could be retained by the water. The total available from the energy of evaporation of water around the world is something like 40 million GW (a significant fraction of incoming solar energy goes to evaporation of water). Obviously not all of that would be available from rainfall, but it's ultimately the second largest renewable energy flow (aside from direct solar) - and in particular, many times larger than wind.
In any case, I think all this pretty conclusively proves there's plenty of energy out there at adequate EROI's; we just have to be willing to make the necessary capital investments.
Concerning the hydropower, it's unclear if the stated emissions contain those of the cement input, which are significant for most hydroelectric. Does it include them?
All the emissions look very low for the solar and wind. I'll have to take a look at some of the sources to see what was included and what wasn't.
The hydropower potential seems extraordinarily high, too.
I think that the greek word is heliocaminus not heilocamini.
If you'd like to learn more about what the experts are saying about the future of renewable energy, I suggest you check out the Renewable Energy Finance Forum-Wall Street, held June 18-19, 2008 in New York City. The event provides financiers, renewable energy project developers, and other industry stakeholders an opportunity to network and share ideas about the future of renewable energy finance. Over 40 high profile industry leaders will be speaking at the event, discussing topics such as biofuels, solar power, wind energy, market drivers, and more.
For more information, visit http://www.REFFWallStreet.com.
Will Enhanced Geothermal Systems (EGS) be addressed at some point? Over 100GW are projected as feasible in the US by MIT, and Germany has the potential for 600 times it's current electricity need, according to Hochtief;
http://web.mit.edu/newsoffice/2007/geothermal.html
http://www.hochtief.com/hochtief_en/200.jhtml?pid=7878
Another important solar technique to consider for EROEI is solar seasonal borehole thermal storage.
http://www.dlsc.ca/how.htm
"Passive solar houses tend to have temperature fluctuations greater than the average conventional house and 75% of heat energy is needed at night (Wayne 1986)."
I can see that that's referenced info, but I always thought passive solar houses have more thermal mass than an average conventional house, which would flatten the temperature curve. Assuming other things are equal, of course, possibly the big one being the total amount of glazing. The 75% figure strikes me as mysterious as well.