The Generalized Hubbert Curve
Posted by Gail the Actuary on October 26, 2010 - 10:20am
This is a guest post by Steve Mohr and Geoffrey Evans. Steve is a recent Australian PhD. He and Geoffrey Evans also wrote Forecasting coal production until 2100. We also published a summary of Steve's thesis, Projection of World Fossil Fuel Production with Supply and Demand Interactions.
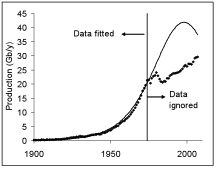
It is important to know the timing of when a resource will peak. It is ideal if a model of the likely production could be determined quickly, easily and accurately. The Hubbert Curve has been used frequently in the literature because it is quick, simple and, as shown with US oil production, accurate. But there is a problem, what to do with production statistics that do not conform to the Hubbert curve e.g. world oil production?
Solutions exist, but are not ideal, for instance, the disruption could be ignored and a Hubbert curve used anyway, but that tends to generate a poorly fitting model to the data. Alternatively a multiple Hubbert Curve technique could be used, but then the fitting is more complicated and the justification that production should follow the path becomes more difficult.
There is a solution: The Generalised Hubbert Curve[1], which is defined as:
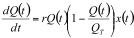
Where Q(t) is the cumulative production, QT is the URR and r is the rate constant, as per the Hubbert Curve, and x(t) is the intervention function. This can be solved to obtain:
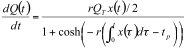
The intervention function is defined as:
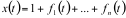
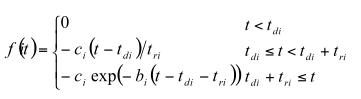
where fi(t) represents a disruptions and is given mathematically as
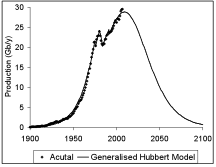
Trivially, with no disruptions we have x(t) = 1 and the Generalized Hubert Curve, becomes the usual Hubbert curve. An interesting aside, is to observe that the annual production of the Hubbert Curve and the annual production of the Generalised Bass Model are identical [1].
Perhaps an example will help. Let us use oil as the production data is well known and there were disruptions to production. Apply the following steps:
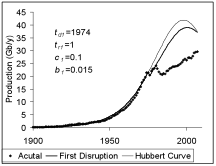
1) Fit a normal Hubbert Curve to the production statistics BEFORE the disruption occurred (<1974). Typically the URR QT is known from literature/your own judgment. For oil, let us assume it is 2234 Gb. r and tp can be determined via Hubbert linearization or by eye, and we’ll say they are 0.075 and 1998. From this we obtain Figure 1A:
2) Look at the first disruption fit td1, c1, b1 and tr1 to the production statistics during the disruption This is easier than it sounds: td1 is known (~1974 first OPEC crisis), c1 controls how far the production decreased, tr1 controls how long production was decreasing (1 year), and b1 controls how quickly the production recovered (Figure 1B).
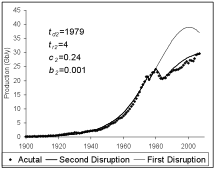
3) Repeat step 2 for the other disruptions.
If you're interested in trying out the model yourself, go to the attached Excel spreadsheet.
[1] Mohr, S. H. and Evans, G. M. “Combined Generalised Hubbert-Bass Model Approach to Include Disruptions When Predicting Future Oil Production” Natural Resources, 1(1) 28-33, 2010.
Contact
- Content: editors at theoildrum dot com
- Tech support: support at theoildrum dot com
License

This work is licensed under a Creative Commons Attribution-Share Alike 3.0 United States License.
Hubbert curve modelling, whatever the form, only make sense if you have access to a decent estimate of the upper limit of production or if the decline is well advance. If it is not the case, you will always end up with a peak in the near future. This is often forgotten by "curve fitter".
Worse yet, Hubbert originally really intended for this curve to model discoveries.
I can derive the Hubbert curve logistic function for discoveries. The model is called Dispersive Discovery.
There are no real disruptions in discoveries, only noise.
The actual production is modeled using something like the oil shock model. With the shock model you have real disruptions, what I call shocks or perturbations which effect the extraction rate from the reserves of previous discoveries.
It is really sad that the ridiculous differential equation (the logistic Vehulst equation) has captured our imagination.
It doesn't describe the actual statistics at all and it leads to all sorts of wrong conclusions.
Oil discovery and production is not a deterministic process, yet that is what the differential equation is implying.
I've often thought that the oil global production curve was largely defined by catastrophe theory. There was an initial cusp catastrophe back in the 1970's followed by a series of hysteresis loops in which the system alternately followed one solution, jumped to the other, followed the other back, then jumped back to the first.
However the basic solution is really defined by the Hubble curve (essentially a logistics curve) and eventually the hysteresis loops will settle down to one stable solution, which will basically resemble the Hubbert curve.
Unfortunately, nobody with the right mathematical skills seems to have followed this line of exploration. Everybody expects oil production to follow some kind of smooth curve, and if I am right, that is wrong. It won't be smooth at all. I'm not going to do the math because I'm retired and I don't need to get a PhD at this point in my career. (That could be fun but way too much work.)
However, eventually oil production will settle down to a basic Hubbert curve, and then it will all be predictable. Unfortunately that will be much too late for a lot of people.
Absolutely right.
This obsession with splitting ever finer curves is not serving the peak-oil community well and, as has been noted here many times before, there is little predictive power. Especially when one is so narrowly focused on production alone. It begins to remind me of the absurdities encountered by our erstwhile protagonist in the book "The Phantom Tollbooth".
First of all, Hubbert himself pointed out that his analysis is critically dependent on having a good estimate of URR, and he explicitly gave a range of possible URR in his estimate of both US and world production. It is pointless to waste time trying to pinpoint the peak when a range of estimates will do just as well.
Second of all, Hubbert himself noted that unforseen disruptions in the rate of production can greatly flatten the idealized curve. It is pointless to waste time splitting ever finer idealized curves when one flattened curve will do just as well.
Third, Hubbert himself used three distinct analysis in his estimates:
1. COMPLETE CYCLE ANALYSIS

Hubbert prediction of 1956 of future production of crude oil in the conterminous United States and adjacent continental shelves.
2. CUMULATIVE STATISTICAL DATA


Variation with time of proved reserves (QR), cumulative production (QP), and cumulative proved discoveries (QD), during a complete cycle of petroleum production.
Variation of rates of production, of proved discovery, and of rate of increase of proved reserves of crude oil or natural gas during a complete production cycle.
3. DISCOVERIES PER FOOT OF EXPLORATORY DRILLING

Estimation of ultimate crude oil production of the conterminous United States by means of the curve of discoveries per foot versus cumulative footage of exploratory drilling.
All of the above figures and quotes are taken from Hubbert's paper "OUTLOOK FOR FUEL RESERVES" which I transcribed for publication on this very website several years ago.
Unfortunately the TOD editors completely ignored me, and the peak-oil discussion here continues to suffer this myopic obsession with splitting production curves, decades after Hubbert himself employed a variety of statistical analysis for discoveries, production and reserves, in addition to using a range of estimates for URR.
Pity.
Cheers,
Jerry
DISCOVERIES PER FOOT OF EXPLORATORY DRILLING
There's a fundamental flaw with estimating future discoveries based on feet of exploration drilling: In any particular oil province there will be a certain depth below which you will find little or no oil.
There are a couple of reasons for this.
The first is that oil formation was a very rare occurrence, but where it did occur, it occurred on a large scale over long periods of time. This is why most of the worlds oil is concentrated in only a few countries. In these countries, oil formation may have occurred multiple times, but there was a first time. Below the lowest source formation, you will find little or no oil. (You can never say never, because sometimes oil breaks the rules and flows down to a lower formation rather than up, but this is extremely rare.)
The second is that if oil has been buried too deep by sediment formation, it will have been destroyed (turned into natural gas) by heat. In any producing province there will be a "hot line", below which you will find nothing but natural gas. Again there are anomalies, like the Gulf of Mexico where the subsurface formations seem to have been abnormally cold and you will find oil a lot deeper than you would expect.
These two things really screwed up US geologists during the 1970s. They had assumed that the deeper they drilled, the more oil they would find. No. Didn't happen. US oil production peaked in 1970 and that is the highest it will ever be. Drilling deeper doesn't find more oil (other than in the GOM where they haven't hit the bottom yet - but they will).
Yes indeed, and that uncertainty in where the oil resides is the foundation of the Dispersive Discovery model. I wrote about it in this TOD post:
http://www.theoildrum.com/node/3287
In the introductory post (http://www.theoildrum.com/node/2712), I explained it in terms of searching through a haystack where you didn't know where the "bottom" or volume of the needles buried in the haystack was. You would send people searching through the haystack and many would over-search and thus come up empty because of their uncertainty in their knowledge of the depth. This is Probability and Statistics 101.
This leads to the hyperbolic reserve growth function if the cumulative search effort is approximately linear with time (i.e. steady effort) and it gives you a logistic if the effort grows exponentially with time (i.e. accelerating search effort).
This is a universal framework because it explains much more than the Hubbert curve; it actually helps to explain what is actually happening in fundamental probability and statistical terms.
You should read his papers before you criticize his work. His reasoning is published and has stood the test of time, and of a lot of frantic objections from people who were really upset with the practical implications of his work.
The discovery wells were being drilled by USGS on a square array that had been planned to cover the whole of the contiguous lower 48 States. Each well was drilled according to the same protocol, in order to keep the data comparable. The data was not some cobbled together collection of reports of wildcat drilling, but rather, it was gathered according to a serious scientific plan that was paid for by Congress at the behest of the oil industry.
The criterion as to when to stop drilling a particular well was specified in the plan. It was not determined by the happenstance of whether the wildcatter had enough money to complete his venture. I think the wells were planned to go until they either found oil or until they found hard rock under the deepest layer of sediment. It was a project that the USGS took as seriously as the Atomic Energy Commission took the development of electric power generation from atomic piles. And it was colored by the same kind of mindless industry support that was present for Atomic Energy. The project was expected to take many years, and was a recurring major item in the appropriation budget of the USGS.
I did an analysis of these curves on this TOD posting a few years ago:
http://www.theoildrum.com/node/3287
Hubbert fit these to exponentials but they IMO worked much better as dispersive hyperbolic examples, which supports RockyMtnGuy's observations.
The hyperbolic always occurs when you have uncertainty in the depth or volume of the area you are exploring. As RMG says, they likely have a fixed depth but you lack this knowledge when doing the exploration so you end up oversampling and the hyperbolic results.
Interesting that they had a methodical approach, but you can't escape from nature's entropy.
WHT,
Looking at your plot, I would guess that the dispersive curve and the exponential curve have almost exactly the same asymptote. They seem to be converging toward the right hand side of the graph. What are the actual numbers of the two? The last four or five data seem to be transitioning from following the dispersive curve to following the exponential curve. I honestly don't see that one should be preferred to the other as a meaningful fit to the data. Hubbert concluded that the value was somewhere between 150 and 200, which both are. An asymptote is the very essence of an extrapolation, which we should never do according to conventional wisdom. Are you arguing that dispersive curve is somehow less a violation of conventional wisdom than an exponential curve? I don't understand. They both give the same answer to the precision that is needed to support the practical conclusion that Hubbert drew. What am I missing? What is wrong/immoral about violating conventional wisdom?
Because that is just about what every creaming curve and reserve growth profile looks like. They all have this long and fat-tail which is characteristic of the dispersive hyperbolic. The exponential has a thin tail and goes to the asymptote quickly. If we want to understand the behavior of reserve growth, you have to acknowledge this fact.
The other point is that the dispersive curve is the first step to getting a logistic. All you have to do is accelerate the growth in an exponential fashion and you will get the Hubbert Logistic. The exponential compensates the fat-tail and you end up with something that looks like it does. That is the reason it has been overlooked all these years -- it is essentially impossible to untangle compensating effects unless you build up a first-principles theory.
To me this isn't about accuracy, it is about understanding and making sense of the behavior in a universal fashion. Sure, you can go ahead and pick any curve you want and claim it is more accurate, but that becomes the definition of a heuristic, and that is something I never had an interest in pursuing.
I think you misunderstand my position. I am not claiming one is more accurate, but that the data does not select one and they both lead to the same answer to the question of the numerical size of the URR, which is the thing of practical importance. There was no possibility of reserve growth in the way the data was gathered. The data were all collected according to the same protocol under the same scientific management team. Reserve growth happens in a productive field that is actively managed with the intent of maximizing some weighted combination of short term profit and long productive life of the field. For these data, once a single well was drilled according to the protocol in the particular place, the drilling crew is moved to a next location on a list of locations that was thought to be far enough away that the data from the new well would be statistically independent from the previous well. The whole data collection project was intended to provide a scientific measure of URR for the contiguous 48 States. At no time were any of the wells produced for commerce.
But still, I'm OK with using the dispersive curve equation to fit the data. I saw two curves on the graph. You quoted the asymptote for one. What is the asymptote for the other? I'm curious.
I would argue that is exactly how reserve growth works. You keep on exploring more of an underground volume and you end up picking more oil by a law of diminishing returns. The law of diminishing returns is the hyperbolic and not the exponential. This is borne out by my statistical theory and by empirical observations.
You are also asking for the asymptote. Its pretty clear the exponential asymptote is 172 max
I think you totally misunderstand the metric "feet of exploration drilling". It is simply a proxy for the total amount of drilling that has been done. Over time more footage usually means more wells (drilled on more prospects), not neccessarily deeper wells.
If you look at the exploration history of most basins you will find that that typically the earliest wells (when little was known about the basin) often go quite deep. As more is understood about the basin (especially if someone actually finds something) drilling tends to get concentrated down to the horizons that appear to have the best chance of success. That is until someone comes along and makes a convincing case that deeper horizons may have potential, and convinces management to spend the money to drill. If successful, then everybody else tries to get in on the act. If unsuccessful, the others just say "we told you so".
It isn't only about heat flow, but also about lots of other factors, for example compaction and diagenesis. These in turn are in part dependent on the size and type of grains in the sands. Nice pure, clean, coarse grained quartz sands can withstand a great deal more compaction (depth of burial) than sands composed of rock fragments or with lots of clay between grains. Geology isn't as simple as some of you guys seem to want to make it.
I've worked in the industry for three decades and I can't recall anyone ever making the simple minded assumption that deeper drilling meant more discoveries. It is almost always tougher to convince management to drill a really deep test for the simple reason that it costs a hell of a lot more.
That's because four decades ago they discovered that it didn't work. Up until that time they had assumed that the deeper they drilled, the more oil they would find. (The USGS was one of the worst offenders in making this assumption.) Then oil prices skyrocketed and they could get the money to drill those deeper wells that they never could afford before. They drilled them and they were dry holes. It was a bad experience for everybody involved.
Rockman could tell you all about it because he was there when it happened. I was there too but I was more involved in enhancing oil recovery and cutting costs through automation. We'd already found all of the big oil fields we were going to find.
Exploratory drilling goes after goephysical research data. Obviously if the data is unreliable the drilling result will be the same. Now success rate is about 25%. What happen if success rate reaches 75%? If it is so, Peak Oil will by removed to the future
See http://binaryseismoem.webly.com
Then they sooner will find much more oilfields in the 0,1-1 Gb range and some in the 1-10 Gb range.
No.
Thank you for comment. But I do not undestand, why NO. May be a little bit?
Peak oil won't be moved to the future (or rather the plateau will not be extended) because it's already too late for that. Finding a bit more of the oil that's left faster might make the decline curve less steep but at the cost of a steeper drop off later.
Plus, improving the likelihood of finding the existing oil doesn't magically make more oil appear underground. Your technology might make it cheaper to find the remaining oil, though.
No cheaper only but three time faster.
Time between discovery and oilextraction is about 10 years for deep offshore fields.
For all - I'll address a couple of points that have been bouncing around.
Success rate from seismic: This has truly changed the game. We’re magnitudes better at identifying potential oil/NG traps than we were when I started 35 years ago. As I type I’m sitting on location as we finish logging a 17,500’ wildcat in SE Texas. Dry hole cost around $7 million. Without the advent of new 3d seismic this well, as many others in the play, would never have been drilled. Not just because of the improved success rate but because there is no geologic data to even hint at a potential to drill in this play. Now the sad news: we just drilled a dry hole. As we say: sh*t happens. But here’s the other side of that story: the new 3d seismic has greatly improved our success rate but it may have killed as many, or more, drilling prospects, than it caused to be drilled. There are plays where the 3d is so definitive that most companies won’t even review a project let alone drill it if there’s no 3d support for it. In the old days many wells would have been drilled on the old 2d data because that was all we had. New 3d data isn’t always correct (as shown by my new dry hole) but very seldom does it incorrectly condemn a prospect.
Here’s another factor that impacts the footage metric: we just drilled a 17,500’ hole to test a seismic anomaly that covered about 100 acres. Even if it had worked it would have only been around 8 bcf + 200,000 bbls of oil. Around 30 years ago I was drilling 10,000’ holes (which cost about 30% of what a 17,500) hole would cost) to test a 1,000 acre anomaly that might hold 40 bcf. So not only is the deeper drilling more likely target NG than oil but they cost a great deal more per foot and, more significantly, looking for a lot less value per foot drilled than we did in the past. I’ve seen the footage metric used many times and it was meaningful. But in those cases it was used WITHIN a trend. The discover rate per foot drilled is a useful number in the deep Yegua play in SE Texas. But it absolute meaningless to compare it to the DW GOM Eocene play or the deep Miocene play in Plaquemines Parish, La. It’s not just comparing apple to oranges IMHO. It’s comparing horses to Volvos IMHO.
Bottom line: we have a pretty good success rate (ignoring my current dry hole) using 3d seismic. But we are being veryy successful at finding relatively small NG reserves at a rather high cost.
Are you in the Bossier play, by any chance?
geo - Nope...deep Yegua. A great disappointment given some of the great wells that have been drilled in the trend. Now our big problem is figuring why the seimic lied to us.
"Now our big problem is figuring why the seimic lied to us."
Them damn geophysicists! They'll get you every time. ;-)
May you have better luck on your next one!
Seismic lied to us becouse 2-3D seismic investigates undergraund structure, no fluid contents. New seismo-electromagnetic technology investigates fluid contents, no structure. It gives 75+% drilling success rate.
"Seismic lied to us becouse 2-3D seismic investigates undergraund structure, no fluid contents. "
Not true at all. Modern AVO seismic does tell you something about fluid contents. It isn't fool proof, but it does work.
geo - That's exactly what bit us in the butt. Amplitude anomalies, as direct hydrocarbon indicators, have been working well in the trend. It may have been a problem with the migration program. I ran a check shot survey late last night and the geophysicists are working with it right now to explain our false positive. It will certainly slow up our drilling efforts in the play until we figure out what went wrong. Around 90% of the $100 million we've spent drilling in the last 12 months targeted 3d AVO anomalies. And I have two geophysicists who are probably in the top 1% of the field working on it. The real problem is that we are drilling deep wells hunting for small targets...pretty much at the cutting edge of the technology. As you know sometimes the pioneers get the cheap land...some times they just take an arrow. Right now I'm feeling a little like a pin cushon.
"Modern AVO seismic does tell you something about fluid contents."
Something is not enough.
New technology gives fool proof. It uses new physical phenomenon:
interaction seismic and electromagnetic waves in rocks with two phase fluid: salt water and hydrocarbons. It is easy:
Electromagnetic wave charges two phase fluid and seismic wave discharge it by moving the fluid into pore space. The discharging generates electromagnetic response.
Only, rocks with two phase fluid give detectable response on the surface. We outline the rocks, determine the depth and thickness the pay. Depth of investigation is 18,000 ft. It provides 75+% success rate. I can demonstrate it on known pays.
Geolog:
You sound like a sales guy for another snake oil company.
"Another snake oil company" is modern civilization which has huge energy problems with changing energy sources. Additional time for the changing will be good reason to change conventional exploration technology (seismics).
Alaska - I've actually used EMT successfully in the past with the first time in 1985. I can't begin to explain the technology but that didn't stop me from setting up a field test that worked. But like all tech it doesn't work everywhere. You have to go into each trend and do a test model.
But when it works it is truly freaky and completely unbelievably. Imagine a small box half the size of a microwave that records an audible signal full of white noise. The an interpreter sits in a sound proof room, listens to the noise and then draws a lithology log AT DEPTH that accurately predicts (within a few feet) the top of a sandstone reservoir at 4,000' (actually can work below 15,000' but have never done one that deep). I use a company out of Dallas (Geophysics International). Trust me: even when I've shown folks examples where it has worked most still won't believe it.
Maybe geolog is a peddler but that doesn't change my background with EMT. Check out GI website if you like. One interesting aspect: GI knows they can't predict if their EMT system will work in your particular project. So they let you do a test model...FOR FREE. If it works...they have a new client who pays. If it doesn't then you're out nothing but a little time. FYI: I've had to wait weeks to get the equipment because one of their clients often has many of their units in the field. That client: Marathon Oil.
Geolog & Rockman:
OK, my bad. I guess maybe I need to be more openminded. It's just that in my experience, when something seems 'too good to be true', it usually is. I'll study up on it. Sounds like more of an exploration tool, and these days I'm just planning development wells, but maybe sometime I'll get a chance to try it.
No problem Alaska. You could be one of the most open minded guys in the biz and if I showed you some of my work the odds are 50/50 you still wouldn't believe it. I do not exaggerate when I say it's truly spooky. Has exploration potential but I find, for a number of technical reasons, it has more applications of the development side especially when there's a strong stratigraphic component to the play. Check out Geophysics International. My first proven results with them was 25 years old. Damn..that makes me feel very old just saying that.
I recently wrote a short article critiquing Hubbert Linearization. I would love for the bright folks that frequent TOD to review my logic/argument.
http://theseventhfold.com/2010/10/11/hubbert-linearization-debunked/
Thanks in advance,
DA
I left you a couple of comments:
I’d say your critique is absolutely correct. I find the most striking point in the residuals plot. By the way, you might want to number the charts/figures to make reference easier.
I’d also note that the design of a HL chart makes the data appear somewhat linear at a casual glance, even if the data really aren’t very close to being linear. It’s a good example of the danger of “eyeballing” data instead of using quantitative analysis.
-----------------------------------------------------
I agree that Peak Oil is a very serious problem. On the other hand, describing at a “master resource” goes too far. Oil can, and will be replaced.
Here’s a a more detailed argument: http://energyfaq.blogspot.com/2008/09/can-everything-be-electrified.html
and for shipping: http://energyfaq.blogspot.com/2008/09/can-shipping-survive-peak-oil.html
I think you’ll find them worth your time.
I think it is a very thorough critique. The more of these analyses we have the better, as people can see the head-fakes and inconsistencies in the original analysis.
I didn't realize that Staniford coined the expression HL, as I had just assumed it was Deffeyes.
Some people like curve fitting techniques, because they are simple and easy to understand.
One the other hand, this simplicity means that they neglect real-world issues, like economics, politics, and improvements in extraction techniques. We can adjust for historical situations, but we cannot adjust for future situations we don't know about yet. So I think that while this approach may have some benefits, it also has real limits. Going forward, it seems like economics, politics and improvements in extraction techniques could be more and more important.
I wrote a summary of a recent article by Adam Brandt called Review of mathematical models of future oil supply: Historical overview and synthesizing critique that gives some insight into these issues.
Was the pun intentional? >;^)
      A
     / \
      |
      |
What Gail said.
And my comment regarding the post on Brandt's work:
Sam Foucher and I started working on modeling net exports in early 2006, principally using the HL method and initially focused on the top three and then later the top five net exporters. So far, combined annual net exports from the (2005) top five net exporters have been below their 2005 rate and between Sam's middle case and high case projections.
My field of expertise is to create decision models for clients such as NATO, the IOC, UNESCO and the World-Anti-Doping Agency WADA. The difficulty is to include all those factors needed to represent reality such as social pressure, potential socio-economic conflicts, politics, alliances, national bellicosity and wealth, and of course the many technical aspects.
I would not dream to develop a differential equation since many of these factors come and go over time and change in influence. In forecasting problems I develop discrete equations with distinct time steps. With this, factors will appear just at the right time to change the behavior of studied problem. In addition, I always use fuzzy logic since most of these factors are very vague especially stepping further and further into the future. Fuzzy logic captures this uncertainties and the result is always given between 2 bounds.
I'd suggest the curve fitters and the URRs are on a hiding to nothing. Too many interacting feedback loops to make that activity be anything more than doodling over a graph of previous data.
There are, IMHO, two useful directions to take, and both rely on the total system of oil resources and worldwide economy being a closely coupled system:
The first is to consciously 'reverse out' the external influences on oil production post 1972. All the cartels, the economic shocks, wars, etc. to arrive at a smooth 'central limit theorem' curve that might give you a Hubbert derived clue as to total resources and peak date. Put the external influences back in and you have a better clue as to the global URR and thus where the future curve has to go (the global URR is the bit that's really key).
The second is to really recognise that the game post-peak is going to be different to the game pre-peak. Different rules will apply. Therefore if you can simulate the behaviour of the market and price pre-peak using a goal-orientated model; you are in a much better place to determine the behaviours post-peak. How drivers change? What the net effect is on the rate of production and the inequality in distribution that results? And THAT is the key question now, not how high and precisely when is the peak.
It's too late to worry about precise dates.
Indeed. Even going over the peak C+C and beginning to go down the downslope is irrelevant, because the shortfall will be made up by renewables, efficiencies etc. But at some point on the downslope we will not be able to substitute any more, and it's at THAT point that socially and economically things fall apart.
No one knows what the downslope will be like after that point. So, playing around with curves to estimate the exact year of peak production is a nice game but is ultimately meaningless. Rather than talk about Peak Oil we might do better to talk about Downslope Oil, if you will :-)
Then there is the net export situation:
http://www.energybulletin.net/stories/2010-10-18/peak-oil-versus-peak-ex...
Here is a nice graph to drive the point home:
NB: This is Jeffrey and Samuel's graph that I just remade in pretty colors.
What is the peak year according to your model and how does that compare to the standard Hubbert model?
28.9 Gb/y in 2009 for the curve above (URR = 2234 Gb), I estimated it in the thesis using a algorithm based approach, and modelled all countries I obtained 30.3 Gb/y in 2011, (URR = 2343 GB). Or in other words very similar projections.
SMohr,
Your previous analysis on coal indicated your best guess(BG) was MUCH closer to reserves + cummulative(R+C) than much smaller HL which invaribly show Peak at 2010 or thereabout.
I assume you were giving us your 'expert' opinion.
Is it your 'expert opinion' that HL is a significantly less probable indicator of URR than R+C?
Still you piled BG, R+C production up into a Hubberts Curve. Why?
Many at TOD ridicule geological reserve estimates followed by quickie HL graphs as 'proof'.
The HL trend in generally appears to be too low *IF* there are other basins that are unexploited. If the unexploited basins are relatively small and negligible then the HL trend works reasonably well.
R+C estimates sometimes appear too high (coal), but other times it seem to heavily underestimate the URR (some metals). Ideally, the URR is obtained from examine the resources of a region in detailed.
---
Just to clarify, the coal article did not use a Hubbert Curves, it used an earlier version of the thesis model, which estimates production by placing idealised mines online and interacting with demand (and a different method for oil and gas). So if demand was weak new mines would delay the start date, and if demand was strong would bring start dates forward or upgrade existing mines.
I did however compare the results obtained from the mining model to Hubbert curves in the thesis and found that Hubbert curves although not perfect were similar in shape to the models projections.
The bottom line is,
you said the HL was 700Gt, the R+C was 1243Gt and BG was 1144 Gt.
The percent difference between YOUR HL and BG is 48.2%(?!) while the per cent difference between R+C and your BG is 8.3%.
http://en.wikipedia.org/wiki/Percent_difference
When push comes to shove, your BG goes with R+C, not HL techniques.
Also in your other paper your best guess is also much higher than some HL URR analyses--2335 Gb conventional oil or 1200 Gb remaining.
You also didn't explain why you piled up all the R+C into a big peak.
Interesting, though I don't have the time at present to fully evaluate the algorithms (and would likely be challenged doing so).
What do the authors think of the following publication;
- Bertrand Michel, Oil production: A probabilistic model of the Hubbert curve
Michel has a much better analysis because he actually think about the problem as a statistical exercise.
I don't think that he ever put everything together but he has much better insight than the logistic curve fitters. I have referenced Michel in the past:
http://mobjectivist.blogspot.com/2008/10/dispersive-discovery-field-size...
Michel had this to say which I completely agree with:
Hubbert essentially chose a curve with the wrong justification.
Hubbert was a fascinating scientist / engineer because he looked ahead even when dealing with a very complicated problem.
And he proved his hypothesis to a significant degree in "a local context". The U.S. is a local context, for example.
The criticism I have read / heard is basically that extrapolation from a local to a global context impairs the accuracy to some degree.
Hubbert's algorithm / formula is stronger when there are fewer "moving parts".
War, embargo, coup, disaster, and the like are examples of the "moving parts" I am talking about.
But that can be said of most any complicated algebra problem.
Hubbert was ahead of his time.
I would say he was ahead of his time as far as having an intuitive grasp of the situation.
Laherrere said this:
Only in the 1980's did Hubbert reference the Logistic curve and the idea of linearization from the Verhulst equation.
Yet that turned out to be a heuristic as it never was theoretically justified.
So Hubbert had tremendous insight but kept the math at the heuristic level.
There are 3 moving parts to the logistic and only one has any physical meaning, the URR.
The other two parts are simply curve fitting parameters.
One is an exponential factor and the other is an initial conditions.
Hubbert was certainly ahead of his time and, were he alive now, I expect he would have accepted the futility of trying to use simple curve fitting where the data argue against such an approach. Outside of the US and Norway the "moving parts" are legion.
Extrapolating the single curve from the US local to the global context is questionable enough. But I am most appalled when people try to to apply single or "multi-cyclic" or "disrupted" curves to other nations besides the US and Norway. (The current post is off the hook on this one but the thesis might not be.)
Let's take a look at the two largest producers and exporters of oil (FSU instead of Russia for a longer time series):
Many curve fitters want to fit the production curves above with some sort of modified logistic curve. Good luck! The logistic curve explains only a very small part of the overall shapes we see.
Until you have a model that predicts things like the fall of the Soviet Union, the Saudi pullback in the early 80's or the train wreck that is Iraq (or Venezuela or Nigeria or ...) it will be impossible to use curve fitting to get a handle on future production and ultimate recovery in these nations. The "moving parts" are no longer perturbations on the main signal. They ARE the signal.
(charts from the Energy Export databrowser)
Jon
Jon,
Obviously, the HL method can't predict political disruptions and contributions from frontier basins, which aren't making any meaningful contribution to production at the time that the estimate of URR is made.
In the case of Russia, we principally used the production data through 1989 to generate the estimate for URR. The wild card for Russia is and remains the frontier basins, but IMO they are to Russia as Alaska is to the US, i.e., helpful but no panacea. The HL analysis suggested that around 2007 Russian production should have "caught up" to where cumulative production should have been (with no political disruptions). And Russian production has been virtually flat since 2007. We haven't seen a real decline so far, because of the frontier basins, but the bottom line remains that the older, large fields are at an advanced stage of depletion.
Regarding Saudi Arabia, they showed a fairly stable HL plot from about 1991 to 2005, which were the data points that Sam used for the HL projection used in this 2006 paper:
http://www.energybulletin.net/node/16459
Annual Saudi crude oil production has, so far at least, been below their 2005 rate for going on five years now.
Nice point, except these are exceptions.
Plot the other 33 major oil producers and then state your argument with a straight face ;-)
Nevertheless, Russia and SA are both near or past peak. (I know we need to wait a few years to see if that is true, but not looking good for SA right now.)
We don't have 33 major oil producers in the world. Ten or perhaps fifteen at most.
You of course have to define what major means but 1mbd of production is good enough as any.
Including India this gives 23.
http://www.nationmaster.com/graph/ene_oil_pro-energy-oil-production
Set the bar at 2mbd and its 16-18 4mbd -> 4-5.
Not only is a lot of the worlds oil production concentrated in a few countries its concentrated in a few basins and even a few fields aka Ghawar. Individual fields matter. A world that did not have a Ghawar located where it is is quite different from our own.
Sure the little guys add up in shear numbers the best example is the 2mbd or so of oil the US produces from stripper wells.
But are they really important ?
It seems to me at least that this sort of distribution lends itself to the creation of critical points in the oil production distribution. Again Ghawar pops out as a very important field. Ghawar in decline effects everybody Croatia not so much.
I'm a bit surprised that no one has really done a value weighting for global oil production about the closest thing we have is WT net exports a number of other possible weighting schemes exist to evaluate the importance of the skewed production profile.
Net exports is probably the biggest but its by no means the only important one. Light/Sweet Conventional/Unconventional basin field size extraction costs, population vs resources controlled, political stability etc etc etc.
I was being silly about the absolute number.
My point was Russia is an exception. SA is an exception.
In any case, lets see whether they are peak or not in the next 2 years.
I agree that Russia and SA are exceptional in that their production histories are not well modeled by theoretical curves. Some countries are well modeled by a Hubbert curve -- namely the US lower 48 and Norway. But I will continue to argue that many of the top producers have "bizarre" production histories where curve fitting is entirely inappropriate.
Using memmel's list of top producers (2007) from nationmaster I'll rate each of the top 20 countries as Yes-No-Maybe as to whether curve fitting 'looks' appropriate:
This list accounts for the lion's share of world oil production yet there are pitifully few "Yes" votes. (I think I'm being generous by giving Mexico a "Yes".) Of course 'looks good' is a very subjective measure. If you don't like my assessment, have a look at the data yourself. I've worked hard to make that very easy to do.
In the end, I think it is incumbent upon modelers to describe why curve fitting is appropriate on a case-by-case basis and to address the concerns of those who can "see with their own eyes" that the production history doesn't look anything like the idealized curve that is being used to fit the data.
Jon
How about instead calculate a overall fitness of the curve comparison?
Are you saying that the tail is a bit extended on some of the curves?
From what I see for these countries there is a peak which is pretty darn symmetric for like 80% of the beef under the curve.
Everything else is noise and variation.
But then again. I look at noisy/undersampled effects everyday and they fit fairly well to simple models.
I would bet that SA and Russia deviate the most in any case.
Simple models are robust and used to predict phenomena.
Here in this case some noise -- be it political/economic can influence the final data in the various cases. In these cases, you say the data do not fit the model "exactly." This analysis is really a judgement call you are personally making without statistics. OK
Are you saying that Hubbert did not include economy and price of oil and politics in his model?
Well, that is not really a good critique of Hubbert.
Show me a simpler model that does what Hubbert did.
The new simpler model will have to roughly predict all the major countries with a better standard deviation than Hubbert did. Those are the only apples, everything else is a perturbation on a Hubbert curve model.
Hubbert gets basically all the credit in the end.
AND Hubbert did say that SA or OPEC could bend the curve with quotas -- so in effect he stated the exact deficiency of his simple first approximation model. I think the reference is in the 1978 TV interview I saw.
"Are you saying that Hubbert did not include economy and price of oil and politics in his model?"
For his very successful work on the lower 48, the time was 1956. The cumulative data of past production shows squiggles that might be attributed to the economic depression. The major upheaval of WWII was in the recent past. Peace was at hand. He was attempting to correct a major misinterpretation of the existing data, not attempting to model future economic turmoil that no one believed was immanent.
Had there been a worry about economy and price in the air, I think the misinterpreters of URR data would have included a misinterpretation of economy and price in their model. Hubbert would likely have responded to that in his papers. But that is not what happened. The actual historical situation did not provide an occasion for consideration of economy and price.
He did do some writing on money and inflation, I think. But that was entirely separate for the oil URR stuff. I think his politics was that of the Technocrat political movement, which was kind of 'other' in a world that was dividing itself between 'Red' and 'Free'.
No doubt Dispersive Discovery models reality better than anything Hubbert did for discovery and the Oil Shock model is much better than anything he did for production. The two models in unison connect the concepts of discovery and production via the concept of convolution. Hubbert never mentioned the mathematical technique of convolution, which I think is extremely telling.
Again his great skill was in intuition.
I do not mean to say however that the good work being done on oil production curve in the real world is not good stuff. It is exciting to see attempts to get the politics and economics into a hubbert-type model.
Boy is real world oil production complex.
Hubbert was quite prophetic imho.
My last point is that I bet the basic Hubbert curve (the area under that curve projected from the initial production data is the oil to be had in a region). everything else extends that area in time, BUT the area under the curve will be the same regardless of the roughness of the actual production data.
That I will call the "Hubbert Area Conservation Hypothesis." And he basically mentioned it in passing I think.
I can't test it myself since this is not my field of study. perhaps someone already did test this theory or perhaps we need some more time/data points.
My feeling on SA was that it had the luxury to control production since it was the biggest producer with a command-style oil economy and it was top dog (until Russia beat it our last year).
Thus SA controlled production to keep prices at the "right" level.
This is an interest approach. It allows for a baseline forecast of no further disruptions, and also the long term impacts of a major disruption can be modeled.
It seems like a step toward a model that takes into account economic feedbacks as well. In the event of a major recession, for instance, there could be an investment shortfall which may look like a disruption. Disruptions are modeled as discrete events with sharp peaks, but economic disruptions may have more complicated shapes, maybe with a plateau. What about extended periods of high prices? Might those look like negative disruptions, by indefinitely increasing investment in production? Could r be taken as a function of price rather than a constant?
You could probably convert r into a price function fairly easily, you'd probably need to change the model into a discrete one... but that shouldn't be too hard.
Hubbert did well with domestic oil. OTOH, he tried to make a similar prediction in the late 70's that natural gas would fall off a cliff in the 80's. That didn't happen, so the prediction was forgotten.
So, one might ask: how would this more generalized model apply to US NG production over the last 60 years?
Like I said above, the model is mainly about discovery and causality.
Hubbert did not get the discovery profile correct so the production profile by definition would not work.
The other behavior to consider is that natural gas is more rate limited than oil. The pipelines are the bottleneck which leads to a rate-limited draw-down.
Some would say that oil has refineries as the bottleneck but this is nowhere near the restriction.
All this is pretty apparent if you treat it like a data-flow model like the shock model uses and dispense with the crummy Hubbert model.
Hubbert did not get the discovery profile correct
Has anyone documented the NG discovery profile? We have NG production data, but is there anything for production?
There is this one from Laherrere:

It has a huge spike around 1970 that looks like it goes off the chart. I have no idea what is up with that. It makes it just about impossible to do anything with because the height of that discovery spike will define how production plays out over time.
Here is another one from Roper:
Could we get the numbers that underly the chart?
Last time someone asked Laherrere for numbers (a few days ago on TOD) he couldn't recover them.
I usually set the graph as a background image on a spreadsheet and enter the numbers that way.
Web - An anecdotal explanation: NG prices were near zero until the 70's rolled around. When I started with Mobil Oil in 1975 NG prices started shooting up from $0.20/mcf (if you were lucky) to over $1.25/mcf. Hundreds of wells found gas reservoirs but were plugged due to low prices. Once prices started climbing many companies just redrilled these old discoveries. Another big factor was the GOM shelf. By 1975 2d seismic began to show direct indications of NG reservoirs (seismic "bright spots"). The success rate of offshore GOM NG prospects went thru the roof. The feds were having 2 to 4 big GOM lease sales per year. Add the price increase and I suspect that would explain the bulk of your spike.
Typically the URR QT is known from literature/your own judgment
WHOA. If we knew Qt for world oil production, even approximately, this website would be a whole lot more boring. The value for Qt isn't a given: its value is the million dollar question!
Being just an average citizen, I really don't care how the predictions are made. I just have a real need to have some knowledge and understanding of a range of about when oil production will peak and some idea of what the down slope curve might look like so that I can make some basic plans for my future- knowing that they are not going to probably be dead accurate.
I don't expect the information to be accurate to the day, minute or second.
From what I have read of those using Hubbert curve modeling and other sources, I am planning on crude oil peaking in the last decade and starting to decline in the first half of this decade. I am still ambivalent about the rate of decline in global oil production but at least can make plans for a fast and slow decline and figure reality will probably be somewhere in between.
In other words, on one level I am not planning to go out and buy a new 10 mpg pickup but I think I still have a few years to finish changing over to higher mileage vehicles. Than kind of thing.
I find the discussions about the different methods of predicting interesting, but it is still the predictions themselves that are of primary interest to me as an average citizen.
What I hoped to do with this model was create something that people could use easily to make their own projections (hence the excel spreadsheet). In terms of decline rates, the projection indicates that by 2017 it'll reach 1%, by 2024 it'll become 2%. So the projection is not indicating a steep decline in oil production over night, it'll be a slow process.
Thanks for this post, Steve. I appreciate the effort you've put into it.
I do have a different view on that. A slow decline (at least at first) is likely but a combination of factors is going to speed it up:
In other words, an economically sound environment would permit a slow decline; our situation is going to be anything but that.
Thanks Aangel, Yes, if we were sensible the decline should be slow, but we can certainly do things to speed up the decline.
"if we were sensible"
_____________________
I saw an interview with Maurice Sendak, author of the children's book "Where the Wild Things Are". He was older. He was in doubt of humanity.
Sigmund Freud ends his book "Civilization and its Discontents" questioning humanity while watching the rise of fascism in 1930.
An old woman assured me today that poverty and chaos are Karma and the happy heralds of Jesus: signs of wonderful magic at work among us.
Greed and insanity trump cubic splines, every time.
Them monkeys is crazy.
Don't forget that the aggresive (technically advanced) way of oil winning during the last decades could also lead to a 'shark fin' oilproduction curve.
Yes, that's why I asked John Michael if he was amenable to making the curve below look like a shark fin:
My guess is that a great deal of the remaining oil will stay underground forever.
If so, it will make the chance of a smooth transition with NG much smaller.
My current thinking on the shark fin has evolved somewhat.
I think that the basics are still correct technology both increases the height of the peak perhaps substantially and also delays the onset of decline leading to the classic shark fin fall off and and asymmetric production profile.
This says nothing about the shape of the top or how you move from peak->cliff.
The public data says a plateau however my own work and now my intuition suggests that a period of linear decline makes a lot of sense.
If you think about it the same technical forces that allowed you to both raise the peak and delay it are still at work in the decline phase indeed since prices would be increasing they would be even more potent on the back side.
Now however instead of shaping a fairly smooth asymmetric curve they are trying too counter act a curve thats falling off a cliff.
The net would simply resolve to two lines advanced technology bringing on new production rapidly and decline accelerating linearly. The result could be a linear increase flat or linear decline. Given that the acceleration rate for technology deployment is likely to be lower than the steep decline the result is a linear decline at some probably shallow rate at first.
My best guess is this gives you a very shallow initial decline rate probably a fairly flat top for a few years then 1-2% until you have depleted another 10% or so then the shark fin drop off kicks in.
This makes a lot of sense the reason for the steep drop is you have produced your fields to 70% of urr with production having only fallen say 10% or so from peak. One thing we do no is that a lot of the oil producible on the back side of the curve will be in a fat tail at 50% of peak or less. This is the last 10-15% of the final URR and it takes a long time to extract and the rate is not high.
The shark fin is then simply a geometric result if you did indeed manage to keep production hight to 70% of the final URR at some point around the 65-75% or so depletion level production has to fall rapidly to the final rate or by about 20% over a relatively short time period to hit the final fat tail rate.
The only real addition is that a period of fairly shallow linear decline is very probable before you hit the wall and it makes a lot of sense and bolsters the underlying physical reason for a final shark fin drop off while production has not really declined significantly from peak.
Obviously the shallow decline will bother a lot of people but its slow enough that most will think that a technical push could easily overcome it. Perhaps all we need is oil prices held in the 70-80 dollar range to provide the financial force to overcome this nagging decline. A problem yes but not the end of the world until that wiley coyote moment hits.
What really interesting is you can probably figure the ultimate URR from this curve shape if we assume 60% URR at peak. Setting peak oil at 2003 i.e the last cheap price with known high production. If we assume about 1TB at peak and at 60% of URR then we would have a 1700 GB URR. to get to 70% depletion we would need to extract 170GB. We do about 25GB a year or so thus you have 6.8 years of a slow decline period before the likely onset of the cliff.
Taking peak based on production and price at 2003 + 6.8 = 2009.8 as the so called shark fin event using these numbers. Plenty of room for error so +/- 1-2 years. Also the guess of 70% as the onset is arbitrary 75% is dubious but no reason it could not be 71% somewhere between 70-75% depletion your going to see a steep decline if the concept is basically correct. We are either close or past this point now again plenty of error but not that much. If technology was not a big factor then we would not have held production high to a significant depletion level. I.e technologies role is minimal and the peak was closer to 50% of URR and thus the entire concept is wrong. Also nothing preventing technology from surpassing the 60% guess again however a peak past 65% of URR is pushing it and simply shortens the linear period basically cutting it in half.
Next although I call it a cliff after the linear period ends you should then have and additional period where the rate of fall of production is accelerating but takes a while to reach its extreme levels. The curve period can be constrained based on the fairly hard depletion limit at most 2-3 years where the decline rate accelerates from 1% to say 8-10% or so whatever the final real slope of the cliff is. Any slower than that and again you run into the problem that depletion gets to advanced to make sense. A period of say 1 year is questionable simply because field decline rates averages cannot physically decay that fast.
So perhaps you have about 6-7 years of linear decline then 2-3 years of a obvious and relentless increase in decline rate. Using my 2003 estimate then the real cliff is 2011-2013.
Again everything can be off by several years but the error is fairly constrained by the intrinsics of the argument and known production/prices to be less than about four years or so. Not that I believe the production data after 2003 but a really steep drop cannot be hidden.
From price it really looks like we left the linear phase sometime in late 2007-2008.
Which mean we are then in the roll over phase right now with production declines accelerating at a noticeable rate even within six months. Of course we entered a deep recession or depression right at the start so demand did take a significant hit.
It all depends on the details which are impossible to know but you could accelerate from a 1mbd per year decline rate to 2 mbd and still not cause a price spike if demand fell by 2mbd. Indeed a short glut period is even possible. If demand fell suddenly by 2mbd yet at the same time production had only fallen by 1.5 mbd you have 500kbd of excess which is more than enough to glut the oil supply chain.
Regardless you still have constraints. As the decline rate approached 3mbd and higher and if demand flattened out you still go into a fairly rapid divergence between supply and demand over a period of about a year or so. And it get worse rapidly at that point.
Its guess work but the basic assumption of the simple model provide some fairly powerful constraints on how long certain segments can last before a new phase is entered.
So this is my new and improved shark fin model the basic addition is a bit more detailed view of the exact shape of the peak event itself which was not in my early versions.
The peak period if you will is fairly tightly constrained to be 10-12 years or so pinning its exact date is difficult but not impossible. I don't think the long plateau we have had fits i.e the public data and this model have already diverged one is now certainly wrong.
No way can production be at the current levels claimed and the shark fin model be valid.
However the divergence although fairly large is not huge. Say 4-10mbd. Sounds shocking perhaps but supply and demand could have easily varied over the lower end of the range and fit to the price graph. Rapid economic changes over months could have easily overran any production decline rate I would have guessed leading to a short term glut.
But on the same hand 4mbd is non trivial the price of oil would absolutely have to be substantially higher than what it was in 2003 regardless of economic changes barring a total collapse.
But it is oil was was around 30-40 back then and now its 70-80 after a major spike in price and the deepest recession since the depression. Of course OPEC claims to have cut back substantially but the official numbers and mine don't differ all that much just the reasons for them. Heck even a 10mbd decline from peak is possible if on the extreme end. Demand destruction from high prices and thence economic collapse could have easily resulted in the world down 4mbd-10mbd and high but not outrageous prices.
With the addition of the linear decline to the shark fin model my best guess using prices and our global economic system is we are now down 6mbd from peak and that depletion has already accelerated from 1mbd or a bit less to 2mbd or so and we have started down the curve to the cliff. If so then it should now move from 2 to 3mbd or so over some of last year and this year definitely in the 3-4 mbd sometime next year. Or getting effectively impossible to hide. The demand destruction for the rapid economic collapse probably help obscure the situation but it can't for long. The price spike in 2008 had to in my opinion happen during a period of acceleration in production decline rates so it serves as and additional point to pin the curve. The initial acceleration of the production decline would have resulted and a fairly small change in overall production say 100-200kbd but that would have been against and already stressed system and sufficient to cause a spike. The follow on financial collapse and demand drop assuming 2mbd would have covered if you will even as production declines accelerated.
I feel pretty comfortable making a pin there for initiation of the curve to cliff sequence of the curve.
Thus with the model we are now basically in the deep doodoo phase as long as demand holds supply and demand will diverge even faster than they did in 2008 as the rate of decline of the decline in production rate is accelerating. Once the supply and demand gap opens up again it diverges even faster. Certainly during the glut phase a substantial quantity of oil could have been stored while production was briefly greater than supply. 100's of millions of barrels. But it does not matter as the supply/demand gap will rapidly wident to several hundred kbd say 0-500kbd over a matter of months 3-6. Storage would allow prices to remain low during part of this widening period but not the entire time. As it ends the real gap becomes uncovered if you will. Once the storage runs low you go from a small gap to a fairly large one literally overnight. And this is actually a fast event weeks or months not years. One day your pulling 100kbd of storage down the next its gone. Worse its weighted heavily to the back side. Storage builds during the glut then slowly supply and demand balance then you start pulling down at and accelerated rate.
As long as your willing to drain storage to not exert pressure on prices everything is ok for a while but again it fails fairly fast over weeks and months and the gap opens rapidly.
If certain unnamed countries with the initials U.S.A decide to lie about their storage levels as the see increasing draw downs after the glut well TSHTF even faster.
In any case we shall see big error bars on my model but also some nice points to pin it and of course the divergence from the model and reported numbers is well in the past. And better the point where things should start to rapidly fall apart is also probably already in the past. The only real question is at what point can the shark fin model be declared a failure and wrong ? I thought this summer however I added in unannounced draw downs of the US SPR and factored in its increased storage capacity and we could still hide things for a bit longer. That of course is a desperate move and eventually the US military would halt draw downs for economic reasons it is a Strategic Reserve at some point. And also added in Japan doing the same they have substantial strategic reserves. And even China could to some extent they have also built up substantial reserves Europe etc. With that I can get us to now without a major price spike and perhaps a few more months. But then of course things are even worse as the remaining reserves would be allocated to the military.
Seasonal variations help right now is a low point so the desperate draw would indeed have managed to get us to a low demand period this buys a bit more time. Problem is it probably shifts crunch point into the winter. Or even worse the spring when planting starts.
The only thing that could save us now would be another financial crash this winter it will put a short term hit on oil consumption regardless of whats going on. But demand is becoming increasingly inelastic and decline rates accelerating so another crash won't but much time. But they are going to have to pull the plug on the economy again this winter or at the latest this spring.
They have little choice and it will buy some time. Perhaps six months perhaps even a year it depends certainly six.
After that I simply can't see any game working basically all the cards are played.
The decline rate is then too steep and the remaining demand too inelastic.
At that point you certainly have one card left and thats a War somewhere that interrupts oil supplies. Obviously that above ground event will hide anything. But that just hiding the nature of the event and indeed potentially making it worse your still hitting the wall.
One thing is for sure the longer prices stay low the more plausible it is that the shark fin model is wrong. That in my opinion is a good thing. Discarding the worst case scenario for oil depletion is not at all bad and means we have more time and perhaps a lot more given that the technology effect is different from what this model proposes.
Indeed I'd argue that if this one is wrong and the technology effect is real simply modeled incorrectly that oil supplies will last for quite a while with CERA's undulating plateau concept being the closest to correct. We would still have the slow linear decline eventually but its well out into the future and spans a significantly longer time period.
The basic shark fin curve is still there but the top and initial decline periods are now double or triple what I'm estimating and of course the current plateau is not yet peak.
Peak is still ahead of us how far is tough to know for sure but at least 2-3 years. The linear phase decline rate is very shallow < 1% maybe substantially and the final shark fin cliff is there but reduced too almost a bump. What this means of course is recovery rates really did increase substantially not just extraction rates. I'm assuming little real change in recovery rates from technology its all weighted towards extraction.
But substantially increased recovery rates are not going to move peak up by much just really flatten the curve. So although peak is indeed probably in the future the actual peak production would not be significantly higher than today. Thus the undulating plateau model and then gentle decline near todays current rates with peak almost certainly less than 10mbd over our current rates.
Sorry for the long post but there are two possible shark fin curves that assume a bit technology effect. They have already diverged and CERA's actually fits the public numbers.
The only question is if this fit is real or simply fabricated ? CERA's model could well be simply official cover if you will that everyone finds very useful. No government on the planet would accept my model :)
Sorry for the long post but its important to understand that two shark fin models are possible we just have to continue to wait and see which one can be eliminated and even then we have to wait to see if the basic concept is right i.e the production curve is asymmetric. Mine is rapidly reaching the point where it should be dropped.
I wish I could say it was time to throw in the towel but not just yet.
Holy crap, Mike, I'm going to have to come back to this post on the weekend.
LOL basically if technology is a factor its done one of two things a super straw effect with negligible real effect on reserves or both substantially increased extraction rate and recovery rates. The curve is still highly asymmetric except that enhanced recovery gives you a long plateau and slow decline. Reserve increases from enhanced recover rates are not going to effect the peak production level. While super straw will distort it significantly higher showing more reserves for the symmetric model yet if they are there its the enhanced recovery that will capture them thus capping the rate and leading the a long decline period.
Or it has no effect which at least for extraction is probably not true recovery rates are still a bit of and open issue but nothing really supports a substantial increase in recovery in general.
My only real change is recgonition of a linear decline phase during the 60-70% urr depletion regime.
As far as math goes well its all technology driven i.e the technology effect rules after recovery passes 40% of URR. Fundamentals i.e how much oils left simply dictates the failure modes of technology.
The reason its independent of discovery once depletion is advanced or discover is well in the past is that the technical advanced are applied to fields regardless of their discovery date decoupling the relationship between discovery and production leaving only depletion of the real URR as the fundamental factor. And of course the question of if backdated reserve growth is real in many cases. Once you pin technical peak at 60% of real URR then the rest follows for the most part.
Thus to somewhat answer WHT discovery does not matter for the backside of the curve.
I want to state for the record that the contents of this comment amounts to gibberish. If you applied a boolean satisfiability test to the ramblings, you would end up with the null set.
I want to say this because for whatever faults I find with Mohr's analysis, it at least shows some innovation and people can actually use the information to make up their own minds.
All that Memmel's ramblings will give you is a headache. This may be intentional on his part. This is an ongoing debate we have had on TOD -- to determine if Memmel is just a time-wasting equivocating troll. He essentially gets his speech translator running, speaks into the microphone for about 10 minutes and then posts it to TOD. That's my theory at least and it could go either way, to put it in Memmel-speak.
I know I don't have to read what Memmel writes but it does detract from the professionalism and EPIC MATH POST quality of Mohr's analysis.
Yes, SMohr's mathematical model results in peak production occurring when half of the URR is consumed. Enhanced oil recovery techniques may extend the peak to ~60% depletion causing the falling edge to be steeper.
Practically everyone here believes in 9/11, too. I'll repeat my challenge: there exists no record of any demolition in history as tidy as WTC7. Search youtube for "demolition" and watch the videos, then go to wtc7.net and watch the videos. It takes ten minutes. I bet nobody will take this challenge. 99% of those who do will refuse to believe their lying eyes.
After hanging out here and a few related sites for the past few years, I'm pretty confident that those who delete 9/11 posts understand and agree with the posts. Likewise, moderators of mainstream forums who delete peak oil posts probably understand and agree with them. In both cases, this is just not the place and time to talk about that kind of thing...
I concur. I've spoken to producers who explicitly say, "We can talk about any topic — except 9/11."
When considering how the decline will affect our civilization, the rate of decline of oil production is only part of the equation. The part that I don't see is the increase in demand (need) for oil. So the total force acting on our society is the spread between production and demand, not just the oil production decline?
I also think that looking hard at your local economy can provide a "feel" for what is happening with oil. For example, I have notived in the past year or so a lot of restaurants here in my town have shut down. They used to be vibrant, then moderately busy, then gone. And the oil that used to be used to ship the food and keep the customers coming in is now going somewhere else. In efect, these places have been sacrificed. They are empty, locked, with no further use until someone can tear them down and grown something on the land when it has been cleared.
My point is that we have entered a zone where some people have to give up their oil so that other people may keep theirs. The people who invested in those restaurants, the buildings, decor, equipment, they were not in it for a good time, but profit and now that is impossible. The pain involved must be extremely real, but unseen and unheard. The principals don't sit screaming in the abandoned parking lots, though maybe they should.
If we have entered a zone where some people give up their oil so that others may keep theirs then it stands to reason that the oil supply is no longer increasing. Possibly it may be decreasing. There is a "minus" feeling now in the last year that wasn't here before.
I've noticed the same thing where I live >:^(
I'm going to guess the US will "give up" and the BRICs will "keep".
Jon,
I'm with you.
This discussion reminds me of the endless battles in technology between this Unix and that Unix, this super-efficient sorting algorithm and that less super-efficient sorting algorithm and so on. I do think numbers are important and I take care in making sure the ones I use can be well substantiated.
However, at some point a "business decision" has to be made and we now have adequate information to make plans for a declining oil future.
If on one side the IEA is generously saying oil peaks in 2030 and on the other side production hasn't increased despite many years of historically high prices, already any sane business person (not blinded by "technology will save us") would sit up and take notice.
Unfortunately, most business people (and people in general) are blinded by "technology will save us."
aangle + jon,
In line with your thoughts, I think the real turning point that should have been recognized is when the production/consumption curve stopped fitting the exponential growth of the BAU model. That model has always been the preferred alternative to all these various peak models. Nothing really significant happens precisely at peak. Before peak large numbers of people accept to the BAU model, at peak attitudes are in a state of flux, after peak is well passed, people might acknowledge that it was some time in the past, and then again, many won't acknowledge it, but very few will openly argue that it has not happened. What will happen to the business of polling about business confidence?
The problem with making plans for a shrinking economy is that we have never experienced and have no theory of a permanently shrinking economy. How much should one invest in starting a new endeavor? and over what period of time should one expect the payback for that investment? What numbers does one scribble on the back of the envelope?
That is the way it is when we grow up as a cancer.
A healthy economy is something we cannot fathom, because it is based on a healthy psychology that realizes growth is something that ceases to exist, except to replenish, in any healthy economy of finite realities.
I do appreciate what Mohr is working on because it gives us a chance to collectively advance our scientific knowledge.
People tend to forget that even though peak oil may have hit us, there may be some other resource constraint issue that is just ramping up. Then we will repeat this entire process whereby no one really looks seriously at the analysis until it is right on top of us and then everyone will whine again that it is too late. Funny how that always happens.
Yes you have an interesting perspective, but I think you used a rather weak analogy as I don't consider UNIX a science. Arguing about UNIX doesn't unlock some hidden or unexplored scientific truths. Say instead we were arguing about aspects of global warming instead of flavors of UNIX.
I think you're being too precise with your metaphor — which funnily enough demonstrates exactly the point I was making. We wonks are discussing the finer aspects of curve shapes while, in my view, there is plenty to go on to make decisions.
What's getting in the way isn't a better understanding of the problem. What's getting in the way is how the social human creature fails to react when confronted with a future at which its mind rebels.
Funny, you were the one that brought the UNIX metaphor up. Either stick up for it or retract it, please don't blame it on me.
No, my point is that you are drawing an irrelevant distinction. It's now getting really funny because you continue to do exactly what I'm saying and you can't even see that.
Yea, I guess it is humorous to the extent that a couple of people out of the 6+ billion people on the planet would argue about the minutia of oil depletion. Guilty as charged and I realize I have a blind spot. And I suppose this distinction is irrelevant to the point you are trying to make as well.
A fundamental problem with this analysis:
The whole point of the Hubbert model is to use past oil data to estimate what will happen in the future -- that the r and Qt estimated from the rising part of the curve bear some relation to the behavior at and post-peak.
In this generalized formula, note that the "disruption function" x(t) multiplies the rate constant r. Basically this is just allowing the extraction rate to vary with time. x(t) is chosen purely empirically to fit the observations, which means that the rate constant chosen at the beginning of the analysis gives no information about future behavior.
As we all know, the early part of the Hubbert curve is ambiguous: I can match pre-1970 oil production with almost any value of Qt I like, so long as I shift the peak date tp accordingly. Suppose I chose a Qt which was two, three, or even ten times as large as you did, with a peak date in mid-century or beyond. It'll look fine at first, but eventually it'll overestimate the amount of production sometime around 1980 or so.
But since the disruption function is chosen empirically to fit the data, I can still fit the data by adding in "disruption" events. I can add in as many f1's f2's and f3's as I like -- I can even give them names, "OPEC embargo", "Iran-Iraq war", "9/11", "global economic downturn", and produce a great fit to the observations... but the fit tells me nothing about the future.
I think you have it essentially right. Not only do the values meander about, they have no meaning in the first place.
At least with the shock model, the parameters have some meaning.
Sam Foucher tried to reconcile the shock model with the Hubbert logistic a few years ago. Google the "hybrid shock model".
It is basically Mohr's analysis with a more formal basis. I wouldn't use it myself but it is somewhat instructive.
QT is usually obtained either from literature estimates (BGR, USGS, etc) or by looking at reserve/resource estimates. You can still estimate the Qt from Hubbert linearisation and simply use the Generalised version to account for *major* disruptions.
EPIC MATH POST
About the Generalized Hubbert Curve equation, I don't think that specific equation defines the curve. Instead I would prefer to call it an identity -- a bit of math that just coincidentally happens to give the right solution. There are many examples of these identities that litter the mathematical and scientific landscape.
Take an example from the world of physics. You will find a ubiquitous distribution referred to as Fermi-Dirac statistics. It has exactly the same functional form as the Hubbert Logistic sigmoid:
F(E) = 1/(1+exp((E-Ef)/kT)))
The "URR" in this case is 1 and Ef takes the place of time. Now, this has a specific derivation that has nothing to do with a deterministic outcome. If this was in fact deterministic, then physicists would have used this formula to derive it:
dF/dEf = -C*F*(1-F)
Try it out, the identity works, just like it works for the Hubbert curve.
Yet physicists don't do this. Why? Because it is patently ridiculous to pursue this line of reasoning. It doesn't explain anything! Physicists are smart enough to recognize an identity when they see one. Ef in fact is a statistical measure of energy and the Fermi-Dirac derivation comes from a detailed analysis of counting statistics. It doesn't come from the freaking solution of a differential equation!
Take a look at this post which gives an interactive view of how a Hubbert curve comes about from statistics:
http://mobjectivist.blogspot.com/2010/06/oil-discovery-simulation-realit...
The linked blog post features all the regulars from TOD as they act as independent prospectors trying to discover a field. It is statistical or stochastic so the outcome will change every time you run it.
I get worked up over this because all resource depletion analysis is still in the stone ages AFAIAC. I am still hoping that some additional bit of insight will get us to better policy decisions.
I see value in this approach as follows: assuming the curve fit up to 1974 is a good fit, and assuming the URR estimate is correct, then the area under the theoretical curve (the logistic production curve assuming no-holds-barred production volumes) from 1974 to 2010 minus the area under the actual production curve from 1974 - 2010 is equal to the oil left in the ground (by quotas, wars, etc) and available to produce in addition to the area under the theoretical curve from 2010 onwards.
Therefore, one can draw out a flat production starting 2010 by using this area as a wedge on top of the theoretical curve, to see the forecast year when the current plateau might end and the final decline phase begin.
Note: if the theoretical logistic curve based on the pre-1974 fit and the URR assumption made by the author of the post would have dipped under the actual production curve before 2010, then the flat- line extension for the wedge of equal area should have began from that year. I haven't looked at data, but it could well be that we are already into the "wedge", i.e. that sustaining production volumes is now dependent on oil that was previously left in the ground due to quotas, wars etc. Increasing talk of the spare capacity buffer not being what OPEC claims it to be would be consistent with that.
the area under the theoretical curve (the logistic production curve assuming no-holds-barred production volumes) from 1974 to 2010 minus the area under the actual production curve from 1974 - 2010 is equal to the oil left in the ground
No, it's equal to the oil you *hope* is still in the ground.
The analysis assumes the theoretical curve was generated using the *true* value of URR. If you happen to choose a URR that's way too high, you can still fit the actual production curve by adding an arbitrary number of increasingly severe "disruptions". You'll conclude that there's plenty of oil in the ground, and happy days are coming soon as soon as we stop having these pesky oil crises...
Contrariwise, if your URR estimate turns out to be way too low, you can still fit the actual production curve by using very mild disruption events ... right up until the point where you've sucked "URR+1" barrels of oil out of the ground.
The predictive value of a model is inversely proportional to the number of adjustable knobs it has. This model has an infinite number of knobs.
goodmanj, is there a reason you stripped out the context instead of quoting the entire paragraph? I quote from my comment above, with emphasis for the bits that you stripped out:
I clearly predicated what I said on the assumption that the URR estimate is correct. I must therefore conclude that your comment added little or nothing to this discussion, except the implied allegation ("infinite number of knobs") that URR might be unknowable, for which you supply no fact or argument in any event.
I clearly predicated what I said on the assumption that the URR estimate is correct.
So did the original article, and that's the whole problem. I pulled a short quote from your comment, but I did read the whole thing.
the implied allegation ("infinite number of knobs") that URR might be unknowable, for which you supply no fact or argument in any event.
OK, here goes. The first part of a Hubbert curve is just an exponential growth profile: when Q(t) << URR, the Hubbert equation is just
dQ/dt = r Q
Production information gained during this time tells you about the extraction rate r, but gives no information about Qt. Hubbert linearization doesn't help: the URR estimated from that technique fluctuates wildly until production begins to plateau. (To see this, take a look at these examples and imagine trying to estimate URR from the *black* dots rather than the green ones.)
So the differential equation and the Hubbert linearization say the same thing: URR can't be reliably estimated until the resource is mostly exhausted.
Hubbert analysis is like driving in a car with crappy headlights: you can't see the brick wall coming until you're about to crash into it.
And it's even worse with the "generalized" form: with the original Hubbert curve, once the real-world production curve plateaus but the theoretical one doesn't, or vice versa, you know you've got the wrong URR. But in the generalized version, you can explain that mismatch using arbitrary "disruption" events ... for a while, at least.
In other words, if you try to extrapolate non-linear data, you don't get a good estimate. Good observation.
Lower 48 HL plot (data points shown in green used for Qt estimate):
http://farm1.static.flickr.com/45/145149304_a4a72211e6_o.png
In the example you linked to (the Lower 48 HL), which Sam Foucher did and which came from our 2006 paper, when you use the linear portion of the data through 1970 to estimate the post-1970 cumulative production, the actual post-1970 cumulative lower 48 production, through 2004, was 99% of what the HL model predicted it would be.
Sam Foucher generated the red curve on the following graph using only the data points shown in green (linear data through 1970):
Regarding global production, the plot has been fairly linear for more than two decades. Sam's plot of global production through 2005 (C+C+NGL's in this case):
http://farm1.static.flickr.com/54/145149301_b930ef7bc4_o.png
Post-2005, annual global crude oil production has, so far, not exceeded the 2005 annual rate, and the C+C+NGL (which has some contribution from gas reservoirs) was between 81 and 82 mbpd for 2006-2008, versus 81.3 mbpd for 2005 (BP).
IMO, we have been on a global crude production plateau for three reasons: (1) Conventional crude production probably peaked in 2005; (2) The initial decline tends to be slow and (3) A slowly rising contribution from unconventional production, which is really not reflected in the HL estimate.
Our 2006 Texas/Lower 48 paper:
http://www.energybulletin.net/node/16459
Texas and US Lower 48 oil production as a model for Saudi Arabia and the world (2006)
*IMO, if a region has not exceeded a prior annual (presumably final) production peak, e.g., Saudi Arabia, then the decline has not been reversed, since the exponential rate of change is either negative or zero. Texas and the Lower 48 for example have both shown year over year increases in production, to levels below their prior production peaks.
Excellent comment!
When you look at it from the point of view of Dispersive Discovery you will find that there will be areas that deplete much earlier (that's the outcome of dispersion -- a statistical variation of rates and volumes). You could actually make some sense by considering these independently and then making early projections.
But using the DETERMINISTIC Hubbert Linearization, we are left with nothing to latch onto during the early stages, as Goodmanj so nicely pointed out.
Re: westexas post above in the subthread - if Sam Foucher could get a good URR estimate for the Lower 48, is it not possible to get one for the world using 1900 - 1974 data? And if a world URR derived this way confirms a "URR" derived by the dispersive discovery model, would that be a good thing or a bad thing?
I suggest that all methods and heuristics have their place around the table, as long as they pass the common sense test. We may lose a lot if we rush to exclude approaches that might lead us somewhere if only we persevere and try harder.
The USA data fits in as a dispersive branch on world discoveries quite nicely.
In practice, the lower 48 served as the root of dispersion with a generally faster accelerating search process. This makes a lot of sense as we had all the technology at our disposal. The rest of the world dispersed more slowly.
Somewhere I did and someone else did a simple volume ratio that demonstrated that USA total oil matches well with global oil.
There are a lot of common sense factors to this model that are simply missing when you look at the Generalized Hubbert model.
It is all in this post: http://www.theoildrum.com/node/3287
Look toward the end.
The authors said:
Quite.
That depends on other variables.
It is important to have "accurate" estimates of how much oil is in a particular reserve.
But is that reliable?
Some of the estimates of Alaska oil fields were off by 90%, which would certainly throw off the peak calculations:
(Anchorage Daily News). It would be earth shaking to find out Hubbert formulae were used with bad figures in significant resource areas.
Dredd - Just a little clarification on how I read that report. The estimate of URR from EXISTING fields was not off by 90%. The estimate of reserves in fields that have not been discovered yet was off by 90%. Of course, URR of existing reservoirs is often in error to some degree but in my experiences an error as high as 90% is pretty rare in individual cases.
SteveM,
I'm revisiting your original post and trying to understand the math. I have questions about details of definition:
x(t) is defined in terms of a collection of functions of time, fi(t), which are each defined for all finite values of t. But is there a constraint on x(t)?
It seems to me that it should never be allowed to have a negative value, i.e.
x(t)>=0, for all finite t.
And concerning the ci in the definition of the fi(t). Should it be required that they also be non-negative?
Or are these suggested constraints not appropriate for a generalized model?
x(t) should be strictly positive (otherwise there is negative production...) ci can be negative (causes production to increase steeper, but that tends to be a rarer disruption, I can only think of the steep coal production growth in China over the last 10 years as a possible example).
I get a kick out of the Oil Drum... fiddlers as Rome burns... no one hardly seems to care about actual alternative and what Hubbert was actually up to:
http://www.archive.org/details/TechnocracyStudyCourseUnabridged .. was a technocrat and helped, along with several others to 'draw out' the first non market government, non political, science based government concept, which was the flowering of American science and intellectualism from the early middle 20th. century.
Hello?
Now in SarahPalinville ... the U.S., you just get recycled nonsense about Keynes and Krugman and overt corporate fascism and sites like this with a money focus.
Hubbert and his curve are simple and based on nature and anyone with an 8th. grade education will not have a hard time understanding his information
http://www.technocracytechnate.org/
Peak oil is a non issue in a science social design. The Price System is the lens of view though on sites like this one~!~
Then his technocratic approach is likely just as simplistic. And simplistic in this case equates to "trust me". The problem is that Hubbert was not very thorough. How else to explain why he was so hesitant to show his math for anything he did? He used his intuition to carry him. Can you imagine the 8th grade student that refused to show his math to his instructor? The one that would just write down the answer and dare the teacher to challenge him? Where I come from that is grounds for a failing grade.
I am being purposely over the top because you are. Big assertions require strong supporting evidence. I know this will get you upset, but you know it is true, because you are a technocrat, and you believe in the scientific method, which is
plodding and has to be thorough by its very nature.
So we make it technocratic. I at least have enough courage to eat my own dog food. Which apparently you snub your nose at.
Right.
Another comment from a site that specializes in Price System rhetoric.
Was Hubbert right about Peak Oil?
Yes http://www.youtube.com/watch?v=ImV1voi41YY
Was his method transparent... ? Yes.
So your just trolling.
Hello. Not really. 2 and 2 is not complicated. Nature may be grand... and undiscovered facts may be curious... but this is known science. Brainwashing is another issue though about opinions. Opinions are never facts. Facts do not fight facts. Ok?
Anyone here talking about eating dog food?
No.
If 'you' have a glass... and there is a little hole in the bottom and things drip out... then you have an empty glass after a while... right?
Is that rocket science?
Is rocket science any thing other than adding 2 and 2?
No.
So... a point is this... this guy (Hubbert) had a lot more interesting things on his mind than Peak Oil... and having peak oil as a focus as anything other than a lame joke at this stage of the Price System is only funny.
Peak Oil is a scam.
Burning carbon... the whole issue of that is a dead letter.
Solar is capable of taking over.
If that is also monetized then the same issues of dysfunctional class/caste system society just go on ... and the destruction of the earth... for desultory purposes... making of money ( debt tokens )... just goes on.
So score another one for the Oil Drum and its focus of money and money economics over substance.
Fitting a curve with an ad hoc modelling function is not a prediction. And giving to it a physical meaning after using it is not correct.
Better to construct a physic-economic model, but very hard to do.
The true predictor is in the ensemble mean that is achievable from the "peak oil update" section.
What about updating it?
Update the peak oil update, please!
Tongue in cheek. Check
Flameproof suit on. Check
http://mahalanobis.twoday.net/stories/264091/