More evidence related to the high cost of horizontal drilling and fracking
Posted by Gail the Actuary on November 4, 2010 - 10:36am
Arthur Berman recently explained why he thinks the Marcellus Shale will disappoint. I was comparing some drilling costs to total revenue, based on EIA data, and I wonder if the problem with high costs might not be quite wide-spread.
Comparing the cost of drilling in a year to total revenue in a given year is in many ways like comparing apples and oranges, because (hopefully) the benefit of drilling will last many years, while revenue relates to accumulated past drilling efforts. But in another way, it is not such a bad ratio to look at, because it tells us what is likely happening to cash flow, and a major change might alert us to a possible problem.
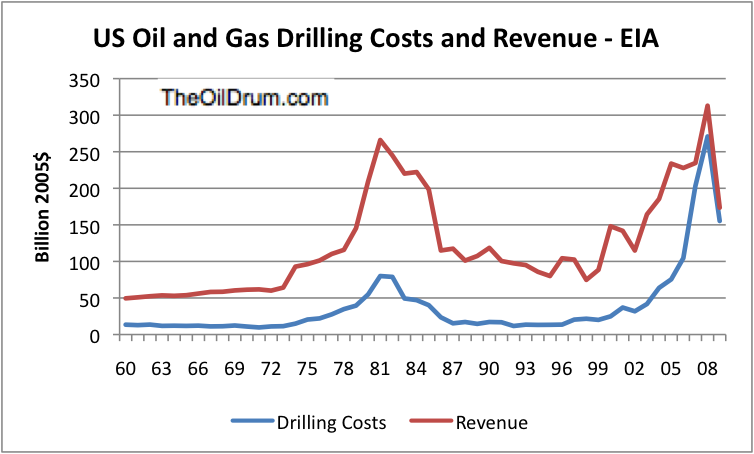
Figure 1. Revenues from Annual Energy Report 3.2 Value of Fossil Fuel Production. Cost of drilling is calculated by multiplying number of wells from Crude Oil and Natural Gas Exploratory and Development Wells, 1949-2009 by the average cost per well from 4.8 Costs of Crude Oil and Natural Gas Wells Drilled, 1960-2008, based on an annual API survey. The 2009 average drilling cost was estimated as the average of 2007 and 2008 drilling costs.
Between 1960 and 2003, oil and gas drilling costs ranged from 12% to 32% of oil and gas revenue, averaging about 21% of revenue. For 2007 through 2009, drilling costs are in excess of 85% of oil and gas revenue. A likely explanation would seem to be the large amount of horizontal drilling and fracking being done now.
Ratio of Drilling Costs to Revenue
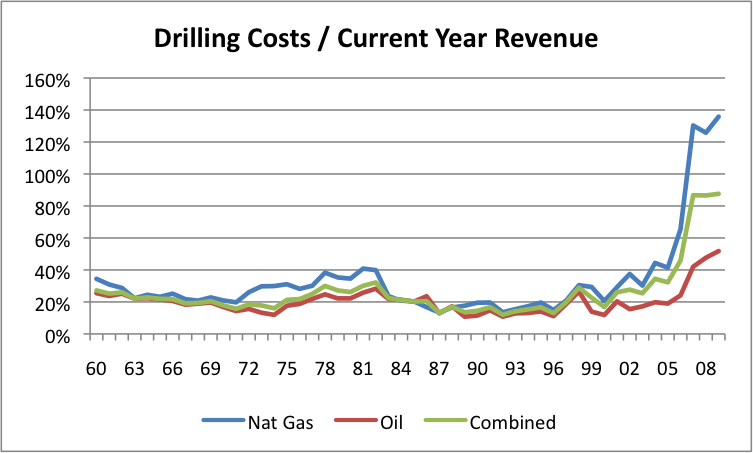
Figure 2. Ratio of drilling costs to total revenue, based on the amounts from Figure 1. The split between oil and natural gas drilling costs is based on the ratio of drilling feet for successful wells.
Since many wells produce a combination of oil and natural gas, attempting to split oil and gas costs is problematic. In Figure 2, I made a rough approximation, and as can be seen, natural gas drilling costs are higher than those of oil. This is not too surprising, given the amount of recent horizontal drilling and fracking for shale gas. Much of the oil would seem to be from wells that have been in place for years, and this would seem to keep drilling costs down, relative to current production.
Clearly, in order for drilling costs greater than 85% of current revenue to make financial sense, production must rise a great deal in the future, or the price of oil and gas must rise a lot, or some combination of the two.
Future Oil Prices
It is not clear how much prices will rise in the future, because high oil prices tend to be recessionary. Dave Murphy has shown that oil prices of $80 - $85 barrel seem to cause recession. This seems to happen because higher oil prices reduce discretionary spending, and this in turn causes recession. The recessionary effect may also reflect the low Energy Return on Energy Investment of high-priced oil. Since the economy needs considerable net energy to maintain its current level, the low EROI may by itself tend to slow down the economy, just as if we attempted to use oil that "cost" more than one barrel of oil to extract.
How High Can Natural Gas Prices be Expected to Go?
What is the price for natural gas that corresponds to the recession-inducing level of $80-$85 barrel for oil? This is not immediately obvious. While people often use "barrels of oil equivalent" (BOE) based on heat values to equate natural gas to oil, natural gas prices are virtually never this high in the US.
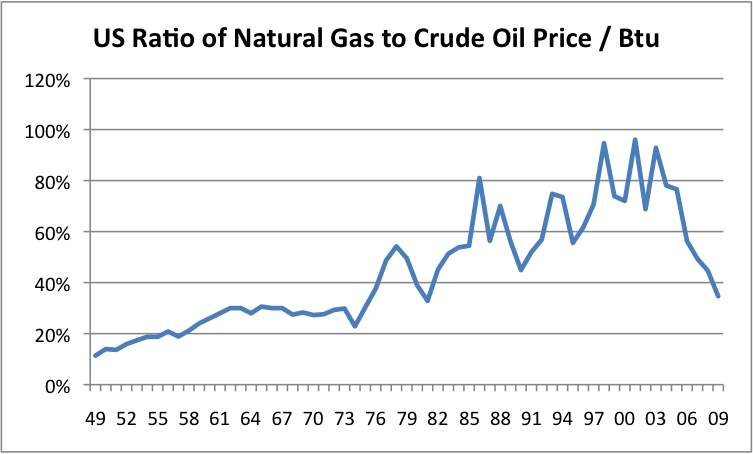
Figure 3. Based on 3.1 Fossil Fuel Production Prices, 1949-2009, where the natural gas price is the wellhead price and the oil price is the "Crude Oil Domestic First Purchase Price," both on a Btu basis.
Figure 3 shows that the ratio of natural gas prices to crude oil prices has varied greatly. In periods of natural gas shortages, natural gas has sometimes traded above 80% of the price of crude oil, but in general, the price has been lower--often much lower. A more reasonable estimate might be that natural gas prices can be expected to be roughly 60% to 70% of oil prices, on a Btu basis. Thus, instead of being 1/6 of the oil per-barrel price (which one might expect based on Btu values), a better estimate might be (1/6 x 60% = 10%) to (1/6 x 70% = 11.7%) of the oil per barrel price.
Using these ratios, the rough upper limit for natural gas prices without inducing recession might be $8 to $10 per million Btu (based on a range of 10% x $80 = $8 to 11.7% x $85 = $10). If natural gas prices can be expected to stay below $8 to $10 per million Btu in real terms (except for brief recession-inducing spikes), this means that there must be a very large increase in future natural gas production to justify the current high natural gas drilling costs, because companies have considerable expenses besides drilling costs. Either that, or the costs are too high relative to the revenue that can be obtained from natural gas--pretty much what Art Berman has been saying about the Marcellus Shale.
Bakken Oil Drilling Costs
I started wondering about the Bakken oil in North Dakota, also. This is shale oil, which is extracted using horizontal drilling and fracking. If I look at the Baker Hughes rig count report, I find numbers which can be graphed as follows:
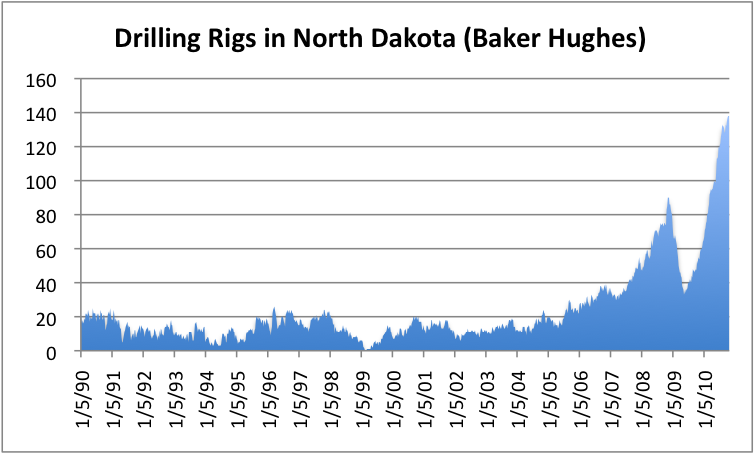
Figure 4. North Dakota Drilling Active Rotary Rig counts, based on data of Baker Hughes.
As of the latest report, the number of active drilling rigs is 138. How many wells these drilling rigs can drill, and the cost, well depend on the type of development. If we estimate costs based on a recent Lario project we are able to obtain, then each drilling rig will be able to drill 6 wells a year, at as cost of $2,500,000 for drilling, plus $4,855,000 for fracking. (This assumes 1240 acre spacing, 2 months to drill each well, and 30-36 stage fracking, which would take an additional 4 months.) Based on this usage, 138 x 6 = 828 wells can be drilled a year, and the total annual cost would be $6.1 billion. If closer spacing were used, the wells might be less expensive, and take less time to drill, but presumably the total cost for the wells drilled by 138 drilling rigs would be similar.
On April 5, 2010, Downstream Today issued a report called Platts Unveils New Bakken Price Assessment. Among other things, it says
Platts reports that current Bakken crude output is about 200,000 barrels per day (b/d) and the North Dakota Pipeline Authority estimates that the field's yield could rise quickly to between 400,000 b/d to 500,000 b/d over the next 10 years before tapering off.
The report also indicates
The world's first price assessments valuing crude oil produced from the Bakken Shale formation in the central United States will be published by Platts beginning May 3, 2010.
I did not find the new Platt's price. The Downstream Today report compares the oil to North Dakota Sweet, or to North Dakota Light Sweet. North Dakota Sweet is currently trading at $62.70 barrel, which is $20+ below WTI crude. The EIA's Domestic Crude Oil First Purchase Price by Area shows North Dakota prices shows North Dakota prices something like 10% below the highest priced oil (Louisiana's), a much smaller price differential. These amounts are before royalties and other taxes.
Suppose that companies operating in North Dakota produce 400,000 barrels a day of crude oil, at $75 barrel. The total revenue will be 400,000 x $75 x 365 = $10.95 billion a year, and according to Lario estimates, natural gas would be expected to increase revenue by about 6%, which would bring the above amounts to $11.61 billion a year. With this comparison, drilling at $6.1 billion a year, estimated above, is not as bad a prospect as on natural gas, but it does make one want to look at the numbers more closely. Will companies have to keep re-fracking the old wells, and drilling new wells, to keep a reasonable level of production?
All of the calculations oil and gas companies give to their investors are made using assumptions about how productive wells will be, what their decline rates will be, and how long they will be economic. It is very easy to be over-optimistic. These initial Bakken numbers suggest that it too, will generate very high drilling costs, although not as high as for natural gas wells.
General Issues
One of the issues we are running into now is that to an ever greater extent, new energy production costs are very much "front ended". This is true for solar photovoltaic panels, and for wind turbines, for deepwater production requiring more elaborate drilling platforms (or "spars"), and now for horizontal wells with fracking. There are multiple difficulties with these high front-end costs. One of the issues is simply financing them all, since it is hard to finance them through cash flow. Another issue is the natural tendency to be over-optimistic regarding how valuable the current investment will be, and to underestimate the ongoing costs required to continue to make the investment economic.
Clearly this type of analysis in this post is only of the type one can do on the back of an envelope. But it, together with the questions Art Berman has raised earlier, makes one wonder whether a more detailed analysis is needed, where ever drilling costs are very high relative to revenue. It is possible that everything will turn out all right in the long run, but it is also possible that companies making the projections are being over-optimistic in their assessments.
Note: Many thanks to Lario Oil and Gas and Oil for generously providing a proposed development scenario from a recent Lario Bakken oil and gas project, and thanks to Arthur Berman for helping obtain this.
Note regarding API Survey: This is a link to the API Instructions for Drilling/Completion Costs, which I received from them. Many thanks to API also!
Contact
- Content: editors at theoildrum dot com
- Tech support: support at theoildrum dot com
License

This work is licensed under a Creative Commons Attribution-Share Alike 3.0 United States License.
thanks for the data from nd bakken. i see some areas of your analysis that could use tuning.
most of the wells drilled in the nd bakken are on 1280 ac spacing, 2 sections.
a drilling rigs operating in the nd bakken can drill about 10 wells per year. the actual drilling takes 4 - 6 weeks and then moves on. the rest of the work is done with a workover rig.
many companies are using 2 rigs to drill each well, one to drill and set surface casing and another to drill to the bakken and then horizontally in the bakken. the point being that rig count is a little vague.
the ndic currently shows about 147 such (bakken)rigs operating in nd.
the 30 plus frac stage well design is used by some companies, but has not been proven optimum. some companies opt for maybe 24 stages. the cost of the frac stages provided by lario ,$4.85 million, puts the cost of frac'ing into focus, imo.
re-frac'ing has all but ceased and has been replaced with multi stage frac'ing. re-frac'ing may re-emerge.
your drilling and completion costs give a starting point, but i assume this will only increase.
given the blistering decline rate on these wells, many rigs will be needed to maintain production ,for even 1 year.
public traded companies are, imo, overstating reserves by a factor of 2x, typically.
land costs have gone astronomical, adding more than $7 million to the single well cost on a 1280. granted many companies already have the land, but many are 'buying-in' as well.
the multi well per spacing unit assumptions of many public traded companies is questionable at best.
eog resources announced a quarterly loss yesterday. i don't know what that is about. eog is the most successful operator in the nd bakken.
Perhaps they lose money, on average, on each well--but they plan to make it up with volume?
It sounds like EOG Resources problems are on the natural gas side of things:
It was the CEO of EOG who said some time ago that their opinion was that the EIA was substantially over-reporting US Natural Gas production and that US natural gas was declining and not still increasing.
Also from your linked article
And also this
Hmm, we just read that Chesapeake is also moving away from UNG to oil as well
http://www.rigzone.com/news/article.asp?a_id=100024&hmpn=1
An economist for Chesapeake (whom I met at the ASPO-USA conference) said that Chesapeake is drilling a lot of natural gas, under "drill it or lose it" provisions of their leases. Her feeling was that US NG production would go up for this reason, and prices would drop further. There are also companies that are producing oil from sources that produce a mixture of oil and gas, and getting gas, whether they want it or not.
It would be good to get better natural gas production numbers, but for now, we need to assume they are right.
The EIA responded to the EOG CEO's (and others including Simmons) comments that production was lower than indicated by the EIA with a statement that they had discovered a flaw in their production estimating process and to expect downward revisions which could be substantial. No such "substantial" downward revision has yet occurred therefore I don't feel the need personally to "assume they are right" :-)
Nor am I especially convinced by the EIA's claim that 2010 NG consumption in the USA has rebounded out of the recession to an immediate all time high (given other economic indicators). Perhaps it has but I'm leaning towards believing that current US production and consumption data is overestimated - as EOG still says.
Incidentally I'm fairly sure that the EIA is also underestimating refined product shipped abroad again by a substantial margin in the weekly reports. That's the difference I think between the MasterCard gasoline consumption data and the EIA's. That suggests to me that US current oil demand is down maybe about 1% on this time last year as compared to up 0.3% as the EIA reports and that gasoline is down between 2 and 3% in the latest weeks as compared to exactly the same as last year reported by the EIA.
After thinking about it, you are probably right.
When a person looks at the breakdowns available for natural gas, most of them are only available through 2008--hardly up to date. Natural gas production includes a huge number of "Ma and Pa" size operations, and I am sure it is hard to get good data from them (or to estimate what is omitted).
Consumption data would seem to be easier to get, but who knows how it is really done.
These are some graphs, for people who want to see what the EIA is reporting.
This is US production, which has been rising:
This is Natural gas drilling rigs, that dropped way back in late 2008 and early 2009 when prices dropped. A person might think this would mean that fewer wells have been drilled recently, and makes it harder to believe that there would be a big spike in NG production.
This is what the EIA reports as consumption. It is quite seasonal, since people use NG to heat with, and to increase electrical production for air conditioners in summer. It includes imports from Canada as well as US production.
With the low price of NG, and with the warm summer in parts of the US, it may not be too surprising that NG consumption is recently up. (Although one might expect with economic activity down, industrial activity should be down, and this doesn't seem to be the case, based on breakdowns given by type of consumer.)
And here's the 8-month Year to Date US NG consumption figures.
Note that 2008 was the previous peak year for reported consumption.
2010 is up 5.5% on 2009 YTD according to the EIA. I also note that the balancing item for 2008 YTD is ridiculously low at -4 BCF (an accuracy of 1 in 4000) compared to previous years making me wonder if the EIA has taken reported production and adjusted consumption to match.
Figures from http://www.eia.gov/pub/oil_gas/natural_gas/data_publications/natural_gas...
I've also mentioned before that the relatively small initial drop in US consumption during the recession is way out of line with data from other OECD countries. It is difficult for me to believe that consumption wasn't down further.
Gail,
In regard to your Graphic entitled "US Natural Gas Consumption - EIA.".
This comment is totally off topic. This form of color based graphic data presentation is very difficult to comprehend. I am not color blind, proven, being a current (male) aviation pilot. Lots of males are however color blind. It is not your fault Gail, but I see this sub-prime form of graphic communication everywhere. It is not good. Perhaps it is just me.
CheersJuan
Sorry. It is hard to use anything to show amounts that fall practically on top of each other.
By the way, I have a son who is color blind, so I should be more aware of this issue. (I am a carrier.)
I was assuming that the Baker-Hughes counts were just for the "big" rotary drilling rigs. I assumed that the workover drilling rigs doing the fracking wouldn't be in the count.
The material I received is, at times, a bit difficult for a lay person to understand. The oil assumption is 370,000 barrels a well, with average production the first month at 908 barrels a day. A graph provided shows production down to 1290 barrels month (43 barrels a day) by the end of the first year. By the end of year five, production is down to 1050 barrels month (35 barrels a day). By the end of year 15, average production is down to 600 barrels a month (20 barrels a day). The graph stops at year 15, but the assumption seems to be that production goes on much longer--34 years total is a number I calculated, but is not shown anywhere on the material I received.
yeah, the ndic drilling statistical update seems to indicate about one well per month for all wells drilled. so 10 wells per year is probably a good guess for the bakken.
https://www.dmr.nd.gov/oilgas/stats/2010monthlystats.pdf
this one shows the ndic version of production performance expectations:
https://www.dmr.nd.gov/oilgas/presentations/ActivityandProjectionsWillis...
the curve is wildly optimistic and flattens 'a lot' more than substantiated by production data. i dunno where the ndic is getting the forecast, i assume they are using what public traded companies have fed them.
you may have to advance to page 17.
Mr. Berman I believe is also on record as saying fewer that 13% of the 3,400 horizontal wells in the Barnett will ever pay out, even at $6.25 per MCF gas prices. If I wrong my apoligies to him.
I suspect the economics on Eagle Ford shale wells in the updip oil leg of S. Texas will will ultimately be similar to the Bakken. Or worse.
Mikey,
I believe that I said that 25-30% of Barnett horizontal wells would pay out at $6.25/Mcf. That was based on well head prices and costs for 2007, meaning that gas prices were higher than now and completion costs much lower because operators had not graduated to 20+-stage fracs and were probably using 5-10.
I am presently evaluating the Eagle Ford and my initial impression is that the EUR per well in the best wells is much lower than the Bakken. At the same time, EOG reports something like 450 mboe as an average and Talisman even higher.
Art
450 mboe is about what can be substantiated from performance history for the first 3 dozen or so wells in parshall field. some of these wells go back to 2006 and this analysis is based on wells with at least 2 years production history.
i doubt the average bakken well (excepting parshall and sanish) will come close to 450 mboe. some wells have already produced 600 mbo, but the average eur is still in that 450 mboe range. eur stated in boe's is misleading here, because of gas flaring.
Yep. We can chose to either consume X now or consume X+Y later. We have a finite amount of energy available to us at any given point in time. We can either chose to consume that energy by:
-driving to the beach
-eating an expensive meal with lots of meat
-buying cheap goods trucked in from far away
-etc....
Or we can chose to invest that energy into productive assets
-drill new oil wells
-build local greenhouses
-build wind turbines
-etc...
The latter actions facilitate more of the former in the future. Not a perfect example but the idea is pretty clear. The tradeoff between present and future consumption has always existed but it is more obvious (and more painful) now.
Edit: perhaps I should have said "...consume X now or XY later where Y>1
This is plain bonkers...are we really saying getting the NG out of the ground costs more than the retail price?
You can always convince yourself that the benefit of drilling and fracking will last a long time, and the price will rise. Not sure that that is true.
Gail - But that's the great weakness of the SG plays: time. With the high depletion rates the operators can't wait for higher prices to save them. An operator has to recover development costs in the first year or so. Otherwise higher future prices that might develop will only apply to a much reduced sales volume. A few weeks ago then CEO of Devon essentially said that even a sudden and totally unprecidented rise in NG prices will only provide a minimum of relief to his company. Those high rate wells drilled in '06 -'08 have significantly lower flow rates to so even $10 NG won't return many exsiting wells to a net profit. It would give the company a little boost in cash flow but wouldn't be able to turn a money losing investment into a profitable one. of course, $100 NG would boost new SG drilling. But only by those companies that have survived the bust and have access to capex AND are willing to tajke the chance that another price bust will hit them after the ramp up drilling efforts.
isn't there some sort of catch 22 here?
I mean the way things are valued from money down instead of exergy up?
if they are banking on the price going up the actual creation of surplus capacity shoots themselves in the foot (the accordian)
midi - In can work out that way in some cases. When we drill a well it's done with specific expectations of how much reserves we'll find and what it will sell for. But once the well is drilled those numbers become much less relevant. I can drill a well for $6 million with the hope it will produce $15 million of net reserves. But once the well is drilled I discover it will only produce $5 million worth of NG. But it will only cost me $2.5 million to complete the well. So on a total cost basis I spent $8.5 million to produce $5 million worth of NG. But I will complete the well because that $2.5 million investment yields $5 million in revenue or a simple 2:1 return. How much I spent to get to the this completion point is a "sunk cost" and has no bearing on going forward decisions. Thus calculating the entire cost to drill and complete I may be selling NG for less than it costs the develop. And then if NG prices go lower I would still sell my NG for even less because my production costs are much less than the sales price. I won't make a guess at the number but there may be a fairly large portion of current UNG production that is still being produced even though the total cost to develop the reserves is far greater than the cumulative revenue from the production.
I can talk with some credibility about the east Texas shale gas plays that Devon developed when I was under contract to them. Once NG fell below $6 per mcf or so Devon was not going to recover their investment in new wells let alone make a profit. But it didn't matter if they were selling NG that cost them $6/mcf to develop for less than $4/mcf. They were still going to sell every cubic foot of NG they could. At that point it's all about cash flow and not profit. Even if NG fell to $2/mcf most of these wells would be keep flowing because the production costs would still be lower. A very few operators can afford to reduce production rates while waiting for NG prices to rebound. In fact, it's not uncommon for operators to push their rates to a max in order to raise cash flow as high as possible. "Profitability" is seldom mentioned during low price periods. "Survival" is a much more common topic.
I know I'm a slow learner and all that...takes a while for this stuff to sink in despite reading it 1000's of times over
basically the oil and gas business is a [complete] crap shoot especially at the margins
cheers to the collective
midi - true but it depends on who's rolling the dice. The public companies bought themselves into a no win game: they threw money like mad at the SG plays because it allowed them to book a lot of reserves (on paper) very quickly. Wall Street calls the shots for these companies: increase your reserve bases y-o-y and we'll hype your stock. Fail to do so and we'll down grade you. Profitability wasn't a concern: that failure won't show up for some years. But the next quarter reserve growth is at our finger tips now. At the other end of the spectrum are privately owned companies that don't broadcast their reserves to anyone but perhaps their bankers. For them it's all about profit.
But both group suffer from the time lag. A well that looks great when it's completed looks poor when prices drop. That's why a common decision metric for many companies is payout time. If it takes more than 24 months for a well to recover its capex it becomes much less attractive since the longer recovery period makes it more susceptible to price drops. There are many operators who are selling NG for less than $4/mcf that justified the original drilling with $8/mcg expectations. OTOH there are many operators selling oil for over $80/bbl that based their original drilling decisions on $40/bbl pricing.
It's difficult to find a middle ground. I've seen as many companies fail because they didn't drill enough as companies that drilled too many dry holes. What makes it even more difficult is that resource plays like SG are so heavily dependent on short term price fluctuations. Conventional fields will have swings in profitability over their longer lives. But they persist. SG wells have to make their profit in the first couple of years. That's why most of the SG plays died overnight when prices fell so fast.
this would suggest that market pricing is not responding close to the margin in a useful manner?
when you/one is/are trying to exploit marginal reserves the middle ground as you term it despite being hard to judge is not leading money away from attempting the impossible....as it where
because the time lag can be of import to share values!.. the abstract and very much more subjective value of the companies shares is an incentive to [as it stands] developing marginally resources AND sending the markets in general poor price signals? Trading in shares places a high demand on the buyers and sellers to look at the true fundamentals of a given situation if that value is going to truly represent the company's state of health.
if reserves being booked is the single metric the buyers reach for then that perception needs to be corrected?
midi - "if reserves being booked is the single metric the buyers reach for then that perception needs to be corrected?" A mighty task indeed. But not so much correcting buyers as Wall Street. WS pushes or dumps stock by their own metric. And that often seems to be predominated by y-o-y reserve/income growth. The other obvious complication is short term investments. Folks who bought Devon or Chesapeake low and sold high did great. Those who bought the stock based on long term (several years) expectations were slaughtered. And we also can't ignore herd mentality. When the oil patch crash came in late '08 Devon fell to $38/share...a completely unsupported valuation. If you had bought Devon at the low you could have doubled your money in about 6 months.
After 35 years, often including valuation of corporations during my acquistion years, I've often found that stock value had very little correlation to asset value or long term profits. As was oftened pointed put: they aren't selling the steak...they are selling the sizzle. And the SG sizzle was so hot in the early days that some knowledgable operators ignored what the knew to be reality and bet the farm. Since then they've been selling off pieces of the farm just so they can make payroll. I.E. Some folks see the latest trade between Chesapeake and the Chinese as a sign the CHK is coming back. It's actually a sign of CHK's continued weakness. You don't trade away you most valuable assets (as Devon did with its DW Brazil leases) at bargain prices unless there's a gun at your head.
then is it fair to say that after 35 years experience the judgment is that "the market" fails to optimize resource allocation?
in a word?
midi - In a word no IMHO if I follow your meaning. But that's not a big surprise. The job of the "market" isn't to optimize resourtce allocation. The "market" doesn't give a crap about anything but profit margin. But that probably also depends on what you mean by "optimize". Or more correctly: optimized for who's benefit?
Gail, this is amazing! I had not looked at cost / revenue this way before. Figure 1 is amazing. Clearly the industry is in a position of it has never been in before. (I wish we had data running back to the great depression.) Costs have exploded and are pressing even record high revenue values. Thank you for finding and posting this.
Never in this time series has the industry been willing to risk this much capital with such thin margins. It could well be that this is another symptom of the huge credit bubble. All this land was purchased with cheap money, and now the E&P players are trapped trying not to default?
If one looks at the cost chart there is a 10 times increase in natural gas drilling cost from 1992 to 2008 (see pg 113 table 4.8) How much is land cost increases I wonder?
http://www.eia.doe.gov/emeu/aer/pdf/pages/sec4.pdf
10 times the input for (at most) an very modest increase in gas production. This is exactly the pattern of cost increases seen before the peak in gold production. A radical cost increase in production for essentially no gain.
I hypothosis that net energy from natural gas acually peaked sooner. So production may have risen, but the 10 times increase in effort likely drove the net energy back down. I will run an estimate this weekend using the value of 24Mj per $(2002) invested in oil and gas extraction that I derived from the Green Design Institutes EIO-LCA software
If anyone wants to do this sooner the formula is:
Net Energy = Marketed Production(converted to energy) - ($Inveseted by industry(real 2002) * 24Mj/$
The EROI = Marketed Production (converted to energy) / ($Invesetd by industry(real 2002) * 24Mj/$
This won't be a perfect estimate by any means, but is about as close as we can get with the public data.
Thanks!
A person always wonders if everything is lined up the way it seems to be - the revenue comes from one EIA table, the wells drilled come from another EIA table, and the cost per well comes from an API survey. So there is always a chance that something is a little off--for example, perhaps the API survey doesn't exactly match up with some of the EIA numbers. But things look so consistent, and seem to match up with what we have seen elsewhere, so it seems like we can assume that pattern we are seeing is real--but a pretty awful one.
It seems like the natural gas situation is likely to resolve badly--as producers find themselves unable to pay back their loans when they become due. As you say, this is closely related to net energy.
I think one thing that natural gas producers may have been kidding themselves about is the value of natural gas relative to oil, based on BOEs. Natural gas is harder to transport than oil, and has more costs between extraction and final use than oil, so even if its net energy looks good when extracted, but the time it reaches its final destination, the net energy is a lot lower. So it is reasonable that the selling price of natural gas will be lower than oil, especially if there is more than the market can use at a given time.
I think you are right overall. NG is expensive to handle. It was the last fossil fuel to enter widespread use and I am guessing because it is expensive to distribute.
Natural gas does not go through the same refining stage as oil, but NGLs do get cryogenically separated and that takes about 10% of the energy content (from US Census of Industries). The EIA reports about 10% of all NG is used powering the lease and gas plant equipment. I am not sure how to explain the discrepancy.
It would be very handy to know the energy cost of running the NG compressors. If anyone operating a lease is willing to share that kind of info, I would love to see it (email in my profile). It would also be interesting to know the % of gas consumed putting it into compressed storage for winter. Our society already does load leveling of energy production / demand. It would be interesting to know how much we currently pay for that service (in energy).
I did some quick calculations on Net Energy of US natural gas production using the formula above (but GROSS production instead of marketed) and using the EIA data you referenced, which runs through 2008 only. This is very rough as I don't know the boundary conditions of the data collected on per foot drilling cost. If the boundary conditions don't match my estimate of energy per $ then these numbers will not be correct, but the trends will still go the same direction.
EROI fell from 66 in year 2000 to 6 in 2008. (EROI of 10 means 10% of the energy returned was consumed doing the drilling).
Peak in net energy was in 2001 at 1.92e10 Giga joules of gross gas production. Net energy delivered dropped to a low of 1.77e10 Giga Joules in 2007.
Essentially the industry passed net energy peak in 2001. All the extra drilling since then has actually delivered less energy to society because the drilling effort consumed the extra energy.
At this point, society must either:
1. Contract as the net energy supplied declines
2. Become efficient faster than the decline in net energy.
3. Invest in energy sources with greater than 6:1 energy return.
If this analysis is even close to correct (and without better understanding of boundaries I cannot answer that), the natural gas industry has peaked in energy production. This may be the best definition of peak production in any given region. Society cannot continue to grow on this regions natural gas resources.
No matter what, the EROI trend is sharply negative with these high rates of drilling. Doubling drilling again (to grow production) would likely drive net energy production down further and faster.
Thanks! I'd be interested in whether Dave Murphy has any thoughts with respect to this, since he may know more about what boundaries are commonly assumed.
Prof. Charles Hall showed this slide at a recent conference. I am not sure what boundaries the EROIs shown were calculated. But this graph seems to be showing a steep recent downward slope in EROI also.
Do you think the API would be willing to share the drilling cost survey question form(s)? Or an old drilling cost report (like 10 or more years back) so we could look at what data is included in the drilling costs.
For instance, does the data include lease operating costs? Or NG compression costs? Etc? If it is drilling only, then I might be over estimating the amount of energy per $. Also if land acquisition or royalties are included that will cause an overestimation (as those are not energy expenses and should be excluded).
Those would let us get more accurate an EROI value, but the slope will remain similar. Costs are rising much faster than production so EROI is very likely to fall.
I can ask them. It is available on their website to members, but we are not members.
This is a link to the API survey instructions that API was kind enough to send.
This I can follow, but then I think you have a logical fail
All a drop in EROI means, is higher overheads / lower yields.
Thus closer is
4. Produce slightly more raw gas, to make up for overhead changes, to keep the same output delivery volumes.
Nett energy can still occur on almost any positive energy return.
Of course, when it falls under 2, you are consuming more than half of your gross production.
Even that can still be ok, if you raise the price.
Remember, Electricity Generation has low yields / poor EROI, most of the energy is wasted, but it is still viable.
Given that the gas price is falling, it seems there is no forced decline here. More likely, as reported many times here, producers decide to keep it in the ground.
Hi jg,
This is why I think doing net energy at the same time as EROI is so important. And I should have added these numbers to my above report:
Year,  Gross (Gj),    Net (Gj)

2001  1.97e10          1.92e10

2008  2.16e10          1.82e10
Hopefully this helps make my point clearer. The industry did raise production, but to do so required so much drilling they drove net energy down. Gross energy up but net energy down. Is this the end of civilization? No. Not at all. But it does mean that growth powered by this energy source is likely over. Any growth requires 2. or 3. in my list above. Electricity can suffer a large efficiency drop up front, because the end use tends to be very efficient. Electric motors can be 90% and heat pumps can be over 100% efficient.
Now, what happened in 2009 and 2010? Drilling rate drops by half and yet production is up. So either:
A. Some source of gas, such as Louisiana shale or maybe the rockies area with less depleted fields came on-line and now EROI is rising again (Texas production is falling, so it is not Texas shale).
B. A whole lot of people are lying about production (and consumption, and storage) which does not seem likely.
The API does this drilling cost survey every year, but it takes 2 years before the data becomes public. So we won't likely know for another year or two what really happened.
The Disappearance of the Natural Gas Glut
914 data refers to EIA-914 Monthly Gas Production Report Methodology (PDF)
Thanks for this. When I look at the production data that is exactly what I see. The shale heavy states are roughly flat (increases balanced by decreases) and the increases come from "Other States" which are states that are not large producers of natural gas and there is no breakdown.
But - then the consumption numbers should be down (unless those are also fudged) and the shouldn't we see a drop in storage? (I will admit I have not done a calculation of storage = produced - consumed to see if those work out. Maybe someone would be willing to do this?)
NG Storage above the 5 year band:
http://ir.eia.gov/ngs/ngs.html
It is a puzzle.
What is also curious is that only a doubling of LNG imports in January/Feb compared to Jan/Feb last year saved the EIA from having to report that storage was at the bottom of the five year range. The LNG surge allowed them to report that storage was in the middle of the 5 year range. Of course no media source noted the Jan/Feb LNG import surge.
In order to balance storage with claimed production the EIA is estimating YTD 2010 consumption at an all time high. It is my suspicion that consumption is considerably lower than reported. Net imports (LNG and conventional) for 2010 YTD are also slightly higher than for the same period last year.
Still the perceived "gas glut" is holding down US and international prices (which includes my UK gas bill) so maybe I shouldn't complain too loudly :-)
I wrote to one of the EIA staff people (Jeff Little) asking about whether any revisions are to be expected in natural gas production data, related to the April 2010 Gas Methodology change or for other reasons.
Thanks Gail.
I wonder if he might also have any direct comment on Mark Papa's statement if you get the chance to put it to him?
I will see if he has any ideas. In my e-mail today, I specifically mentioned the article that mentioned the Mark Papa's statement. Also the April 2010 change in procedure. I wrote to him yesterday also, but he needed more information.
Again this is Logically/mathematically false.
You can easily get growth, even in nett; you just need to include the energy overhead in your calculations.
Lots of other sectors do this now, without blinking, it may be a new mindset to the Gas sector. They WILL need new spreadsheets.
In the past Gas EROI may have been so high, it was easily ignored.
A change from 250:1 to 200:1, shifts your energy overhead margins from 0.4%, to 0.5%, a move of 0.1% (!)
A change from 10:1 to 9:1, shifts margins by 1.1%, still not huge, but your margins are now well on your accounting radar @ ~10%.
Another way of looking at this, is if we roughly guess the cost of servicing capital at an average 10% of production, then as you move thru EROI of 10:1, your energy costs move from lower, to higher than your servicing capital costs.
Even this is a paper number, as it is your own energy, and directly sales related. No real cash is involved, no anxious bank manager.
One possible scenario:
With the lower EROI, the natural gas companies can't pay back their debt, and there is a big shake-out in the natural gas companies. The amount of natural gas produced goes down. The price tries to spike, but this produces more recessionary impact. The price drops some more, and more natural gas producers drop out. More and more people are out of work, and move in with relatives, reducing natural gas demand.
If the price would go up and stay up, there would be little problem, because the expensive drilling methods would be affordable. But if high prices only induce recession (because of low EROI), it becomes impossible to be able to afford the high priced drilling methods.
Jon - Actually the current situation feels very familiar to me. Dig back thru the data base during the post-embargo days of the late 70's/early 80's. Consider just the lease sales in the federal offshore in the GOM. Winning bids often exceeded $150 million per lease. That's about $30,000/acre. And that 1980 $'s not adjusted for inflation. In today's $'s it would probably exceed $60,000/acre. That makes the prices being paid for Marcellus look like a bargain. And remember: back then oil was selling for less than half of what it is today and NG considerably lower also. We also had over 4,600 rigs drilling in the US at the height...twice as many as we have running today. If fact, given that history of absurd enthusiasm it surprising we don't see higher activity levels today. But I suspect a large part of the reason is the current credit crunch. Back in the 70's all you needed was the word "oil" in your company name and the banks would throw money at you.
The most "interesting" inquiry I ever had was around 1981, when a representative from a Houston based S&L contacted us about investing directly in oil and gas deals. We replied that we appreciated the interest, but we would pass.
For those who didn't understand why WT turned away free money: If you're promoter that makes his living seperating fools from their money then you would hunt folks like that S&L. Otherwise we avoid such unsophisticated partners: they don't understand what they are doing in general and are usually a big pain in the *ss.
how 'bout neal bush ? would you consider him a sophisticated investor ?
elwood - Don't know Neal. He knows what he's doing? And more importantly:is he doing it with his money or someone elses?
i dont know what neal bush is doing now either. he was the posterboy for the s & l scandal of the '80's(silverado s & l). after that he ran a small oil company in denver, jnb exploration. it was once claimed that he had a reputation of failing spectacularly !
i dont know if he knows what he is doing or if he ever knew what he was doing.
http://txoilltd.com/AboutTXOil/OfficersDirectors/NeilBush.aspx
I think he is a guy who does really knows what is he doing.
____
hostgator coupon
hostgator coupon
Hi Rockman,
That is why I was surprised to look at Gail's Figure 1. The early 1980's look like they had a much higher spread between cost and revenue than we are seeing today (maybe Gail can examine the data see what the tightest spread was then and now). Something odd is happening. Is this the worlds largest credit bubble looking for a way to invest in real assets? Does this mean anyone without access to a very deep credit line will be destroyed by the flood of money to a handful of large producers? I don't know.
How do you see this play out?
Jon - I haven't had time to dig into Gail's sources. One big question is whether the cost just reference wells that were productive? Or do the costs include the capex spent on dry holes? I can offer that during the late 70's boom monies spent of dry hole + monies spent on wells that proved to not be commercial possibly exceeded the capex spent on successful wells. Of those 4,600 rigs drilling at the peak I promise at last half were drilling wells that lost money...sometime a little...sometimes a lot. And do the numbers figure in lease costs? Over $2 billion were paid to the feds for leases in the Destine Dome area off FL. And how much oil/NG was produced from those leases? Easy number to come up with: exactly $0. Bottom line: I always find it difficult to see the stats fitting my anecdotal experiences. Another factor that makes it difficult for me to judge the numbers: big price swings. In 1986 I could drill and complete a 4,000' NG well in Texas for $50,000 at a time when I was selling NG for $1.20/mcf. But during this low price period I delivered the highest rate of return to investors than at any other time during my 35 years. In 2008 it costs $750,000 for the same well when NG was selling for $9/mcf. Today I can drill the same well for $450,000 while selling the NG for $3.80/mcf. Today it costs less to drill a horizontal SG well but then again NG is selling for 70% less than during the height of the drilling boom. Adding to the complications from inflation/deflation you have that time lag issue. A SG well drilled by Devon in July '08 looked quite profitable at the time ($13/mcf). But looking back from today that well didn't even recover all of its capex let alone make a profit. By January '09 Devon released 14 of the 18 rigs drilling SG in east Texas and paid a $40 million penalty to do so. Is that $40 million spent to NOT DRILL WELLS figured into the stats? What about the 100's of million $'s spent on leases that will never be drilled? Today the hottest conventional NG in the Gulf Coast is driven by expensive 3d seismic. Has that multibillion $ expense been factored into the well costs numbers? It should be because, IMHO, at least 90% of the deep NG drilling wouldn't happen if the 3d weren't shot.
There also a huge change in the geologic base today from 30 years ago. The GOM shelf really boomed in the 70's. New seismic technology greatly improved the success rate for NG exploration as the same time as NG prices began booming. And that was a big part of the reason for the huge crash. Rather similar to what we've seen in the last few years: boom in SG driling ramps up production just in time to get smacked up side the head by recession induced demand drop.
The table gives separate values for oil wells, gas wells, and dry holes. The dry holes are the most expensive of the three categories, both on a dollars per foot and on a total dollars per well basis. Dry holes are less than 10% of the footage drill, but perhaps a bit more than 10% on a total cost basis.
The table also gives total well counts, and average costs for all wells, including dry wells (so one can get total dollars for all wells). I used these totals, then tried to allocate them between oil and gas based on information for successful wells of the two types.
Thanks Gail. I have to find some time to dig through those numbers. The less than 10% dry hole number sounds rather supicious. Even today with 3d seismic we don't approach that low a dry hole rate in the conventional plays. The SG plays may have a high completion rate but completing a SG that only produces half the revenue it cost to drill wouldn't be logged as a dry hole.
Dry holes aren't split in any way between oil and natural gas, which is a problem.
Presumably those doing the drilling know what they were hoping to get, but the rest it is not shown in the data. So there could be more natural gas dry holes, and fewer oil dry holes, but I can't tell.
The definition of dry hole may also be different from what is economic to drill. They may find a little oil or gas, and the well will be categorized one way or the other, even if they actually end up abandoning the well.
yeah, dry holes, economic dry holes and opm disposal wells.
I can see two reasons why oil from the Bakken formation will not fetch the WTI crude price, now at $87 per barrel:
1. Because of the relatively new areas being drilled and the small quantities of oil produced (many wells are 100 to 500 bbl/day or 0.7 to 4.0 truckloads/day) the pipeline infrastructure does not exist and cannot be built for profit. So the oil is usually trucked to the refinery in Mandan, ND or Billings, MT or put in a RR tank car for delivery to other oil buyers in MN (St. Paul) and MT (Great falls and Laurel). The cost to truck the oil would be about $4 to $5 per barrel for a 150 mile distance. Shipping by rail for 300 miles would be about the same cost. As diesel fuel prices climb, so will cost of shipping, thus keeping Bakken price depressed.
2. The increase in Bakken oil production, and to a lessor extent tar sands oil production, has overwhelmed the region's refineries and they do not have capacity to process all the oil available. Its a buyers market. So for refiners at the end of the south to midwest pipelines, the WTI will fetch a high price as its delivery cost is very low. For midwest refiners obtaining Bakken oil is more complicated (maybe two or three transport companies involved), costly and probably bought in smaller batches as compared to WTI, GOM or imported (IMO).
That is some inspirational stuff. Never knew that opinions could be this varied. Thanks for all the enthusiasm to offer such helpful information here.
sensual massage
tantra london
tantric massage london