| Fukushima Dai-ichi status and potential outcomes | The Oil Drum | Belgian & EU Parliamentary Meetings on Peakoil & Energy Policy |
Tech Talk - Oil producers just below 1 mbd: India, Argentina, Egypt, and Oman
Posted by Heading Out on March 20, 2011 - 10:03am
In 2008, there were nine countries that produced between 500 kbd and 1 mbd, according to the EIA. Of these, Azerbaijan has been able to increase production to just over 1 mbd, and I wrote about it last week. Therefore, let me look at the first four of the remainder – India, Argentina, Egypt, and Oman, in this post. The latter two are some of those countries where popular protests have, in one case, brought down the government, and in the other,have caused some changes to be made. How this will play out in terms of oil production and oil exports remains one of the questions which is currently unanswerable.
India was producing 888 kbd of oil in 2008. It is a country with recognized growing demand for oil, to the point that Libya’s Gadaffi has offered it the chance (along with Russia and China) to replace Western companies who have shut down operations because of the turmoil. The growing internal demand for vehicular liquid fuel, remembering that India was the country that introduced the Tata Nano, is reaching record levels. Growth for different sectors of that market are rising at more than 10% a year.
Local car sales jumped 23% from a year earlier in February to 189,008 vehicles, according to data issued Wednesday by the Society of Indian Automobile Manufacturers, an industry lobby group. The figure is more than January's all-time monthly record sales of 184,332 cars.
Indian demand for oil is now more that 2 mbd above domestic production and the country is increasingly dependent on imports. In 2009, the EIA showed where these came from:
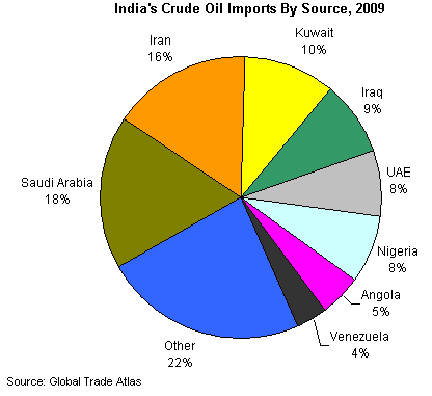
As one looks at the coming global oil market, therefore, India is one of the BRICS nations (Brazil, Russia, India, China and South Africa) that will drive increased international trade, likely well above the levels of today. The EIA considers that Indian growth will be on the order of 100,000 bd per year, which will likely have to be met by additional imports.
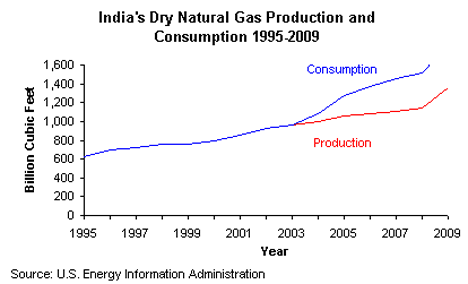
The Indian situation in regard to natural gas is similar. Although production has started to increase signficantly, demand continues to outstrip it.
In the global market, India has often been overbid by China as both seek to guarantee fuel supplies into the future. India is currently seeking to add Russia to its suppliers and there has been an ongoing effort to run a pipeline down from Turkmenistan into India, via Afghanistan and Pakistan, for a number of years (the TAPI Pipeline). At the moment agreements are reported to be imminent, and these will be followed by natural gas purchases. It should be remembered, however, that the pipeline has to run through Afghanistan, and over its thousand-mile length will pass through Kahdahar Province and then through the troubled tribal areas of Pakistan.
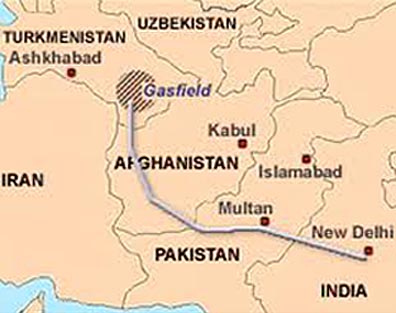
The pipeline would deliver up to 2 bcf from the rich Turkmen fields, though some of the resulting flow would likely be tapped along the way to help both transmitting countries, before the remainder reaches India.
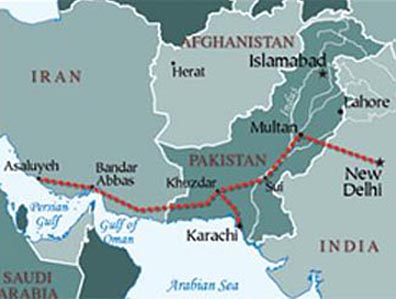
An alternative would be to run a pipeline from the natural gas fields of Iran down through Pakistan into India. This is the IPI pipeline, but (because of the sanctions on Iran) is less favored, at least by the US. And, unlike China, which has already created the pipelines into Turkmenistan, India is still not that far along in the discussion.
Argentina does not attract a whole lot of attention on the hydrocarbon front page. Yet, the picture of how it illustrates the Export Land Model can perhaps easily be seen from this plot from the Energy Export Databrowser.
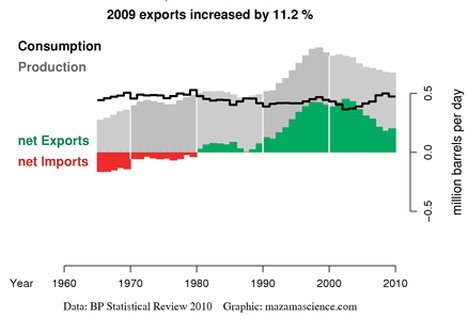
The situation in the Argentine is perhaps illustrated best by the actions of Repsol, Spain’s largest oil company.
“The sale of YPF shares is part of Repsol’s strategic goal to rebalance its portfolio of assets,” the company said.
Repsol is seeking to reduce business in maturing fields in Argentina while investing in exploration in Brazil’s offshore Santos Basin and elsewhere to increase output.
Thus, as production in the country falls, and demand rises, the amount that is available for export will likely continue to decline. The EIA, which listed Argentine production at 782 kbd in 2008, anticipates that it will be slightly down at 760 kbd this year continuing the trend shown above. Nevertheless, as Spain pulls out, China is moving in , buying out the Exxon Mobil interests in the country.
The natural gas picture is just a little further along, with production having peaked and domestic consumption, which had followed right along, now requires that the country begin to import natural gas.
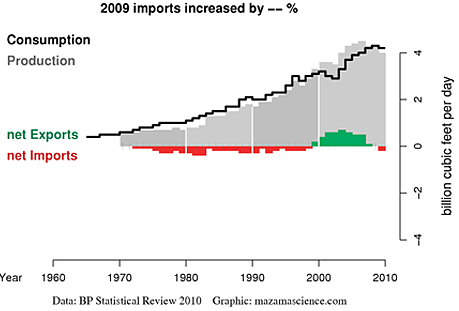
It is expected that the natural gas fields in Argentina will collapse fairly quickly, with reports that the country will sensibly run out of the fuel within seven years. Within that time frame, it is likely that only the current glut in supply will help. But (as with the UK) as more countries find themselves in this predicament, the supply excess will more rapidly attenuate.
Egypt was, of course, one of the two countries that started the current popular protests against state leaders that had led too long. Producing 718 kbd in 2008, it was about that time that domestic consumption overtook production. Production in 2010 averaged 660 kbd, of which 540 kbd was crude oil.
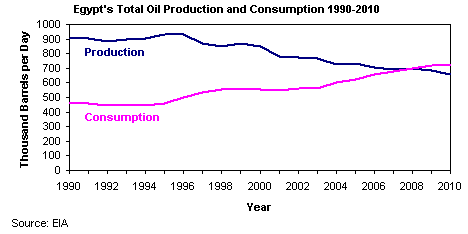
Government plans to control demand as the country moves to import a larger percentage of that demand are likely now out of the window, at least in the short term. Because the country has about a million b/d refining capacity, it will continue to both export and import hydrocarbons, but with the balance swinging toward the import need, it is difficult to predict how this will evolve in the future within the frame of the current unrest.
Consider, in this regard, the natural gas exports to Israel and Jordan. Until five weeks ago a pipeline carried the gas across the Sinai. Following a terrorist attack on the pipeline, flow has been restored to only a quarter of the previous level, and even that is now in question, as a leak just halted the flow again.
Egypt has been supplying 40% of Israel's natural gas since May 2008 – raw material for the production of 20% of the country's electricity – through the state-owned EMG company, businessmen Hussein Salem of Egypt, Yossi Maiman of Israel and Jewish American Sam Zell, and Thai energy company PTT.
The Egyptian opposition openly objects to the gas deal signed between the two countries in 2005. Since the Egyptian supply was halted, Israel Electric Corp. and the private power plants have been purchasing their gas from the Israeli Yam Tatis reservoir.
Gail has recently written on some of the back story to the Egyptian problems. With the rising population and as their increasing expectations from whatever new government finally evolve, it is likely that demand will continue to grow. However, with a relatively large reserve, Egypt can continue to export into the future, though the customers may be more politically screened.
.png)
Finally, for this session, I will refer again to Oman. I wrote about Oman just recently, as the protests in other countries had started to be repeated there. There has not been much of a change in the situation since then. Protests are continuing. Saudi Arabia is now responding more aggressively than they had earlier, with troops having been sent into Bahrain. And this, perhaps, implies that reactions will not be as peaceful as they have been to date. In this scenario it is not possible to predict whether even popular monarchies such as that of Oman will survive. That, in turn, calls into question the overall reliability of oil and natural gas supply from the Middle East and North Africa. Given the nervousness about nuclear power, it will be interesting to see how the governments of the world react. There are no easy answers.
Tech Talk - Oil producers just below 1 mbd: India, Argentina, Egypt, and Oman
PDF version
53 comments
Tech Talk - Oil producers just below 1 mbd: India, Argentina, Egypt, and Oman
PDF version
53 comments
Contact
- Content: editors at theoildrum dot com
- Tech support: support at theoildrum dot com
License

This work is licensed under a Creative Commons Attribution-Share Alike 3.0 United States License.
I think the odds of a gas pipeline that transits Pakistan providing a meaningful part of Indian consumption are very very low. At the end of the day it was that rather than sanctions or US pressure that scuttled the Iranian _Indian gas pipeline.
I don't know anything about undersea pipelines and whether they are even economically feasible- but its either that or LNG with regard to natural gas from Iran/Oman.
I would completely agree with crazyv on this. I am originally from India but have lived in the US for past 25 years - my parents still live in India and I visit them every year. Almost all of my Indian friends would agree that depending on Pakistan and Afghanistan would be complete folly. These two countries are probably the least stable places in the entire world.
crazy - Saw a study years ago. Don't remember the numbers but the cost estimate was huge.
Rockman,
India must go natural gas or non-car electric-powered transportation, the prospects for running cars on oil are bleak. If the ratio of cars to people approaches even 1:4 in Asia, we would have gas lines in the US.
But would that not force prices to rise faster than the people in countries like India could afford? More demand in those countries would force up prices limiting that grpwth.
NAOM
One big problem in India is that fuel prices were heavily subsidized by the government reducing the incentive to economize. Indian cars are mostly small and generally fuel efficient. The problem is simply that there are so many of them nowadays. Roads are always congested. When growing up in Delhi in the 1970s and 80s, the roads were always clear, mostly what you what you saw were bicycles. Nowadays, its often hard to see any asphalt since there are so many cars! Mind you, this despite having one of the best subways systems in the world.
Electric cars would be well suited for Indian conditions except that the power grid is so bad that nobody would be able to charge up their cars.
The 20th century csr has outlived its usefulness. It is in decline. Electric cars and small gas cars do not address the structural problem. I'm not sure the 19th century train is the solution either.
In a drumbeat a few months ago there was an article claiming that we can invent any technology we want to replace the internal combustion engine. It won't help, because we don't have enough roads for all those cars. The car revolution is meeting its end now. Even if we solve peak oil and climate change issues, cars have to be replaced with transit networks.
Great to see this country-by-country analysis continue. For additional detail, I have a few posts related to some of these issues on my Energy Trends blog:
Best Hopes for paying attention to global trends.
Jon
Interesting to note that despite the considerable number of countries with falling crude and condensate production, world crude and condensate production is still rising rapidly (since January 2009) and set a new all-time record in December 2010 according to the EIA:
http://www.eia.gov/cfapps/ipdbproject/iedindex3.cfm?tid=50&pid=57&aid=1&...
The trend is steeply upwards and although there may be a slight dip due to the Libyan situation it seems highly probable that the upward trend will continue for quite a period into the future. Certain people on TOD may have to revise their "brilliant" models going forward.
or not.
There's limits to compounding growth, Nordic; even a dumb ass like me gets the basic math. Why bother drilling in 5000ft of seawater for example? 'Coz the easy stuff's gone perhaps?
Re '"brilliant" models', there's nothing wrong at all with the EROI ones. Common sense really.
Cheers
Joe,
For sure its getting harder to find oil. No doubt about it. We just won't have the collapse in production constantly predicted on TOD.
NM
Let's not paint with too broad a brush here. I prefer not to be lumped in with perma-doomers, and I'd wager neither would most of the regular posters. From what I've read over my 4 years at TOD, most people are expecting a bumpy plateau, followed by a long, slow, bumpy decline in terms of energy production and economic activity, followed (in about 40 years) by population peak and gradual decline. Few are expecting Mad Max in our immediate future.
Harm, I'm pretty much in agreement with you. But I don't agree that you can say that most people agree. I am of course talking of the actual posters on TOD. Once again, have a look at the "median" and "mean" curves at the following link:
http://www.theoildrum.com/node/3720
Lots of people predicting a collapse however you look at it! And ACE of course was the doommeister:
http://www.theoildrum.com/node/5177
a long, slow, bumpy decline in terms of energy production and economic activity
I can understand the theory that a very fast decline in oil production will over-stress our social structures, and we'll get Mad Max. It seems pretty unlikely to me, but conceivable.
I can't imagine why a slow decline in oil production would cause a decline in economic activity: I'd expect oil to simply be replaced by PHEV/EREV/EVs, electric rail, heat pumps, etc.
followed (in about 40 years) by population peak and gradual decline.
Well, that's the mainstream UN projection - it doesn't require economic decline.
Couldn't agree with you more. The transition may not be too bad.
Let me also quote from http://www.theoildrum.com/node/5177
"As everyone knows, there is never a post on The Oil Drum that the entire staff agrees on. Nonetheless, Tony bases his findings on solid research, and a staff survey shows that most agree with a 2008 peak. A post discussing whether an alternate scenario with a second later peak might be feasible is planned for later."
Once again: "Most (staff at TOD) agree with a 2008 Peak".
Well. We are now seeing that "most" of the staff were wrong. And that Euan Mearns was most probably right. (Read the very amusing "battle" between Euan and CCPO for entertainment. (In the post I linked at the beginning). I quote again from Euan Mearns:
"I think it is premature to make a definitive call on peak oil - those who work on this subject have been dogged by crying wolf and being wrong for decades - I would have hoped that lessons may have been learned." Very wise words indeed.
Has "Westexas" agreed yet? In the past he's argued very strongly for a 2005 peak...
I believe West Texas concerns himself mostly with peak net exports and last I saw, his charts indicated 2005 as the export peak to date-but I can't remember if that was just crude or total liquids.
I'll agree that C+C is up and that there have been far too many inappropriate models and "End is nigh!" predictions here and elsewhere.
But we clearly disagree on the appropriate usage of the terms trend and steeply. (Determining a trend by picking your starting month in the depth of the recession is hardly unbiased.) I think "undulating plateau" is a more appropriate description of oil production over the last couple of years -- up before the recession; down for the recession; up for the recovery; down for Macondo-Libya-Recession 2.0(?); perhaps up again after that.
I don't think we'll fall off an oil production cliff. But I also don't think we'll ever see EIA monthly production of C+C reported above 80 million barrels per day. My prediction is for steadily increasing annual prices and a continuing undulating plateau (65-80mbpd) for the next decade.
Jon
Jon,
I'm not in complete disagreement with you. I'm just pointing out that the upward trend in C&C has been fairly clear since the beginning of 2009 and seems to be continuing.
Production will certainly not fall off a cliff as predicted in so many earlier TOD post. WHT's model may prove to be fairly accurate but many of the others certainly will not!
And for those of you who say that nobody has been predicting a collapse in production on TOD please read:
http://www.theoildrum.com/node/5177
and also:
http://www.theoildrum.com/node/3720
which has a really good overview of some of the worst predictions. Note in particular the first graph which has curves labelled "mean prediction" and "median prediction". Now go and check the actual figures from the EIA and the IEA. Interestingly the much maligned predictions of those two organisations are in fact closest to the truth.
ps. I think you probably are wrong about your 80 million bbls/day number. Production will probably go quite a bit higher than that.
Nordic_Miss,
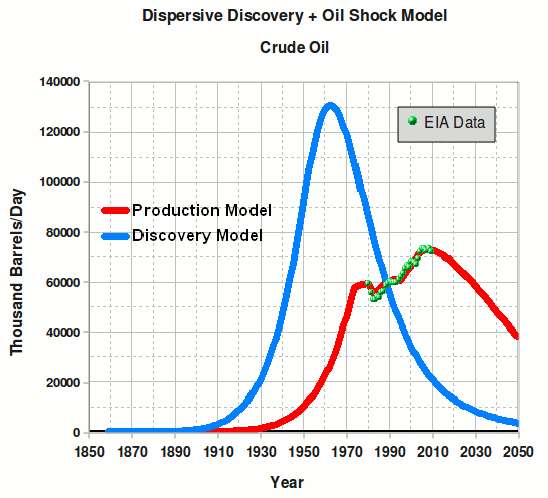
Thanks for your backing of the Dispersive Discovery + Oil Shock model. This generates a rounded peak for crude centered around 2008
The Oil ConunDrum
What will probably get your goat is that this model has a URR of 2800 billion barrels.
WHT,
Your model is excellent for known discoveries. My only question has always been the incorporation of the "unknowns". Also: Have you updated the model with the enormous increases in proven reserves during 2010?
NM
It extrapolates future discoveries from the rate of past discoveries; the future plus reserve growth constitutes the unknowns. That is essentially why I have 2800 billion barrels and not the more generally accepted 2000 barrels for URR. I don't have to update because your "enormous increases" are within the fat-tail fluctuation levels expected.
Yeah, there is an uptick in the data. I focus on Net Exports....
And if you think that the trend is "steeply upwards", I suggest you compute the derivative of the data series and plot that....
Hi Nordic,
Just trying to understand - no agenda. The link you provided showed these reference points:
Jan 06 - 73.6
Jan 07 - 72.8
Jan 08 - 73.9
Jan 09 - 71.5
Jan 10 - 73.1
Dec 10 - 74.8
So, from the previous high in Jan 08 of 73.9 to the last figure given for Dec 10 which shows 74.8, this is a .9 increase or 1.2 percent higher. I'm certainly no expert, but from what I've read, I assume that much of the increase is from condensate - not crude. And condensate (as I understand) has a bit less usable energy and is less flexibility for multiple purposes.
I'm all for embracing optimism, but how does something like an actual energy increase of around one percent play against both global human population growth and increased production of oil consuming machines and practices? I readily admit I may be missing something and am very open to being assured that the more pessimistic models are wrong.
Dave,
I'm probably not such a great optimist as you think. I believe that growing population and living standards will lead to absolutely huge challenges in providing enough energy. The only solution is probably a 1-child policy for the whole of the world. I just don't think oil production will collaps "tomorrow". Also my point was that the trend is sharply upwards from January 2009. Since then the effects of investment decisions made prior to the economic downturn are beginning to materialise in the form of new production capacity. Remember: It takes a long time to get an oil field into production.
NM
Regarding the EIA data, the monthly reported numbers are of course affected by changes in inventories, and they are in any case subject to revision, generally downward. I think that the average annual production and price numbers give us the best indication of fundamental supply & demand factors. The preliminary EIA data are showing 2010 to be basically flat with 2005, but in any case following is my standard C+C versus price data analysis (annual averages in both cases).
Note that despite slowly increasing unconventional production, total C+C production has still not exceeded the 2005 annual rate, and the average annual production for the five year period from 2006 to 2010 inclusive is about 500,000 bpd less than the 2005 annual average, with a 2006 to 2010 average annual oil price of $76 (versus $57 in 2005).
Incidentally, we looked at the decline in Egyptian net oil exports in this article, along with a look at global net oil exports:
http://www.energybulletin.net/stories/2011-02-21/egypt-classic-case-rapi...
Did you see that we went negative again on net imports of refined products:
http://www.eia.doe.gov/dnav/pet/hist/LeafHandler.ashx?n=PET&s=WRPNTUS2&f=W
The 4 week average is looking ugly:
http://www.eia.doe.gov/dnav/pet/hist/LeafHandler.ashx?n=pet&s=wrpntus2&f=4
Hi,
Just as a suggestion, it might be worth dividing oil production by population to get a picture of oil availability.
So..
Year : Pop(mil) : oil per
2002 : 6170 : 0.0109
2005 : 6454 : 0.0115
2008 : 6707 : 0.0110
2011 : 7000 : 0.0105
C+C per person is down almost 10% (give or take error bars) from 2005; you'd need C+C near 80 mb/d just to keep up with population growth.
Have you noticed that net imports of refined products is declining at a faster rate:
http://www.eia.doe.gov/dnav/pet/hist/LeafHandler.ashx?n=pet&s=wrpntus2&f=4
It took about 2 years for net imports to drop 1 million barrels per day from 2008 to 2010. But it has dropped to zero in a little over 1 year.
That's an encouraging sign.
Encouraging sign that we no longer import "refined" petroleuem, and prefer to do the refining ourselves?
This is crude:
http://www.eia.doe.gov/dnav/pet/hist/LeafHandler.ashx?n=PET&s=WTTNTUS2&f=4
An encouraging sign that imports are dropping, reducing the trade deficit.
It's a financial improvement, and a transition away from oil.
I mean, look at that chart: that's almost a 1/3 reduction in overall imports, most of it in only 3 years!
For some odd reason, some people see that as a bad sign - I suppose they worry that means economic activity is falling. But, I see no sign of that - manufacturing and overall GDP in the US is growing, even as oil consumption and imports are falling.
Good news.
We are making up for it with Bakken, NGL, biofuels?
I think that's roughly 70% of the import decline, with the rest from reduced consumption: efficiency, substitution, conservation.
I know a lot of people in New England are dying to get rid of their fuel oil home heating, for instance. Airlines are dropping their low-efficiency small jets like hot potatoes. The large shipping lines are buying container ships that reduce fuel consumption per ton-mile by 50%. I'm sure Walmart is flogging their truckers to install aerodynamic hoods.
I'm not sure - I'd love to see a good, detailed analysis. $100 oil, for the 2nd time in 3 years, provides a lot of motivation, but exactly where the reductions are coming, I don't know yet.
The EIA numbers claim a recent increase in USA produced crude.
2004 2005 2006 2007 2008 2009 2010
5,418.852 5,178.375 5,102.079 5,064.247 4,950.317 5,360.537 5,511.934
That increase almost looks desperate doesn't it?
Yes, I think I had it reversed: 30% or more of the decline in imports is increased production of all liquids, and 70% is reduced consumption - http://www.eia.gov/dnav/pet/hist/LeafHandler.ashx?n=PET&s=MTTUPUS2&f=M
A careful deconstruction of these numbers would be very telling I imagine.
Yes, I'd love to see a detailed analysis. It would make a very good TOD post.
Note the increase in (gross) product exports, from the US:
http://tonto.eia.doe.gov/dnav/pet/hist/LeafHandler.ashx?n=pet&s=wrpexus2...
I think the US is being outbid.
US exports are going up. Isn't that a good thing? A sign of trade balance health?
If Russia's (or Mexico's, etc) exports rose, we'd say that was a good sign for them. Why interpret falling consumption in the US, which frees up products for export, as a bad thing?
In other words, what does "outbid" tell us? It sounds negative, but it doesn't really tell us what's going on.
If someone chooses to buy a Prius to save money on gas, have they been "outbid"?
You have a very important point there. I live in crude exporting state and we are very aware that any we burn we don't get to sell. The more we can sell as finished product (read jet fuel) the more value added we get.
It was too bad our legislature bailed on our big hydro project in the mid 80s. The Interior region of the Railbelt has burnt lots of fuel oil for it's own electrical generation that could otherwise have been exported and the Cook Inlet region has prematurely depleted it's natural gas reserves doing the same.
As WHT says a full deconstruction of the numbers would be very telling.
related aside:
I once watched a 60 Minutes interview with the Shah of Iran several years before the Revolution. One the main points he made--what waste burning oil was, it had so many other high value added uses. Too bad no one was listening. He was the first person and one of few persons in a position of power that I ever heard say 'burning oil is foolish'.
This can't be too hard. Keep track of imports and exports and production and consumption and make sure all the numbers don't contradict. Its basically a bookkeeping exercise with a couple of charts thrown in to guide the eye.
Nordic_mist
...I just don't think oil production will collaps "tomorrow".
And neither do the vast majority here. Please see the "best of" threads on the home page --plenty of data to suggest otherwise.
Then, here's a question: why do people like "Aangel" feel that the shock of dealing with falling oil production will be so great as to cause our economy to totally collapse?
Hi Nordic mist,
The January 2009 point happens to be a low point. If we look at the data from the EIA over a longer period, say from 2008 or even 2005, the picture is a little different from a sharp rise. I agree there is no evidence of a decline, but a sharp rise overstates the current situation considering that the recent drop in c+c output (in 2008-2009) was simply due to a recession (which most here are in agreement with). The problem that many forsee is that we are likely to see an increase in demand when the economy recovers, can we increase output enough to keep up? The data for the graphic comes from the EIA (same page you used with data from Jan 1994 to Dec 2010 for crude + condensate).
Zerohedge is reporting another oil slick around the DWM
Change DWM to DWH
id - Time will tell. Hopefully when the sun comes up we'll know what's going on. FYI: an oil "sheen" has been reported...not an oil slick. A spill of one gallon can create a sheen that covers square miles. Might be from the W&T rig, might be a natural seep, might be from some ship's bilge dump.
As I said...time will tell. The Coast Guard has gotten good at this lately.
These photos were taken yesterday. Photos 63, 64, 65 seem to show a lot of sheen? (page 4 of album)
http://s291.photobucket.com/albums/ll297/creekkeeper_2008/BP%20Slick%20p...
gmf - Thanks but couldn't locate those specific pics. Some the shots might be oil on the surface but a lot of the shots aren't. The ones showing very sharp contrasts are tide lines: the muddy coastal waters meeting the clean Gulf waters. See that all the time. But there's no point in speculating about the pics. By now the Coast Guard should know exactly what's oil and what's not. The choppers have dip lines they can catch samples with. And obviously they had at least one cutter out there by now catching samples if they felt there was the need.
We should be seeing an official statement by lunch Monday.