| Spectral Extravaganza: The Ultimate Light | The Oil Drum | Tech Talk - Current Oil Production and the Future of Ghawar |
Energy Return on (Energy) Invested (EROI), Oil Prices, and Energy Transitions
Posted by David Murphy on June 15, 2012 - 11:51am
This is a guest post by Matthew Kuperus Heun (Calvin College) and Martin de Wit (Stellenbosch University & de Wit Sustainable Options) based on their recent paper in Energy Policy.
The Oil Drum Editors' Preface
The following analysis provides an interesting view on the relationship between EROI (Energy Return on Energy Invested) and market prices, but the strong inverse correlation that the authors emphasize may be an artifact of the underlying Cleveland (2005) EROI statistics that they use. Cleveland’s indirect energy intensity approach, based on calculating EROI from $/BTU and adjusting for energy quality using price indices, will plausibly result in lower EROI during periods of oil price spikes because of higher prices of inputs that do not correspond with higher energy inputs, and will, therefore, overstate changes in EROI that are unrelated to “energy quality.”
Because this post is excerpted, we suggest that readers refer to the full paper in Energy Policy for details of the analysis not mentioned below.
Introduction
The economical and sustainable provision of energy to run modern economies and meet human development goals is one of the Grand Challenges facing the world today. There is increasing evidence that the physical scarcity of fossil fuels is a serious possibility to reckon with. An important question to ask is whether price signals of physical scarcity will be sufficient to cause transitions to alternative fuel sources.
One proposed physical indicator of energy supply scarcity is energy return on (energy) invested (EROI). Little work has been done so far to model, test, and understand the relationship between oil prices and EROI over time. This post (based on our recent paper) investigates whether declining EROI is associated with increasing oil price and speculates on the implications of these results on oil policy. The questions addressed are:
- ‘‘How is EROI related to energy prices?’’
- ‘‘What implications do EROI trends over time have for economic and energy policy?’’
- ‘‘What is required to ensure a smooth transition away from oil toward substitutes?’’
We propose a physically based model of the interaction between physical scarcity and market prices, with a focus on the behaviour of EROI and oil prices over time.
Model Development
We developed a model of the relationship between EROI and energy prices of the form
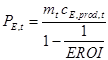
where cE,prod,t is the cost of producing a unit of energy in time t (in $/GJ), mt is the markup (ratio of price to cost), and EROI is the gross energy output to energy input. This equation is a form of the “net energy cliff” for prices, wherein we acknowledge that making a profit requires a higher price when energy production declines for the same input “effort.” Carey King and Charles Hall obtained a similar result recently (King, C.W., Hall, C.A.S., 2011. Relating financial and energy return on investment. Sustainability 3 (10), pp. 1810–1832).
Historical Trends
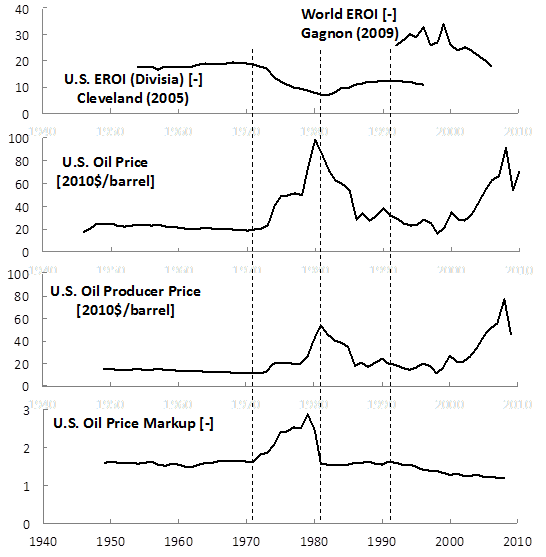
Figure 1 presents data on EROI, oil price, production cost and mark-up in an easily comparable way. Divisia-corrected EROI for the U.S. remained approximately constant from the mid- 1950s to early 1970s, declined rapidly in the 1970s and increased again in the mid-1990s. The available data indicates that EROI for the world (Gagnon et al., 2009) and the U.S. (Cleveland, 2005) are falling at the present time. The present rate of technology improvement appears to be insufficient to put oil production EROI on a positive slope with respect to time. Time series data for oil prices are available from many sources. We used inflation-adjusted data for the average U.S. oil price ($/barrel) for the period 1946–2010 as based on historical free market (stripper) prices of Illinois Crude. Producer prices for U.S. domestic oil are available from the U.S. Energy Information Agency (EIA, 2010) and show a peak in the early 1980s and a continuous rise from the early 2000s onwards.
Dividing the U.S. oil price by the U.S. producer prices provides an estimate of the oil price mark-up ratio. Over much of the period for which data are available, the mark-up ratio has been relatively constant, except for the spike in the 1970s and the recent decline since 1990. It does not appear that oil producers in the U.S. are (currently) in a position to charge a premium for ever-scarcer oil. In fact, just the opposite appears to be happening: the mark-up ratio has been trending downward over the last two decades.
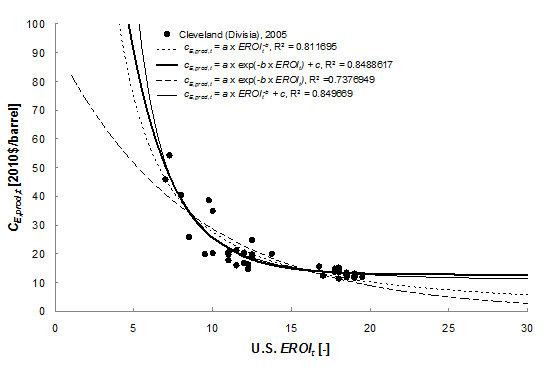
EROI-Price Correlation
To assess the relationship between EROI and production costs (cE,prod,t), we plotted producer prices vs. EROI for the years 1954–1996. We found good inverse correlation. The graph below shows several empirical models that were evaluated statistically.
EROI Extrapolation
Based on the Cleveland EROI data, we can extrapolate EROI forward through time. This is, necessarily, difficult to do, thus our approach is to bound the future EROI prediction with a linear and an exponential decay function as shown in the following graph.
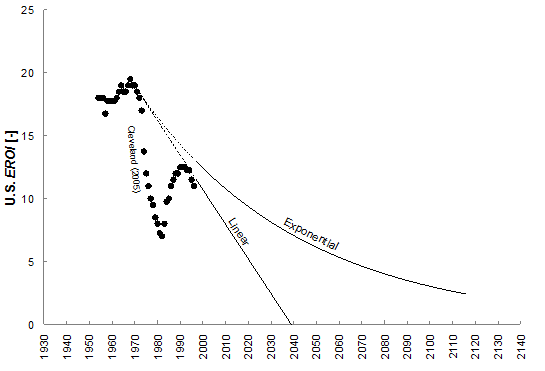
The linear EROI decay line is expected to lead to a faster ramp-up of prices compared to the gradual exponential EROI decay line.
Oil Price Predictions
Using the best model of producer cost vs. EROI and the linear and exponential decay scenarios for the evolution of EROI with time, we can make predictions of oil prices into the future (beyond 1996, the extent of the Cleveland (2005) data).

At this point, all indications are that prices are trending above the curve for linear EROI decline: the 2011 average oil price for Illinois crude is $87.48 (see History of Illinois Basin Crude Oil Prices). For 2012, we are already notably higher in the range $95-110. A possible explanation is that a Fear Premium is being paid for geo-political risk on Iran or elsewhere.
Conclusion
One cannot take a smooth transition from oil to other forms of energy for granted. Our paper highlights four factors indicating that a smooth transition away from oil is unlikely: insufficient oil-sector technological development to overcome depletion, declining mark-up, a non-linear relationship between EROI and production costs, and the non-linear relationship between EROI and oil price. In fact, with EROI values tending downward below 10, the risk of significant increases in oil prices, all other factors constant, is very high.
Significant transitions in energy technologies are not fast. Fouquet, in a study of previous energy transitions, indicates that, historically, the time-scale for diffusion to dominance for a new energy technology is on the order of three decades for the fastest transitions.
Several policy implications, most notably to diversify away from oil toward alternative energy sources and to prepare for depletion-induced oil price shocks, lead to the conclusion that some form of management and support will be required to achieve a smooth transition away from oil. The Dutch example on energy transition management provides some experience, but more research is needed to understand how policy makers can better influence energy transitions.
For additional details, see Energy return on (energy) invested (EROI), oil prices, and energy transitions.
Energy Return on (Energy) Invested (EROI), Oil Prices, and Energy Transitions
PDF version
63 comments
Energy Return on (Energy) Invested (EROI), Oil Prices, and Energy Transitions
PDF version
63 comments
Contact
- Content: editors at theoildrum dot com
- Tech support: support at theoildrum dot com
License

This work is licensed under a Creative Commons Attribution-Share Alike 3.0 United States License.
There is another variable here - debt.
New credit changes the slope of future EROI. It functions as higher (perceived) net energy at present at a cost of steeper EROI decline rate. Despite the fact that EROI is meant to be a biophysical measure, I don't think you can effectively model EROI without taking into account what humans use as a proxy for energy - money/credit.
This was the conclusion to my first post on TOD back in 2006 - A Net Energy Parable
Basically, I think even the interpolated EROI numbers we see today are overstated. (and I wonder what happens to EROI of oil, gas, wind, etc. if there is a disruption to global trade (for whatever reason).
If most EROI values are overstated than doesn't that mean that our society is already more adapted to lower EROI values than we think? I've been struggling for a while to try and determine (just by pondering) how quickly declining EROI proceeds off the "cliff" versus how quickly it declines along the smooth easy slope from 100:1 to 10:1. Each additional unit of EROI decrease is a larger and larger portion of the total, so when using actual energy units wouldn't the EROI decline slow down in speed as it approached 1:1?
Some thoughts FWIW. As oil price rises the amount of fossil fuels available as economical "reserves" increases substantially -- that 300 billion barrels of oil sand didn't used to be economical but now it is. Part of this has to do with new technology but mostly it's due to economics and thermodynamics. If it takes three times as much labour and 5 times the capital (Edit: entirely made up numbers to make a point) to produce a barrel of oil sands oil than to produce some light sweet crude, then it just ain't gonna happen until the price rises due to scarcity of the sweet crude and its inability to meet demand.
The amount of oil sand is fairly large, and oil shale even larger (I am not sure, however, if the low EREOI of oil shale would even support the functioning of an industrial society due to a lack of net surplus energy).
As oil price rises then this non conventional production ramps up. But it is slow oil, because it requires all that extra capital and labour. This works to keep prices up and they must stay up, because if this supply of slow oil magically became fast oil then prices would drop to previous levels and then that oil sand oil wouldn't be economical anymore, and supply would run dry, then price would go up again.
This continually rising price kills demand which tends to slow the rate of production, which is why you get the Hubbert Curve peaking at only halfway. We just learn to get by with less, but more expensive, oil.
As direct EROEI declines this is further amplified by declining indirect EROEI, meaning that to produce a barrel of oil sand oil requires not only natural gas but way more labour and capital than regular oil, and these inputs should be factored into the overall EROEI calculation. With economic growth slowing, stopping, and reversing, unemployment rises which is then soaked up by the decreasing indirect EROEI -- an increasing proportion of the population gets a job in Alberta, or in a far off location providing manufactured equipment to Alberta, rather than previously in some other unrelated field that was previously supported by cheap oil. This jobs boom is promoted by politicians as a way to alleviate unemployment and as a solution to economic woes, and evidence that we aren't running out of fossil fuels -- "just look at all the jobs in Alberta!", when in fact it is confirmation that we are running out of energy.
Eventually EROEI gets so low that you just can't produce enough surplus oil to support all the other supporting structures of a national economy required to extract it, and then things fall apart.
Of course the whole debt issue and oil financialization mentioned by Nate throws all this analysis on a trampoline, and will likely move forward the point at which things fall apart.
We are never going to get to an EROEI of 2:1, we'll all be gone long before then because you can't support a society on that.
perhaps but not our financial system
so yes society can get along on lower EROEI but this adaptation will manifest itself as financial restructuring and perhaps wealth distribution.... OR political dislocation and revolution
I don't think we're making much or any progress on really knowing how to work with decreasing EROEI.. what I think we're doing is playing the same game of juggling tradeoffs, thereby in countless ways 'Robbing Peter to Pay Paul', with the faith-expectation that things like foregone Maintenance, Roadwork, Dental Visits, Auto Replacements, Roofwork.. that there will be a time coming up when these can be picked up again.
It may be more akin to standing on thinner and thinner ice, instead of some more perceptible shift.. dropping EROEI feels like the same old ground under your feet.. (??)
Hoping for a little clarification between EROI (energy returned on investment) vs. EROEI (energy returned on energy invested). Case-in-point: Though the financial return of ethanol production may be positive, the net of energy in to energy out may be negative. I tend to use the former as an overall financial ratio and the latter as a pure energy ratio. Am I missing something?
I agree. I've noted several times that EROEI is the best acronym to use, instead of EROI. I think that because we are basically attempting to communicate with the economic world, in which the $return on $invested is the usual metric for discussion. Thus, the use of EROI instead of EROEI becomes especially confusing for the non-energy community, which means most people. The authors mixture of energy and dollars would only add to the confusion, IMHO.
It should be quite clear that $EROI represents a mixture of current market prices, which by definition obscures the hard measure of energy input from different sources. These days, US natural gas is selling at a particularly low price, so the Canadian Tar Sands produced by burning Natural Gas can be sold at a low price, whereas the value of that same natural gas is much higher in other markets. Electricity from coal sells at a lower price than electricity generated from oil, but a higher price than electricity from Natural gas, which is another temporary situation as the supply of natural gas may be expected to tighten as the rate of drilling new wells has slackened. Electricity generated from nuclear plants put into service nearly 40 years ago is also relatively low cost, as the capital cost was booked long ago.
The fact is that the price of oil is not a good indicator of the future availability of oil (or NG, for that matter). Worse, such calculations based on prices depend on the accuracy of the inflation data, which are used to produce the graph of Figure 17. The bump in the graph around 1980 surely shows the obvious error in this approach. How can one view the comparison of the more recent data of 2007-2010 and the two extrapolations, given the previous lack of correspondence at 1980?
E. Swanson
I of course understand you cannot overcome the physics involved. That when EROI gets too small or down to 1:1 you cannot keep going. It isn't physically viable even if credit or other synthetic economic factors make it economically viable for a short period of time.
I have wondered however why decreasing EROI doesn't also serve to curb the price increase of oil or other energy even if it is in great demand and short supply. If spending money/resources on a barrel of oil now returns less than it did 25 years ago, then its economic value isn't as much either. Maybe that is because there actually aren't any direct substitutes. Still somewhere down the road, when EROI is too low, the value of oil will also have to be impacted in a way that lowers or caps prices. The last barrel of oil no matter the demand isn't worth an infinite amount of money because its value in being used will have become limited severely.
This is an excellent point. Also, consider that we can produce oil/gas/coal deposits if we're stupid enough to do so and have the energy available elsewhere to subsidize it (or if we cannibalize existing infrastructure). IMO, that should be a consideration when pondering which EROEI decline curve we'll follow in the future.
Another point to consider is that we are oil, and therefore we'll spend all our money keeping ourselves going.
Is this distinction really necessary? I rather find it more confusing. We could simply stick to ROI and EROEI. While ROI may be positive, EROEI is probably negative for corn.
I wouldn't know how to correctly 'understand' the idea of EROI, Energy return on Money invested. J/$? Isn't this then just calculating the energy density of the investment?
Or is it just me who doesn't get it? Maybe you could give an example of how you would calculate EROI (Energy returned on investment)? EROEI and ROI are simple.
EROEI: 1 barrel of oil gets 10 out => EROEI = 10
ROI: $40 of costs gets $100 of oil out => ROI = 2,5
EROI: $40 gets 1 barrel (~ 6GJ) out => EROI = 150MJ/$ ?
What does it mean?
EDIT: Aah sorry, my bad. I see you meant we shouldn't use EROI anymore, but EROEI rather. To avoid the type of confusion I just had :) Clearly, I agree; Although until now I used EROI the most, as that's the one used by Hall etc.
EROEI was most definitely positive for the 180 bushel/acre corn I harvested last year. If it was all processed to Ethanol, there would have been enough fuel to drive my car over a million miles. There is definitely more energy in the ethanol that came out than the natural gas that went into ammonia fertilizer as well as the natural gas that went into ethanol plants.
I can also easily run all the farm equipment and deliver semiloads of corn to the ethanol plants using another 80 or so acres of soybeans to make soybean biodiesel. (The soybeans, btw, offset some of the nitrogen requirements of the corn)
This is all with existing technology, and the only roadblock to switching the entire operation to run the farm *from* stuff I grow on the farm is the capital investment in on-farm biodiesel, ethanol, and ammonia fertilizer production. If you have $$ to invest, and you believe the EROEI of oil/natural gas will run out in the next 10 years, then I suggest you contact me and we can get started sooner rather than later. The current low interest rates also make it extremely attractive to build such capital equipment.
But you have to be willing to bet that oil prices will go to $200/barrel, and stay there, in the next 10 years. How many of you here are willing to buy a substantial amount of capital (say half a million) at risk on this bet?
BenjegerdesFarms,
your comment made me want to look up on the evidence for a negative EROEI for corn ethanol. Yet again, TOD has a great contribution on this: http://netenergy.theoildrum.com/node/6760.
You say there was definitely more energy in ethanol from corn than the amount in gas that went into fertilizing & ethanol plant. How do you know that? I'm just curious.
Of course, geographical and other variations may change the picture for you.
The key to that is the phrase:
..6.5 liter (or its energy equivalent) to be reinvested to produce more ethanol..
Most of the off farm consumption is low grade heat for the distillation process - you would not burn ethanol to do this you would burn either the spent grains or the unprocessed corn (or even the straw). The major problem with energy return calculatons is boundry setting, the corn to ethanol part of the process is an energy conversion and can have an efficiency below 50% and still be useful, the corn growing part is an energy extraction process and must have a return >>1 to be useful.
Consider coal or gas to liquids plants or electricity generation, the energy conversion means if you calculated the energy return on the final used product it would be below one but useful energy is still produced.
Thanks bingleybong, your point on the low grade energy for distillation makes things clearer to me.
But I don't really follow the rest of your post. Boundary setting, distinction between energy extraction and conversion, all right. But isn't corn growing also energy conversion, i.e. sunlight to corn? And for this energy extraction (production), shouldn't we take the whole process into account from sunlight to final product, ethanol? If this EROEI isn't >>1, then it still wouldn't make sense to produce ethanol from corn. I don't think we have much use for simply corn as an energy source.
But maybe what you're saying is that we could raise the efficiency of the corn to ethanol process in the EROEI calculations, by (totally or partially) discounting the low grade (heat) energy that can be gotten from sources that are less 'valuable' (straw, ..). OR we could still use the low EROEI as a way to invest a less wanted (abundant) energy source, and to get a more valuable energy source out (liquid fuel in this case). The energy loss wouldn't then count so much as it would be on the part of the more abundant source, while liquid fuels would come out.
An interesting thought: Robert rapier argues we could use coal for the ethanol production part, thus effectively having a 'coal to liquids' plant with efficiency possibly higher than Fischer-Tropsch. http://www.consumerenergyreport.com/2011/10/31/how-not-to-use-eroei/.
Finally, is it true gas to liquids or coal to liquids or electricity generation have an EROEI < 1? As I understand it EROEI isn't conversion efficiency. You don't count the gas or coal coming in as energy input, only those energy inputs that are necessary to change the coal or gas into liquids. It can hardly be < 1 seen like this, or G/CTL wouldn't make any sense.
Anyhow, I'm just trying to understand this EROEI thing, I could be wrong.
Xardas,
"shouldn't we take the whole process into account from sunlight to final product, ethanol?"
If I'm reading that question right, then generally no, you don't include the energy from the sun directly as part of EROEI, since 'we' are not investing that energy.. we're just catching it, and we'd want to know how much energy it took US to be able to do so.
I would think Solar Refining of Ethanol might make EROIE sense, or at least balance out much better than using Gas for the Distillation heat.. might still only be really advantageous for small out-of-the-way users.. ?
Jokuhl, I'm sorry I should've worded it better. I understand the captured sunlight shouldn't be included in the EROEI calculation. I rather meant, the energy that needs to be invested in order to transform this sunlight into ethanol - through corn.
Actually, I think you critize me on the same issue I don't agree with bingleybong on his take that GTL/CTL has negative EROEI. One shouldn't include the energy you want to convert as an energy input..
Probably solar for refining utilization would indeed make sense, if possible. Apparently low EROEI isn't inevitably a bad thing, if the energy inputs are of a lesser desirability than what you get out.
I find it a rather interesting new viewpoint on these EROEI analyses.
I think this may summarize the issue with corn ethanol... the most conservative EROEI numbers from a previous TOD article (referenced above) for corn ethanol are in the 1.05 to 1.1 range. There are several substantial difference between the the study that gave that range and the reality now. We currently get over 3 gallons of ethanol per bushel in the best ethanol plants, and some of the earlier studies used 2.5 gallons per bushel. This slightly decreases the energy per gallon in the biorefinery, and significantly decreases the energy per gallon invested in ammonia fertilizer and diesel used on-farm.
Right now, when I grow corn, I am effectively doing a natural gas to liquids process. We can't burn natural gas in automobiles (well, there are a few LNG trucks). The important point is there is *a little bit* of net energy gain from solar capture by corn, and a whole lot of protein and high-value livestock feed that comes off.
If I make my own nitrogen fertilizer (using multi-megawatt wind turbines with EROEI in the 50 range), and then distill the ethanol using energy from corn stover and corncobs, and then apply the ash back to the same field as potassium and phosphorus fertilizer, and run the farm equipment on soybean oil, the only external 'energy' investment is the iron, steel, aluminum, and copper in the equipment.
What I'd be producing in this case is electricity (when the wind blows), food (livestock feed), and a high-value directly usable transportation fuel (ethanol) which needs no additional refining step.
I am missing the financing piece to do this all on-farm. I estimate it would be in the 15 million dollar range, with about half going towards wind turbines, electrolysis, and a small-scale haber-bosch unit to make ammonia. The other half would go into a small-scale ethanol plant that uses low-grade heat from the ammonia production to distill the ethanol, with some back-up of burning corncobs or corn stover.
Well, of course, B-Farms.
You have figured out that claims of low EROEI or even that EROEI < 1 not being practical nor profitable are largely half-baked nonsense.
Good for you.
And you have also correctly observed that the real limiting factor is $ -- or more specifically ROI. Return on Investment is simply a money on money thing. That system has been used for centuries because it works.
The half-baked claims about EROEI have not been around that long, and are sort of playing out as nonsense.
Here is why. Not all Energy is Equal. Some -- such as liquid fuels are a premium -- no matter how lossy the path from Well to Wheels, or in your case, from Corn Field to Wheels may be.
Meanwhile, Surplus Energy sources -- such as Electricity (from most any source) in the US, or NG in the US can practically be wasted in producing the Premium Liquid Fuels -- such as Ethanol, Diesel and Gasoline, with little regard for the amount of Energy put in -- as long as it is profitable.
Seems like fun to invent a new form of semi-subsistence farming, based on shipping out some of the surplus carbon, a bit like farmers in Roman times shipped olive oil, but nowadays using highly geared machinery instead of leveraged human, donkey, or horse, farm-fuelled muscle power.
But, given realistic machinery, plant and turbine replacement times and initial investment of 15M dollars, can your total farm pay for that over 2 or 3 decades and make other necessary financial returns at the same time? (And that kit presumably comes out of the fossil-fuelled economy, probably with a rising price tag and a risk premium. We presume also that the guys making the kit continue to consume in toto a lot of fossil fuel?)
PS Depending on size of farm and cash flow issues how would wind-powered nitrogen fertilizer production compare with a good clover grass sward? (Upto 200kg/ha N fixation; sorry haven't done pounds and acres just now.)
FYI, 200kg/ha nitrogen is 178 lbs/acre, which is about what my corn crop needs. Soybeans put in about 40-50 lbs/acre. Alfalfa/clover/etc is a great low-capital way to build nitrogen, but it ties up an acre that could be getting between $500 and $1500 revenue per acre depending on the price of soybeans. It easily could be done (there are lots of sustainable integrated crop/livestock operations that use alfalfa/clover for all their nitrogen needs), but on black flat land, the return per acre is a lot higher investing in the capital for a 16 row planter and 12 row combines to grow corn/soybeans.
Risk premium seems to be what's killing long-term investments like what I'm proposing. Wind to ammonia looked damn good in 2008 with $12/mmbtu natural gas (and when farmers were paying $1200 per ton for ammonia). But the market volatility since then has made it impossible to really do anything on the 15-20 year scale, because whether I can pay that 15M back depends on what the price assumptions are. It's hard to sink 15 million into a project you expect will barely break even for 5 years, then net you 25 million in year 6 because commodity prices just doubled.
Maybe what I'm really proposing here is the CSCI (Cornman Sachs Commodity Index) as a way to do long-term investment in increasing commodity prices, that instead of being backed by paper contracts (like the GSCI), is backed by farmland and the energy production equipment installed on that farmland. Maybe I should be investing in a nice suit and buying some bankers expensive meals instead of putting solar panels on my roof. ;) (I installers for a 4.5kw array on my roof as I write this)
Thanks.
Keep crunching the numbers!
I am not sure, though, I would want to ... er ... bet the farm with Cornman Sachs if they are anything like the other lot.
And sourcing capital in a credit crunch seems an intractable bind for the next while?
Incidentally, what makes the price of Soya go up and down on the international market?
Chinese etc consumption patterns? Competition with Brazil?
best
Phil
Risk premium seems to be what's killing long-term investments
Yeah, the only thing making NG truck conversions possible is the extremely short payback times.
Casual observers of the energy scene tend to forget how volatile gas prices have been, but business investors don't forget....
Sorry late reply
Nothing has negative EROEI - the worst case is burning fuel for no fuel gained which is an EROEI of 0. I think you are saying exactly the same thing as I am - once you have gathered the energy converting it has an efficiency (and you can burn some of the gathered energy or supply it from something else to power the conversion) but including this in the EOROEI calculation is wrong and basically means you can get any EROEI answer you want. If growing the corn does not provide more energy than it takes to do so (and given the need for liquid fuel / gas to make fertiliser assuming you burn the ethanol to power it is not unreasonable) than it is not an energy source but the relevent number is the energy in the harvested (edible?) corn not in the resulting ethanol.
A lot of EROEI calculations seem to simply add up all the energy consumed (including in the conversion steps), then divide the energy contained in the final product by this to get the EROEI. This is wrong both because it effectivly assumes all BTUs are equal which they are not and effectivly assumes you use the final product to power the process which you would not except where you must.
So far as CTL/GTL were concerned I understood that the conversion efficiency was not much better than 50% but the EROEI of coal especially is still very high so you still get a lot of useful energy (the capital cost is very high though so using ethanol as a conversion agent is likely much cheaper).
To correctly work out the net energy gain of an ethanol process burning natural gas you need to know the EROEI of the gas as well as the corn.
As a purely hypothetical example consider a process that used 10% of the potential ethanol to grow the crop and needed to burn 50% of the corn to make the ethanol. The net yield would be 40% of the potential ethanol avilable to sell (50% of the corn is burnt, 50% turns to ethanol, 10% is used to power the farm), not a great yield but useful and if you did an EROEI calculation (useful fuel out over product + external fuel burnt) the result would be 40%/(10% + 0%) = 4 EROEI.
On the other hand with exactly the same process but supplying the process heat externally you would get a lot more ethanol (90% of the potential) but you would use external fuel equivalent to at least 100% of the potential ethanol (actually much more since the corn contains more energy than the ethonol since not all of it is converted). Thus the EROEI would be calculated as 90%/(10% + 100%) = 0.8 In fact you need to know the EROEI of the external fuel to make the calculation and the two process are not directly comparable.
Of course if you tried to power the first process by burning the ethanol it would not work at all since you need a lot more than the total energy content of the potential product to make the product. No one in their right mind would actually do this but of lot of EROEI calculations seem to assume they would by basing the calculation on the second scenario.
Thank you.
I promised myself I wouldn't carp on this subject unless someone else started it first. But as I've said many times in this forum, trying to introduce a new concept and giving it an inherently-confusing acronym (which already means something else in a very close context) is silly. Even among the bright folks at TOD I've seen the terms quickly confused in comments.
Since EROI was used by prior scholars to refer to ER/EI, we seem to be locked into it by convention and academic timidity. Again, I'd encourage experts to adopt a clearer term to help promote acceptance of an important concept.
May I humbly suggest that everyone who feels compelled to enter this debate over naming conventions might do well to get the whole picture directly from the horse's mouth - so to speak.
Please obtain and read "Energy and the Wealth of Nations: Understanding the Biophysical Economy" by Charlie Hall and Kent Klitgaard. Charlie, who was David's PhD adviser, was the principle originator of the concept, having transferred the energy balance concepts from systems ecology and the early work of Howard Odum on energy and the economy. I think debating whether EROI or EROEI is a better acronym (or ERoEI, etc.) can cause many to miss (or avoid a deeper discussion about) the central point. On TOD we tend to focus on raw energy flows because that is the easiest to get data for and peaking phenomena are certainly contributing to the financial crises we are experiencing. But more fundamental than flow rates of raw energy (fuels) is the net energy gain to society of each increment of that raw energy, hence EROI matters greatly. Ultimately the price of oil is only a poor reflection of the underlying dynamics of the system. All that really counts is the net energy that is available to do useful work.
Read Charlie's book and recommend it to other to read. Then lets have a conversation about the implications to the economy of the coupled phenomena of peak production of raw energy (e.g. oil) and declining EROI. Get the biophysics down pat and then interpretation of the financial will be much clearer.
Thanks George.... but if I may say so, the 'debate' isn't an end in itself, it's to help an important concept to progress from obscurity into general understanding. Calling it EROI is about like introducing a new brand of toothpaste and calling it "hair gel". There would be several predictable results: hair with toothpaste in it, poor product sales, and an ongoing debate over why the toothpaste was called "hair gel".
A cautionary example: http://www.youtube.com/watch?v=wfmvkO5x6Ng&feature=fvwrel
Kudos to Hall et al for great work. Be nice if more people understood it. Just sayin'.
"All that really counts is the net energy that is available to do useful work."
Agreed. From a mainstream POV, neither EROI or EROEI are suitable, IMO... "Nett Energy" is far more appropriate (and more likely to be understood by my fellow Joes and Janes, who can generally relate the term to their take-home pay). Nett energy is what the future's all about.
Of course, people seem happy enough to pay all the tax they can. ;)
Cheers, Matt
I could see a disruption of global trade lowering the EROEI of certain oil fields by forcing regions to use lower quality resources to produce the inputs necessary to extract oil such as metallurgical grade coal, iron ore, lime, etc. Hypothetically, if the entire EU were cut off from the rest of the world, the EROEI of North Sea oil fields would decline as comparatively (to say North America) low quality coal and iron ore would have to be mined in order to produce the steel pipe etc necessary for production. As a result of mining lower quality ores, more energy would be needed to extract them.
As a corollary, I could see a modest increase in the realized EROEI of certain oil fields due to a global trade disruption. Consider that iron ore, being a commodity, is sold at an "average" price. If the U.S. were cut off from the rest of the world, domestic prices for iron ore would fall (theoretically) which should cause only higher grade ores to be extracted and brought to the market... thus increasing the EROEI of the oil fields that use the resulting steel pipe (increased relative to having to use iron mined to meet global demand rather than domestic).
the interpolated EROI numbers we see today are overstated
Wind's E-ROI is probably around 50.
Cutler Cleveland's summary of the literature:
http://www.eoearth.org/article/Energy_return_on_investment_(EROI)_for_wind_energy
which showed that wind's E-ROI was around 19. If you study his sources, you'll see that that most of the studies are quite old. If you look at the turbines used in those studies, you'll see that the turbines studied were much smaller than those in use today - look at Figure 2, and read the discussion. If you study that chart, you'll see a very clear correlation between turbine size and E-ROI. It's perfectly clear that Vesta's claim for a current E-ROI of around 50 is perfectly credible.
Again, an E-ROI of 19 is more than enough. There isn't an important difference between an E-ROI of 20 and an E-ROI of 50. It's like miles per gallon: we're confused by the fact that we're dividing output into input, when we should be doing the reverse, and thinking in terms of net energy. An E-ROI of 20 means a net energy of 95%, while an E-ROI of 50 means a net energy of 98%: there really isn't a significant difference.
Great comment, thank you! That's some great news.
A review for most relevant energy sources, Hall 2011:
www.mdpi.com/2071-1050/3/10/1796/pdf
apparently the Cleveland study you linked is the most recent to date (for wind), and it's only a meta-analysis of other and, as you say, older studies.
OTOH there is the major drawback of a significant energy pay back time, the 'Energy Trap' as Tom Murphy calls it :
http://physics.ucsd.edu/do-the-math/2011/10/the-energy-trap/
But anyhow, economics aside, I'm happy to know renewables actually have a very decent EROEI.
Yes, the payback time is a significant thing. Still, Tom's analysis is highly unrealistic.
1st, we currently have an enormous surplus of energy consumption versus some kind of operating minimum: the US could reduce oil consumption by 25% with aggressive carpooling overnight (think single passenger SUVs). The US reduced oil consumption by 19% from 1978 to 1982, while GDP managed to grow slightly. The US reduced consumption by more than 10% since it's recent peak, while again growing GDP slightly.
2nd, for better or worse the world has an enormous quantity of coal, bitumen and kerogen in the ground - more than enough to cook the planet and render the oceans uninhabitable, which is a far greater threat than Peak Oil, or Peak Fossil Fuels.
While not disagreeing at all with your basic point, I'd observe that in a society where decision makers focus on small differences between quarterly financial returns as the criteria for going forward, the 3% difference may well be significant when it comes to choosing between energy source. If it's not significant for the net energy of society, it might well be for the climate.
Here's to not deciding everything based on quarterly reports.
Absolutely.
A related point: people often think that because something isn't done now, it isn't feasible. Often the difference in cost between the status quo and alternatives is very small.
Of course, we should always remember: if you include external costs like security and pollution, new tech like EVs, wind and solar are much cheaper than the status quo.
I looked at the article in detail and the underlying detail as well, which was the main reason for the editorial at the top . Here are some thoughts about it.
I think the very good inverse correlation is an artefact caused by the use of the Cleveland EROI statistics and the influence of prices thereon, as explained below.
There are two main reasons for Cleveland's (2005) large decline in EROI the 1970s and slow rebounce early 1980s, that are both related to energy prices.
A) The indirect energy costs
If we look at direct energy costs into energy production, calculated by Cleveland primarily on the basis of actual energy inputs (BTU’s) and not indirect approaches, we see a curve that has not too many sharp changes (it roughly follows US production trends). Once indirect energy costs are incorporated the picture becomes much different. There is a very large curve upwards since the early 1970s that goes sharply down near the end of the 70’s, to return at the mid 80’s to the values before the oil crises. The indirect energy by Cleveland is fully based on energy intensity as a dollar’s worth of output in the industrial sector conversion, via BTU per dollar of output).
The BTU/$ measurement is highly influenced by other factors that are not energy related, it is to me not plausible that as Cleveland states “energy intensity is a reasonable proxy over time for the energy embodied in the inputs purchased by the oil and gas sector”. The reason is that dollar denoted values for process components do not give the exact cost of production that is proportional to energy expended. In case of the oil crises commodity prices changed rapidly, and there has been a large influence of relative market scarcity from demand and supply, as well as financial system costs such as credit and loan availability. It is highly likely that this has led to overestimates of energy inputs during periods of economic crisis, which would explain a large part of stark changes in Cleveland’s EROI.
B) The Divisia index
The marginal product (additional increase in production due to an increase in inputs) is assumed in Cleveland's paper to be related to price differences. In other words if energy prices are higher (because theoretically they have a better energy quality --> specific energy and energy density and such) they result in higher output as well (higher marginal product).
Cleveland uses an index that multiplies both energy inputs and energy outputs over time with the respective calculated price based "energy quality" index (Divisia index). In this index the quantities per fuel are multiplied by their cost (or expenditure) shares relative to other fuels, averaged over two periods. In other words if we have two fuels and both are used equally (in terms of BTU’s) where one has a higher cost share than the other as its price is higher, this fuel will have a higher index figure than the other.
This again is influenced by effects not related to energy. One key factor was the replacement of crude oil output by the sector by natural gas (whereas oil is a higher quality fuel reflected by a higher price per BTU), resulting because it is on the output side it results in a lower EROI (less “quality adjuted” outputs). However, the price differential between oil and natural gas has many other influences, including high market differences where a major amount of oil is imported and the marginal costs are higher than for natural gas. If we look at today’s market the price difference in the US between crude oil and natural gas is in no way representative of their “energy quality” differences.
--------
To summarize, due to Cleveland’s indirect energy intensity approach the EROI will always be lower in cases of oil crisis that result in high economic effects (much higher prices of inputs), and also overestimates changes not because of “energy quality” but due to market based differences. Because of this there is a high relation of the EROI curve with price changes, whereas higher prices of fuels result in a much lower EROI due to the methodology (not because of higher energy inputs or lower energy outputs). The correlation between the presented EROI curve and oil prices therefore appears to me to be an artefact, not a genuine relationship.
Rembrandt
Your comments raise the issue of cartel caused scarcity vs physical changes in EROEI. The challenge is how to distinguish between them. The OPEC oil crisis clearly caused the 1973 spike. The change in elasticity trend in 2004 suggests similar scarcity issues are involved over the last decade. However, this time there is also an underlying transition from "cheap oil" to more more difficult to obtain and thus more expensive production costs, from both energy and cost increases. e.g. deep offshore drilling and oil sands. e.g. see: Marginal-oil production costs are heading towards $100/bbl
In
Regime Change In The Oil Market: Is There Evidence of Critical Slowing Down in Oil Price Series?
David Comerford (December 13, 2011) argues that the cause is not an economic “Critical Slowing Down”. Thus could it be geological constraints etc.
PS For more on EROI see Hall & Klitgaard “Energy and the Wealth of Nations” 2012 Springer ISBN 978-1-4419-9397-7, and
Introduction to Special Issue on New Studies in EROI (Energy Return on Investment) Charles Hall Ed., Sustainability 2011, 3(10), 1773-1777; doi:10.3390/su3101773
A couple of points that may be helpful in clarifying the broader context within which this increasing EROEI curve.
1. Oil is very useful but many of the functions it performs can be substituted (ex: electric cars solar water heating, nuclear, coal to liquid). As the price of oil rises and an increasing amount of its functions are switched to other energy sources- this will create a downward force on oil prices.
2. As oil becomes a smaller and smaller part of the economy due to #1 above- future oil price increases will have a smaller and smaller effect on the economy as a whole. We do not worry about the price of whale oil today- for example.
3. The EROEI of oil does not exist by itself but in relation to the EROEI of other energy sources- there may be a tipping point where the mass of society exits oil and this could actually cause a short term price free fall for a while. Much of the broadbase use of oil depends on the mass consumer oil infrastructure (refineries, pipelines, gas stations) and this system depends on economies of scale to make it cheap enough for consumers. As customers pull out of oil, the benefits of economies of scale are lost and this adds an additional "tax" of sorts- on oil. This can lead to a very sudden price rise that flushes out the remaining consumers rather rapidly. Then comes the sudden price collapse as oil supply is greater than the demand of the few consumers left. But since consumers will have gone to another energy source they won't return and the infrastructure will not have enough capital to rebuild- thus a permanent collapse.
Just one scenario- but one I find very likely- the point is this: economics exists in the real world.
Regarding point #3, I could see financial considerations driving us away from the utility grid in the future via a similarly vicious cycle.
Technology enables a demand shock (LEDs and Fluorescents more than pay for themselves)->
Utilities raise prices to compensate for revenue loss and to service sunk investment costs->
LED technology becomes more prevalent
Utilities further raise prices to compensate for revenue loss->
Other energy conservation become more prevalent->
Utilities further raise prices->
Local energy production (PV, community based biogas) becomes profitable->
Utilities further raise prices->
Local energy production becomes even more appealing->
Etc.
The above cycle assumes, of course, stagnant to declining prices for technology/capital. Given advances in manufacturing techniques for PV and solid state electronics such as LED, I think that's a fair assumption.
Oil is very useful but many of the functions it performs can be substituted
All of its functions can be substituted: long-distance travel (aviation, container shipping) is the hardest, but even that can go to bio-fuels (at a moderate scale), CNG, LNG, liquid H2, synthetic fuels (from renewable electricity and atmospheric CO2), etc.
Not that this is useful or clarifying to anyone else, but I understand what you're saying and it makes sense. IMO, Cleveland is/was just doing his best given available data. Being aware of the limitations of said data are the way forward.
FWIW, the phenomenon you describe could be ascribed to the compounding nature of the value chain. This is a bit circular in the energy industry so I'll just pick an arbitrary starting point. Let's say that oil prices rise 10% and that producers like 10% profit margins. Also, let's assume that oil is the only input in producing iron for simplicity. Arbitrary commodity prices below for simplicity.
Oil prices rise from $100 to $110. The iron ore producer previously produced at a cost of $100/ton and sold for $110/ton. Now, he has to sell for $121/ton. The pipe producer previously produced for $110/ton and sold for $121/ton. Now, he has to sell for $132/ton.
I'll revisit and edit this tomorrow to provide a better example but I think you get my point. The profit margins compound and this is what gives the appearance in the dip in EROEI data when there is a price rise when using BTU per dollar as the proxy for EROEI.
For All
A couple of observations. As greenish points out there's often confusion between EROEI and EROI. I would offer it's even worse given that neither metric has a practical application. As been pointed out before the oil patch uses neither metric in making investment decisions. Even EROI falls short: the oil patch doesn't utilize the energy input used to calculate a monetary return: it's $'s in and $'s out. Always has been and always will be. A simple example: a Deep Water drill rig that took X amount of energy to build and Y amount of fuel used to drill a well. On Date 1 the rig rate may be $350,000/day and fuel is $3.50/gallon. On Date 2 the rate is $750,000 day and fuel is $6/gallon. Prospect A reserves are the same on both dates as is the EROEI. Obviously the decision to drill will not be determined by EROEI or EROI but the perceived ROR.
Another complication: don't assume the well above won't be drilled during the higher cost period. The reserve target is monetized based on future price expectations. The low cost well may not be drilled because the potential revenue is too low as a result of low product prices which, not coincidentally, also caused the lower drilling cost due to a drop in infrastructure demand. I've seen as many projects rejected during low cost periods as during high cost periods...maybe even more.
Someone mentioned above what "curve we'll follow in the future". It wasn't clear if that meant what curve we would decide to follow or what the curve will look like independent of our goals. Decisions based upon economic analysis aren't completely unrelated to either EROI or EROEI. The costs of the energy inputs ultimately will affect those metrics. But IMO there are other factors that will express greater control over the process. Factors based upon economic gain regardless of net gain in energy.
Three examples. First, looking at the calculations for energy returns during the late 70's it isn't clear how the energy inputs were estimated. More importantly, were they estimated for just those wells that produced energy or did the analysis include energy consumption used drilling unsuccessful wells. That's not a small factor: during the height of the 70's drilling boom there were over 4,600 rigs drilling running...more than twice as many as during today's "boom". And many of those rigs drilled dry holes and noncommercial wells one after another. A huge amount of capital and energy were expended that didn't generate one Btu of energy. Was that energy outlay utilized to estimate energy return on the successful projects? Second, consider the recent boom in NG shale drilling as well as the more recent oily shale drilling. I would offer that some companies can justify their efforts in these plays even if the ROR is rather low (which would also imply a lower EROEI) because they see an adequate return on investment via stock value gain as opposed to strictly ROR. Third, as other have pointed out, the Canadian oil sands are utilizing relatively cheap NG to recover relatively expensive oil. Thus the ROR is significantly better than the EROEI of those projects. OTOH one might calculate the EROEI of one of my S. La. deep NG prospects offers a better EROEI than an oil sand investment of the same amount. But I won't drill my well for the very same reason: low NG prices that yield an unacceptable ROR.
Intuitively we know EROEI will, in general, decrease over time. Many wells drilled in major fields 50 years ago recovered many times the amount of energy as the average well drilled today. OTOH a new DW Brazil well may recover as much oil as one of the original Ghawar wells...maybe more. It might consume a greater amount of energy to drill that new well but it's possible that its EROEI would still be better. But many current and future wells won't likely fall into that category. For each DW Bz well drilled hundreds of fractured shale wells will be drilled. Wells for which EROEI will be very small compared to those DW producers. In fact, some of those future shale wells will be closer to zero EROEI. I just analyzed an area in E Texas where operators are trying to extend the Eagle Ford Shale play. Even with the learning curve that's been established many of the new wells drilled in this area are commercial failures with very low EROEI's if not negative. But those results haven't stopped companies from poking holes in the ground there. One of the companies pushing this new trend is the reformed group of Petrohawk. IMHO Petrohawk was one of the most financially successful S. Texas Eagle Ford operators. But not from drilling but by selling their acreage for $12 billion to a public company desperate for opportunities to grow their reserve base to satisfy Wall Street's demands. It will be interesting to see if the group can repeat their business model in the new trend. IMHO with such dynamics in play it would make EROEI estimates more of academic than practical interest.
Beyond the oil patch (or the PV production process, or what have you), society ultimately must pay the full costs of producing and utilizing a unit of energy, all of them, regardless of how far removed these costs may seem from the core process. Even the energy and other resources involved in selling acreages or leases, as in your example, must be accounted for in the bottom line when determining the ultimate utility/benefit of an energy source. Of course, during times of abundant, easily extracted energy, these costs are easily ignored. As these total costs begin to approach the net benefit, we ignore them at our own civilizational peril; robbing Peter to pay Paul may work financially for some, but not for the collective, not for long. Indeed, the complex dance that producers perform keeping Wall Street, et al, investing, is very effective at masking the point where net costs exceed net benefit, costs which are being socialized and passed to the future. IMO, we're realizing this now, and have been for some time. Peak oil is only one subset of this process.
Collectively, BROTI (benefit returned on total investment) is the only metric that will matter in the long run, impossible to calculate of course...
Ghung - "..society ultimately must pay the full costs of producing and utilizing a unit of energy." I suppose that depends on how you define "pay". When oil prices crashed in the mid 80's society paid a small price of energy compared to the $trillions spent, and never recovered, by the oil patch during the prior boom. So if you include us as part of society then I would agree. Again, as you say, there's a distinction between individual gains and those of the collective. But the collective doesn't get to vote on what the oil patch does. So Peter may not like getting robbed but who does? LOL.
Please see my above comment to Ghung re: clarification of EROI terminology. The issue isn't about how the oil patch makes financial decisions per se. What you write about is good background information to have about the oil patch, but it isn't central to the biophysical concepts that have to be addressed regarding net energy to society. I would suggest that eventually the impacts of declining EROI will hit the decision processes of the oil patch through the effects it has on costs of doing business vs. return on dollars invested simply because the former ultimately represents an integration of all supporting energy expenditures.
There is practical and there is practical. What economists and financial folk see as practical is just a surface view of the underlying dynamics of the economy. Sooner or latter (and I suggest it is sooner or even now) the reality of the relationship between money and net energy will assert itself and those decisions will start to wobble.
George - "I would suggest that eventually the impacts of declining EROI will hit the decision processes of the oil patch..." I'll go you one better and say it impacts the oil patch today and, to a degree, always has. But that's the key phrase: "to a degree". Oil patch economics are always a function of the cost to conduct business and the revenue stream. And there is a relationship between those factors and the net energy gain of any activity. But as we've discussed it's not a simple one to one relationship. Using relatively cheap NG to produce relatively expensive tar sand oil is still one of the best examples. In theory using 1 Btu of NG to produce 0.8 Btu of oil is very possible if the folks are paying 10X as much for that oil Btu as the NG Btu.
Then there's the imbalance caused by public companies pursuing low EROI projects for the benefit of stock value. If you haven't heard my tale of one extreme example: a client once had me drill 4 horizontal wells which they knew would have not only a negative EROI but also cause a decrease in NPV of the company. The new hz wells produced the same Btu's as the existing vertical wells but at a much faster rate. They increased the company's production rate from 10 mmcfpd to 50 mmcfpd. And Wall Street rewarded this undeniable money losing move by increasing share price almost 400%. And no one lied: the facts were clearly stated in the company's annual report. I consider what's happening in the current fractured shale plays to fall into this same category but just not at the same extreme level.
Rock - Isn't NPV about the discounted value of future profit in today's money? If you can get your money back faster you can get it invested into hopefully new profit making ventures faster as well. As you said cashflow is king and you need it not only to finance current operations but to also to help get finance for future operations from loans. It's the future uncertainty which kills the value of long term financial investments because of things like the gas glut in the U.S.A. can kill off profitability entirely for what initially seemed like foolproof ventures.
Governments are pretty useless at every short term venture they ever did but they generally have an excellent track record of the long term ventures. Governments can borrow at extremely low rates for long term investment and they can consider things like 2nd and 3rd generation wind turbines. Whilst a private company may balk at the high upfront cost of say a wind turbine a government can invest in 2012 for payback in 2032. The EROEI of a first generation wind farm might be 10:1, but the fixed equipment is rated to last up to 100 years and the second and third generation wind turbines may have an EROEI of 100s:1 as all you'd need to replace are the moving parts.
We have also plotted world crude prices vs ERoEI and came up with a correlation coeffiecient of 0.947 using 1960-2009 WTI. Your main problem here is two fold: ONE - the 1980 - 1985 price data-set is an anomaly. During those years OPEC forced the price up 292% by cutting their production by almost 50%. When you linearize the ERoEI function you see a six point drop in world ERoEI after those years. This probably resulted from the non-OPEC producers over pumping their wells to capitalize on $27 oil. Even though the price distribution is not normal, the ln($/b) distribution is; you can therefore easily show that the 80 - 85 period does not belong to the same population as the balance. TWO - the ERoEI curve is not an exponential function, it is an inverse logistic function which can be derived mathematically. Even though the two distributions are similiar, their difference will affect your projections by quit a few $/b.
Our plots of actual $/b vs projected for 1960-2009 came up with a correlation coefficient of 0.96, again using WTI. Our 2012 projection is $72/b, about $15 lower than yours. Although there will be considerable resistance to it (neither the Middle East situation or the US dollar will do well) it still seems quite likely we'll see $72 this year. Europe and China are unraveling, and the US is not about to enter a new boom era. Even OPEC in its hayday could only keep the price of oil up for so long.
On "a smooth transition from oil to other forms of energy ", we totally agree with you. Our estimate is that there is $88 trillion in oil dependent capital stock that can not be converted for use with other energy types. The economic impact is going to be tremendous no matter what other energy sources are utilized.
Overall good paper, and thanks.
The Hill's Group
The problem I see with energy return on energy investment type of analysis is that there is an underlying assumption which is not explicitly stated. That assumption is that the energy inputs are non-renewable.
Once you open up that assumption and allow for renewables as input EROEI and all its variants become true but irrelevant.
As a wise person once said: "the only responsible use for non-renewables is to create a renewable society"
Take for example PV which is used to release hydrogen from water which then is made into methanol, or whatever liquid works for you. One can argue that although the electron to liquids conversion process is inefficient (and has a negative energy return on energy investment) but that just a choice society makes (whether to use, for example, an electric car or a CE car) by its infrastructure design.
And yes, if society chooses to do so the PV panels can be made with non-fossil fuels as inputs, it is just that in the current infrastructure a number of PV inputs are still FF powered, not inherent impossibilities in the processes themselves.
The PV to liquids process, depending on what inputs one chooses to use has either a negative EROEI or a positive one.
Rgds
WeekendPeak
That's an interesting topic, using PV panels to create more PV panels through artificial hydrocarbon synthesis. I plan to investigate that further.
The overall process would have to be well in excess of 1:1 to be viable. Say a solar panel has a lifetime EROEI of 20:1. I would assume this means that the BTU's of oil + the kW-hr of electricity needed to make that solar panel are 1/20th of the kW-hr of electricity the panel will produce over its life. So to make a renewable solar infrastructure, some of the energy captured by that solar panel over its lifetime would have to be devoted to making more solar panels for the future, rather than powering a blender or electric car.
I'm not up on the chemistry but let's assume the efficiency of the electricity-to-hydrocarbon conversion is say 20%, and that estimate may be on the high side by the time the produced hydrocarbon has been refined to the appropriate feedstock. Let's assume that of the 1/20th of the energy needed to make the solar panel, 1/3 comes from electricity and 2/3 from oil. Therefore, to provide that same amount of oil (2/3 of 1/20th) with a 20% synthesis efficiency would now require 5X the original oil energy, or 5 * 2/3 * 1/20th which equals 1/6th of the panel's lifetime electricity production.
But those efficiency numbers I used are all just made up off the top of my head. If we assume 10% efficiency then we're looking at 1/3rd of the panel's produced electricity must be devoted to making new solar panels so you can see it quickly devolves into unfeasible depending on the electricity-to-hydrocarbon conversion process.
Why do you want to produce artificial hydrocarbons? For the production of Si you need carbon and heat, latter from electricity(electric arc), the carbon is converted in carbon dioxide, which could can be fixed in biomass, the biomass is converted into carbon. As long as the PV panel produces many times more ernergy than its production consumes the whole process can be IMHO sustainabel.
For the production of Si you need carbon and heat
Why does the reduction/purification of Si require carbon?
You can (in small scale) of course use other metals like Mg or Al, too (3 SiO2 + 4 Al --> 3 Si + 2 AlO3). These can be produced by electrolysis with PV generated electricity.
To my knowledge, in large scale production usually carbon is used (SiO2 + C --> Si + CO2), my guess is because C allows easy separation of the products CO2 and raw Si and it is much cheaper than metals. Separation of Si and a metal oxide makes more trouble. For purification the raw Si it is converted into a silane which can be distilled, last step is the cleavage of the pure silane.
So carbon is convenient and cheap for reduction (as long as carbon is cheap), but reducing silicon doesn't require carbon (or fossil fuels).
I would guess that the availability of cheap coal has prevented the exploration of alternatives that wouldn't be dramatically more expensive (competitive advantage doesn't require a big price difference).
Even with a much higher price for carbon the advantage of a gaseous oxide still exists. We have enough biomass to produce carbon in a sustaniable way, so I would not change the production.
Another for me interesing question is to which extend old PV panels (at least the crystallin Si panels) can be recycled with a smaller energy input compared to reduction of SiO2..
My impression is that the output of old PV panels drops very slowly: perhaps 90% of original. That suggests recycling wouldn't make sense.
Further, with new panels costing as little as $.70/Wp, it's hard to see it as economic.
All in all, I have a hard time seeing any barriers to producing abundant, affordable low-CO2 electricity.
Yes the output drop is much less than 0.5% per year for good panels. However, after 35 or 40 years you may have to repair your roof and deceide to buy new PV modules :-)
At some point (we don't know yet how long on average) the internal conductors (i.e. solder traces) of PV panels will probably fail, necessitating recycling of panels and component parts. Whether the majority of recycling will be of complete cells into new panels or of silicon into new cells is an open question. Doubtless some of both will take place. (Some physically damaged panels will have cells that are not recyclable as cells.) Questions I have are:
-how easy to disassemble today's panels without damaging cells?
-does the cost of the process of testing and matching old cells to each other to reassemble into new panels outweigh the benefits?
I suspect that in 30 years there will be a fairly strong market in refurbished and re-manufactured solar panels.
Null Hypothesis
Re: "using PV panels to create more PV panels"
You will find much of the discussion under "solar breeder". e.g.
solar breeder in google.
or in google scholar. For the grand scale, see the Sahara solar breeder (SSB)plan.
See also the "Energy Yield Ratio"
"The solar breeder is an energy self-sufficient industrial manufacturing
plant that produces net energy in the form of solar electrical panels."
"Energy yield ratios of 21 and 23 were found for a small and large scale wind turbine, respectively." Life cycle energy and greenhouse emissions analysis of wind turbines and the effect of size on energy yield, R.H. Crawford
My view of this is perhaps naively simple. I think of liquid hydrocarbon energy depletion as the ratio of energetic profitability to economic profitability, with ever diminishing economic profit and ever decreasing energy profit, continuing until not enough energetic or economic profit exist to sustain the process of hydrocarbon acquisition itself.
Hydrocarbon-based energy prices, per se, I think, will increase, as an expression of lower energetic profit from existing supply and the greater costs, both economic and energetic, needed for acquisition. In that sense, the terms of the equation effect each other.
Perhaps someone more conversant with mathematics notation than I could write that up as an equation. I don't expect any graph made with those assumption to be strictly linear.
EROI/EROEI are good determinants of how deep a hole we've dug for ourselves (we'll not dig out of). By themselves, the energy returns v. energy investments are more numbers the establishment will fudge.
What matters in the economy is the return on consumption: the ruined intertemporal balance sheet (apologies to Axel Leijonhufvud).
- there are nothing but liabilities on the physical balance sheet as resources are exhausted there are negligible material assets to offset them. Unlike gold which is refined and mostly still in human hands, energy assets are destroyed. The offsetting assets are supposed emerge on the economic balance sheet.
- these assets are abstractions or cribbed: 'wealth', 'convenience', 'pleasure', 'status'. Business profits are borrowed (liabilities on the same economic balance sheet): the finance assets we treasure are also abstractions and are shrinking fast: both the cause- and effect of the current debt crisis.
We've burned trillions of tons (more or less) ... of irreplaceable fuels and have nothing to show for them but smog, some pitted highways, crumbling cities/suburbs, used cars ... and debts. We've had to bury ourselves in debts to ruin our world.
Our feudal predecessors did much better (so did the Chinese): they left us cathedrals and beautiful towns.
The intertemporal balance sheet is where society's bankruptcy lurks, it's taking place within the EU right now under analysts' noses. With no return on consumption, there isn't any way to pay for new fuel but increasingly unserviceable debt.
...
We were occupants of a very resilient solar system. None of what we have created was necessary. Our cells ganged up on other cells and we became multi-cellular predators. Today, in our glorified complexity, we have ganged up to hunt, eat and extinct many species of herbivores, eat soil gradients and now fossil fuels. Each step required a greater level of ganging up, complexity, and tools to fully exploit the available resources. We gang up to tackle and consume that which cannot be tackled on an individual or less complex basis. Fortunately or not, our behaviors have evolved to allow our cooperation in this endeavor.
When the ganging up strategy fails and fossil fuels are depleted, our technological fantasy will dissipate. Just as bone remains when a human system dies, the steel and concrete infrastructure of the technological organism will persist long after the human flesh melts away from the technological bones.
Why not change now? Why not go the PV route and eliminate the roads and cars. Because, like all life, we are involved in a technological, evolutionary arms race. Given the opportunity and some rationalization bubbling up from the limbic font, we are more than willing to devour other societies and their resources. Perhaps we have more compassion than the mud dobber wasp that paralyzes spiders, bites their legs off and encases them in mud tubes for their progeny to devour alive, but sometimes events like the rape of Nanking and various other slaughtering events make me think we are no different, that civilization is not so civil after all. The fossil fuel eater will gladly use their advantages to consume the relatively helpless PV society if they’re considered worthy of consumption.
When the fossil fuels are gone, the societies as we know them will be gone. Like the pan caking collapse of a building, societies will fall through previously utilized but inadequate resource bases like coal, unamended soils, and natural and captive herbivores. None of these will be able to catch the weight of the desperate primate gang bangers looking for their next meal.
This whole situation deserves the undivided attention of our leaders, but I do believe it is beyond their scope of reasoning and the subject made poisonous by the ignorance and natural passions of their constituencies.
Meanwhile, in the real world the top three installers of wind and solar are Germany, China and the US. These are also the most successful economies.
I don't see any sign that their renewable investments are setting them up for invasion from their neighbors France, Japan and Canada.
when E-ROI gets over anything around 10:1, it starts to lose it's meaning. Consider: you have a choice between picking up 100 gallons of fuel at two locations. The first location allows train travel which consumes 2 gallon of fuel, but 20 hours of travel. The other requires car travel that consumes 4 gallons of fuel, but takes only 4 hours. You save 16 hours of travel time by consuming two more gallons of fuel - when fuel costs $3/hour the choice is obvious, right? You take the car, despite moving from an E-ROI of 50:1 to "only" 25:1.
Here's a good article expanding on the above: http://www.theoildrum.com/node/8625#more
----------------------------------------------------------
E-ROI analysis is a useful tool, but scale of the net energy gain is more important.
The analogy here is Soviet toilet paper: if you subsidize it too much, the toilet paper makers start buying it from the stores, and using it to make new toilet paper, because it's cheaper than the normal wood feedstock!
Obviously, you don't want that kind of thing, but....
Look at the transition from hunter-gathering to farming: hunter-gathering was far higher E-ROI, but it didn't scale.
Similarly, local wood is higher E-ROI than distant, deep coal, but local wood didn't scale.
Scalability (maximum volume that can be produced) is far more important than E-ROI.
----------------------------------------------------------
We should remember that forecasting this kind of thing is quite difficult, and be humble about our projections. Remember, "Predictions are hard, especially when they're about the future".
"Extrapolation of energy costs and gains in petroleum drilling and extraction indicates that drilling for domestic petroleum could cease to be a net source of energy by about 2004 at low drilling rates and by 2000 or sooner at high drilling rates, and that the net yield will be less at higher drilling rates."
Hall, Charles A., Cleveland, Cutler J., Petroleum Drilling and Production in the United States: Yield per Effort and Net Energy Analysis, Science, New Series, Vol 211, No. 4482 (Feb, 1981), pp 576-579
-----------------------------------------------------------
Finally, solar costs and manufacturing energy inputs are dropping fast, and wind's E-ROI is probably around 50.
Cutler Cleveland's summary of the literature:
http://www.eoearth.org/article/Energy_return_on_investment_(EROI)_for_wind_energy
which showed that wind's E-ROI was around 19. If you study his sources, you'll see that that most of the studies are quite old. If you look at the turbines used in those studies, you'll see that the turbines studied were much smaller than those in use today - look at Figure 2, and read the discussion. If you study that chart, you'll see a very clear correlation between turbine size and E-ROI. It's perfectly clear that Vestas' claim for a current E-ROI of around 50 is entirely credible.