Tech Talk - Saudi Arabia and What Lies Ahead
Posted by Heading Out on July 15, 2012 - 5:02am
Saudi Aramco has stated that it designs the well layouts and extraction patterns from its oil fields so that they effectively decline at a rate of 2% per year.* If one divides 100 by 2 it yields 50. If one subtracts 50 from 2012, one gets the year 1962. Even for those with poor math skills, these are not difficult operations, and they lead to the conclusion that those fields which came into production in the early 1960’s and earlier are now reaching the end of their productive lives. They are not there yet, since production took time to ramp up, and some fields have been rested over the years when production was cut back, or even mothballed. But this gives you some perspective on the overall scope of the situation, without the need for complex mathematical modeling.
(*The IEA apparently believes that the figure is closer to 3.5%) (H/t Matt) Saudi Arabia states that, without using advanced recovery techniques and “maintain potential” drilling sites – often not in the same field as that being depleted – the rate would be 8%.(h/t Darwinian ).
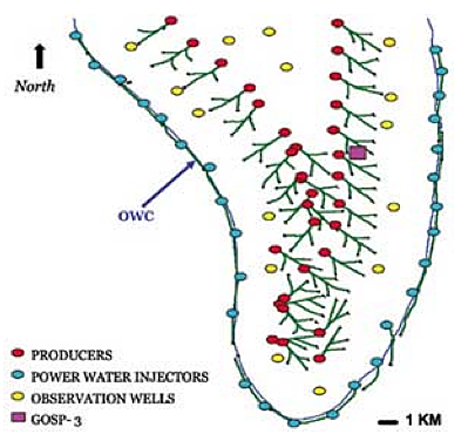
In earlier production practices, where companies “stepped out” production wells away from the original producers, and gradually extended their knowledge of field size, reserve growth over time was a normal development. However, with the large size of the fields in Saudi Arabia, and the need to maintain operational pressure during production, Aramco (as JoulesBurn has clearly shown) rings their fields with water injection wells that drive oil to the central high point of the reservoir, slowly migrating the producing and injection wells towards that center as the field is drawn down. This practice precludes the incremental increase in reserves over time, since the field boundaries are constrained. As the wells reach the central part of the reservoir (the crest of the anticline) a clear definition of the closing days of the field becomes more evident.
At the same time it is worth pointing out that until fairly recently, when Aramco were carrying out their “maintain potential” drilling, they were merely drilling additional wells at 1 km, spacing further down the reservoir. But when one moves from the perimeter of the reservoir to the crest, then there are no more places within that reservoir to continue the practice. Thus, in more recent years, Aramco has offset declines in older reservoirs by bringing new fields into production. But as the illustration that JoulesBurn has provided for Haradh 3 shows below, in the smaller reservoirs it is no longer possible to have the space for multi-year progressions of the wells across the field, and thus, to sustain production, new fields will have to be added to the network at more frequent intervals to sustain levels of production.
Saudi reservoirs have also been large. This brings with it the need for large infrastructure, not only to remove the oil, but also to separate the oil, gas, and water (and occasional sand) that come from the well, and to inject water into the reservoir to replace the oil and maintain the reservoir pressure that drives the fluid to the well. That infrastructure is tied to specific design flow rates and it is difficult to change the volume flow rates by significant amounts at short notice. Thus, when a field such as Abu Sa’fah, for example, is brought on line to produce 300 kbd, the plant is completely designed for that flow and there is no immediate way to handle an increase in flow. Therefore, Aramco can only produce to the capacity of the infrastructure in place. It is this requirement and “step-function” nature of the additions to oil flow that provides some of the shape to the flow of oil in the region.
However, it is also a limitation in that the two remaining large sources of crude oil that Saudi Arabia anticipates coming on line must wait until all the logistical handling is in place.
The first of these is the Shaybah expansion. Shaybah began with a production of 250 kbd, and has seen this progressively increased, first to 500 kbd, and then, in 2009, to 750 kbd.. The expansion requires that additional plant be installed to process the hydrocarbons produced which will include 264 kbd of NGL. The anticipated completion date is in 2014.
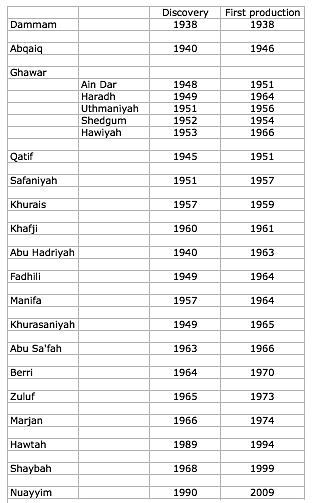
Manifa has been the more controversial of the fields in Saudi Arabia for some time. Although it has been known to exist for a long time (see above table) and was initially brought into production in 1964, it has never seen the major thrust to develop production that is now underway. There have been several reasons for this, the primary one being that KSA has never needed the production in the past to be able to meet anticipated demand. However, there have also been significant questions as to the make-up of the oil, and its need for special treatment. In 2005, back in the days when KSA was admitting to a decline rate of 6%, it was producing at around 50 kbd. JoulesBurn has written about the controversy over the make-up of the oil, which is a heavy, sour crude containing vanadium. Regardless of the validity of those arguments, it does appear that the oil is now going to be fed as it is produced to two new refineries that have been planned in the Kingdom. These are at Jubail, which is expected to be completed in 2013 and will handle 400 kbd of oil, and the second at Yanbu, which, as of this year is being developed with Sinopec, ConocoPhilips having pulled out of the deal. Those together comprise some 800 kbd of the 900 kbd of oil that Manifa is being developed to produce.
It is pertinent, relative to the opening comment, to note that this is the last large project that Saudi Aramco has reported to be on their books. If one were to accept that their real decline rate is some 3.5%, then, at a production level of roughly 10 mbd a year, this would be reducing at 350 kbd per year. A 1.2 mbd addition to current production (Manifa and Shaybah combined) would thus only match just over three years of such a decline rate. For there to be new sources of production brought on line in the future, there must first be a considerable infrastructure put in place, and there does not at present appear to be any evidence of this, nor planning and bid documents being prepared for such an eventuality. Remember that Aramco began construction for Manifa in 2007, and it is still likely at least a year from major production.
To some extent this can be overcome by feeding new production from fields not now in production into the existing GOSPs and related facilities. But this implies that production will not grow beyond its current levels at around 10 mbd. Aramco has become very skilled at controlling water floods, enhancing production from existing reservoirs and previously bypassed oil, but those wells can only be revisited a limited number of times. Because of the large number of highly productive wells the country has, it is possible in the short term to raise production, but that increase has to go through production facilities that are of only limited volume. Thus the increase can be of only a short duration, and as has been commented by others in the past few weeks, a system cannot be run at full production for long without problems developing. Furthermore, the underlying assumption that production declines can be offset by new production to hold depletion to 2% a year is really only true for the country as a whole, and individual decline rates for specific reservoirs have been reported to run between 6 and 8%. As there are fewer large projects to provide the offset for such decline rates, then the impact of the greater values will become more evident. And so, while I expect that the Kingdom will reclaim its position as leading oil producer before long, I continue to believe this will happen because of a drop in Russian production rather than a gain in from the Kingdom.
Contact
- Content: editors at theoildrum dot com
- Tech support: support at theoildrum dot com
License

This work is licensed under a Creative Commons Attribution-Share Alike 3.0 United States License.
Yes, your conclusions are in line with Kjell Aleklett's of ASPO too. He decided to go through all the data, both historical, present and what he terms 'realistic estimates' on all things Saudi Arabia.
His conclusion is that Saudi Arabia will be able to keep it's current production for at least a decade, possibly even rising to 11.5 to 12 mb/d at it's maximum some years out(in the best case).
This is consistent with the former head of engineering at Saudi Aramco(the company which controls Saudi's oil production) who talked candidly to the U.S. embassay in Riyadh(via Wikileaks, you can read the original cables here)that he expects Saudi to more or less flatline at about 10-11 mb/d over the next decade. The 11 mb/d that he estimated was a figure that would be reached only slowly with the help of unconventional oil.
In other words, the notion of the so-called 'spare capacity' (if defined in a tradtional way, namely sudden release of oil onto the oil market) was more or less killed by Saudi Aramco's own head of engineering(although now retired).
Russia is a much bigger worry. I've posted before that the CapEx costs just to keep producing at current levels is reaching the $100-110 dollar band. And we should remember that Russia never had any kind of major civil unrest these past years.
If Russia had peaked 10 years ago, the decline would already have set in by now, since world prices back then could not support the kind of investment costs now needed just to remain flat. Russia, however, is lucky as the world supply is stagnating, thereby pushing up prices and allowing them to keep investing huge amounts of capital in order to keep their production flat.
The key hope is that unconventional will be able to stabilize the prices and if they are to rise, then at least rise so slowly that the socities can adapt. That is the hope of the elites in the West. We'll see if it pans out that way.
Edit:
An update on Russia. Here's the Financial Times from just two months ago:
You can read the whole thing here.
Most estimates I've seen have landed between $100-110, but $100 is the low estimate in this case and $117 must be seen as a high estimate.
The FT piece talks about largesse, and there's some of that(not to mention the military budget), but that is not the whole story.
In April of 2008, Russian oil production actually declined year over year - which is pretty shocking considering that the Spring/Summer period of 2007 to the spring/summer period of 2008 saw a huge, secular price increase of oil prices for all blends all over world. And Russia's production declined in this period?
The Wall Street Journal did interview one of the top energy executives in Russia:
Via the BBC.
There were a few bearish predictions in that piece which did not pan out, but the point is that unlike what the FT piece indicates, a lot of these problems have to do with struggling to find new production and keep up with the rising production costs at exisiting oil plays.
Thanks Leiten -
How much of Russia is yet to even be explored? Are there huge swathes of land where no geologist has even stepped? I've always wondered. Saudi has been picked over with a fine toothed comb; how about Russia?
Concerning Russia: Alex Burgansky: Russian Oil and Gas Industry Surprises Analysts
Saudi Arabia is obviously not the only country that is engaging in massive infill drilling to stem the decline rate. Of course not all those 5 to 6 thousand new wells are in mature fields, but most of them are.
Ron P.
A steep decline for Russia can be seen in this set of graphs from Australia's internal Report BITRE 117 (Fig 7.33 for Eurasia)
19/12/2011
Australian Energy White (Wash) Paper 2011: peak oil denial not yet peaked
http://crudeoilpeak.info/australian-energy-white-wash-paper-2011-peak-oi...
Geeze, this is absolutely alarming. Eyeballing the chart the decline, for Russia, starts about 2015, hitting about half a billion barrels per year by 2030. That works out to be somewhere between 1.35 and 1.4 mb/d. They are producing, currently, about 10 mb/d. That is some fall from grace.
Leonardo Maugeri in Oil: The Next Revolution, has Russia actually increasing production (capacity) to about 10.75 mb/d by 2020. (Figure 2: Country-by-country evolution of oil production capacity to 2020 on page 3.)
Ron P.
Russia is a very old oil producer. It has been rather thoroughly explored, exclusive of the high Arctic regions of Siberia. Northern Siberia and the Russian Arctic Ocean are reputed to be gas-prone. There is a lot more potential for finding natural gas than oil up there.
During the Soviet era, the geologists were under an awful lot of pressure to increase oil production, and the easiest way to do that was explore the entire country, find the biggest oil fields, and produce them as rapidly as possible. They had the advantage that they could just arbitrarily send people to Siberia to work in the oil fields whether they wanted to go there or not.
The result was that they had a lot of production, but did a lot of damage to the oil reservoirs and stranded a lot of oil as a result. The increases in production in recent years have come from infill drilling and EOR. They have been identifying the pockets of stranded oil and been producing them using modern Western production techniques. This has resulted in a second peak on their oil production curve equivalent to the first - a bimodal distribution curve with Communist peak and a Capitalist peak. We're close to the top of the Capitalist peak.
I know from experience that reworking old oil fields that major oil companies have sold can be a lot of fun. Using 3-D seismic and EOR, you can get an awful lot of oil out of them that the majors missed. The problem is that there are limits to this process. Once all the recoverable oil has been located there's nothing much you can do except plug and abandon all the wells and sell the production equipment for scrap. The companies I worked for that specialized in this are pretty much gone now.
In other words, at some point Russian production is going to go into terminal decline, much as North Sea oil production has done in recent years. This involves some pretty steep initial decline rates, as the UK has found.
As I have previously noted, North Sea producers did a great job of bringing new oil production on line, after 1999. New fields in the North Sea, whose first full year of production was in 1999 or later had a production peak of about one mbpd, in 2005. These new fields served to slow the overall post-1999 rate of decline in North Sea crude oil production to about 5%/year.
However, note that the North Sea showed a seven year "Undulating Plateau" from 1996 to 2002 inclusive.
I wonder about this as well. I don't think anyone directly answered the question. Mother Russia is pretty damn massive. And I really don't think it has been gone over very well with modern seismic. Yeah, they are doing lots of in-fill drilling . . . but there have got to be more finds out there.
However, even if they do exist, it is going to be a long time before they are discovered, drilled, and brought on line. So much of the territory is quite remote and would require a lot of time & money for pipelines. So even if we assume a lot more undiscovered oil exists, it won't make a difference in the near future.
I thought I answered this, but I guess I didn't do so directly.
Russia has been very thoroughly explored using relatively modern technology. Probably all of the biggest oil fields have been found. What Russians are doing now is redeveloping their old oil fields to extract the oil they missed in the heyday of the Soviet Union.
They still have a lot of oil to produce, but they are going to have to produce it using infill drilling and EOR. They aren't going to find any monster new fields like they found in the past. It is what we call a "mature" oil province.
A lot of Russia is very remote, but most of it has already been explored. During the Soviet era, they just sent millions of people to Siberia to do the exploration and development of the oil fields. Arctic oil production is nothing new for the Russians.
The UPI article where the IEA states the decline is 3,5% was dated 2012. The article stating that, with infill drilling, Saudi had gotten their decline rate down to almost 2% was dated 2006, or six years ago. I see no contradiction there whatsoever. The decline rate has simply increased over those six years.
William Catton, in "Overshoot" compared methods to pump the oil out a lot faster in order to stem the decline rate with becoming more efficient at filling out withdrawal slips at the bank. You could withdraw your money a lot faster but you would not create any more money in your account.
There has been many threads and posts on TOD and hundreds of articles on the web discussing decline rates. But there have been very little mention of depletion rates. When, with infill drilling, you decrease the decline rate, you, at the same time, increase the depletion rate. What has all this infill drilling done to the depletion rate of Saudi fields? When you decrease the decline rate you, at the same time, increase the depletion rate.
They keep pumping harder and harder with more and more infill drilling with horizontal wells in order to stem an 8% decline rate and maintain 9 mb/d of production and they will be able to keep this up for decades? I don't think so. Just as sooner or later all those extra withdrawal slips will completely deplete a bank account much faster, all those extra withdrawal wells will completely deplete an oil field.
Saudi, despite its decline rate has been able to maintain its output level by bringing new fields on line and brought older fields out of mothballs. And of course, by putting super-straws in older fields they have been able to suck a lot harder on those. And they still have one more to go, Manifa. Then nothing except more super-straws. I am not optimistic that they will maintain current production for decades.
Ron P.
"When, with infill drilling, you decrease the decline rate, you, at the same time, increase the depletion rate. What has all this infill drilling done to the depletion rate of Saudi fields? When you decrease the decline rate you, at the same time, increase the depletion rate."
So I guess this means that the slope on the downward side of the production graph is a lot steeper; longer time at plateau but then a much more rapid plunge...
I didn't mean to say the same thing twice in one paragraph. An oversight that I missed in a proofread. But on second thought it is worth saying twice since so few seem to understand that very simple principle.
But your assessment is correct. It is especially true when you understand that all the new infill wells are horizontal wells, pulling all their oil right off the top of the reservoir. That means the decline will be very slow until the water hits those horizontal wells right at the top. Then the decline hits hard and fast.
Ron P.
Ron ,
do you think these methods will result in a shark's fin production graph? We've been doing really well to keep production of crude at a relative constant level since 2005 , remarkable really for two reasons, price wise the standard economic model should have given us more oil as there's more profit to be made , and secondly for the fact all the extra oil has only kept things steady and we've not seen a decline.
This really makes me wonder that we'll not keep this up for ever....
Forbin
Re: Production Plateaus . . .
Down the thread, I note that the combined post-1995 CNE (Cumulative Net Exports) from six members of AFPEC (Association of Former Petroleum Exporting Countries) were 53% depleted in only four years, at the end of 1999.
Here's the kicker: There was no production decline over the four year period.
Combined production in 1995 was 6.9 mbpd.
Combined production in 1999 was 6.9 mbpd.
But the 1995 to 1999 post-1995 CNE depletion rate was 19%/year. Building on the bank balance model that Ron referenced up the thread, it's as if you were maintaining your standard of living by depleting your bank account at the rate of 19% per year.
In a similar fashion, in my opinion, we are only maintaining something like Business As Usual as a result in a sky high rate of depletion in post-2005 Global CNE and in Available CNE.
Global CNE = Global (top 33) Cumulative Net Exports
Available CNE = CNE available to importers other than China & India
Incidentally, if we look at global crude oil production numbers (EIA, C+C), in the 10 year period from 2002 to 2011 inclusive, globally we have consumed about 23% of all the crude oil ever consumed (through 2011). The prevailing general consensus is not that our rate of consumption of a finite fossil fuel resource base is too high. On the contrary, it is too low, and the emerging consensus* is that we should, and we will be indefinitely able, to increase our rate of consumption of a finite fossil fuel resource base.
*With the exception of a handful of "Finite Earth" types
"if we look at global crude oil production numbers (EIA, C+C), in the 10 year period from 2002 to 2011 inclusive, globally we have consumed about 23% of all the crude oil ever consumed (through 2011)"
Let me get this straight.
At the time of the Pharaohs there was a finite amount of crude oil ( + condensates) on Earth: TOTAL OIL EVER AVAILABLE (TOEA)
The amount of oil humanity has burned or turned into chemicals in the period between 2002 and 2011 represents 23% of TOEA. In just 10 years.
Now, this TOEA is the sum of all resource figures from around the world, not booked reserves **
So, even if that TOEA figure was off by a factor of two - in other words there is still the same amount again to be discovered - then in the same 10 year period between 2002 and 2011 humanity will have powered through 11.5% of all the oil ever available - assuming a 100% recovery rate of the resource in place.
That is just a staggering statistic. Totally sobering. There is a little lad playing in the garden outside my window as I type. He is 11 years old. So in just his short lifetime humanity has devoured a quarter of all oil?
I'm not new to this; it still amazes me though. When put this way it is like being smacked over the head with a bat. Kinda gets your attention.
Out of interest, even if production rates stay constant how long will it take to use of the next 23%?
-----
** The resource being the total amount of oil in the field/basin; the reserve being the (smaller) amount the engineers reckon they can produce given current technology and economics.
The most commonly used estimate (ExxonMobil and Deffeyes agree on this number) for global cumulative crude oil production through 2005 is 1,000 Gb. With that as a starting point, we have the following (C+C, EIA):
2006 to 2011 inclusive production about 160 Gb
Cumulative through 2011: 1160 Gb
2002 to 2011 inclusive: 263 Gb, or about 23% of total cumulative production
EIA Annual Global Crude Oil production
2002: 67 mbpd
2003: 69
2004: 72
2005: 74
2006: 73
2007: 73
2008: 74
2009: 72
2010: 74
2011: 74
Annual global (Brent) crude oil prices doubled from $25 in 2002 to $55 in 2005. Global crude oil production increased at about 3%/year from 2002 to 2005, which would have put 2011 production at about 90 mbpd.
Annual global crude oil prices doubled again, from $55 in 2005 to $111 in 2011. In response we have been on a (so far) seven year undulating plateau, starting in 2005, versus the 90 mbpd level that we would have been at in 2011, given the 2002 to 2005 rate of increase (and Yergin, circa 2005, was predicting a continued 3%/year rate of increase).
Replying to my own:
What is the actual figure that is generally accepted for the total amount of oil ever to have existed - in all forms (so assuming all Alberta sands are turned into crude ditto Orinoco etc)?
(edit: so the 23% represents that amount of total production not the actual total resource?)
Yep.
The argument of course is about the size remaining resource base that can be commercially produced. Cornucopians argue that higher prices and improved technology are shifting more resources into the proven reserves category, which is true. However, a key question is whether the increase is material or incremental.
In the context of the global net export situation, I would argue that the increase is helpful, but (so far at least) only incrementally so. For example, Canada has shown increasing net oil exports, but total combined net oil exports from the seven major net exporters in the Americas, inclusive of rising net exports from Canada, fell from 6.1 mbpd in 2004 to 5.0 mbpd in 2011 (BP).
This analysis has led to my Titanic metaphor:
At the 2005 to 2011 rate of decline in the ratio of GNE to CNI*, the Chindia region alone would consume 100% of GNE in 2030, 18 years from now. Of course, I don't think this will actually happen, but that is the trend line, the rate of decline from 2008 to 2011 accelerated, versus the 2005 to 2008 rate of decline:
http://i1095.photobucket.com/albums/i475/westexas/ECIPlots2.jpg
*GNE = Global Net Exports, Combined net exports from top 33 net exporters in 2005
CNI = Chindia's Net Imports
The "total amount of oil that has ever existed" is a bit of a nebulous number. The vast majority (>99%) has leaked out and been lost forever. The vast majority of what is left is trapped in impenetrable formations from which it can never be produced.
You could put the world's recoverable resources of conventional oil at approximately, 2000 Gb, of which half (1000 Gb) has been consumed so far.
The Alberta oil sands have about 1700 Gb of bitumen-in-place, the Venezuelan oil sands about 2000 Gb of extra-heavy-oil-in-place, for a total of 3700 Gb. The USGS estimated the kerogen-in-place in the oil shales of the US at 3000 Gb, of which half (1500 Gb) is recoverable.
However, this has to be taken with a grain of salt. The Alberta oil sands is estimated to have 170 Gb of proven reserves and the Venezuelan oil sands are estimated to have about 300 Gb of proven reserves because that is all that is economically recoverable. None of the US oil shales have proven reserves because none of it is economic with current technology.
Because of the amount of non-conventional oil out there, I don't think we are going to have a shark-fin curve, because as prices rise the non-conventional oil will become economic and go on production, and the technology will improve so that more of it will become economic. This will stretch out the curve a long ways.
So I am anticipating a global oil production curve with an "undulating plateau" at the peak, followed by a fairly steep decline, but not a "shark fin". The decline will be very prolonged - there will still be considerable production in 2100, but it will be very, very expensive - probably too expensive for most of the world's 9 billion inhabitants to be able to drive to work in petroleum-fueled cars, and that includes most Americans and Europeans. Lifestyles will have to change.
A couple of points. As prices rise demand will drop, keeping prices low, perhaps low enough that most of that non-conventional oil will never be economical to produce. It is a serious mistake to just assume that as oil declines prices will just keep rising and rising. High prices and a declining energy supply will definitely knock the economy into the doldrums. A very deep recession would be almost a certainty and even a depression is likely.
And another point. That non-conventional oil that just barely becomes economical to produce will definitely produce a shark fin EROEI curve as I depict in another post below. In my opinion there will definitely be a sharp shark fin EROEI decline curve.
As it happens an excellent video just came out yesterday by the creator of the EROEI concept, Dr. Charles Hall. He explains why EROEI is so very important. Which will explain why that barely economical non-conventional oil will make little difference.
EROEI and the Collapse of Empires
Ron P.
Ron – I think there’s another factor some don’t appreciate re: shark fins and more gradual declines. FWIW I’m not a proponent of the shark fin…at least not a severe one.
The open ended question is who will be developing those expensive unconventional reserves. As I’ve pointed out numerous times my privately owned company didn’t drill for unconventional shale reserves because they didn’t deliver a satisfactory ROR for my owner. And that was true when oil was $120+ per bbl. Conventional NG plays were doing so until prices collapsed. And if my EOR poject doesn't deliver an acceptable ROR he'll junk my company and send our $300 million budget to his other companies. He is very fond of me (mostly because I don't treat him different despite his $billions LOL) so it wouldn't be personal when he ran my butt off. Just good business.
The pubcos dominate the shale plays because they need to keep adding to the reserve base to support the stock values. Even before the recent slide in oil prices there was some indication the pubcos may soon be lacking the capex to keep fueling the shale treadmill.
So a purely theoretical question: if the pubcos efforts in the shale plays begin to lose investor support and they start pulling back significantly who is going to drill those tens of thousands of wells? My company might…if oil hit AND sustains a price higher than we’ve seen in the recent past. But as you’ve pointed out the economies don’t appear to be able to handle those high prices. I don’t think many folks realize they are making a potentially invalid assumption: just because there are numerous marginally profitable oil wells to drill that there will be enough investors willing to spend those necessary hundreds of $billions. If consumers can't afford to buy expensive oil how can companies afford to drill for expensive oil?
Ohh…ohh…I know. The feds can borrow a few more $trillion and loan it to the oil patch. It worked for the auto industry. I’m sure Chesapeake would drill every location they had under lease if they could use tax payer $’s.
Problem solved. LOL.
And if high oil prices continue to pressure economies to very low growth or recession, then the ability of those economies to 'afford to buy expensive oil' will drop over time and further reduce incentive for exploration.
I am a shark fin proponent, which can also be viewed as a cresting wave analogy. High oil prices are pushing the outside of the envelope of incentive to bring as much oil as possible to market in the face of a peak, but like a wave that over extends (by way of rapid depletion) it crests and then collapses.
What is fascinating is the view from the leading edge of this cresting wave to cornucopians appears as an infinitely growing supply as non-conventional and ultra deep resources previously out of economic range now appear like a panecia. However, the reality is the current high flow rate (and any increases) can only be sustained if the price is low enough to spur economic growth. Without it there is that point where the tip of the wave has no support and precipitously falls. We are still short of that point, but I wonder by how much.
Rockman,
I'd suggest you get a form of shark-fin not because you get swift decline rates due to extraction techniques, but because the feedback loops that govern production get rewritten.
Investors put money into drilling to make bigger sums later, with acceptable risk profiles. As costs go up and demand destruction increasingly looks like making the oil unaffordable, the risk on the return increase, and as you say eventually the investors play different games with their money.
However, with sky high oil costs we get depressions, and with it collapsed stock markets. Banks and financial markets get called on their lies and disappear overnight, taking with them their dream of money. Businesses that relied on cheap transport are assailed by higher costs and worse credit markets, and fold. That has a domino effect to other businesses.
As such the investor might not even have the money to invest, even if they wanted to.
Governments look on, and attempt to support the economy, stopping it from collapsing. Because those politicians are bought and paid for, the money goes to their friends - not necessarily where its needed. As for oil, well we don't want to let a precious and irreplaceable resource like that walk out the door - it's controlled and limited by government mandate.
Those countries that can export, don't. Those with imports are cut back to their domestic production rates.
In short, you get a shark fin because the system that enables the drilling to happen in the first place is removed and realisation is gained that you can only break the piggy bank once.
The oil that is around is not distributed evenly. In fact its distribution on decline is profoundly uneven - and with it the speed of the shark fin as encountered by the individual. 100% > 10% within a few years is the likely scenario for the man on the street.
Not really following this discussion but thought I'd give some props to the person who coined the term "shark fin" in relation to decline, TOD member "memmel," who used to write interminable posts about who knows what, leading who knows where. He came up with the SF by staring at a plot of some big offshore field and thinking its precipitously steep backside could be applied to the world as a whole, somehow, I think. Maybe? He was really something. Used to spend a lot of time skimming past his free-form association.
You might try taking a handful of producing countries who have declined, and see if you can get a very steep decline out of the result. Kinda think you'll get a shape closer to an Oreo cookie, but that doesn't make for the same kind of ominous tone that "shark fin" has.
As prices rise demand will drop, keeping prices low, perhaps low enough that most of that non-conventional oil will never be economical to produce. It is a serious mistake to just assume that as oil declines prices will just keep rising and rising.
It is a serious mistake to assume the Laws of supply and demand have been repealed.
I've been looking at it more depth recently and have decided several things are going on at once which are confusing people.
In this case, the supply has remained constant, but the price has risen over the past decade, so the only conclusion I can draw is that the supply curve has shifted to the left and the demand curve has shifted to the right.
What is going on is that Peak Oil is responsible for shifting the supply curve to the left, which would normally result in lower supply, but the rise of China+India+others and the movement of billions of their people into the middle class has shifted the demand curve to the right.
The result is an "undulating plateau" of supply and demand, and a fluctuating but higher price with no change in supply.
I've also been looking at the EROEI concept, and decided it is misleading. You should be using the inverse function, which could be called EIPER, Energy Input to Produce an Energy Return and could be expressed as a percent. This eliminates the astronomical numbers for conventional oil, which are meaningless.
Thus a real Texas gusher, with an EROEI of 100 would have an EIPER of 1%, indicating there is very little input required to get the oil out, which is OK in its way, and fuel ethanol would have an EIPER of 100%, which indicates you're gaining nothing by turning corn into fuel because the same amount of energy is going into the process as is coming out.
More tellingly, a marginal nonconventional oil project with an EROEI of 3 would have an EIPER of 33%, which indicates that it is still pretty good in a resource-constrained world.
Most Canadian oil sands has an EROEI of between 12 and 4, which means an EIPER of between 8% and 25%. The former is not bad compared to a Texas gusher, and the latter is still pretty acceptable. There are about 170 billion barrels of oil producible in Canada within that range, and at about 300 billion barrels in Venezuela.
And all that oil is economic at current prices. As prices rise, more will become economic. The big constraints are capital and labor.
Rocky, the laws of supply and demand have definitely not been repealed. A lot of peak oilers seem to think they have however. They just expect, as oil gets scarcer and scarcer, prices will just rise and rise. That is proof that they haven't a clue as to how the laws of supply and demand really work.
As proved, beyond any shadow of doubt by events of 2008, as supply declines, or remains flat as demand increases, prices will rise until they get to the point that demand is seriously affected. As more and more people cut back on their consumption, because of high prices, the economy is adversely affected. A lot of demand is destroyed. Prices collapse. They did and they will again.
Do not expect prices to rise again without demand destruction... again. They didn't before and they will not again.
I find it absolutely astonishing that some people expect expect the same scenario to be run again but with different results next time.
No, the big constraint will be the state of the economy. Why on earth do you think it will be different the next time? As prices rise the already sorry state of the economy will only get worse. More and more people will cut back on everything. More and more people will become unemployed. As the economy collapses so will the price of oil.
Ron P.
Ron, when prices rise, not all demand destruction is due to economic decline some is due to energy efficiency and substitution becoming more economical. I can easily see a scenario where oil hovers between the price of the tar sands, oil shales, enhanced recovery techniques, etc at say $80/B and $120/B where energy efficiency for vehicle mileage and substitution of EV, nat gas, etc. kick in.
With the short life span of the marginal producers, it is difficult for me to see how prices can stay down for long periods of time. Cycles that may have taken 5 - 10 years in the past may play out in one to two years if new investment slows due to insufficient ROR. Nat gas will be a good measure of how quickly the marginal supply can dry up when returns are not sufficient to cover costs even in a 0% interest rate environment.
As far as the economy goes, I'm more concerned about the debt crises and potential currency crises, at this point, than energy. Many countries may lose the ability to purchase oil before their is no oil to purchase.
And how fast does that happen. More energy efficiency automobiles and such take years to develop. The price spike in 2008 took a matter of months.
More economical substitution doesn't happen at all. What is cheaper and more efficient than gasoline that was brought on line in late 2008? Is it still there today? If so just what are you talking about? I want to get some of that cheaper and more efficient stuff to put in my tank.
No one is talking about prices staying down for long periods of time, I am saying they will not keep getting higher and higher. There is a price which the economy can stand without slipping deeper into a recession. they will not get higher than that. And I would say that price, in today's dollars, is somewhere between $100 and $130 a barrel. When they go higher the economy slips and demand drops. When they go lower demand increases.
You cannot leave the state of the economy out of the equation. It is as simple as that.
Of course there is a lot more to the economy than the price of oil. The debt crises is very much a factor. But everything is tied together. Everything affects the economy and the economy affects everything. And if many countries do lose the ability to purchase oil before there is no oil to purchase... then that proves my point doesn't it.
Ron P.
Energy efficient automobiles exist today and many people already own them. Most families have multiple vehicles and the ability to switch to the most fuel efficient vehicle when prices rise. As far as vehicles go, gas is just one part of the expense. If someone can afford to purchase the vehicle, pay the yearly tax and license fees, pay for insurance, as well as maintenance and normal wear items like tires then they can buy $4 or $5 gas. Maybe they don't drive as much or switch to the more fuel efficient vehicle but they can still buy some gas.
Substitution happens when prices are high not at the lows of 2008. Substitution comes in many forms, freight shifting to rail from trucks, commuters moving from single vehicle to transit and car pools, wood substituting for fuel oil and propane, GTL substituting for oil, nat gas substituting for oil, electricity for oil, etc.
I agree with your $130 a barrel but its not all the economy slipping, some of the drop in demand is the response to the higher price. Paying more for a more fuel efficient vehicle makes more sense, electrifying rail starts to pencil out. In short, higher prices drive investment in fuel savings. As the reality of persistently higher prices settles in, I expect more people to make the investment in fuel efficiency. Just as with the hope for economic recovery, it takes the public awhile to cut through the constant stream of BS from the media and the government to see that the economy is not improving and cheap gas is not around the corner.
To add to what Ron is saying about demand destruction. Oil prices don't just create demand destruction, they also limit the amount of money that can be allocated to capital as credit lines are less readily available. As less credit is available, less consumers and businesses will have the money need to make the expenditures to either buy a efficient car or build a factory that produces efficient cars.
And even if the company did have sufficient funds to make such a factory the lack of demand from consumers will mean less are built. The global economy (or the economy in the West at least) suffers from a lack of demand. As the price of oil increases then the level of demand will fall further due to less discretionary income. If this demand falls sufficiently then it will trigger positive feedback loops that can cause a collapse in demand. If you want to gain a good idea on the feedback loops that will take place please consult garyp's response to Rockman's post as he highlights these loops quite effectively.
Once those positive feedback loops take hold it will overwhelm the system and governments/central banks will be impotent to stopping it. At that point deflation or hyperinflation will begin to set in and any forward investments will be abandoned as the priority of businesses becomes surviving rather than expansion. In other words, expect none critical product lines to be cancelled. Moreover while businesses cut back there will also be many business failures which will reduce the supply of money and by extension capital formation. We had a taster of all this in 2008 but the next leg down will be greater than 2008 I suspect.
This is alrady happening. Portugal, which has one of the highest dependancies in Europe on imported fossil energy, also had one of the most heavily funded renewable energy industries, using government subsidies. Now that they are facing financial bail-out, the funding for renewable energy has been slashed more than anything else. They are entering terminal economic tailspin and doing exactly the wrong thing to pull out of the dive.
Most other countries will follow exactly the same policy.
The credit bubble that has been created in the developed world has allowed a lot of countries to consume more oil and other resources than they could have otherwise afforded. Now that the bubble is imploding the credit system that allowed countries to run large external current account deficits is falling apart and a more balanced bilateral trade system will take its place. The developing world seems to have this figured out and is moving rapidly in that direction. So, countries that have been living beyond their means will have to rapidly reduce their standard of living through a depression like deflation and/or a currency devaluation induced inflation. This is a process that is, for the foreseeable future, fairly independent of oil prices, not that high prices help. If anything, the demand destruction while this process runs its course should serve to keep a lid on oil prices, barring something stupid in the gulf.
So, I agree that a number of developed countries are going to have a hard time transitioning to a lower energy intensive economy but it will happen. Hopefully, the more mature cultures will be able to handle it without devolving into chaos, time will tell, but, if the society keeps itself together, eventually prices will get cheap enough to attract foreign investment and they can start building their own solar panels.
The events of 2008 were what I consider a market correction. The market price overshot the equilibrium point in going to $147/bbl, and then overshot again going down to $40/bbl the next year. Then it went back up and seems to have stabilized around the $100/bbl price point for Brent for quite a long time. It's $102.35 today.
2008 was complicated by the fact that the US suffered from the bursting of the subprime mortgage bubble, which severely damaged the US and European banking systems. I was caught by surprise by that because I didn't know the US had screwed up its banking regulations so badly. The Canadian banks were under tighter government control and didn't participate in the bubble or the bursting thereof.
A number of other countries did not suffer as badly as the US and the EU, and continue to increase their oil consumption in the face of higher oil prices. I'm referring to China, India, Brazil, and the OPEC oil consumers of their own oil. I think they will continue to maintain their consumption even if prices go quite a bit higher, and the US and EU will suffer most from it.
I am slowly moving towards the possition that oil supply will stay flat for quite a while, before they finally begin going down. But on the road tothere, more and more people will be compeeting for it, and due to that, the economy will get worse and worse. IE, we get poorer at the individual/family/corporation/state levels.
When it finally starts going down, it will not be becuse we are out of high volume low quality expensive to produce oil, but because society is to damaged to keep up an economy to afford the stuff. In this scenario, it is almost impossible to predict when the decline will set in, and how fast it goes down. Only sure thing is, down it will.
You also need to factor in climate change. At some point it will begin to hurt society badly. We are already seeing it accelerate. I now belong to the crowd who worries more about CC than PO, even though there is no doubt PO is causing us a lot of trouble already, and the two worsen each other.
These opinions re due to revision at any point, as I am still working on the model.
An alternative model:
eh = extra heavy oil from oil sands and Orinoco belt, pg = refinery processing gains, other is other liquids that are not c+c+ngl such as biofuels, coal to liquids, gas to liquids, and blending components, c+c is crude plus condensate, ngl =natural gas liquids. Fuels such as ngl(75 %), ethanol (57 %), and biodiesel (88 %) are discounted by the levels in parentheses due to their lower energy content per barrel relative to crude oil to get a “barrel of oil equivalent”.
The extraction rate profile is below and thanks to WebHubbleTelescope for producing The Oil Conundrum upon which this analysis is based (Generalized Shock Model fallow=6 years, build= 8 years, maturation= 10 years) also note that extraction rate is similar to depletion rate, it is the % of mature reserves (oil that has infrastucture in place to enable production) that is produced in a given year:
I recently produced the following highly optimistic scenario to see how far the plateau might be maintained under ideal conditions (which are unlikely .)
This scenario attempts to avoid the likelihood of underestimating future oil output and is intended to present an upper bound on future liquid fuel output. It assumes there will be no oil shale output from the Green River kerogen deposit in the western US and that oil prices will remain high enough($100 to $120 per barrel in 2012 $) to prompt oil companies to produce the large extra heavy oil deposits(or bitumen) in Canada (255 Gb at 15 % recovery) and Venezuela(165 Gb at 15 % recovery) and continue pursue deep water projects and Arctic oil. (Note that Venezuela assumes 20 % recovery from the Orinoco resource and that Canada assumes 10 % recovery from the oil sands resource, I have assumed that each will achieve 15 % recovery to model extra heavy oil production.)
It further assumes that natural gas peaks in 2038 at 157 trillion cubic feet(tcf) per year (URR= 16500 tcf based on Steve Mohr’s middle case for natural gas) and that the world rate of ngl per cu ft of natural gas increases to the US level by 2040 (this is another optimistic assumption). It also assumes that biofuels, coal to liquids, or gas to liquids (or some combination of these three) can increase from 640 mboe/a (million barrels of oil equivalent per year) in 2011 to 1200 mboe/a in 2030 while refinery processing gains worldwide approach US levels over this period.
The issue is likely to be a lack of demand as high oil prices may reduce the growth rate of world income eventually leading to a recession (on a worldwide basis I don't think we are in a recession yet). See the IMF World outlook (2011 World GDP Growth 3.9 %) http://www.imf.org/external/pubs/ft/weo/2012/01/index.htm In addition, the world may begin to take climate change more seriously which could curtail demand for oil due to public policy (it would make more sense to focus on reducing coal, oil, and natural gas in that order because carbon dioxide per unit energy decreases as we move from solid towards gaseous fossil fuels.) Another potential problem is that natural gas prices may increase to a point that production of steam for in situ oil sands and extra heavy oil may be too expensive and make extra heavy oil unprofitable. Based on conversations I have had with RockyMountainGuy, natural gas would need to rise to twice the price of liquid fuel on an $/unit energy basis if current liquid fuel prices are maintained so that production from oil sands are not threatened by this prospect (it is unlikely that natural gas will even rise to that level, about $32/ GJ of natural gas in 2012 $.)
Excel and Open Document spreadsheets "worldoil plateau" at:
https://sites.google.com/site/dc78image/files-1
Steve Mohr’s Thesis summary can be found at: http://www.theoildrum.com/node/6783 then follow links for full thesis
DC
Charles Hall has tar sands EROI at 2-4; see table 2 in this article. (table 2) (pdf)
After chasing the links in your reference back through several levels of footnotes and references, I find it links back to the Oildrum:
Unconventional Oil: Tar Sands and Shale Oil - EROI on the Web, Part 3 of 6
Not at all what you quoted, but what I would consider reasonable average value for 2006. Oil sands producers are continuing to improve the technology so it is slowly but steadily improving.
The experimental THAI process which was being promoted at that time appears to have died a quiet death, though.
Good.
A Canadian oil patch guy I talked to three or four years ago said that, in his opinion, the THAI business plan was to use the THAI process to pump the company's stock price up, and then use the pumped up stock as capital to buy proven reserves from other companies and/or to buy other companies outright.
That's probably correct, and a classic strategy. Pump the stock up, and then use it to buy reserves and other companies that have some real oil reserves. Petrobank's stock is down to about $10 from a high of about $60 in 2008, so it didn't have a lot of long term benefit.
Actually an increase in the price of a companies stock increases the market value of a company, and increases the stockholders equity, but does not mean the company has more working capital to buy anything with. To get more money hey would have to sell stock held by the company, if they had any, or issue new stock which would require SEC approval.
Ron P.
They can acquire another company without selling stock by paying in shares rather than cash. They wouldn't require SEC approval because it's a Canadian company. Of course, it requires Canadian regulatory approval, but that's more or less automatic if it's another Canadian company. It's all up to the shareholders.
There is a contradiction here, a serious one. As Rocky Mountain Guy points out, the laws of supply and demand haven't been repealed. What is needed is the concept of the equilibrium price, that which is necessary to balance supply and demand.
In recent years, supply has been roughly stable (with only a very minor increase), despite massive price rises. This is because of depletion of oil which is cheap to produce and its replacement by oil which is expensive to produce. Basically, in order to make oil sands and deepwater drilling economic, purchasers need to bid at a higher price. The lucky producers which can continue to get oil the old fashioned way, from wells on dry land and using their own pressure, get a windfall, since the market price is not dictated by the average cost of production, but by the cost of the most expensive oil it is economical to produce. The fact that the price of oil hasn't moved massively in the last year or two demonstrates that, at the moment, the equilibrium price for Brent is $US90/barrel, give or take $15. It is at this point that the upward pressure from increasing costs balances the downward pressure from demand destruction.
Now, as production of old-fashioned cheap oil is gradually replaced by new expensive oil, at some point the equilibrium price will increase. This, in my opinion, is likely to be when production of deepwater oil plateaus in a couple of years*. Will this cause demand destruction? Yes. It will cause enough demand destruction to bring demand back within the limits of available supply. It will not, however, reduce the equilibrium price. It will merely prevent that price going through the stratosphere immediately.
Another fact that needs to be kept in mind is that high oil prices affect the US economy much more than developing countries like China, India, Brazil and South Africa. It's simple to measure this, by looking at the per capita use of oil. This means that some of the rapidly developing countries will out-bid the US and, to an extent, Europe for oil that is produced. Westexas writes consistently on his favoured theme of Avaliable Net Exports, which is underlaid by this phenomenon. As a general rule, it can be said that the lower the per capita oil consumption of a country is, the less affected it will be economically by the increasing price of oil. We can then foresee the possibility of China, India and other similar places continuing to grow and import increasing amounts of oil at the same time as the US and Europe endure economic damage from their higher oil intensity.
Finally, while oil is the most valuable fuel known to humanity, because it is portable, can be used in moving machinery, is usable at both large and small scale and has a very high energy density per unit volume, it is not the only fuel. As it gets more expensive, other forms of fuel will become more economic. At some point, renewable energy will become economic for supplying the transport needs of society. It is likely that we will have a smaller energy budget per capita than industrialised countries now have, but that doesn't mean the end of civilisation. It just means we have to be intelligent about how we spend our allowance.
* The watering out of Ghawar, although it is something I deeply desire, is likely to follow, rather than precede, the peak of deepwater oil production.
Okay, let's try again. As prices rise, demand will drop, causing prices then to drop in response the lower demand. Is that better?
No that is not the case at all. The chart below is net imports plus production of all OECD countries. (12 month running average.) The data is from the EIA International Energy Statistics. Net imports plus production gives you the basic consumption numbers for all OECD nations.
12 month running average of Imports plus Production of all OECD nations in kb/d. Last data point is Feb. 2012
Consumption is in the 34 OECD nations has dropped by about 6,500,00 barrels per day, or 15 percent, since 2005 because of high prices and the recession those high prices brought on.
Though world production has been relatively flat since 2005, that is because exporting nations, especially in OPEC, have dramatically increased their domestic consumption due to domestic subsidies. That is because of the Export Land Model. Check it out. Also China and India have increased their consumption as well.
Ron P.
Ron – Excellent point and chart. The relationship between consumption, economic activity and oil prices is all the more obvious when oil prices overlay your chart.
Your chart emphasizes the MADOR concept I harp about from time to time. As you show GLOBAL consumption has fallen. But that reduction hasn’t been spread evenly among the consumers. Due to increasing prices the consumption pie has gotten smaller. But how is that pie being divided today compared to previous decreases in consumption? Once again: a shortage is only a problem to those who don’t get their piece of the pie. If you get a big piece there is no shortage…for you. And that’s what really important, isn’t it.
There are a lot of layers to our enegy onion. Enough to make one tear up.
No it doesn't help. You're assuming that the demand curve will shift to the left because of higher prices. However, that is already factored into the demand curve. Remember, we're dealing with a curve, not a fixed demand.
What happened was that, due to changes in the market (Peak Oil), the SUPPLY curve shifted to the left. With the same demand curve, a new equilibrium point is established at a lower demand and a higher price.
The 2008/2009 economic mess confused the issue because, due to lags in the market, the price overshot the equilibrium point a couple of times, once going up, and once going down. I think we're back to the equilibrium point at the current time.
It's actually even more complicated because of the growing economies and middle classes of China + India + OPEC. The DEMAND curve shifted to the right at the same time as the supply curve shifted to the left. The result was that a new equilibrium point was established in which supply and demand were more or less the same (the "undulating plateau"), but the price was much higher.
Your graph merely illustrates that China + India + OPEC backed the consumers in OECD countries out of the market by outbidding them for oil (or subsidizing their own oil to their own consumers).
We're kind of getting into Economics 201 here. You need about a year of university economics to understand it.
Ron and RockyMountainGuy,
As RMG said, and I agree,
World Supply has been flat since 2005, expensive oil is being consumed by those who can afford it, OECD countries need to become more efficient in their use of liquid fuels (and fossil fuel energy in general).
I believe that Ron said that higher prices will reduce demand and I think he meant (quantity demanded, moving left along the demand curve), but I also think he forsees a collapse in aggregate demand(recession), which would lead to a shift in the demand curve as well. His argument is that oil prices will not rise by much due to these effects and I believe that is correct up to a point. As economies adjust to higher oil prices, and become more efficient in their use of liquid fuels, there may be room for prices to rise gradually, if oil prices cannot rise (because these efficiency improvements have physical limits) a lot of oil that is too expensive to produce will not be extracted and the quantity of oil supplied will drop very quickly at that point (between 2035 and 2040 under a very optimistic scenario, where there is no worldwide depression from now until then.)
DC
Apparently you are not familiar with the Export Land Model either. The lions share of the decline in OECD consumption is due to declining world exports and the rise in prices that this caused and the recession that this caused.
The supply of oil declined and prices rose in response. It is that simple.
Ron P.
No, we are not dealing with curves or fixed demand. Of course it can be expressed as a curve there is no real need to do so. It is so simple. Unless you are talking about something like insulin, where demand is fixed over a very wide price range, price always affects demand. We are dealing with supply and demand where price is the arbitrator. Economics 101, not 201.
When prices go up demand goes down. The economy is affected, a recession ensues. Prices are still high, in fact they are still very high and the economy is still sick.
No, declining net exports (Export Land Model) had an even greater effect than the increase in consumption by China and India. But even that misses the point. The decline in OECD consumption can be tied directly to the rise in the price of oil and the ensuing recession. Remember your economics 101, as prices rise, demand falls.
Ron P.
No it is not that simple. We are dealing with supply and demand curves, and dealing with time-dependent shifts in those curves. As I say, its getting into Econ 201 rather than Econ 101.
You're interpreting it as if the world was limited to the US. You can't assume everyone is in the same boat as you. YOUR economy is sick. MY economy is doing okay, and the Chinese economy is similarly doing rather well. The problem for the US is those countries which are not in the same boat, because they have less price sensitivity than the US. An oil price increase will not put them into recession.
The US and EU, as I say, messed up their banking, money, and financial systems, and a lot of the fallout comes from that. Other countries did not mess up their policies and as a result are doing much better. Canada had a short little recession, China had none at all.
That's why I added "+ OPEC" to the list - I factored the ELM into the demand curve. The ELM shifts the demand curve to the right, which again is a problem for the US and EU. The OPEC consumers are much less responsive to higher prices because they don't have to pay them. The Chinese economy is more robust and can afford the higher prices.
Canadian consumers are just buying much more fuel efficient cars, which one would think would be the rational approach to the problem. A lot of the cars being bought already meet 2016 fuel economy standards. With the astronomical new fuel taxes in Vancouver, people are just taking the fast and efficient SkyTrain. Don't you wish you had a SkyTrain?
The chart I posted includes all OECD countries, including Canada. It includes about 75% of the oil consumed by all importing nations. Don't get hung up on this Canada, USA thing. This has nothing to do with that. But Canada, as far as oil consumption goes, is doing exactly what the rest of OECD nations are doing.
Canada Production less Exports 12 month running average in kb/d. The last data point is February 2012. All data is from the EIA. The production data is Crude + Condensate.
In fact Canada is doing even worse than the rest of OECD, on average. Average OECD decline is 15% since 2006. Canada has declined 18.9% over the same period. Of course you will say that is because they are buying more efficient cars. And the rest of OECD cannot make the same argument?
       Jan-06		1376
       Feb-12		1116
Consumption decline	-260 kb/d
Percentage decline	 -18.90%
No, nothing affect consumption that much, that fast, except higher prices and the state of the economy. Better efficiency, for everyone, is part of it but only a very small part of it.
Ron P.
You're misinterpreting the statistics. All they mean is that Canadians find it more economically efficient to export their very expensive oil to the US than use it themselves. They are substituting cheaper sources of energy for oil - these would include hydroelectric power, natural gas, nuclear power, wind power, coal, etc. Canada is awash in vast amounts of energy resources, and oil is among the most expensive of those.
Canadians are also making major advances in energy efficiency by doing thing such as, as you said, buying more fuel efficient cars. A lot of the newer cars being sold meet the 2016 fuel economy standards, and are more powerful and less expensive to boot.
It's amazing what the car makers can do when you hold the hot irons to their feet. Nowadays, you can buy a BMW sports coup that gets 50 mpg and goes from 0-100 km/h (62 mph) in 10 seconds, but costs $24,000. Unfortunately, you can't get it in North America yet.
Canadian oil consumption is no higher than it was in the 1970's. All that means is that Canadians are using oil more efficiently - like the 50 mpg BMW. It has nothing to do with the state of the economy.
I wasn't going to post this today, but I guess I have to now:
Canadians, on Average, Now Richer Than Americans
This is correct, but it says nothing about the extent of the effect. If a rising price causes demand to fall to the extent that the price falls back to where it was, it is the same as saying that the original price is the equilibrium price. Rocky Mountain Guy & I are saying that some things can drive the equilibrium price upwards. These things could be:
(a) Higher costs of production;
(b) Rapid economic growth in Third World countries; and/or
(c) Higher national income in OPEC countries.
In these circumstances, if we have a relatively static global oil production, the factors I have mentioned will drive the equilibrium price upwards. The increase in price will destroy sufficient demand to bring it back within the limits of available supply. Of course, most of this demand destruction will be in OECD countries, but this is a distributional question, not an aggregate one. This might be one of the sources of the disagreement between Darwinian and myself - he is looking at the US (or, at most, the OECD), while I am looking at the world.
For the sake of completeness, I will point out that the subsidisation of oil in OPEC countries is a mind-bogglingly stupid policy. This can be seen by looking at the situation of Indonesia. This is a country which started subsidising oil products years ago when it was an exporter and a member of OPEC in good standing. Since 2003, though, Indonesia has been a net importer, but with an oil consumption pattern based on very low prices hard-coded into its economy. This has been a real drag on the Indonesian economy. If oil had been sold on the domestic market at the world price, with the money going into keeping taxes low, providing social benefits or building economic infrastructure, Indonesia would be in a much better economic situation today. And this will be the case with every oil exporting country as its production falls and domestic consumption rises. They are embedding wasteful oil consumption patterns into the economy, patterns which will cause much suffering when net exports turn to net imports. If the people of Arabia have to return to riding camels, they won't be happy and I don't think the House of Saud will be on the throne for long.
I get gobsmacked again and again. Yet I still hop into my car and go to work along with everyone else. I know there's nothing we can do to stave off the moment where suddenly the wells are all spewing "oil-stained brine" so that will have to be the World's wake-up call - total withdrawal from Oil. And like the fabled withdrawal agony a heroin addict experiences, so shall we (or our Children).
It makes me sad, imagining the disillusionment that will surely be on my two little girls' faces as they face the reality that what happened was practically a global suicide as they realize that their father (me) won't be able to do a damn thing about it.
It'll be like *poof* all over the World, then it's curtains.
Just to clarify, if we look at the total estimated volume of crude oil ever consumed, through 2011, about 23% of that volume was consumed in just the 10 year period ending in 2011:
Yes I suspect we will see a shark fin production graph. Most expect a linear decline rate with the shark fin resulting from declining EROEI.
But if you have a shark fin decline rate and declining EROEI? That hurts just to think about it.
But wait... we will have a shark fin decline rate, a steeper shark fin caused by declining EROEI, and on top of all that we have declining net exports due to domestic consumption. Three declines stacked on top of each other.
Also note that even if domestic consumption does not increase but stays steady, you still have an accelerated decline rate. Example: If a country produces 10 mb/d and consumes half that amount then they export 5 mb/d. But if production drops by 10% to 9 mb/d and they only continue to consume the same amount, 5 mb/d, then exports will have dropped by 20%, not just the 10% that production dropped.
Ron P.
Darwinian - those curves seem to have us going from an EROEI of about 10 now to 1.1 in 2035. I think Charles Hall's example is that at 1.1 you can get the oil out the ground, put it in a tank and look at it, nothing more. I've never seen anything to indicate that it will fall that fast, if it does it's game over in about 12 years when we get to EROI of 2 or 3, certainly for the oil industry, and maybe for civilization as we know it if you're feeling doomsterish. Is there an original article which gives the assumptions used to generate these curves because they don't quite ring true to me? For example some of the tarsands projects being developed now, which tend to have longer life cycles that conventional oil, will still be producing in 2035 and at worst they seem to get about 3 or 5 and, based on operation alone, i.e. after ignoring sunk energy costs for the original development, would be on the higher side.
Yes, it can be found here: The Oil Drum: Net Energy
Game over in 12 years? We should be so lucky.
Ron P.
You envision it happening well before 2024?
We are all just guessing here of course. But my guess would be yes. Most peak oilers expect the decline to take decades. And they don't expect total collapse to come until late in this century, if then. And they are basing this, mostly, on the speed that it took civilizations in the past to collapse, like the Roman Empire or even the Mayan civilization that took about 100 years to totally collapse. But those civilizations were agrarian civilizations where most people lived off the land before as well as after the collapse.
But that can't happen today. All those trades are lost. Only a tiny fraction of the population would be able to return to the land today. If the grid went down today, and stayed down, the chaos, death and anarchy would take less than one year to wipe out nine tenths of the population.
I cannot predict the future. And I am glad. If I could I think it would be more than I could bear.
Ron P.
A – Not that EROEI and ROR are independent of each other but as pointed out before drilling decisions never have and never will be determined by EROEI. I don’t really know how to relate the two numerically. Is an EROEI of 3 equal to a ROR of 12%? Of course, the ROR of that project will vary with the drilling cost and the value of the produced reserves. Same amount of energy used and produced but price variations change from a 12% ROR to a 5% ROR and the prospect doesn’t get drilled. As already pointed out my private company doesn’t drill the shale plays due to insufficient ROR. OTOH pubic companies like Chesapeake can’t drill them fast enough. So Prospect A has an EROEI of X and one company can justify drilling it and another can’t.
Now more complexity: Chesapeake wants to drill Prospect A regardless of a low EROEI/ROR (in order to add reserve base to keep Wall Street happy) but lacks sufficient capex to do so. Last report from CHK they were at least $15 billon short to finish their current drilling program. So even though they have their reasons to drill wells others companies can’t justify they can’t. And if they lose market confidence and can’t raise the capex to keep their program going? And if oil prices slide a bit lower and more companies follow them? EROEI of the prospects hasn’t changed. But not only has the economic incentive to do so dropped but also the financial capability.
Could it happen? The EROEI of the east Texas dry NG shale play hasn’t changed. Yet that drilling activity is but a shadow of its former self. The tar sands certainly seem viable even if oil prices slide some more. But what happens over time if NG prices increase 3X or 4X? The EROEI won’t change but economic value of such projects will fall. Would tar sand production increase...stay flat…decrease? At one time a tar sand EROEI of 6 could mean heavy development. And at another time perhaps not so much.
IMHO trying to predict future resource development by EROEI seems so weak as to be of limited value. Of course, projecting future development based upon possible ROR, future capex supplies, the vagueness of the future stock market along with geology and political theater ain’t a walk in the park either.
Rock,
I suspect EROEI will set a floor under the prospect ROR, as a reducing value as EROEI drops. In the NG world when selling gas we deal with heating value (energy) rather than flow rate alone. For lower EROEI sources, it's going to cost more to get the same number of BTUs back out, so to hit the ROR target will require ever-higher prices.
I think it's clear to most that the shape of a production curve is a function of price, and the unclear part is whether Hubbert's curve is the real-world result of decline, depletion, and reducing quality of replacements in a larger economy. We all talk a lot about the decline side, but what of the historical rising side? Why wasn't it a step function to an earlier plateau, or an narrow impulse spike to infinity and back to zero?
Obviously, the up-slope was a conglomeration of economic factors (how fast the economy could grow given available energy), technology (which is itself a time function of investment), available capital and manpower, exploration logistics, and all sorts of other interlocking factors. The result of all has been a fairly gentle growth rate of production.
The downslide will likely be a reductionist variant of the same process. Obviously the shape will be a function of price. Where will be the point of highest price? Just after the peak, where a screaming world economy this the wall? Halfway down, after a slowing economy shifts to a split of dying societies and other growing ones that feed on them? 9/10ths down, when a small oligopoly can buy what they want, while others struggle to live? 99.9% where oil is used only for esoteric luxuries?
As Darwinian mentioned, we could have a shark fin for EROEI, for depletion, and for Westexas' export model -- but all of those presume a cost curve to generate that function.
Me, I'm in the camp that says our current EROEI will enable us to slam into the wall at high velocity, and prices will go a good bit higher (maybe $500 per barrel?), but in wide oscillations spanning years per cycle, before the technology growth machine grinds to a halt. That buys us time for substitution, and the ever-present option to substitute by doing without.
EROEI will set a floor for substitution to solar or other technologies. The cost point of those technologies would then set the long-term limit for oil price. The dynamics required to get to there will be the interesting part.
Paleo – Let’s try a very simple model to set the basics. East Texas dry shale gas prospect has an EROEI of 4. When NG is selling for $10/mcf the ROR is 18% and I drill it. When NG prices fall to $2.20/mcf the ROR is 2% and I don’t drill it.
So what set the floor with respect to drilling this well: EROEI or NG prices? This is a theoretical model. In the last few months I cancelled $60 million of my company’s NG projects. The EROEI of those projects, whatever they actually are, didn’t change. But lower NG prices reduced their estimated ROR to levels not acceptable to my owner. Every operator that completes with me has reduced their drilling budgets for the same reason. Companies drilling on the shelf in the GOM significantly cut back their program when we did, about 18 months ago, when NG gel too low to justify the high cost of offshore ops. Just my WAG but I would say many $billion of NG projects have been cancelled because of prices. OTOH I’m about to risk $20 million testing my idea for a horizontal EOR project. The EROEI of my project hasn’t changed from when I generated the idea in the late 90’s.
No one bought the idea then because oil was in the low $20’s. But now my owner will throw the money at these projects that still have the same EROEI as they did 15 years ago. Except now I estimate ROR using $90 oil. Prices set the floor on this project then and now. Not EROEI.
I’m not projecting what will set the floor on resource development in the future but what has happened in the last couple of years. Decreasing EROEI hasn’t killed those NG projects…inadequate ROR due to falling prices has. Now maybe in the future the dynamics will be more impacted by other factors such as EROEI or geopolitics. But they haven’t in the past nor are they today IMHO. Decreasing EROEI over the decades is a metric…not a controlling factor. If it were the hundreds of rigs that had been drilling the dry shales would still be digging today IMHO.
They are not just horizontal wells, they are multilateral horizontal wells drilled into the "sweet spots" of the reservoir, with the ability to analyze production in individual legs and shut in those legs with excessive water production. This means if one leg waters out, they just shut it in and produce from the remaining legs.
This has the advantage that as long as they can drill new multilateral wells and add legs to old ones faster than the old ones lose legs, they can maintain high oil production rates by increasing water injection rates, despite the fact the reservoir is mostly full of water and the oil column is becoming thinner and thinner.
The problem from our perspective is that the final decline, when it comes, will be much faster than it otherwise would be. The wells don't decline like conventional wells. We won't see any increase in the water cut until they run out of places to drill new legs, and the remaining legs will water out very fast because the water level is already very close to them.
Re: Saudi Net Oil Exports--Observed Net Export Decline Rates Vs. Post-2005 Estimated CNE Depletion Rates
The following graph shows the ECI ratio (ratio of domestic total petroleum liquids production to liquids consumption, BP) for Saudi Arabia, from 2002 to 2011:
http://i1095.photobucket.com/albums/i475/westexas/SaudiECI.jpg
The observed 2005 to 2008 net export decline rate was 2.7%/year. Saudi net exports in 2008 were 8.4 mbpd, at an annual Brent price of $97, versus 9.1 mbpd in 2005, at an annual Brent price of $55.
The 2005 to 2008 rate of decline in the ECI ratio (6.5%/year), suggested that Saudi Arabia would approach zero net oil exports around 2032, with estimated post-2005 CNE (Cumulative Net Exports) of about 41 Gb. I estimate that the 2005 to 2008 post-2005 Saudi CNE depletion rate was about 8%/year.
The observed 2005 to 2011 net export decline rate slowed to 1.5%/year. Saudi net exports in 2011 were 8.3 mbpd, at an annual Brent price of $111, versus 9.1 mbpd in 2005, at an annual Brent price of $55.
The extrapolation on the preceding Saudi graph is based on extrapolating the 2005 to 2011 decline in the Saudi ECI ratio. The 2005 to 2011 rate of decline in the ECI ratio (6.0%/year), suggested that Saudi Arabia would approach zero net oil exports around 2034, with estimated post-2005 CNE of about 45 Gb. I estimate that the 2005 to 2011 post-2005 Saudi CNE depletion rate was about 8%/year.
Using the Rule of 72, these two extrapolations both suggest that by the end of 2014 (one-third of the way into the projected net export decline period), Saudi Arabia may have already shipped about half of the total cumulative supply of post-2005 Saudi net oil exports.
A 50% depletion level, after 9 years, is consistent with the "One-Third" rule, to-wit, about one-third of the way into a net export decline period, as a general rule about half of post-peak CNE have already been shipped.
IUKE + VAM Case History
For example, the six countries in the IUKE + VAM* data set showed a combined "Undulating" production plateau, starting in 1995, and they hit combined zero net oil exports 13 years later, in 2008. By the end of 1999 (31% of the way into the net export decline period), they had already shipped 53% of post-1995 CNE.
Estimated post-1995 Cumulative Net Exports (CNE), using the initial six year rate of decline in the ECI ratio, were 9.2 Gb (billion barrels). Actual post-1995 CNE were 7.3 Gb.
In other words, the actual net export decline was faster than what the initial six year projection predicted.
*Indonesia, UK, Egypt, Vietnam, Argentina & Malaysia
Saudi Aramco has stated that it designs the well layouts and extraction patterns from its oil fields so that they effectively decline at a rate of 2% per year.* If one divides 100 by 2 it yields 50. If one subtracts 50 from 2012, one gets the year 1962. Even for those with poor math skills, these are not difficult operations, and they lead to the conclusion that those fields which came into production in the early 1960’s and earlier are now reaching the end of their productive lives
There was a time I was pretty fair at math but atrophy takes its toll.
However I do believe you have an egregious error in your simplification.
Is not the decline rate the percent decline since the previous years production? The formula would then be the reverse of calculating compound interest. Your simplification has the decline being essentially 2% of the peak production year until the field is dry (you did allow the qualification that how long it takes a field to achieve peak production was something that was not included in the simplification) . If my understanding of decline rate is correct-and I'm pretty sure it is--that is not at all the case.
Once a field begins its decline if the decline rate is held to 2% per year each year the drop in barrels per day produced each year is less than the drop the year before so that when the decline had brought the field to 50% of its peak production year (which will take substantially more than 25 years at a 2% decline rate) the absolute decline in barrels per day will actually be 1% of the peak year's production.
Theoretically holding the decline rate to 2% a year would allow a field to produce into almost infinity. There would be a theoretical physical limit to how long the 2% rate could possibly hold as once the field was down to under 50 molecules of petroleum a 2% decline rate would be impossible to maintain as the loss of a single molecule of production in a year would exceed a 2% rate (I believe the actually theoretical limit of how long a 2% decline can be maintained when working with whole numbers kicks in quite a few molecules higher but like I said at the top atrophy has taken its toll when it comes to my formulating simple equations). Obviously the real physical limits allowing a field to produce with only 2% annual decline rate kick in much, much, much earlier in the depletion stage than when the last 50 molecules or so remain but that still doesn't change that the percent decline is from the previous year's production and not from the peak year's production
so while it is true using a 2% decline rate
gives you some perspective on the overall scope of the situation, without the need for complex mathematical modeling
using a straight line calculation by subtracting 2% of the peak year's production which is what happens
If one divides 100 by 2 it yields 50. If one subtracts 50 from 2012, one gets the year 1962
is flat the wrong way to go about it.
Actually if a field had a constant decline rate of 2% then after 35 years and 3 months it would be pumping at 50% its original flow rate. I did the math. However that is meaningless because decline rate and depletion rate are two entirely different things.
If decline rate and depletion rate were the same thing then if you could keep adding enough wells to get your decline rate down to zero, then the field would produce oil at that rate forever.
But they are obviously not the same thing, so how long they can keep pumping oil at a high flow rate depends entirely on the depletion rate. They may indeed keep pumping with a decline rate around 2 to 3% until the water hits those horizontal wells at the top of the reservoir. Then the decline rate will hit 100%, or pretty close to that.
Ron P.
Ron – maybe a simple model for folks who don’t grasp the significance of you explanation. A 10’ tank with 5’ of oil floating on 5’ of water. A hose in the bottom of the tank can continue to pump water in as the oil is produced from the top. In essence mimicking a water drive reservoir. A suction hose in the top 1” of the oil column pulls it out at a constant rate…mimicking a horizontal well. And 1 bbl of oil (2% of the oil volume) is withdrawn ever 24 hours. Virtually a zero decline rate. Thus a 2% depletion rate that produces 100% of the oil URR in 50 days. On the 51st day the decline rate goes from zero to 100%.
At the other extreme consider a perfectly sealed tank containing 100 cubic feet of NG at 114 psi. Open a valve and it releases a volume that’s proportional to the difference between the internal pressure (114 psi) and the external pressure (14 psi). Mimics a pure pressure depletion drive. The initial flow rate if high but immediately falls as the rate is proportional to the pressure differential. The flow goes to zero when the internal pressure reaches 14 psi. But the depletion rate is constant and very predictable: plot it on a long-normal chart and it’s a perfect straight line.
Of course real reservoirs don’t perform so perfectly. But the dynamics are the same. Just the magnitude varies.
Thanks for expanding on my major caveat
Obviously the real physical limits allowing a field to produce with only 2% annual decline rate kick in much, much, much earlier in the depletion stage than when the last 50 molecules or so remain
no argument with any of your points. What we can learn from the decline rate is how much increase in effort it takes hold a given decline rate, but, like you pointed out, it won't tell us how long those efforts will pay off.
Um, so now I have to find the quote on what the Saudi consider the 2% of - it may take me a little while, but consider that if it were last years production (which is what I think that you are saying that it is) and the Saudi's were holding that to 2% by adding wells, then their production would be going down each year. It isn't and so I have to find the exact quote on what it is. Sorry for the delay but it is a lovely day in Maine this afternoon.