| Tech Talk - Global Crude Oil and Iran | The Oil Drum | Tech Talk - The Quiet Steps of a Geothermal Movement |
The Big Deal About U.S. Energy Self-Sufficiency
Posted by aeberman on October 31, 2012 - 5:23pm
Mark J. Perry caused a minor sensation on October 22, 2012 when he posted a blog about record-breaking fossil fuel production in the United States. Perry is an economics professor at the University of Michigan at Flint and a visiting scholar at the American Enterprise Institute. His blog is titled as an economics and finance website but a great deal of content is about energy.
In "U.S. fossil fuel production will reach all-time high this year; America’s energy self-sufficiency will be highest since 1990" (http://www.aei-ideas.org/channel/carpe-diem/page/2/), Perry shows a stunning graph of U.S. fossil fuel production (coal, natural gas and crude oil) from 1975 to 2012 (Exhibit 1).
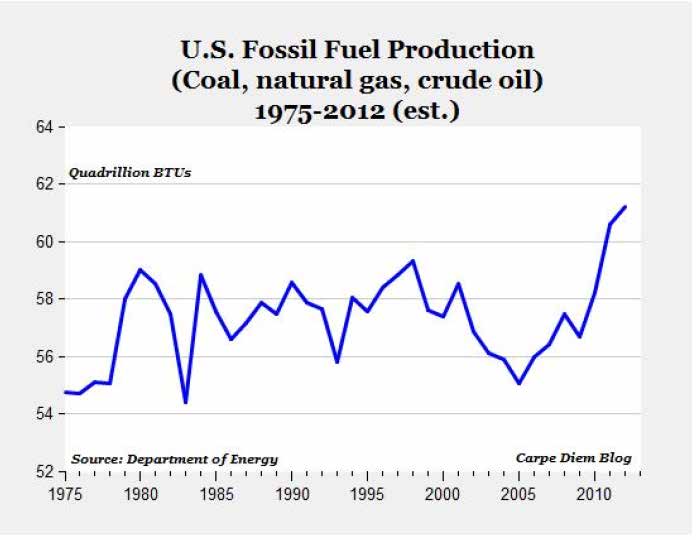
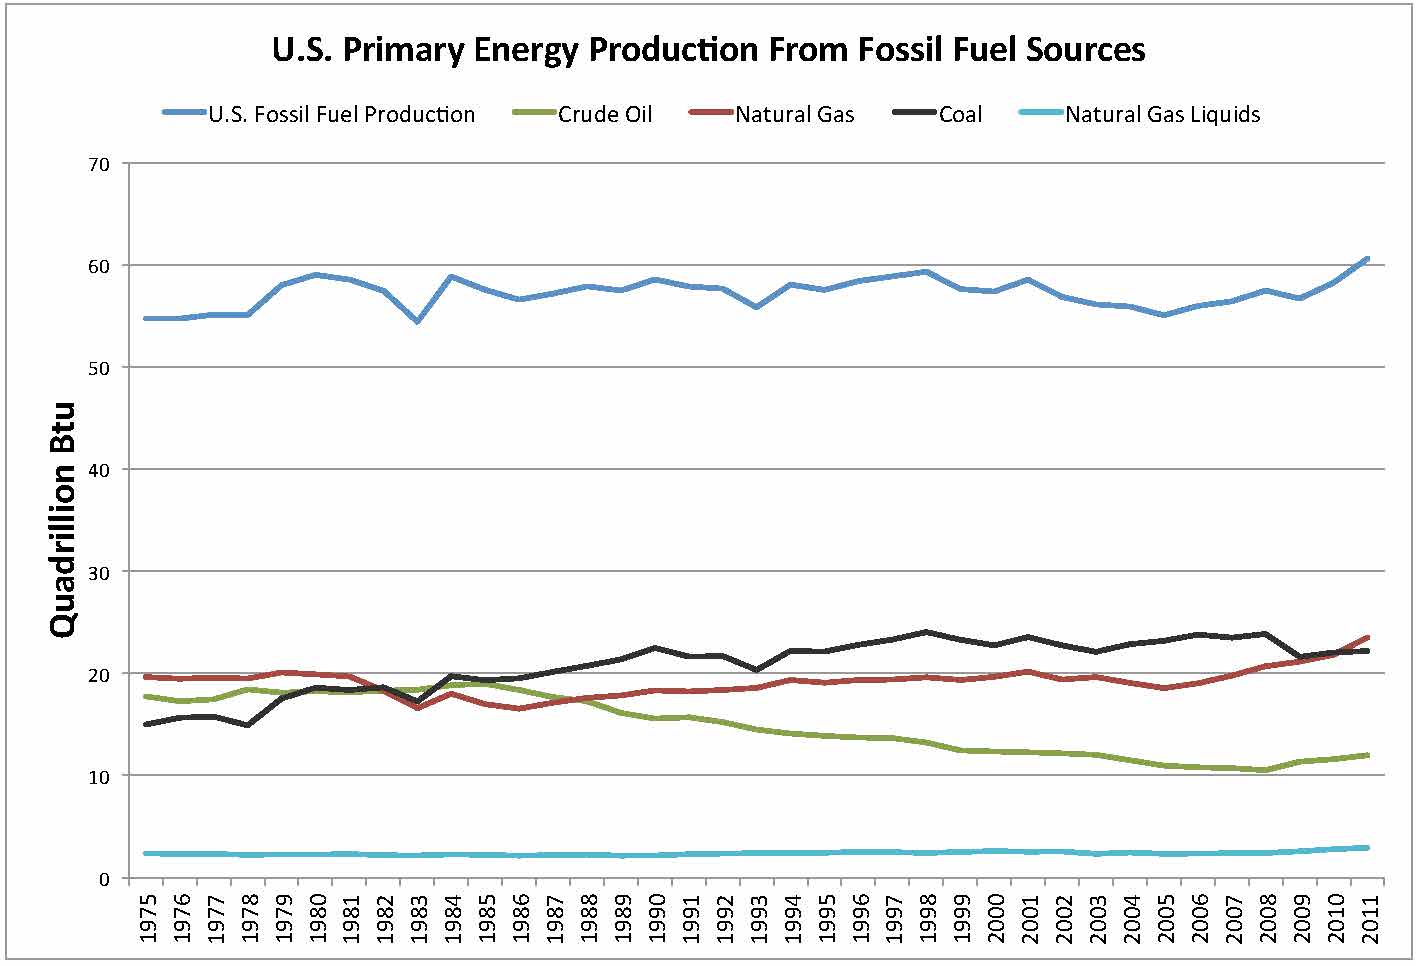
I was able to reproduce his graph using EIA data but I had to include natural gas plant liquids to make it match. When I plotted this data on a more conventional y-axis scale, the enormity of the anomaly shrinks to what it really is, namely an increase in overall fossil fuel production within a narrow range of fluctuation over three-and-a-half decades (Exhibit 2).
2011 fossil fuel energy production was 1.3 quadrillion British thermal units (Quads) higher than the previous peak in 1998 with 60.6 Quad in 2011 and 59.3 Quad in 1998. The EIA reports comparative energy production in Quads to normalize the various measures of its components: cubic feet for gas, barrels for crude oil and natural gas liquids (NGL), and short tons for coal. A Quad is a measure of the heat content of those energy sources when burned. Exhibit 3 shows how this conversion is made.

One Quad is approximately equal to 1 trillion cubic feet of gas, 180 million barrels of oil, 120 million barrels of NGL (about 65% of the thermal content of crude oil), and 36 million short tons of coal.
Exhibit 4 shows the various components of total fossil fuel energy at a scale appropriate to understanding which sources increased and decreased over the period of the graph.
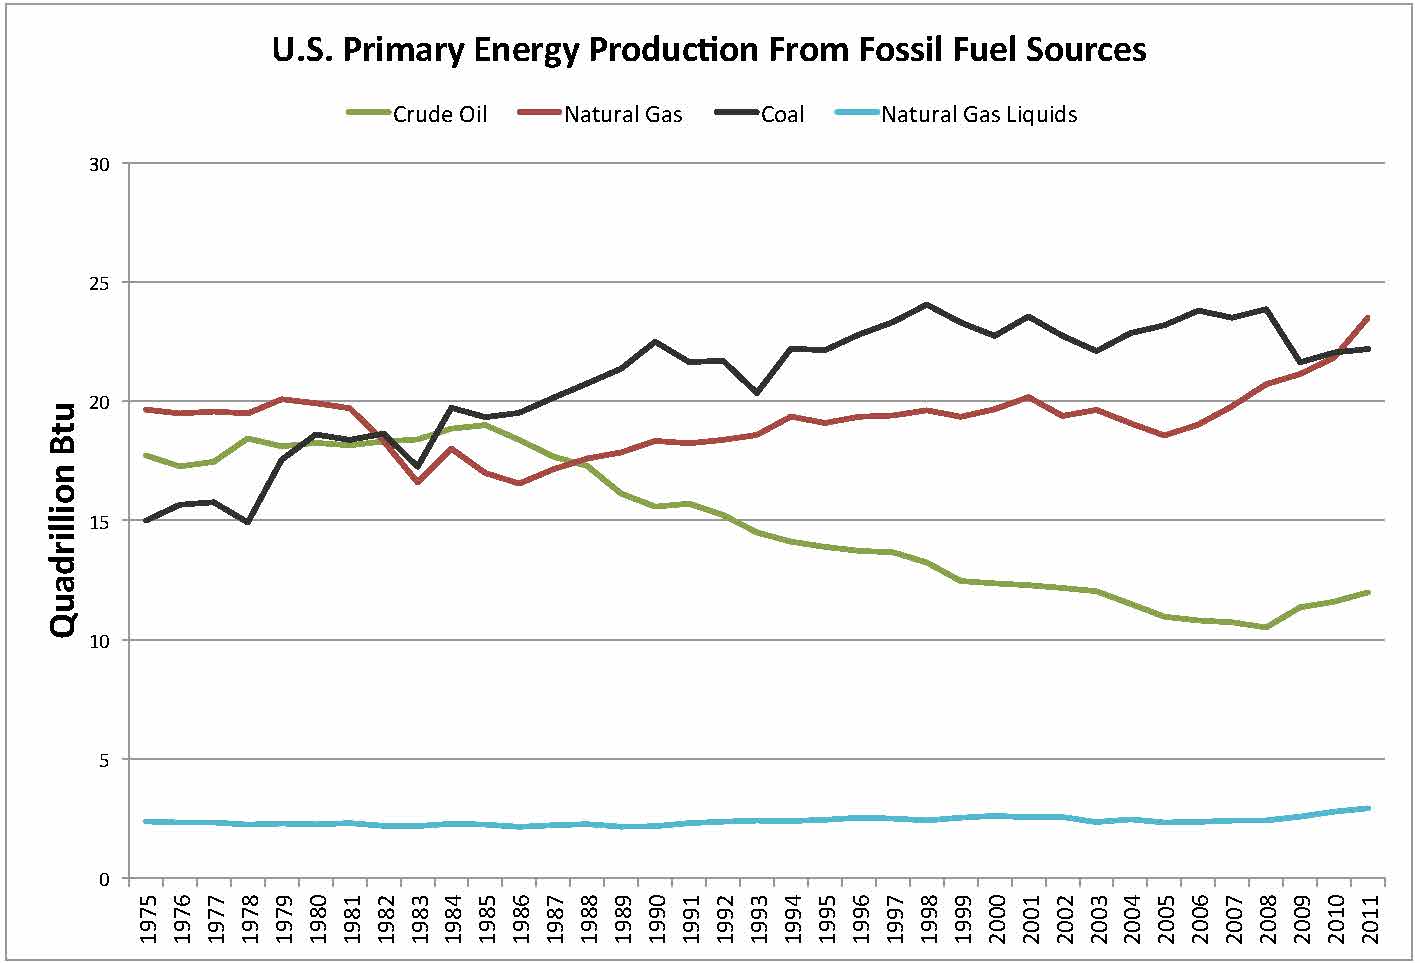
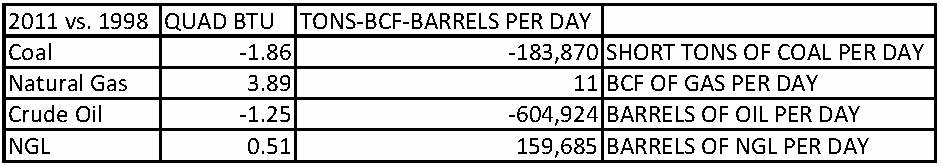
Comparing 1998 with 2011 production, coal decreased by about 184,000 tons per day, natural gas increased a whopping 11 billion cubic feet per day (bcf), crude oil decreased almost 605,000 barrels per day and NGLs increased approximately 160,000 barrels per day (Exhibit 5).
Dr. Perry celebrates the success of the shale revolution in his blog calling it "a big deal." He points out that the U.S. is closer to energy self-sufficiency than at any other time in the past 22 years. But the problem for the U.S. is not total energy. We have always had an abundant endowment of coal and natural gas. The problem is liquid fuel for transport and that comes from crude oil. The shale revolution in oil that he describes is notable and important but it only returns production to 2003 levels which were lower than at any time after 1951.
There is nothing untrue in Perry's blog but it, unfortunately, contributes to the distorted viewpoint that the U.S. will soon become energy independent and will no longer need to import foreign oil. The U.S. has used more oil than it produces since records were kept in 1920 but became a true net oil importing country after World War II (Exhibit 6).
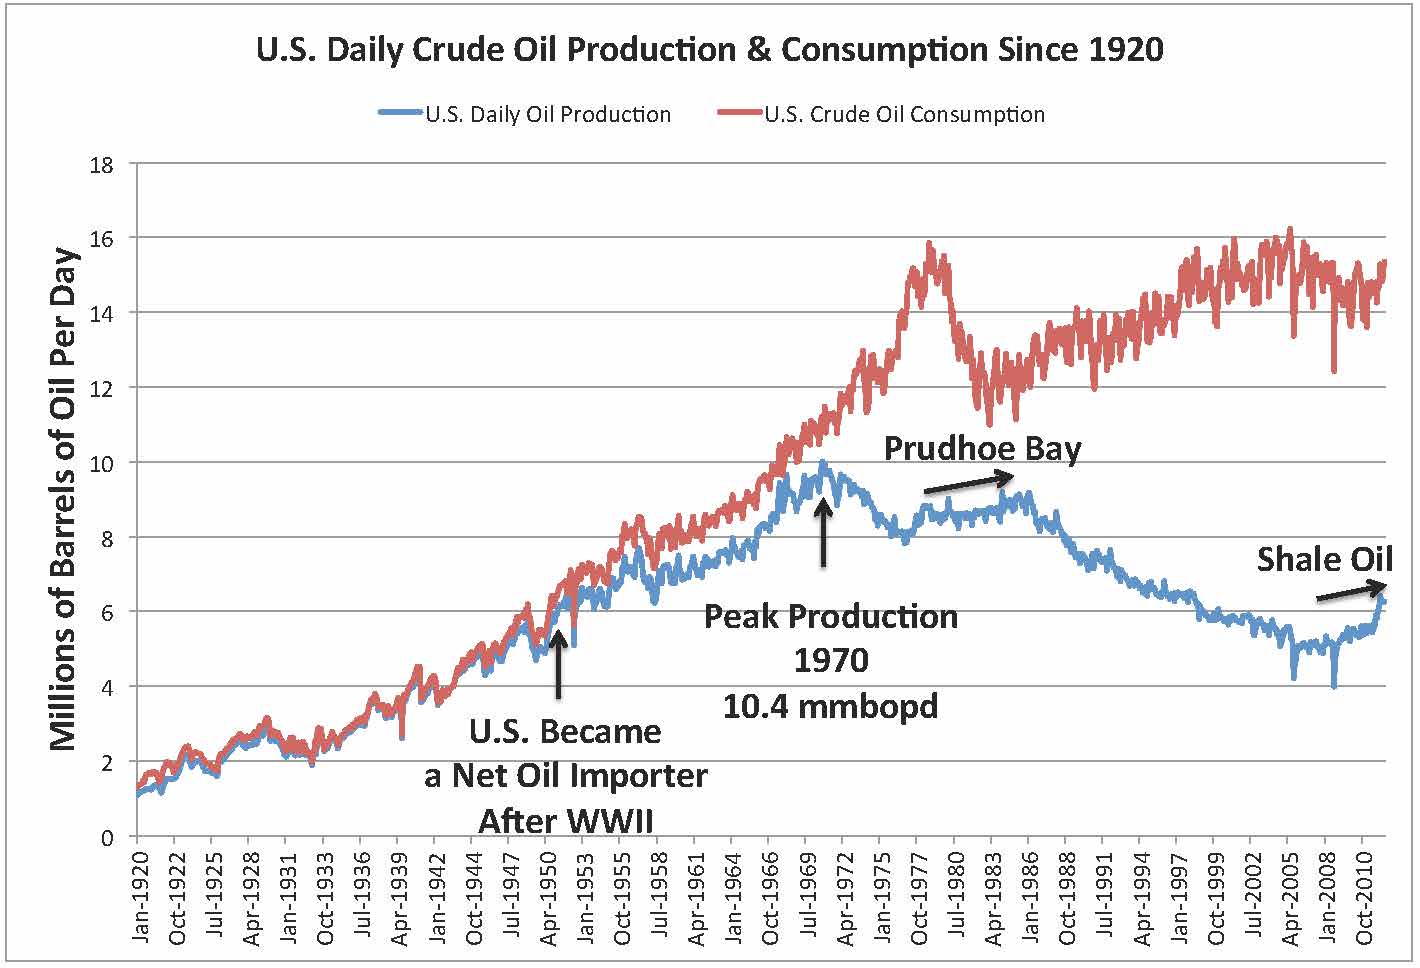
After production peaked in 1970, not even the discovery of Prudhoe Bay, the largest oil field in the U.S. (12.8 billion barrels produced to date), brought production back to the 1970 peak. Including the recent increase from shale oil, the gap between production and consumption is approximately 9 million barrels of oil per day, almost as much as 1970 peak production.
I am encouraged by the slight reversal in U.S. oil production but see no way that we will become oil independent. The star performer in total fossil fuel production is natural gas. While it is true that gas offers the possibility of replacing crude oil refined products as a transport fuel, this will be decades in the future (massive equipment changes and distribution infrastructure) and does not address the near- to medium-term problem of oil imports. Curiously, nowhere in his blog about economics and finance does Perry discuss the cost and profitability of shale gas or shale oil. Rather than write so much about energy, a subject outside of his training and experience, it would be useful if he wrote about the economics of the shale developments that he is so exuberant about. That would be a big deal.
Contact
- Content: editors at theoildrum dot com
- Tech support: support at theoildrum dot com
License

This work is licensed under a Creative Commons Attribution-Share Alike 3.0 United States License.
Nice summary, the current media push with the meme "the US is about to get energy independent" is truly amazing (when it is not plain lies as "now the US is a net exporter"), and not only in US media.
About :
" The U.S. has used more oil than it produces since records were kept in 1920 but became a true net oil importing country after World War II "
What does it truly mean ? And is exhibit 6 correct ?
I thought the US were a major oil exporter in the 1920ies, 30ies, 40ies, for instance :
"U.S. fields accounted for slightly more than 70 percent of world oil production in 1925, around 63 percent in 1941, and over 50 percent in 1950."
http://www.americanforeignrelations.com/O-W/Oil-Oil-and-world-power.html
In Europe in the 30ies for instance, most oil came from the US I think ?
How come this is not reflected in the graph ?
(but maybe separating data between oil majors production whatever the country and "countries" production for these periods isn't that easy).
Would be interesting to find this data, seriously doubt exhibit 6 is correct on the 1920 to 40 period.
A graph that I find quite interesting (from wikipedia) :

Especially as a reminder of to which point the US were the first producer and by a lot, in the 60ies, and the quick ramp up of KSA, Iran, former USSR in the 60ies.
Yves,
I think that you make an excellent point. The production and consumption data in Exhibit 6 comes from EIA as noted so, if incorrect, presents a problem with their reporting. Available EIA export data only goes back to 1981. It may be that U.S. refining capacity was higher than much of the rest of the world in mid-20th century and imported crude was subsequently exported as refined product.
Thanks for your comment.
Art
Art,
Indeed read in several places that the US was a major oil exporter in the first half of XXth century, so there might be a problem on this period regarding US domestic consumption/export ratio on fig 6. And also yes, the crude/refined product aspects.
Although there was also Romania, Baku at that time.
And what is also amazing is the rise in global prod on this period even if total numbers are lower ..
Cheers,
Yves
Spindletop, very early in the 20th Century, produced half the world's oil for a limited time.
One cause for the Japanese attack at Pearl Harbor was the US cutting off oil exports to them.
I think the USA only became a net oil importer in the 1950s.
Alan
The Annual Energy Review, from the EIA, has some more detailed information back to 1949, but unfortunately only about the US:
http://www.eia.gov/totalenergy/data/annual/pdf/sec5_7.pdf
As Art noted, it appears that the US became a net oil importer right around 1948. Note that the largest US Lower 48 oil field found on the runup to the 1970 US production peak, the East Texas Field, was found in 1930. By the time that a child, born in 1930, had graduated from high school in 1948, the US was a net oil importer. Based on the above data table, US net oil imports increased at 11%/year from 1949 to 1970, and then our net imports increased at 14%/year from 1970 to 1977, after US crude oil production peaked in 1970. In 1978, production from the North Slope of Alaska began to really come on line, and then US consumption fell in the late Seventies.
An interesting statistic would be the reserve to production (R/P) ratios for current shale oil wells, versus the R/P ratios for wells in large conventional oil fields like the East Texas Field. It's very likely that the wells on the East, structurally highest, side of the East Texas oil field were capable of making virtually as much oil in 1972 as they made in 1932. In contrast, I suspect that at least 90% of the shale oil wells currently producing will be down to 10 bpd or less, or will be plugged and abandoned, in 2022.
Regarding 18 year intervals, if, and it's a big (and unlikely "if"), but if we extrapolate the 2005 to 2011 rate of decline in the ratio of Global Net Exports of oil (GNE*) to Chindia's Net Imports (CNI), by the time that a child, born in 2012, graduates from high school in 2030, the Chindia region alone would theoretically consume 100% of GNE. Note that China's 2005 to 2011 rate of increase in net oil imports (9.1%/year) was below the US 1949 to 1977 rate of increase in net oil imports.
Also, while there are some signs of at least a slowdown in the rate of increase in China's oil consumption, their domestic oil production has also stopped increasing, which would contribute to increasing demand for oil imports.
This would indeed be interesting. But impossible. An essential part of any reserves calculation is recovery factor. Estimates of recovery factor for the Bakken range from 1% to 50%.
Some of the recent estimates:
An SPE paper gives 7%.
Enerplus Resources Fund claims 15%.
Others claim up to 19% primary recovery, with significant additional recovery with water injection.
Maugeri claims 50%.
If we take the 7% estimate as the minimum, and the 50% as the maximum, there is a 7:1 uncertainty in any reserves/production ratio. That uncertainty makes any comparison with the East Texas Field (for which such a ratio can be calculated reasonably accurately in retrospect for the last 80 years) completely meaningless.
As long as we are dealing with "Fantasy Island" recovery factors, why limit recovery factor estimates to 100%?
In any case, given the observed decline rates, what seems completely meaningless is any discussion of double digit recovery factors in shale oil plays.
Canada is not included in this top?
Canada is just recently getting up to 3.25 mbd
Canada's arrival as a major oil producer is much more recent than the countries shown on the graph. In 1960, Canada was only producing 500,000 b/d.
The increase in the last 30 years is due to oil sands and heavy oil production, with some East Coast offshore as well. Conventional onshore production peaked in the early 1970s and is now less than half of the total.
The thing that strikes me in the last diagram is the way US consumption and production move in opposite directions post peak. Presumably this is price driven, and energy independence will come with much higher prices than US inhabitants will enjoy paying.
Hot,
I do not think that higher oil price will result in energy independence because of demand destruction at some threshold price. This week, we see a notable drop in oil-directed drilling in the U.S. on lower demand-driven price and perhaps availability of capital. We may also be running out of attractive new drilling locations in the Bakken and Eagle Ford but who knows.
The fragility of the global economy is a factor that cannot be left out of any discussion about oil price and supply.
I'm sure my kids will be energy independent. They'll be burning whatever wood they can scavenge from whatever forests are remaining after we 'substitute' (in the economic sense) wood for high-priced oil. Something tells me that's what Hot was getting at...
Desert
aeberman - I made this point a while ago: what does "energy independent" really imply? Many would say that the KSA is truly energy independent. But I think a good argument can be made that they are more dependent on oil than the US. What would life be like for their population today if it weren't for oil? What other resource do they have? IOW which economy, the US or KSA, could handle a significant decrease in oil production better? There will come a day when KSA exports won't sustain their population...what do they fall back on then?
In that sense virtually no industrialized economy is "energy independent'. But many are in much better shape than others. In addition to some having more domestic energy some of these economies are more diverse. That's why I find the predictions of US "energy independence" a tad silly. As I said I don't consider any country to be independent. But the US is by far is a better position than the vast majority of economies on the planet. We are one of the largest domestic oil producers on the planet (and affluent enough to out bid most of the world for what we need to import). We're the largest NG producer on the planet and are in the process of becoming a minor NG exporter. We are the closest market for one of the largest new oil resources currently being developed: Canadian tar sands. We have huge domestic coal reserves. We have, perhaps, the most sophisticated energy extraction industry on the planet. We have a great ability to expand nuclear energy if we chose to. We have one of the best credit lines on the planet...good news/bad news, of course. We have one of the strongest militaries on the planet if it comes down to protecting resources. Unfortunately we have a huge chunk of non-essential energy expenditures we could cut back on if required; unfortunate in that a large portion of our society is dependent upon those expenditures to make a wage.
So no country is energy independent. But which country would folks like to the see the US swap places with? I suspect that's a rather short list. So yes...the US is approaching energy independence. Approaching but never reaching. And it's been closer to being independent that almost any other country and has held that position for many decades. So predicting a US future that offers a better capability of dealing with potential global energy shortages isn't really that much of a push IMHO.
Rockman,
As usual, you make some excellent points.
My view of trade is that I have something that you need and you have something that I need, and that is a good thing. To be dependent on trade is normal. If you can't get along with your trading partners, that is a problem.
I agree that the United States is in a relatively good position in terms of energy, arms, etc. but relative is the key word. I am less confident that you are that the U.S. will be able to cope with oil scarcity/higher prices in the medium term.
Art – I seem to have confused you as I have others about my expectations of the future. I have very little confidence in the US “coping” with our energy future. We're not reacting very positively today. That was my point about the relatively good position we’re in now compared to most economies. But we are taking no serious preparations for the future. And I think part o the reason for that lack of focus is the relative good position we’re in today. But I suspect we’re much closer to a tipping point than most would believe.
Confidence in our future coping ability? Not even close.
Energy independent would mean BTU positive net balance of trade, of $ positive net balance trade of energy.
That is, export more BTUs than we import, or export more dollars worth of fuel than we import.
I'm guessing the former will occur before the latter, due to high exports of coal.
This is a worthwhile goal because global energy prices simply will not diverge the way they have in the US. The US has a price discrepancy of cheap coal and gas, expensive oil. The globe as a whole does not. Moving closer to energy independence (either measure) better positions the US to exist in a high energy priced world.
Pretending that there is no value in producing more energy (even if it is for export) is economic nonsense.
Energy independence might not be all it is cracked up to be. For example Canada is clearly energy independent. The last time I checked gas cost something like $1.37/liter or CAD$5.18/gallon. The CAD$ is pretty close to par these days.
The taxes on fuel are much higher in Canada (as they are in most developed countries) and there are fewer subsidies to the oil industry. This is deliberate government policy to discourage excessive oil consumption and encourage public transit and the use of alternative energy sources. In fact, Canadian oil consumption is lower than it was 30 years ago despite the fact oil production and GDP are much higher. Public transit ridership rates in Canadian cities are two or three times as high as in comparably sized US cities.
This doesn't look very energy independent to me.
http://atlas.media.mit.edu/explore/tree_map/import/show/all/2709/2010/
I like how Mexican and Canadian oil is now "our" oil and included in US figures. The real issue is "I have an agenda" so I will change the criteria I use to present my agenda. We'll see a lot of this for a while. Educated people are just more believable so make better liars. Fancy titles, elaborate misrepresentations and the like are convincing to the poorly educated masses.
Combined net oil exports from the seven major net oil exporters* in the Americas in 2004 (BP, total petroleum liquids):
*Canada, Mexico, Venezuela, Argentina, Colombia, Ecuador, Trindad & Tobago
I see that you've stopped including Brazil.
I don't think Brazil has been on the list for many years, perhaps decades. And with slow development of the Tupi and other deepwater oil fields during economic expansion, I doubt they will ever be on the list of net oil exporters. Note that their ethanol production is declining as they require more land for food production and growing food it is more profitable than biofuel production.
I like to point out that Brazil have the intentions of becoming an industrial nation like us in the west. To achieve that goal, they will need all the oil they got. They have no plans to ever becoming an oil exporter.
Hello Zeke,
Hmm, I wonder for how much longer - when Canada starts exporting to China, then the Chinese will complain about those "foreign devils " stealing their oil!
ah interesting times !
Forbin
zeke - Just to be clear, while the Romney campaign (and others) are speaking of 'North American' energy blah, blah, blah, none of the figures/charts in this post refer to anything that isn't strictly of US origin. (Anyone please correct me if wrong.) Just trying not to further muddy the waters. And IMO, Exhibit 6 should be plastered to the forehead of everyone who tries to talk about US 'energy independence', or who calls PO a 'myth', or who touts tight gas as a 'saviour'.
Peak oil is a myth. The US is transitioning to natural gas.
How long will it take to transition to natural gas as a transport fuel and at what cost? Decades, I suspect. It's a good idea but not happening quickly or cheaply.
The US has a transportation problem I am unaware of?
Go ahead and draw a graph that compares median household income to the price of gasoline. Make sure it goes back to the 50s. If you have never done this you will be extremely surprised by the results - which is that gasoline is more affordable for the median household now than in the glory days.
Expensive natural gas and expensive oil is a problem, expensive oil and cheap natural gas is very, very different. The US uses more coal+gas than it does oil, and the former is cheap in the US, and will remain cheap in the US for many years.
For a quick look, I only found household income back to 1967. Actually retail gasoline price over median household income is currently at about the same peak as in 1981, which was pretty high compared to the 1967 - 1979 period and most of the subsequent period until recently.
No I believe you referenced inflation adjusted median household income but non-inflation adjusted retail gasoline to get that result.
No - I used nominal (non-inflation adjusted) income and price. $6140 in 1967, $49,103 in 2011. $0.33 for gasoline in 1967, $3.53 in 2011. Another interesting comparison is crude oil price. That has gone up 60 times since 1967 versus 8 times for household income. Makes it look like on a relative basis, the refiners and marketers are getting the short end of the deal over time.
Makes me fondly remember the days of full service gas with a smiling attendant who washed your windows and checked the oil.
You did not go back to the 50s when the median household income was 25K and gas 2.50. In other words, your annual household income was 10,000 gallons of gasoline.
We might make some synthetic gasoline, diesel and jet fuel from natural gas, but only 10% or so in the next decade.
We already make about 10% of the gasoline transportation fuel from natural gas using everyone's favorite food vs fuel argument, the corn ethanol gas-to-liquids process.
I'd argue that the reason we have ethanol and not direct natural gas to liquids is the corn renewables input provides a little bit of insulation from the volatility of the underlying natural gas price.
This also leads me to believe that at some point, some process like the Doty Energy CARMA-GTL process that takes mostly methane, but some additional energy from something else (in this case, wind) will end up adding at least another 10, if not 15%-20% to the total hydrocarbon fuel production over the next 15 years. This is likely to be similar to the growth curve for corn ethanol. It also turns out to be a nice fit because there's a nice overlap with the US wind belt with the same farmers who invested in ethanol 10-15 years ago.
We could take the 30 million acres now used for corn ethanol, plant Miscanthus and create 100 billion gallons of synthetic fuel per year. Nothing to it but to do it.
In the first portion of the linked article the author states that current GTL technology can produce $.88/gallon diesel if natural gas is $5/1000 cu ft.
According to EIA data www.eia.gov/totalenergy/data/annual/pdf/sec12.pdf on pages 321 and 324 diesel has 0.139 mm BTU per gallon while natural gas has 1.025 mm BTU per 1000 cu ft. If one gallon of diesel is converted to equivilent natural gas you need 0.135 cu ft of nat gas. At current price of $3.09/gal for diesel the natural gas cost for same amount of energy would be $0.50 per gallon. But the process to convert natural gas to diesel fuel is only about 60% efficient so this effectively works out to $0.83 per gallon. Add in conversion cost (capex and operations) and you get more like $1.04 per gallon equivilent.
However. when one converts a diesel engine to natural gas the intake air is throttled like a gasoline engine leading to a drop in thermal efficiency from around 30/32% to about 24/25%. So more energy must be consumed to get the same amount of work. Thus the calculated cost of $0.83 per gallon cost of nat. gas rises to $1.33.
So the cost with todays natural gas price ($3.69/mm BTU) is $1.33 but with it being 50% higher next year the cost goes close to $1.75 per gallon equivilent. Still make sense to convert to natural gas for vehicles that can operate on short range (about 250 - 300 miles for trucks, 150 - 200 miles for cars). For cars the bigger issue is storage and refueling time.
For trucks and buses, CNG/LNG makes sense. For cars making synthetic gasoline from natural gas makes sense. Two therms of natural gas makes one gallon of synthetic gasoline. $1 for natural gas, $1 for plant and labor makes a $2 gallon. Sell it for $3 wholesale and you make money with domestic energy.
I keep thinking natural gas to DME is going to work out because DME burns so well in diesel engines.
"Peak oil is a myth. The US is transitioning to natural gas."
If peak oil was a myth, there would be no need to transition to natural gas.
Peal Oil's most recent incarnation was obsessed with the idea that "there is no substitute waiting in the wings".
Globally, Peak Oil is waiting for the rest of the world to catch up to the US in terms of shale gas technology. When this does, the price of oil will revert to within a factor of two of the marginal cost of producing a BTU of natural gas. So natural gas at $5, oil at $60.
In the meantime, the US will act as an oil price ceiling (as will Canada). Oil under $120.
If you think oil between $60 and $120 is consistent with peak oil, have at it.
"Peal Oil's most recent incarnation". I see you've been getting your information at third hand.
Read this site for a while. There's (litotes warning) a little bit to learn.
Starting with the fact that the world price for gas is not $5 per thousand cubic feet, and continuing with why the price of gas might be different in different places, and why this is much less true for oil...
I am aware of the price of natural gas in many parts of the world.
If you think that the global average of the price of natural gas can experience a long term disconnect from the price of oil than fine.
Very many peak oil writers predicted gas would peak sooner than oil. That is simply a fact. Twilight in the Desert says this, Long Emergency says this, many others.
But my point with re: to natural gas is to simply ask Mr. Berman for an explanation for his fictionalized graph of natural gas production here.
http://www.smartplanet.com/blog/energy-futurist/everything-you-know-abou...
This graph is clearly wrong. It was wrong when the article is presented, it is more wrong now (after the EIA has updated their numbers) and Mr. Berman refuses to provide an explanation for it.
[edit]
Let's avoid personal attacks and support arguments with facts. Please refer to the posting guidelines.
Thanks to all!
K.
Pete - PO in the US in 1971 is an undeniabe fact just as the fact that the US has been the largest producer of NG on the planet for decades. You seem to be comparing apples to zebras. Are you in the right place?
" that the US has been the largest producer of NG planet for decades"
No, Russia was the largest natural gas producer for many years. It is difficult to discuss energy issues with people that don't know basic facts like this (or people that think increases are plateaus, etc).
You can keep changing the definition of "Peak Oil" to mean whatever is happening now, that is fine. Exclude unconventional sources, exclude ethanol and NGLS, etc. do whatever you need to do to buttress your story.
I mainly just want to know why Berman lied about the natural gas production numbers just a few months ago in the Nelder piece. It is relevant because here Berman is again drawing graphs. His previous graphs were wrong (outlandishly so) and hence the current graphs are not trustworthy, pending an explanation.
That is all, just an explanation.
"No, Russia was the largest producer of natural gas for many years...."
Can you give us the facts?
According to this page on the EIA site: www.eia.gov/CFapps/ipdbproject/IEDindex3.cfm?tid=3&pid=3&aid=1 the US has surpassed Russian natural gas production since 2005 by 5 to 20%. I did not look at years back to 1990, which before then the numbers may have been inaccurate as the USSR was releasing the information.
Or course it is here.
http://www.eia.gov/todayinenergy/detail.cfm?id=5370
So 6, 7 years Russia leading, sometimes by a wide margin. This is over.
Do you guys not read the news? Try it sometime.
Looks like you don't know how to read charts.
On the linked web pagesI linked, going back to 2000 US production leads Russian by 5 to 20% EVERY year. So which years since 1990 did Russia lead US in natural gas production (excluding flared and reinjected, in other words "marketable gas")?
Like you I just want the facts made known to the Oil Drum users.
If you select "dry marketed natural gas" from your chart you will see that Russia was the leading producer for many years.
I believe the raw data you look at by default includes massive North Slope injected gas. The US will market that gas someday, it is in the bank.
You are referring to two different things because "natural gas production" is not the same as "dry natural gas production." Dry natural gas is a refined product. EIA Glossary: dry natural gas production:
ROCKMAN is not referring to dry natural gas production.
EIA Gross Natural Gas production, i.e. natural gas production or gross gas withdrawal which the EIA's glossary defines as, "The full-volume of compounds extracted at the wellhead, including nonhydrocarbon gases and natural gas plant liquids," in billion cubic feet:
Because "decades" is at least 2 decades and the data show the U.S. surpassed Russia since 1993 (it does not show the last 2 years), ROCKMAN appears to have made an accurate statement. Because you changed the category to dry natural gas, I say ROCKMAN got it right.
Dry natural gas is a refined product and that is why it is the metric that is used to best assess aggregate production.
Otherwise you will be measuring "production" that isn't absorbed into the economy.
So if you go by the correct metric, which is dry natural gas, than Russia was the largest producer in the aughts.
If you go by some other measurement, you will be misled in many ways, to include the mistaken belief that the US was the largest producer of natural gas for many decades, which was what Rockman said.
I suppose one could say "Russia, US who cares". But marketed dry natural gas production is the correct way to measure natural gas production in sum. The other measurements are of interest but generally inferior and misleading for assessing production across time, or between countries, etc.
Perhaps that is Art Berman's mistake (see other posts), that he confused different types of natural gas production. OK, fine, but perhaps he should say so. Otherwise, he is confusing people who don't know energy very well.
Excellent point. The US uses something like 17 or 18 million BPD. Perry has a certain political agenda. Uncharitably, one might suspect that what he writes is related to who funds his think tank.
It is almost laughable that he talks of energy independence due to and increase of 1/2 million or so BPD in production due to fracked shale.
If you consider oil to be "transport energy", North America has a long way to go.
http://mazamascience.com/OilExport/
What was the percentage decline in NA imports from 2008-2012?
Question: Does training for the economic profession ruin a person's ability to separate facts from beliefs or are people prone to such confusion drawn to the profession?
The Carpe Diem 'blog' is useless to me because it is a singularly rose-tinted view of the world (nothing but good news or directionally irrelevant tidbits need apply) and, typical for an economist's view, parades these cherry picked items as if they were somehow more relevant and smarter than other offerings.
If the world was fair, and it might be again someday, Mr. Perry will have a long time to consider just how and where his profession got the limitless earth paradigm so wonderfully wrong from the security of his drab living room instead of rather expensively mis-informing future generations from the front of a classroom.
Art, Thank you for bringing some needed data and context to the conversation.
I was brought up by a scientist to be a scientist. From a very early age I always found it impossible to understand economics until the light bulb finally went on - it doesn't make sense. It is a one giant ponzi scheme.
I have always followed very traditional and simply rules when it came to money. Without ever earning huge amounts or investing in questionable financial arrangements, I find myself owning far more real wealth in the terms of physical assets of post-peak value than most of my more 'affluent' neighbours. I seem to have successfully ridden the breaking wave of cheap fossil energy. Not that this guarrantees I will survive the crashing surf.
Me too. I could never understand why I was so good at numbers and math and figuring things out, but something simple like money and economics remained such a mystery, even though I took all the requisite economics classes in university. I'll never forget that time in the 3rd year economics class we were forced to take, when a room full of hundreds of mechanical engineers was presented with the imaginary charts that economists use as a basis for their theories. We'd all just spent 4 years learning about real charts based on real world data, and then to see this joke ... the hall practically erupted in laughter. Don't remember a thing about the content of that course to this day, though.
The prof, who was an engineer who had moved over towards the economics side of things, agreed and said that when he first learned this stuff it seemed like it was all just "made up", but that's how the world of economics operates, and that's what was actually happening out there in the market.
Thanks to blogs like Chris Martenson and others, the whole field of economics was then exposed as nothing more than smoke and mirrors, a sham. Then it became much easier to understand. If you are an engineer, an earth scientist, or anything related to that, then you are a much better economist than any official economist could ever be.
If you really want to get your bloodpressure up think about reserve banking for a minute. It truly is a license to print money, and stick it in your own pocket. The idea that banks are intermediaries between savers and borrowers is one of those "true but irrelevant ideas and one that banks love to keep alive.
Rgds
WeekendPeak
That reminds me of a comment I heard about the time of the 1987 bank explosion:
"We need strict banking regulations or the bankers would own all of the money after a very short time"
Economics is one of the social sciences or "soft" sciences. It is attempting to explain the behavior of people, and since the behavior of people is largely inexplicable, the theories are not all that rigorous.
Where I went to university it was classified as one of the "Arts" subjects, which I thought was hilarious, but since I had to take a certain number of Arts courses to get my two Science degrees, I took them in economics. This worked out very well later in my career when a grounding in economics gave me a big advantage over the other techno-nerds.
The trouble that most engineering students have is that they do not understand people. If you understand the human factor, you can do much better than if you only understand mathematically predictable things. If you understand economics, which is not simple compared to, say, quantum physics, you can make a lot of money. This is probably the most important thing to know about it.
Most economists are weak on math, but if you use some advanced math on economic theories, they become a lot more rational to explain - but only if you understand advanced math as well as advanced economics.
Conventional economics is based on the "rational person hypothesis" -there is enough experimental evidence to prove that assumption is completely false. If the fundamental assumption of physics were proven wrong would we still cling to our theories? IMO the only economists who are worth paying any attention to are the behavioral economists- they at least test their theories on real people. As to the rest- for every theory proposed there is an economist who will propose a counter theory and there is evidence for both having worked and both having failed. If that is science (soft or hard) then so is Intelligent design and creationism, astrology, palm reading etc.
We cling to economists the same way that centuries ago we clung to astrologers. Human beings need the certainty that people who claim to see the future bring.
The rational person theory is a simplifying assumption of neoclassical economics. It works fairly well in explaining the behavior of markets. The trouble with assuming that people are not rational is determining in what ways they are not rational. You quickly get out of the range of Econ 101 and into Nobel Prize territory.
It's similar to the Ideal Gas Law, which also involves simplifying assumptions. If you have a lot of CO2 or H2S in your gas, it stops following the ideal gas law and starts doing its own thing, and the calculations become much more difficult - the law stops being the law, and you need a gas chromatograph and a computer to figure out the behavior. We don't have a chromatograph for people.
I studied civil engineering and chose Political Science as my compulsory non-engineering subject. (Most studied Computer Science, a wiser career choice as it turned out.)
I thought with with my logical training I'd be quite a star at such a nebulous subject. Not so. When my essays got Ds (much to my surprise and distress), I looked at a couple of the guys' essays who were getting As and had to admit they had superior insight to me.
Clearly there are cause-and-effect relationships in politics, economics, psychology, etc. But teasing out the laws that govern them amid the noise and feedback of real life is very, very difficult.
I am struck by how much credence people give economic forecasts when economists have such a hard time predicting what has already happened. Case in point the quarterly GDP number. How many of them actually get it right. The preliminary report is released a month after the end of the quarter i.e. with regard to events that have occurred at least one month ago perhaps even four months. Even astrologers can predict the past. Yet we place so much credence on their GDP forecast for 2013 and beyond!
Oracles, augers astrologers and economists - that is the family tree.
Economics used to be called Political Economics, then it tried to borrow from Science and Mathematics to make it seem more respectable. It deals with human behavior, which is seldom if ever quantifiable, so it misses the target often.
From the article:
"One Quad is approximately equal to 1 trillion cubic feet of gas, 180 million barrels of oil, 120 million barrels of NGL (about 65% of the thermal content of crude oil), and 36 million short tons of coal."
[end excerpt from article]
If the energy content of a barrel of NGL is ~65% of the energy content of crude oil, and one Quad ~= 180 million barrels of oil, then 1 Quad should ~= 277 million barrels of NGL, not the 120 million. What numbers are wrong, barrels or energy content or my math?
Plus, if we're realistic about using it to kick the can of our current predicament down the road a bit farther, you've got to knock those numbers in half again to account for the energy lost in the Fischer-Tropsch process, no? I wonder what dent happens to the lifetime efficiency of a gasoline engine when converted to nat. gas for that matter? If we're calling it a subsitition, we certainly have to include the embodied energy of the conversions if we're being honest with ourselves. Obviously that doesn't apply to new rolling stock, but something tells me to be realistic about using nat gas as a transport fuel, you're gonna have to have a massive cash-for-klunkers conversion of vechicles' fuel systems. Not that I'm advocating it, necessarily, but it sure would be nice to see some nat. gas ambulances and telco trucks around in 20 years, you know? And even that would be a healthy investment given the size of the population and the declining economic landscape. But I think once real problems can't hide behind economics, you will see a lot of priority realignments quite quickly...
Desert
You have the math correct, Art made an error. I would add that using the heat content data at the EIA website the current average (2011) heat content of NGL is about 70 % of the heat content of an average barrel of crude (it varies a little over time). So that would lead to about 256 million barrels of NGL to produce 1 quad. Or take the average (67.5 %) and call it 265 million barrels.
DC
An even more revealing statistic would be to correct oil production and consumption in the US for population growth, to present it on a per-capita basis. One could go further and do so on a per-GDP basis as well, but because the GDP statistics are so phony, and because the oil imports so distort the true picture of US GDP, I don't think correlating to GDP would have any meaning.
Regarding the assertion that US energy independence is going to be difficult to achieve, I disagree. The US has enjoyed a highly abnormal flow of goods into the country for 40 years due to the reserve status of the dollar flowing back out. The US will quite easily become energy independent, and I predict that when it does happen it will be a swift and brutal transition.
Then, assuming the country doesn't descend into a pit of civil war, if it's still got its suspenders around its shoulders it will turn to CTL and GTL to make up the difference for the foreign oil it can no longer import.
I agree! It will be like driving it a gas guzzling SUV into a brick wall at 100 mph! It's fuel consumption will definitely be significantly reduced thereafter.
The current US Energy dependence paradigm and consequently the US economy is becoming increasingly unstable and fragile.
In comparison less affluent societies are by nature much more resilient because they can only hit the wall at 5 mph. They might have to repack their apple cart but will be able to continue on with relatively minor damage.
Nassim Taleb author of The Black Swan, is working on an interesting new book titled 'Antifragility'
http://www.econtalk.org/archives/2012/01/taleb_on_antifr.html
Taleb on Antifragility
Nassim Taleb
Hosted by Russ Roberts
New Jersey now is what energy independence in the US will look like, even more so after the Jerry cans are abandoned b/c there is no more gasoline available.
I don't know how the establishment is going to back out of the sack it has climbed into with regard to ongoing 'energy bubble'. With Brent prices declining to the cost of delivery at the terminal, it is hard to see where additional real supply is going to come from. If it costs $100 to bring oil to the market and the customers can only offer $50 ... you can see there is a real problem.
Universally, economists blame current difficulties on constrained final demand. If these dudes think demand is straitened now, wait until there are actual shortages and accompanying bankruptcies. Nobody will be able to afford fuel at any price ... no matter how low. The process involved is self-amplifying, a positive feedback loop: high real fuel prices => increased credit => higher credit costs => insolvency => high real fuel prices => etc. This dynamic occurs even when fuel prices decline as credit availability declines faster ...
Fuel use has little economic return, most fuel is simply burned up for nothing, for non-economic 'fun' or 'convenience'. The gap between what fuel costs ... and zero (its return) must be financed with debt. Simply accessing unaffordable fuel solves nothing, the fuel remains in the ground! This is the case with much of the shale hydrocarbons overseas, they are too expensive to extract.
The economists are fools, the problem with energy has never been on the supply end but on the consumption side. There never has been a permanent gain to offset the permanent loss the burning of energy sources represents.
Frankly, I see shortages now ... a permanent US fuel supply shortage that migrates from place to place, this month's Northeast gasoline shortage was last month's shortage in California. Notice the same rationalizations in both places: refinery 'problems', "disasters" (fire and flood) ... it's more like unaffordably expensive gas (for Americans stretched to the financial limits).
I just don't understand why oil is considered by some to be so magical.
Sure, increasing import bills are a problem, but please note that OPEC countries are working very hard to spend their new income - that will tend to raise their non-oil imports, and raise oil-importer exports.
Yes, the cost of capex for substitutes will slow the economy down, but that's not overwhelming or permanent.
Yes, an oil shock can cause FUD, which slows down capex, but that's not permanent either. At a certain point EVs will gear up, and people will spend their money on them. In fact, car sales may go up, as there's actually a reason to buy a new car.
The US (and most of the OECD) has plenty of electricity, and plenty of time to transition from fossil fuel sources of electricity to renewable sources (not that we shouldn't transition away from FF much more quickly to reduce CO2 emissions...).
Our current operational problem is liquid fuels, and there are plenty of good substitutes for liquid fuels: electric vehicles (and their variants: hybrids, plug-in hybrids, extended range EVs, etc); freight reducing fuel consumption by 2/3 by moving from trucks to diesel trains, and then electric trains; heat pumps; and for the small percentage of energy that's needed for long-distance transportation, synthetic liquid fuels will work just fine.
At some point all the EVs etc will have been bought, and we'll not be worrying about oil any more.
Gets even more interesting when we examine sources of the natural gas boom - seems the unexpected source is oil shale gas by product - relying on trend figures on by product fossil fuels in my opinion is thought with dangers and difficulty.
Curious to see why someone willing to distort the facts is taken so seriously.
Here is Chris Nelder quoting Art Berman 8 months ago.
http://www.smartplanet.com/blog/energy-futurist/everything-you-know-abou...
“His well-by-well analysis found that total U.S. gas production has been on an “undulating plateau” since the beginning of 2009″
Wait, what does the EIA say.
http://www.eia.gov/dnav/ng/hist/n9050us2M.htm
Wow, that's a big jump from the beginning of 2009 to now.
Mr. Berman, were you misquoted by Mr. Nelder? Or were you fabulously wrong just a few short months ago? And if the latter, (which seems the likely case) why should we trust you now?
Gas production is on an undulating plateau but not since 2009.
To be clear - this was Berman's original response before he edited it
"I don't think that I ever said that natural gas production has been on an undulating plateau since 2009 because it has been increasing until recently."
His response is now edited, not sure why he won't answer a simple question.
Nelder quotes Berman, and presents a graph with total production on it that is completely at odds with the EIA graph.
Here is the link again.
http://www.smartplanet.com/blog/energy-futurist/everything-you-know-abou...
Is that graph yours? It is labelled as yours. It says "source Arthur Berman". Are you a different Art Berman?
This seems clear evidence that you are simply fabricating numbers out of whole cloth. Again, why should we place any credibility in your analysis when just a few months you presented a clear piece of fiction for third party publication.
I suppose a “plateau” is all in the eye of the beholder. I haven’t seen any rules defining a plateau so I’m free to make my own up: when the range between the highs and lows is less than 10%. In 1972 we produced 23.1 tcf. In 2011 (last year for the stats available) we produced 28.6 tcf. So the average over the last 40 years has been 26.4 tcf. The range between the highest highs and the lowest lows has been 9%. Thus we’ve been on a NG production plateau for 40 years.
Of course, NG has been rising recently and the same stat can be offered for the period 2005 thru 2011: a plateau with a 10% range. And with a good steady increase during the period so it looks like we may be on the verge of busting out of my 10% rule. But there is an interesting aspect to the recent increase. The beginning of the plateau in 1973 was a result of a huge increase in NG prices. Prior to the 1970’s NG was worth so little companies would just flare it. But PO hit in 1971 and the country needed a new energy source and NG was it. And how much did we use in the period from 1973 to 2005: over 800 TRILLION CU FT. And virtually all of it came from conventional fields. Conventional fields that did not have the precipitous decline rates we see in the recent shale plays as witnessed by that 40 year plateau. While the recent and continuous rise in NG from the unconventional reservoirs is encouraging it should be noted that it’s the result of continuous drilling required to keep the rate up. That effort took a huge step back when NG prices collapsed in 2008 and the NG drill rig count dropped over 70%. Much of the NG setting a production base today is from thousands of low volume wells drilled during the shale gas boom. And increases are obviously coming from NG associated with the oily shales as well as other shale gas plays, such as the Marcellus , that are still viable.
So optimism for increasing NG is warranted as long as drilling activity remains at its current hectic pace. But any slow up would obviously lead to a strong regression of the trend. The new shale gas wells won’t sustain decades long production as the old heritage conventional wells. That’s an undeniable fact when you compare decline curves side by side. I can point to many conventional NG wells that are producing at a higher rate after being on line for 10+ years than shale gas wells that have been producing for 3 years…or less.
The unconventional shale plays have added a nice boost. But not game changer IMHO. The US has been the leading NG producer for many decades. Current NG production along with the current increases has not changed the situation to any significant degree. IMHO an equally important factor is that while NG production has been increasing so has the demand for it. And with efforts to avoid more coal burning by power plants and a potential transition to utilizing NG in all forms of transportation that increased production might easily be offset by increasing demand. And then only as long as the shale plays have locations left to drill. The Austin Chalk carbonate shale play of the 90’s doubled oil production in Texas. But only for a short time. And did so for two reasons: the high decline rate and the fact that the entire trend was drilled up for the most part in less than 8 years. And it was done utilizing the same horizonta drilling and farc'ng tech being used today. Some AC wells are still drilled occasionally but when was the last time you saw a headline touting this play? Since the beginning of the oil industry every trend play has had its beginning and eventually its end. The same will be true of the current hot plays.
Everything is sustainable...until its not.
Anyone that looks at this chart
http://www.eia.gov/dnav/ng/hist/n9050us2M.htm
And thinks it describes an undulating plateau from the period of 2009 to the present is simply not a reasonable person.
A 15% increase in 15 months is not a plateau. But if your explanation is "increases are plateaus" than OK, you probably also think up is down, hot is cold, and black is white.
Is it just me or is the end of that graph showing the start of a plateau?
A 15% increase in x months is NOT breaking out of a long term plateau.
*IF* said short term trend continues to ever larger increases, then it is breaking out of the plateau.
There are seasonal variations of multiple %. One needs to see a bit more than +15% sustained for a 12 month average to say that the plateau has been broken out of.
Not there yet.
Sorry
OK, fine that is one interpretation. I think it makes no sense.
The broader point is Bermans graph bears no resemblance to the EIA graphs. Does he really believe the EIA numbers are so far off?
Per the linked EIA graph, September 1983 production was 1,312,654 mcf and January 1984 production was 1,730,382 mcf.
That is a 31.8% increase in just four months - twice your 15%.
Did this increase break the long term plateau in NG production ?
No, it did not.
Your claim that a +15% is enough to claim breaking the plateau makes no sense. Only if your eye follows the graph further upward does it make sense - but future data may not (and IMO is unlikely to) follow one's eye upward.
In 2016, it is more likely that the recent +15% will be seen as just another undulation.
Alan
That's kinda harsh. If you read the link you attached you will see that there is mention of the difference between EIA data and what Berman reports. How do you know which one is correct?
If Art Berman wants to stand by that chart and say he still believes that natural gas plateued at the early 2009 value (and not at the much higher late 2011 value) that is fine by me, he should say so here.
He doesn't appear to be standing by that chart in his current comments.
The implication of that piece (that the EIA production numbers are wayy off) is a bit like arguing that the moon landing was faked, especially considering the dramatic price swoon of the current summer.
But again, if Art Berman wants to say "the EIA can not track production, even production 12 months back after it has had time to re-evaluate", fine go ahead and say that. Say it clearly.
Looks like you didn't read your own quoted article.
In the first link Chris says that Art Berman's chart shows an "undulating plateau", not that Art says there is a plateau. Better go back and read your links.
The chart is there. The words "undulating plateau" are in quotes. The chart shows an undulating plateau at the beginning of 2009.
The EIA data does not.
Berman owes any reasonable person an explanation for that chart.
http://www.smartplanet.com/blog/energy-futurist/everything-you-know-abou...
Art Bermans graph shows gas production at 1.6 trillion cu ft for Jan 2009 and slightlty under 1.6 trillion cu ft. for what appears to be Aug 2011 (shortly before the article was written). Producion during that period fluctuates slightly up and down (varies about 5%) during that period .
If that is not an undulating plateau then please define one for me.
Right Art's graph shows a plateau beginning in Jan 2009 but the EIA data paints a very different picture.
Hence, some explanation is required. Does Berman feel the EIA numbers are wildly inaccurate. Is his graph misinterpreted somehow.
It seems pretty clear - what is there to misinterpret. He shows a total natural gas production doing the completely wrong thing. Everyone looking at it will think it odd, to say the least, and surely others will think it fabricated.
I am willing to consider that he made a mistake, or Nelder (somehow) did, but in the absence of an explanation I believe Mr. Berman is simply embarassed to be caught in a tall tale. I don't blame him.
Perhaps it might help if you focused on what Art actually wrote, in the linked Oil Drum post, rather than focusing on a summary article.
I have highlighted the relevant portion of Art's article, in bold. Incidentally, based the latest available EIA data, I would argue that Art's analysis of the state-level data accurately predicted what the EIA is now showing, to-wit, that monthly US dry natural gas production has not materially exceeded (through July, 2012) 2 TCF per month since October, 2011.
http://www.theoildrum.com/node/8914
After The Gold Rush: A Perspective on Future U.S. Natural Gas Supply and Price
Posted by aeberman on February 8, 2012
Monthly US Dry Natural Gas Production:
http://www.eia.gov/dnav/ng/hist/n9070us2m.htm
But here are the larger points that Art was making:
Why throw sand in the air.
I'm looking at the graph. Anyone can see it is wrong. There must be an explanation, what is it?
I understand he wrote many things, and some of them were right. But he developed a graph, and the graph was wrong. Not a little wrong, a lot wrong. And it was not a graph predicting future production, it was a graph describing past production.
Apparently you think this doesn't discredit Mr. Berman. I agree, sometimes his overall conclusions are right (sometimes not) but what bugs me is he appears to simply fabricate numbers.
First, perhaps I missed it--and again I suggest that you focus on what Art actually wrote, and not on a summary article--but I couldn't find where he said that US gas production had been on undulating plateau since 2009. He did say, in February of this year, based on his analysis of individual data sources, especially state data, that US natural gas production appears to have reached an undulating plateau, and as noted above, the available monthly EIA data since October, 2011 support that very premise.
Incidentally, I would assume that there is an error on the vertical scale on Figure 19, and I assume it must be monthly production. In any case, here is what you said to Art:
Unless you can provide evidence that the chart--showing the sum of production reports from state and other sources--was fabricated, this seem to be a clear case of malicious libel.
If the chart is an accurate representation of what he represented it to be, i.e., a summary of individual data sources, it seems to clear to me that you owe Art Berman an immediate apology.
Right the chart is obviously mislabeled anyone can see that.
"If the chart is an accurate representation of what he represented it to be, i.e., a summary of individual data sources, it seems to clear to me that you owe Art Berman an immediate apology."
The chart is presented as being comprehensive to the entire US. If that is not the case, than fine, it is Mr. Nelder who is mistaken.
In such a case, one would have to ask what sources were omitted. It certainly looks like he is attempting to break out the US natural gas production in sum by category.
The more obvious explanation (i.e. what other people will believe) is that it is simply grossly inaccurate data presented by Art Berman. Not the first time he has done this.
Why do you assume the EIA's data for the nation is correct while the summation of the data from the states presented by Art Berman is incorrect or falsified?
Berman's Chart:

EIA's chart:

A possible explanation for the recent discrepancy between the two charts is that data from the states may not include natural gas condensate (EIA calls it lease condensate). Over the last three years there appears to have been a rush to develop wet natural gas wells because the NG condensate fetches a high price while the price of NG has been generally dropping to unprofitable levels.
The data from the states may not include some offshore production when under federal jurisdiction beyond some distance from shore. It might not include production on federal land within the state.
The EIA's graph is improperly labeled because it declares the vertical axis is in "trillion cubic feet" without a time interval. Is it production per day, month, year or something else? On the other hand, Berman's vertical scale contains too many zeros wasting space and making it difficult to read the numbers. Using 2 digits of precision and setting the units to "trillion cubic feet of gas per day" would have been easier to comprehend. Because the unit on the EIA's chart is mislabeled I can not resolve the apparent discrepancy between the values (1.6 tcf/day = ~11 tcf/month = ~48 tcf/month = 580 tcf/yr). Because there is an obvious error on the EIA's chart, I discredit the EIA first.
When the Berman chart first came out, my assumption was "ahh, there is something very unusual here and the EIA will update their numbers, or Berman will, after some time has passed and any reporting delays have been rectified".
Generally, the EIA production numbers are considered accurate, particularly after some passage of time.
"Why do you assume the EIA's data for the nation is correct while the summation of the data from the states presented by Art Berman is incorrect or falsified?"
So (for me) this is like asking "why do you assume the moon landing is real when there is a widely respected person who says it is a hoax.
However, if Berman wants to say "I stand by my previous data showing the EIA is completely incorrect", fine. It does make you wonder why he refers to the EIA at all, if they are so untrustworthy, but it would at least shed some light on an odd situation.
"A possible explanation for the recent discrepancy between the two charts is that data from the states may not include natural gas condensate (EIA calls it lease condensate). Over the last three years there appears to have been a rush to develop wet natural gas wells because the NG condensate fetches a high price while the price of NG has been generally dropping to unprofitable levels."
How can this possibly rectify the problem? Dry natural gas does not include condensates, if Berman is including the condensates than removing them will compound his error, and if he isn't than adding them in will result in an apples or oranges comparison.
In other words, the condensates can explain why Berman's graph would show larger results, but not smaller results.
" Because there is an obvious error on the EIA's chart, I discredit the EIA first."
The EIA's chart is correct. It says "monthly", indicating the amount per month. July, 2012, 2,133,027 million cubic feet of dry natural gas were marketed. Natural gas is always measured in large numbers, the raw data can have 10, 11, 12 digits. I would not care if Berman's chart simply had an improperly labelled unit, that is a typo, but when the entire shape of the data is wrong by a long shot it is very, very unusual. I call this "fabrication", but it is perhaps an honest mistake.
I am skeptical about EIA data because there are significant discrepancies between EIA, IEA, JODI and BP data for world crude oil production. There is a long history of EIA's data for world crude oil production being revised preferentially downward. When the EIA claims that Saudi Arabia produces more crude oil than Saudi Arabia claims, I wonder about the accuracy of EIA's data. I do not mean to imply that the other sources are more reliable, but I have to view the data with large error bars.
Errata: in my post on November 1, 2012 - 5:29pm, "~11 tcf/month" should be "~11 tcf/week."
The graphs are not labeled "dry natural gas." Without that adjective, it means gross production unless it is just more inaccurate terminology.
I do not see "monthly" included anywhere in the EIA's chart. You seem to be including extrinsic information. From my perspective, there is an error in the EIA's chart and a discrepancy between the vertical scales.
"I am skeptical about EIA data because there are significant discrepancies between EIA, IEA, JODI and BP data for world crude oil production."
Of course world crude oil production is very different from American marketed natural gas production.
Is there some history of the EIA American marketed natural gas production being discredited? Even after 20 or 30 months (i.e. the EIA is making a mistake as far back as 2009). No, the EIA is widely recognized as doing a stellar job and Art Berman stands alone in claiming (tacitly, via his chart) that they are wrong.
"I do not see "monthly" included anywhere in the EIA's chart. You seem to be including extrinsic information. From my perspective, there is an error in the EIA's chart and a discrepancy between the vertical scales."
Why do you say things like this? Are you just silly. This page
http://www.eia.gov/dnav/ng/hist/n9050us2M.htm
has a table labelled "U.S. Natural Gas Marketed Production (Million Cubic Feet)". Can you see this table, it occupies most of the page.
And there are 12 columns, with labels like "Jan", "Feb", "Apr", etc. One for each month.
And then there are many rows, one for each year.
And each cell of data is the total production for that month, of that year, in million cubic feet.
So, again, 2,133,027 million cubic feet were produced in the most recent month recorded, July 2012.
This is not extrinsic information every day there are many many people that read this table and have zero trouble understanding it.
Also, near the top, you can switch back and forth between monthly and annual numbers. Monthly means "per month", annual means "per day".
I can not explain this chart to you with any more detail, but perhaps one of the other posters can reassure you that it is not mislabeled.
Like one of the other posters, I actually don't think you are confused by the table at all, but rather just attempting to somehow distract from my very simple question.
You are using extrinsic information from the EIA to conclude that the unit on the EIA chart is Tcf/year and the chart Berman used is Tcf/month even though both of the charts are labeled differently. I direct linked to the charts I was describing while you have switched to a different chart and data set for the EIA.
Close to a 40-year plateau, based on BP data.
http://mazamascience.com/OilExport/
Everybody in the 1970's thought that the recent peak was the beginning of the end. Hubbert predicted NG production was going to fall off a cliff.
Then, 10 years ago everyone thought the same thing.
Gotta keep these things in context.
http://energybulletin.net/stories/2012-09-04/usgs-releases-damning-eur%E...
USGS releases damning EUR’s for shale
by Deborah Rogers
September, 2012
Look if you want to think shale gas was been something other than a runaway success story than fine, go ahead and think it I won't try to dissuade you.
If Berman wants to talk about EUR's and nothing but EUR's and speculate exclusively about some "break even point", below which Aubrey Mclendon goes bankrupt fine.
Mr. Berman created a graph of PAST PRODUCTION. Not EUR's, not wells drilled, not prices, but the actual production numbers.
That graph appears to be wrong. By a long shot.
Either stand by the graph or provide an explanation for it.
Otherwise - I will assume that the production graphs you show here are similarly doctored.
Got it. The USGS is part of the conspiracy to badmouth shale gas too. You wouldn't happen work for Cheseapeake by any chance?
The DFW Airport Lease, which Cheseapeake touted as one of the best remaining areas in the entire Barenett Shale, was a swell example of a "Runaway Success Story."
In any case, as noted above, we are waiting for you to demonstrate that the chart that Art showed was prepared using fabricated data sources.
There is no clear definition or a runaway success. Most people think this is true for shale gas but certainly not all, and certainly not all plays.
And of course, Aubrey McClendon is sometimes proven to be wrong about his FUTURE PREDICTIONS.
But I have never seen anyone produce an wildly incorrect graph of PAST PRODUCTION other than Art Berman.
Pete – Sorry for the delayed response...work does get in the way at times. I’m out on a well at the moment with limited net access so I asked my 12 yo daughter to pull up the facts
http://www.bing.com/images/search?q=russian+natural+gas+production+histo...
As the chart clearly shows the US and Russia have been swapping the NG production leading back and forth since 1985. And it clearly shows that the US was dominant before 1985. In 1970 (last data point) we were producing 3X as much NG. Obviously the US has produced more NG in the last 40 years than any other country.
As you said above: “No, Russia was the largest natural gas producer for many years. It is difficult to discuss energy issues with people that don't know basic facts like this…”
Yes they were. And the US was the leading NG producer for the majority of that period...24 out of the last 42 years. A very basic and documented fact. The US has been the major producer of NG on the planet for the last 4 decades despite your attempts to spin otherwise. The fact that the US and Russia are running neck and neck for the current top spot today doesn’t change the documented history.
Feel free to cherry pick your data to support you claims. But if my 12 yo daughter can expose your spin with a 10 minute net search you might want to sell your story in another venue. Most of TOD is a tad smarter than my daughter. I won’t name the exceptions. Some of them are my friends. LOL
And I second the moderators request for tad more civility. I appreciated how difficult it is to not respond in kind to rudeness. But this is TOD and not some bar fight. LOL. Ignoring the offender is the best weapon IMHO.
Again, Russia was the largest natural gas producer for many years. This chart makes it clear.
http://www.eia.gov/todayinenergy/detail.cfm?id=5370
So 6, 7 years Russia leading, sometimes by a wide margin. Neck and neck for most of the aughts? No.
Some people are not looking at marketed natural gas production but instead at other versions of the data. The correct reference point is marketed natural gas production, as reinjected gas, flared gas, etc doesn't count.
So can we at least agree on this? Russia was the leader for many years, sometimes by a wide margin.
Perhaps you would prefer to say Russia was the leader for several years, instead of many years. The point is that for at least half of your daughter's lifetime, Russia was the world leader in marketed natural gas, sometimes by a wide margin.
Look at it another way. Sum up marketed natural gas production for the entirity of your daughters life. Russia will be ahead by this metric, by a decent sum. But the USA is ahead right now in monthly production.
This is one of the reasons why shale gas is considered a big change. Nobody was expecting your daughter to live to see the US leading in marketed natural gas production. Up until a few years ago, your daughter only saw a slight glimmer of a lead when she was born. And then the USA fell behind Russia, and then far behind Russia, and there was every reason to believe that Russia was the future of natural gas and the USA the past.
But then new technology was developed and your daughters world was radically changed. She now lives in the world leader for natural gas production, and the expectation is she will continue to live there for the rest of her (hopefully long, warm, and well lit) lifetime.
Hooray for America and hooray for the wonderful future for Rockman's daughter. I hope she grows into a willowing beauty and breaks the hearts of both my sons.
She now lives in the world leader for natural gas production, and the expectation is she will continue to live there for the rest of her (hopefully long, warm, and well lit) lifetime.
That is a very nice, but quite unrealistic expectation for the next, say, 65 years.
Alan
Well, I think not, I think the learning curve on shale fracking and the reserves in Alaska (which has yet to be fracked and will sooner or later develop export access) make it quite likely that Rockman's daughter will never see Russia signficantly leading the USA in natural gas production.
But this is afield. Was the USA the natural gas leader for many decades? Not if your decades include 2000 to 2010, no. Was the Russia the leader for many years? Yes, if 7 can be said to be many.
If Rockman had 7 daughters he would say he had many daughters. If Rockman lived in an unhappy marriage for 7 years he would say this marriage lasted for many years.
7 is many, no?
7 is many in decades, but not in years, months, weeks or days.
Alan
This word many, I don't think it means what you think it means.
But suffice it to say that "the US has been the world leader in natural gas production for decades" is patently false. Russia was the world leader in marketed natural gas production for the aughts.
This is clear from this chart.
http://www.eia.gov/todayinenergy/detail.cfm?id=5370
But if you look up the underlying data and look at marketed natural gas production it will also be true.
I would be willing to believe that the Russia is also the leading producer of natural gas (marketed natural gas mind you) for the lifetime of Rockman's daughter but I have not done this calculation.
The more pressing question is not comparing to Russia - but will there be enough US natural gas at reasonable prices in 65 years.
I think the answer is almost certainly going to be no.
Alan
Predictions are hard, especially about the future, and double especially about the future 65 years out.
But if you agree that "American peak gas" has been delayed for multiple decades, OK, that is a reasonable point of agreement.
I will agree that the undulating plateau of US natural gas production has been prolonged by at least one decade, quite possibly two.
Little impact on US NG supplies in 2077.
Alan
And globally, is there any reason why shale fracking will not spread to many parts of the globe?
It depends on geology and the local environment (drilling support, closeness to markets, etc.).
The failure of fracing in Poland for example. Geology was not that good.
I neither expect success or failure of fracing elsewhere - it depends on unknowns.
It is most certianly not something that can be counted on. And as time goes by without a comparable elsewhere in the world, I begin to wonder if we have some conditions that are fairly unique.
Alan
There is still work on fracking in Poland. I would think if there is no shale gas coming out of Poland by 2015 then we can call fracking in Poland a failure.
I would say that is true globally as well. Certainly there must be shales around the world similar to the US. If there is no meaningful production of shale in any of South America, Asia, Europe by 2015 than one would wonder, but I would be very very surprised if this were still true. It would be shocking, really. China will almost surely have a decent amount of shale gas by then - not a lot but some.
Yep, sums up the level of debate when this is required.
NAOM
It's nice when kids learn, but not when they are deluded.
Russia led the world in natural gas production for the aughts, this is a basic fact.
Another is that US natural gas production has increased significantly since 2009 - Berman creates charts that say otherwise but he appears to be wrong.
You mean "dry natural gas production."
From Deborah Rogers' article:
Now you guys know what Art has been putting up with for several years.
I think that these series of personal, and as best that I can tell, totally unsubstantiated, attacks on Art have far more to do with Art being right, e.g., the recent USGS report linked up the thread, and very little to do with Art being wrong about something.
What would appear to be really pissing the shale promoters off is that much of what Art has predicted is being borne out by recent events and by independent reports.
Shoot the messenger; it's all they know.
Looking at the same chart Pete keeps referencing, set to annual production, 2011 production is only a few percent above 1973, this despite "utilization of new technology" and massive investment (little real profit). They refuse to acknowledge that fracking and shale plays are very real indicators that we are scraping the bottom of the barrel. Burn it all; it's what we do.
http://www.eia.gov/dnav/ng/hist/n9050us2A.htm
If Pete and his friends think this is indicative of a "gas energy revolution", and that natural gas (most of which has already been allocated) will save our waste-based, highly extractive culture, I have a beach house in New Jersey he may be interested in. Here in an age of declining finite resources, it's interesting to watch those who occupy their time grabbing at straws.
From the chart:
1973 production: 22,647,549
2011 production: 24,169,613
What is obvious is that these folks need to drive the price of natural gas much higher before they lose their financial a$$es.
OK if you think the reduction in price and the increase in supply of natural gas is short of revolutionairy, then fine, believe that.
There is no doubt that without fracking the US would be in dire straits with re: to gas.
(If you read your history, you would also not doubt that the developments of better drill bit technologies was needed for the American oil boom of 1930s to 1970s).
What I want to know is why Berman's graph differs so radically from the EIA graph. Bermans graph does indicate a plateau in 2009. The EIA's doesn't. Does Berman stand by his graph and continue to believe that the EIA is very much in the wrong with re: to past production?
Somebody is greviously wrong - either Berman or the EIA. If Berman thinks the EIAs record of gas production from early 2009 to late 2011 is wrong why won't he say so? If he thinks the EIA is right and his previous numbers are right why won't he say so?
Are his production charts here similarly disconnected from the EIA numbers? If not, why does he sometimes present production numbers consistent with the EIA and sometimes inconsisntent?
It is kind of a big deal to say the EIA is off by 10 or 15 percent. It is an even bigger deal to say they are 2 years on, after they have had plenty of time to update their production estimates. Most people think EIA production estimates are pretty good when published, and really good 2 years on. Does Berman think this is true or does he think the EIA is out to lunch?
6.7% increase in 38 years. 0.17% a year.
TBH it is clear that both coal and NG could have been increased a lot more over the decades but there wasn't the demand relative to oil. On a BTU basis both are ridiculously cheap. With 'conventional' US NG showing signs of peaking 10 years ago, fracking took off on the price signal, but as usual the market was overplayed just in time for the blow back from 2007/8, and with investors desperate to throw good money after bad, the drilling continued long enough for gas to start taking market share away from coal. Now reality is in the process of returning to the NG market, and we will flip back into high NG prices as falling shale production hits rising demand. It will all level out for a while, at higher NG prices, and coal will slowly become king again, if PO and hurricanes haven't reduced us to mad max in the mean time.
"6.7% increase in 38 years. 0.17% a year."
That is correct but I would argue a misleading way to look at the data. There was a long slow decline, then a sharper decline, then a completely unexpected sharp increase.
And of course the USA in 1973 used (or misused) natural gas very differently than now. We now have much better pipelines and infrastructure, better natural gas generators for utilities, many many more homes with natural gas heating, water heaters, natural gas dryers, on and on.
But fine, if you want to think the USA will grow natural gas by 0.17 percent a year for the forseeable future go ahead. I simply want to understand how Mr. Berman comes up with these production charts - he has presented a chart just recently that looks inaccurate in as much as it completely at odds with the EIA production charts.
1973 US Population approx 212 million
2011 US Population approx 310 million
Per capita production of natural gas in the US has shown a large decrease. In recent years imports of natural gas into the US have more than tripled in spite of the recession and the out sourcing of natural gas consuming industries to other countries.
If you want to go this direction you should show the price of natural gas in 1973 relative to median household income.
In other words, if Americans were willing to pay the same proportion of their income for a BTU of gas now as they were in 1973 than perhaps per-capita production would be at the same levels.
The per-capita production numbers tend to piddle out when you compare them to median income. People are paying a smaller slice of their paycheck for energy. If people wanted more energy, they would be willing to pay more and production would rise.
I know many of you will disagree with this, but at least put up the prices relative to median income to give some context.
OK I ask a question about Art's production charts from just a few months ago, and my posts are removed.
I guess you guys don't believe in free and open discussion.
Something to think about. Maybe if people were allowed to post freely and TOD posters were expected to stand by their previous work then TOD would be more popular and people would be more interested in what you have to say.
When you throw someone out the door for daring to disagree you simply create an echo chamber and marginalize yourself.
All I want is simple answer - does Berman believe his production chart for natural gas from a few months ago? (which was quite shocking and controversial when published). Or was this chart misquoted and misinterpreted by Mr. Nelder (who published it in a few places)? Or was this chart simply a mistake by Berman?
It is a pretty simple question and since Mr. Berman continues to throw up production charts (using EIA numbers) it seems relevant.
I hope this post isn't removed but it probably will be.
Cheers
Pete
Gosh, Pete, I count 24 posts from you (still remaining), quite a lot for someone who has been a member for less than 21 hours; about 25% of the comments.
"All I want is simple answer"... doesn't mean you're entitled to one. Suggest being a little less abrasive and confrontational.
That is fine. Like I said, Berman puts up production charts here, but his production charts in the past are very unusual. He doesn't want to discuss his chart of a few months ago and expects people to simply believe his current charts, OK, he can do that. And on TOD that is perhaps acceptable, but one should recognize this is not acceptable outside of TOD.
Two things: You've made your point quite clear; and nobody here can force Art to respond. Perhaps you want the entire post removed?
"...expects people to simply believe his current charts..." Since he's submitted them for examination and comment, and since many of your counter-arguments remain, I don't think that holds water. This site isn't about Art's expectations, or your's for that matter.
"Perhaps you want the entire post removed?"
The smarter planet post with Art's chart? I suppose if Art gets it removed it would be a tacit admission of his mistake, albeit not a very honorable admission. At any rate, everything on the internet is preserved for all time on the way back machine (run by my friend Brewster Kahle just for this sort of thing) so there is no point in him taking it down.
I want Art to provide an explanation for his production chart of a few months ago. Otherwise, I will find it difficult to believe his current production charts, and so will many other people.
You're free to post your own 'more accurate' chart and have it "preserved for all time". I'm sure many here would like to see it. I'll enjoy your explanation as to why it's a much more 'honest' analysis than Art's. Looking forward to it. Be sure to put your real name on it, as Art has.
I believe the EIA production chart is correct. I have said this many times.
Either the EIA production chart is incorrect or Art's previous chart is incorrect. Which do you believe?
And if the former, what exactly is the point of this post, which appears to rely heavily on the EIA data in many places?
If the latter, is there any assurance that whatever mistake Art made in creating the previous chart isn't being repeated in some of the charts here?
Why is this question so controversial? I honestly don't understand, most people stand by their work, explain their mistakes when they make them, etc.
Yeah, you've made your point more than once. It's "preserved for all time". You seem to have a problem with unresolved issues...
It's not the question that's controversial, it's you. Instead of approaching the topic in an attempt to foster conversation, you began by throwing about hyperbolic language in an accusatory tone.
In the same vein, you didn't wait for any response or discussion from Art before you jumped into impugning his current post because of the post from 8 months ago. Who are you and why do you care so much?
The worst of it is that your aggressive style has damaged the possibility of having an honest conversation about Art's previous post on natural gas.
Your very first post mentioning Art's name or chart contained this:
"But my point with re: to natural gas is to simply ask Mr. Berman for an explanation for his fictionalized graph of natural gas production here."
http://www.theoildrum.com/node/9584#comment-926619
You'd been a member of the site for only a few minutes then and you started by accusing someone of "fictionalizing" graphs. Then you kept the attacks up, getting nastier and nastier. No matter how correct you might or might not be, do you honestly think anybody will want to discuss anything with a person displaying your attitude? You burnt your chances from your first post!
OK, I will try to be nicer.
I am Peter Taibei I have been called Pete The Bee since I was little.
I think Art Berman's production graph is very much wrong. Perhaps fictionalized is not the correct word, perhaps he made an honest mistake.
Or perhaps the EIA production numbers are wrong, but that seems very unlikely.
Either Art Berman/Chris Nelder are wrong or the EIA is wrong? Which is it?
We welcome free discourse supported by data.
I removed some posts by you and others due to the personal attacks contained in them.
Also, your enthusiasm is appreciated, but TOD also discourages readers from "hogging" threads.
Best to all,
Kate
Is your definition of "hogging" actually just responding to people?
Some people say "you're wrong", then I respond, and you remove my response, but not the original comment.
Is that really the way you want to moderate?
It's your forum, but that is not fair by any reasonable reckoning.
In my opinion the moderating is excellent. There is plenty of leeway for diverse viewpoints. But generally I do not wish to have good posts overwhelmed by 40 posts on 9/11 conspiracies, 40 posts telling me how to vote, spammers selling kewpie dolls or repetitive posts in general. I have no problem with the guidelines.
I've only removed comments with personal attacks.
The original comments I've left in the threads because they didn't contain anything objectionable. It's always possible to reframe your arguments within TOD commenting guidelines.
TOD commenting guidelines - http://www.theoildrum.com/special/guidelines
The threads can be tricky to cull because taking one or two comments out of a thread can cause an entire thread to disappear. Sometimes it's possible to restore some while keeping the objectionable ones out, but this doesn't always work.
There's no specific written prohibition about how many times readers may respond to other comments, but it's generally accepted that people not dominate a thread with the similar arguments repeatedly.
I'm sorry for any inconvenience I've caused.
Clearly a fair number of responses agree that the discrepancy between Berman and the EIA is worth considering, that is why there were so many response.
Also there was the matter of marketed dry natural gas production. Some posters (Rockman, Rockman's daughter, a few others) were looking at gross production not marketed production, as they should have. I feel that I was able to help people by instructing them as to the correct way to measure total natural gas production. Rockman was confused on this score, now I believe he will not make that mistake again. He works in the industry in some fashion (perhaps boots on the ground) but it is still better that he learns such things, no? I was happy to instruct him, just a little, there are no hard feelings. Everyone learns.
One thing on these 'self-sufficiency' arguments is that they do have a point on "North American Self-Sufficiency". We now import much more from Canada and less from the middle-east. And this does improve the national security issue with oil imports . . . we are less dependent on oil imports from a volatile part of the world filled with people that hate us. So that is at least one legit point they have.
However, that does almost nothing for the trade deficit, pollution, economic dependency, CO2 output, and other issues. In fact, switching to tar sand oil imports instead of conventional oil imports makes the pollution/CO2 issues worse.
http://nextbigfuture.com/2012/11/us-daily-crude-oil-production-at-667.html
The EIA shows Texas oil production is over 2 million barrels per day in August. Texas was last at this level in 1988.
US daily oil production was 6.67 million barrels per day for the week of Oct 26 which was up 59,000 barrels per day. The US is averaging 500,000 barrels per day more in 2012 than in 2011. The four week average is up 12.9% from the same period in 2011. This is the highest daily US crude oil production level since 1994.
The daily US all oil liquid production (including natural gas liquids and ethanol) is at 10.97 million barrels per day.
Advancednano,
When you look at the data from the Texas Railroad Commission(TRRC), for both crude+condensate and for grosswithdrawals of natural gas, and compare it to EIA data there are fairly large differences starting in the middle of 2011.
West Texas has pointed to these differences in the past. There may be a good explanation for the large differences, clearly they cannot both be correct.
One possible explanation is that the rotary rig count levelled off in the fall of 2011 and the EIA did not recognize this change.
I would be interested in the perspective of oil industry people who would know much more than me. Thanks.
DC
It turns out that the Texas RRC is not counting condensate in the oil production numbers.
westtexas,
The condensate is included in my chart for texas (I used the general production query from the online research at the RRC and included both the crude and condensate columns). That is why the EIA and RRC data agree up to 2011.
The following indicates a possible solution:
http://seekingalpha.com/article/663271-the-texas-natural-gas-mystery-solved
http://www.eia.gov/oil_gas/natural_gas/data_publications/eia914/eia914me...
In my estimation the EIA data will be more accurate than the RRC data for the most recent 12 months.
Art's chart was pointing out the differences between state level data and EIA data, and I believe a close reading of the EIA document explains these differences. Basically the state level reports don't include all production until about a year later. EIA uses statistics to make a better estimate.
DC
petethebee
I have a great deal of respect for Art Berman and Chris Nelder, but I think it would help the discussion to admit
that the shale gas explosion was unprecedented and unexpected--by everyone.
"Everyone" in 2003--the EIA, Simmons, NPC--knew that we'd need to be importing 10 billion cubic feet a day
of LNG by 2012 or 2015.
By my reckoning, the growth in shale gas production has been the single largest, most rapid, largest sugar rush of
new energy into the American economy in the last 50 years.
24 bcf/d is the equivalent of about 4 million barrels/day of crude oil. Or more than 2x Prudhoe at flush production.
The Haynesville alone went, in the space of just 3 or 4 years from nothing to as much gas from that single field as we
produce from many tens of thousands of wells in Colorado.
The Berman/Nelder claim that production was on an undulating plateau after 2009 was wrong. So what, lots of things are wrong.
Where Berman was right (see the Sunday NYTimes article from a few weeks back, must read) was that these shale gas plays were
losing money big time, and for that he was roundly excoriated by everyone in the nat gas industry.
The claim that American has "100 years of gas" looks way off to me. The gas industry promised me 100 years and shorted me 50 looks to be
more like it, when you actually study the plays and what they are likely to produce. A number of the shale gas plays have already plateaued and some
are in decline.
As for whether Russia or the US were/are the world's leading gas producer... not sure who cares or what the relevance is.
America is extraordinarily endowed with fossil fuel. Wyoming produces more energy, in BTU, than all but about 5 nations on Earth.
Most of us at TOD missed an early and complete appreciation of what shale gas and tight oil would amount to, but so did Exxon.
Look HPDI is a company, they try to make money with their reputation.
Art Berman creates a graph of US production that is completely at odds with the EIA and puts HDMI's name all over the graph and his post, and then he never, ever, admitting to a mistake ever again.
Anticipating a change and reporting on that change are different things. Berman and Nelder failed to anticipate shale gas - I agree, no big deal.
But they (and they alone) reported that the EIA is wildly inaccurate in their production numbers.
How many Purdhoe bays are there between Berman's production numbers and the EIA's production numbers?
And again, if Berman and Nelder want to post up bogus production numbers, and never revise/correct them, then why should we trust their current postings re: production?
Who else posts up production numbers that are so far off from the EIA? Exxon does this? No.
Is there 100 years of gas, or 50, or 20, or 10?
I am not interested in this question. After one game changer of this magnitude, I think we should all stop taking about how much gas is there in the USA for at least 5 years. We have no idea where this learning curve is going. The reserve estimates of 10 years ago have been utterly destroyed, anyone who thinks the reserve estimates of today (10 or 100) are terribly accurate is a fool.
Perhaps in 5 years things will have stabilized a bit and we can really understand how much gas is there.
I see Mr. Berman has hit a nerve-
Let reality sort it out--
To be clear, my complaint is that Mr. Berman data essentially says the EIA isn't doing their jobs. Perhaps the EIA is in the bag for Obama, overstating production numbers to make Obama look good?
Any number of conspiracy theories can be spinned once you say 20 months worth of EIA production data is incorrect.
I simply say, ahh, here is the simplest explantion, that Berman is wrong and not the EIA. Perhaps Mr. Berman can verify this common sense conclusion.
However, this suggestion clearly makes people very angry. Art Berman is a nice guy, perhaps one should simply let these things slide. That would be my instinct as well, but there are other people (Chris Nelder) now trumpeting this data, which in turn points back to Art Berman's original post, which in turn points to HPDI. So if Mr. Nelder will continue to bring this up in other media it is reasonable to say "let's get to the bottom of this, or else HPDI's reputation for accuracy can be besmirched".
Because if Art Berman did his analysis correctly, then HPDI is in conflict with the EIA data. Why pay for HPDI data if it is so inaccurate? HPDI's customers will believe the EIA data is reasonably accurate, I can assure you.
OK--
Let see how shale adds to the future----
I'm a materialist.
The EIA's chart can not be correct because it states the vertical axis is in "trillion cubic feet," not tcf/month. You may be correct that the EIA chart represents dry natural gas production, but that means the title is also mislabeled. By your theory, you are comparing two charts with errors. Because the data is in a sorry state, the prudent course is to discard both.
The web page is here
http://www.eia.gov/dnav/ng/hist/n9050us2M.htm
The word trillion does not appear.
The chart is simply a plot of the table.
The table lists monthly production number in million cubic feet.
Like Captain America says, I can do this all day. Every time you say the EIA chart is mislabeled I will explain the labeling of the chart to demonstrate that it is not mislabeled.
You will need a better explanation for Berman's graph than "all charts are mislabeled".
Worth asking. Maybe Art needs some time to go back and look things over. If it were me, I would.
Sure, if Art says "give me a few weeks to revisit this topic and see where I went sideways", fabulous!
Perhaps he can ask Chris Nelder to stop pointing to this data as well.
I would be surprised if HDPI did not have words with Art Berman over this. One errant post is fine, but Chris Nelder took Art's chart and ran it all over town, made a big ta do over it.
Pete,
it's pretty clear what's going on here...I had the same type of argument with the same people. It aint's worth it.
http://www.theoildrum.com/node/5634
http://www.theoildrum.com/node/8959
Can you summarize? Is it that they just won't believe the gas is being produced?
Stabilization won't reflect how much gas there is, but how much can be produced at whatever the current costs at that point may be. Any production rate is a loose measure of a resource base, at best, but a solid follower of price. NG vs Oil price diversity and US vs World price spreads will affect production levels significantly, as will availability of infrastructure to effectively get products to market (a significant current issue).
Viewing recent NG production as an independent phenomenon is of little import, in my opinion. There are so many factors that led to the current US-centric gas glut:
- Drilling infrastructure available to rapidly respond to NG price signals
- Private ownership of mineral rights, with resources largely in rural areas
- Aggressive independent gas companies who compete for reserves
- Ready access to cheap capital with few competitive investments
- High oil prices (a fungible commodity) in plays with associated NG (nowhere near as fungible)
- A broad existing gas and oil gathering and pipeline network with infrastructure from past booms
- Improving automation technology for artificial lift and enhanced recovery
- Available hoz well and frack technology able to exploit shale economically at existing oil prices
- A strong local market for NG and aggressive personalities (like Pickens) to excite an enthusiastic market
Whether the recent spike in production is indicative of a new, higher plateau or simply a temporary spike up is a minor point to me, like arguing whether a 2005 oik peak or a 2012 peak or 2015 peak manifests. I think it is clear that there is a lot of $12 NG, and that is a pretty fair price in a plateau of $90 oil. I am positive there is no where near as much $3 NG.
I am pretty sure Art, Bee, WT, Rock, and many others here understand the underlying dynamics I outline above better than I, and yet I cannot help but wonder why there are so many discussions here about rates and peaks versus reserves at given cost points. Sure, rates determine consumer availability, but costs reflect economic viability.
Randy,
A small clarification. As noted up the thread, as best that I can tell, Art never said that the undulating plateau started in 2009.
I have highlighted the relevant portion of Art's February, 2012 article, in bold. Based the latest available EIA data, I would argue that Art's analysis of the state-level data accurately predicted what the EIA is now showing, to-wit, that monthly US dry natural gas production has not materially exceeded (through July, 2012) 2 TCF per month since October, 2011.
http://www.theoildrum.com/node/8914
After The Gold Rush: A Perspective on Future U.S. Natural Gas Supply and Price
Posted by aeberman on February 8, 2012
Monthly US Dry Natural Gas Production:
http://www.eia.gov/dnav/ng/hist/n9070us2m.htm
As also noted up the thread, in my opinion the renewed, or more accurately, the continuing assault on Art has far more to do with Art being right than with him being wrong. I previously linked the following summary of a recent USGS report on EUR's for various shale gas plays:
USGS releases damning EUR’s for shale:
http://energybulletin.net/stories/2012-09-04/usgs-releases-damning-eur%E...
Here is the key question, which Art has previously addressed: Once the shale gas players materially reduce their drilling, which they have now done, will they be able to catch up with the very high underlying decline rates from existing wells? I suspect that the overall natural gas (NG) decline rate from existing wellbores is much higher now than at the start of the shale gas drilling boom.
rudall – Good post. A few points (some borderline picky). “Everyone in 2003…knew that we'd need to be importing 10 billion cubic feet a day of LNG by 2012 or 2015.” I suspect many, if not all, that made such a prediction didn’t miss the increase in domestic NG production as much as they didn’t anticipate the coming economic meltdown. No model is never more accurate then the assumptions used to create it.
“By my reckoning, the growth in shale gas production has been the single largest, most rapid, largest sugar rush of new energy into the American economy in the last 50 years.” It’s been good but from 1956 to 1971 domestic NG increased 100% from 12 tcf/yr to 24 tcf/yr. So that jump ended 42 years ago, Not 50 but I’ll spot you 8 years. LOL. But according to the EIA NG production has increased 22.1% in the last 6 years. Not very impressive compared to 100%. But it is interesting to note that NG production increased at about the same rate (0.8 bcf/yr) during both periods. For a similar 6 year period (Dec 1988 – Dec 1994) NG increased 13.1%. Not quite as good as the increase in the last 6 years but still not chicken feed.
“24 bcf/d is the equivalent of about 4 million barrels/day of crude oil. Or more than 2x Prudhoe at flush production.” You seem to be implying shale gas production has increased the energy equivalent of 2X Prudhoe. Do I misread you? About 82% of current production was coming from conventional fields prior to the shale gas boom. Additionally not all the NG coming to market in the last 6 years has come from the shales. For instance during this period the Independence Deep Water Hub came on at 1 bcf/day. That one event represents about 20% on the increase during this period.
Picky point about the Haynesville Shale: not a field but a trend. Otherwise I don’t think folks have been paying enough attention to this trend. A healthy rise in NG prices and it could boom big time again.
“As for whether Russia or the US were/are the world's leading gas producer... not sure who cares or what the relevance is”. Couldn’t agree more. But then again I never said it was, did I? I was just correcting an inaccurate impression being offered. As the reference I supplied clearly shows the US and Russia have swapped back and forth the title of largest NG producer since the mid 70’s although for the majority of that period the US held the title. And prior to 1975 the US clearly dominated the contest…at one point producing 3X as much as Russia. Integrate the curves and the US has produced more NG than Russia. And in the future who will claim the title? As you say: Who cares? I, for one, don’t either.
As far as Pete goes I think he’s done TOD a good service whether you agree with him or not. A tad caustic at times perhaps but whom am I to criticize? LOL. Sometimes I think we can be a tad complacent and should be pushed to defend our positions. As been said before: what doesn’t kill you makes you stronger.
BTW you might be surprised how many in the oil patch did appreciate the potential of the various shale plays. At one point the Austin Chalk (a fractured carbonate shale) was the hottest drilling play in Texas many years ago. It was developed using the same horizontal drilling and frac tech used today. We all looked at the other Texas shales at the time (there are others besides the Eagle Ford). Over 20 years ago one company with over 600 nearly depleted AC wells offer a contract to any service company that could side track a horizontal hole from those wells into the EFS or any other fractured shale (Georgetown, Buda) in the section profitably. No one won the contract...prices weren't high enough then. Heck, over 30 years ago I pumped a 500,000# frac into a shale in the Edwards Formation. High NG prices at the time made it seem like a good idea, Turned out it was a very bad idea. LOL
It was just a question of waiting till prices got high enough. And the fact that the pubco have been having a major problem finding enough conventional wls to drill.
Rock
I always enjoy your thoughts on the biz.
As per your comment above, I stand by the statement that the 26 bcf/day increase in US shale gas production
between 2000 and 2012 represents the largest infusion of new energy into the American economy in many decades.
Prudhoe, flush, was about 1.5 MBd, as I recall. http://tinyurl.com/b345kyy
So... is this a "revolution"? Is it a game changer? The coal industry would sure as hell say it was.
Cheniere would sure as hell say it was, since it stranded their billion dollar investment in LNG imports. The game
changer isn't doing wind industry any favors, either. Or the CBM play in the PRB for that matter. Or the Russians.
Perhaps in 2000 or thereabouts, I think some of you guys in the biz understood that the Barnett wasn't a one-off, but the EIA certainly early in the last decade and even the NPC was saying we gonna need 10 bcf/day of LNG imports. Dozens of LNG terminals were planned. People in the biz were frankly freaked by the first year decline rates they were seeing in Texas conventional wells. 56% was the number in an OGJournal article from that period by a respected analyst. Swindell?
-------
I think at TOD we get stuck in defending our EROEI, finite fuel, steep decline rate world view--and that has prevented many of us from fully appreciated what the industry and technology have wrought.
At the same time, the cheerleading about shale gas and shale oil seems so over the top sometimes, and so ignorant of climate change and so heedless of what these staggering depletion rates in shale wells really mean... that an autoimmune reaction is going to be fierce, particularly at this web site.
Recall that the 1.5 mbd from Prudhoe... this came from 200 wells. Just 200. I think there's still fewer than 600 production wells there now.
And how many shale wells has it taken to get to 26 bcf/day. Don't have that number, but am guessing we've drilled about 240,000 gas wells in the U.S. since 2000, perhaps 40% into the shales. Would be interested in seeing the real number, if someone has it handy. But certainly the number of shale gas wells must now number 30,000 or more.
The o/g industry has leased at least 10% of the Lower 48 now, and will need to drill perhaps 1,000,000 to 2,000,000 gas wells
over the coming century for the "100 year promise" to pan out.
And then? What comes then, pray tell?
I think what so many people miss is that it's not turtles all the way down. Shales are the source rocks. Once they're drilled up, well then all bets are on abiotic gas and hydrates. LOL
At this point I haven't a clue what got peteTheBee's dander up. There was a point where I thought I did, around the 'undulating plateau' point of the day's bombardment so at that time I thought I'd take a look at how the shale gas 'revolution' ('retirement party') has affected Canadian gas production.
NG production peaked in 2002 and is now at 1995 levels of production. (you'll have to click through as the chart is rendered with javascript so no image url available to display image)
NG Storage levels in Canada are well above the five year maximum average according to the Canadian Gas Association
NG well drilling in 2012 has been below the five year minimum average according to the Canadian Gas Association
So NG drilling in Canada is way down, storage is filling up, and more importantly production is dropping fast.
The fracking of shale gas in the U.S. that was juiced up by Wall Street seems to have served to reduce production in Canada. And NG is a North American market. Driving prices for gas below real costs is going to have some wicked side effects.
As Rex Tillerson said...
Art was pretty clear that the economics of shale gas don't make sense. The financial play that is shale gas may have raised production in the U.S. (however little) but it has ended up lowering production in Canada.
It is not complicated. US marketed natural gas production from 2008 until 2012.
Art Berman says one thing, the EIA say another. Who is correct?
I agree, Rex Tillerson is losing money when natural gas goes to 2.50. This doesn't bother me.
I'm not sure, petebee, what scientific training if any you have. You've given your name. What is your profession? What expertise do you claim in this discussion, if any?
You've identified one basic problem, being the discrepancy between Art Berman's charted US natural gas production, and the EIA's. If your quarrel was over the semantics of what consitutes an "undulating plateau", I think it's been made clear enough times in this thread alone that descriptive terms can vary widely from one user to the next, and are ultimately a matter of convention.
I'm no petroleum engineer--rather an underwater acoustician--but I do understand the principle of uncertainty. There is no such thing as a perfect measurement. Tiny variations in the environment below the threshold of our best detectors--and these variations occur within the instruments as well--combine to produce apparently random variations in the results. Of course this leaves larger, systemic bias-producing errors, which we try to eliminate by examining the data and correcting our methods and equipment. However, on the best of days, our results are uncertain. Even if, by some chance, the sonar were to log a perfectly accurate--down to the micrometer--depth from transducer face to sea floor directly beneath, well, we wouldn't have standards accurate enough to recognize it as perfect! It's a conundrum.
Fossil fuel economics is no physical science. There is no way to ground truth reported production statistics from OPEC states, or any other sovereign state for that matter. Even well-by-well data from the US depends on the varying expertise and methods of the reporting persons, and can't be verified by such simple methods as we use with single- and multibeams as a bar check.
I am driving at a point: that it is very possible for different reporting agencies, and different tabulators, to reach different results when compiling things such as production data. Even a relative outside observer like me sees enough discrepancy on a regular basis between OPEC, IEA and EIA production statistics, to name just a very few, to realize that there is no one perfect measurement of fossil fuel output. The observed variation is a prima facie confirmation of that. You can label one or another falsified, or biased, or untrue, but the fact of the variation speaks for itself. It is no different in the physical sciences. For two different scientists to agree that two different results--say, depth measurements of 4015.8 and 4032.7 m--are the same, requires a common set of assumptions between the two.
What could be the cause of the difference between Berman's and the EIA's data? Since I'm not a petroleum engineer, I can't fully answer that question. However, one possibility is that they draw from different primary data sets. Is it guaranteed that both graphs include the very same set of wells? Were some of the data from wells common to both graphs adjusted between the reports? I can't know the answers to any of these questions but suffice it to say, that I can imagine sufficient complexity for the graphs to diverge.
Of course, any divergence is made much starker by the EIA's chart extending into projections, which Berman's does not. The eye can be easily conditioned by what appears later in a graph to reinterpret what appears before.
My point in all of this is that you make a category mistake in stating that only one--Berman or the EIA--must be correct. Unfortunately, the world of physical measurements is not so binary, a matter of "right" and "wrong"--unless one committed a gross blunder, or deliberate fraud. You have accused Berman of both, while attaching an arbitrary, bordering on mystical, faith in the correctness of the EIA stats, when in fact westexas provided you with an observation-based characterization of the EIA's statistics. Your thinking is simplistic in this case, and your tone, as has been remarked on several occasions, has made you no friends. If your interest in the discrepancy between Berman's and the EIA's plot is sincere--and I don't believe it is--but if your interest is in fact sincere, you might better begin with the question, "How did Berman arrive at a different production plot?" Perhaps, should the author himself have eventually answered, you would have begun learning the actual method behind the result.
"My point in all of this is that you make a category mistake in stating that only one--Berman or the EIA--must be correct. "
They cannot both be reasonably accurate. They are so far apart that one, or the other, is far removed reality.
It is not a matter of being off by 2% it is a matter of being off by 15 percent.
If Berman's graph is right the entire shale gas production story is a massive fraud.
Pete,
At this point, I have to say that you seem to be missing the forest for the trees.
Andrew
Perhaps the response is "we don't care whether or not Art Berman's graphs are off by 15%".
OK, but if his level of accuracy is plus or minus 15% than it does leave a very wide range of interpretation, no? Look at his graphs here, and imagine them all underestimating the actual numbers by 15%. Would the post still make sense? No. The numbers need to be reasonably close to reality (say within a few percent) for them to make sense.
I think the EIA graphs on the EIA web pages are that close. I have clearly identified a Berman graph that is quite inconsistent with the EIA data, so one or the other is far off from reality.
I did enjoy the response that said "you are making a mistake when you think Berman or the EIA must be wrong". That was a funny line of thought - they both address the same issue, they have very different data, and yet they can both be right.
Isn't it much more accurate to say one or the other is wrong.
Do you want to just make numbers up? Or do you want to look at real data?
In oil, there are occasionally major differences between the major players - EIA, IEA, BP & JODI.
Getting good statistics is a statistical game, with error bars, as well.
Alan
PS: Rockman is "boots on the ground" but also MUCH more than that.
Have we seen those kinds of differences for US statistics?
For, say, KSA production, the EIA is just one of many sources. For the US, it's the offical national source.
Nobody disagrees with the EIA gas numbers 20 months on to the extent that Berman does. Hence my belief he is simply playing games to make his numbers come out small, without actually having the courage to say "the EIA is wrong".
I would respect him more if he had the courage to describe his graphs in clear language.
how the shale gas 'revolution' ('retirement party') has affected Canadian gas production
A bit of inside information - Canadian NG production is not backed by a lot of reserves. It peaked around 2000 and is now on the downslope of the classic Hubbert curve - and the decline is starting to get to the steep part of the curve.
What the US shale gas 'revolution' is doing is disguising the decline in Canadian exports from US consumers. Otherwise, there might be some tension and conflict arising from it, because Western Canadian provincial governments are curtailing exports and diverting the declining supplies to domestic consumers. Consumers in Central Canada are also being curtailed, and those provinces are importing more NG from the US.
However, because of the glut of US shale gas, it's all sweetness and warmth in the consumer markets, both US and Canadian.
Also, note the Canadian consumption curve. The sharp upturn in recent years is NG going to the oil sands plants as oil sands production increases. This NG is being removed from the volumes being exported to the US under Alberta government allocation rules. Don't assume the Alberta government can't do this because it can under the Canadian constitution.
Canada does have substantial shale gas resources, and Canadian companies are familiar with horizontal drilling and frac'ing, having used them for decades. However, unlike US companies they are not going to drill shale gas wells if it is uneconomic to do so. They are waiting for higher prices.
RMG:
A question. Some of the shale play maps one sees show these huge shale plays in Canuck-land.
The Montney, Horn River etc, and one certainly read a full ration of articles claiming that the Canadian shales were as
super-abundant as the U.S. ones.
Is there any truth to those impressions, and if so is it simply price and distance to markets that has slowed their extraction?
Could Canadian gas production rebound if N Am gas prices went to 5 or 6/mcf?
US gas exploration (starting with new leases, etc.) will restart somewhere between $7 and $9 mcf.
At least that is the estimates I have heard.
Alan
IMHO, the large area on the maps is a partial function of the map projection.
On the other hand, having worked "north of 58 recently" (i.e., I'm not telling you where, because the leaseholder screwed it up), the areas are also large and cold.
The Horn River Basin is ~ 75 miles east to west and ~120 miles north to south.
The Cordova Embayment is ~30 miles east to west by ~90 miles north to south.
The Liard Basin (more Frontier) is ~60 miles east to west and 120 miles north to south.
The next stop would be the Mackenzie Delta (smirk, smirk, because my name is on some of the GSC maps).
In contrast, the Fort Worth Basin is ~150 miles by ~150 miles, and the gas sweet spot at the Newark East field is ~30 mils by 30 miles.
And there's not much financial interest in conventional gas in the WCSB. Too many people, including some very well known players, have lost their shirts.
I'm looking for oil in Africa.
The Canadian shale gas formations are indeed as abundant as the US ones, but the drilling conditions are much more difficult (no roads, bottomless peat bogs, extremely cold winters) and they are a lot further from market, meaning transportation costs are much higher.
They would require higher prices than US ones to trigger a drilling frenzy - e.g. $10/mcf or so. However if NG was priced at an energy equivalent level with Brent oil, it would fetch $16-18/mcf, and that would be enough to cause a drilling frenzy.
The current glut of US shale gas would have to disappear off the market for that to happen, which is always possible, but I'm not holding my breath.
The original data skeptic was L.F. (Buz) Ivanhoe
http://hubbert.mines.edu/news/Ivanhoe_96-1.pdf
OK, to be clear I was invited to comment here by robert wilson who told me "If you had Gail’s courage you would go to TOD and tell him, not us. I will be watching to see if you have the cojones – and competence to confront him mano-a mano."
I asked a very reasonable question with re: to the dramatic differences between Art Bermans assessment of natural gas production the EIA, and Mr. Berman declined to discuss the matter in any form.
Perhaps sometime later he will be more interested in some form of discussions.
Enjoy your dirt cheap energy (coal and natural gas) fellow North Americans! It will last for quite some time, most likely long enough for Rockman to enjoy a grand daughter and explain to her the difference between gross withdrawls and dry marketed natural gas.
Enjoy the continuing economic collapse Pete as high energy prices destroy the ability to grow economies other than by adding debt. I am completely underwhelmed with your comments as usual.
I agree that the Peak Energy movement should begin discussing debt instead of peak energy as peak energy has been destroyed by fracking.
I believe that you overstate the contribution.
However, if you believe so, buy stock in contract drillers and drilling supply companies - for we shall have to have an exponentially increasing # of drilling rigs working for as long as we can increase the #.
Alan
Got it.
Discrete wells peak and decline.
Discrete fields, the sum of discrete wells, peak and decline.
Discrete regions, the sum of discrete fields, peak and decline.
But the world, the sum of discrete regions, will never peak and decline.
Actually, this is a pretty good summation of the conventional wisdom regarding energy, to-wit, discrete wells peak and decline, but the sum of the output of discrete wells will never peak and decline.
The amount of shale that can be commerically fracked if oil is over $90, or natural gas is over $5, or oil is over $60 and gas is over $4, is staggering. And one of those three conditions will be true for the forseeable future, perhaps all three. And if none of those conditions are true then energy will be extremely cheap.
World oil consumption is 1,000 barrels/second.
Merely "staggering amounts of resources" are inadequate, especially if we start using 1,020 barrels/second and then 1,044 barrels/second, ... because energy is cheap.
As I stated before, the # of drilling rigs required to access fraced oil & gas at a rate to keep up with the above is also staggering.
Alan
I don't really see the world's demand for American energy as a big problem for America (American coal, American gas, etc) but I agree some people are terribly worried about the number of rig workers that need to be hired and rigging gear that needs to be built, etc.
My point is merely that American energy will be dirt cheap or American workers will be employed and busy, one or the other, and perhaps both.
Something is finite therefor something is scarce, that is pretty much the logic of the oil drum right now.
Finite things are sometimes very, very large.
There is no conceivable way that US Oil & gas will be "dirt cheap".
Current NG prices are losing money for producers (see XOM) and prices will need to rise substantially to replace current consumption.
And as conventional oil & gas decline, even more frac rigs will be needed.
If high prices do not constrain demand, increasing demand will require still more rigs.
Alan
Ohh the rigs, the rigs, where will find people who need jobs to work the rigs .... oh wait.
"Current NG prices are losing money for producers (see XOM) and prices will need to rise substantially to replace current consumption."
No, not from $3.50. $4.50 NG is profitable. I know Art Berman has some theory that gas needs to be $8 for shale fracking to break even but that is simply wrong.
When do you think we will see $6 NG? Not for a decade, minimum. Maybe two. $6 NG is the BTU equivalent of less than $40 oil that is not expensive energy. And that is the upper limit, it will average cheaper.
gas needs to be $8 for shale fracking to break even but that is simply wrong.
Oh ?
I have heard it will take $7+ from industry people to get the landmen out there signing new leases. Either that, or a substantial reduction in drilling, fracing and completion costs.
Alan
Not in PA. Perhaps in the Louisiana plays. The PA plays are the cheapest in the country right now.
It is a bit academic, Eagle Ford and Bakken will flood the market with by-product gas for another few years unless the price of oil craters.
But $5 gas would bring a flood of gas out of PA. $4.50, some will come back.
Prices vary, plays vary. Marcellus is just not expensive, it has yet much gas to give us.
I believe Berman convinced some people shale gas was expensive based on some LA plays. Those were not the droids he was looking for.
Bakken gas production will "flood the market" PTB says.
Really? It's less than 1 bcf per day right now. Or about 2 % of U.S. consumption.
Point taken. Things may not be so bad. Falling into a black hole can take an infinite amount of time from a stationary perspective. Plenty of Big Macs remain to be enjoyed, from those outside the crunch.
Yes I have no great expectation that Americans will stop eating Big Macs and instead eat locally grown asparagous. I know that will make some people very angry.
Replace "some" by "most" and we are in complete agreement. The end result becomes the same.
Most people will become angry about Big Mac eating? No.
Yeah, that's the part that I just don't get... >;-)
I don't see predictions of *US* oil independence, but *North American* oil independence. That looks to be feasible circa 2020.
Or US energy independence - i.e. net positive balance of trade of energy goods.
Without a major drop in US energy consumption - impossible.
Alan
Not really, coal exports are booming and natural gas exports are on the way.
Natural gas is insanely cheap in the USA compared to the rest of the world, but coal is also much cheaper.
The price of exported coal will be a small fraction of the price of imported oil, even if the BTUs climb to something comparable (VERY doubtful).
Much of the price of LNG goes to liquifying it, transporting it, and vaporizing on the other side. Roughly $2.50/mcf.
*IF* (as I do not believe) US NG stays under $5/mcf, we will burn most of it at home (or export it to Mexico).
It will replace most US coal generation, Americans will just waste it, etc. etc.
And even modest LNG exports will drive the price up.
We simply do not have enough NG to substitute it for other energy, waste it and export large amounts of LNG. Add to this a growing population and a possibly growing GDP.
And all this ignores the impact on Climate Chaos.
Alan
This ...
It will replace most US coal generation,...
appears to conflict partly with this ...
We simply do not have enough NG to substitute it for other energy,
So you we do have enough gas to replace coal but not oil, yes? Which implies you have an NG reserves figure in mind that would be sufficient. What would that figure be?
With a little luck we'll get a big drop in oil consumption.
US fuel prices are way too low, but even so, industrial/commercial consumers are moving pretty fast to sharply reduce their consumption.
The local taxi companies seem to be buying 75% hybrids.
I would suggest all interested readers / commentators here read through the recent NPC topic paper, including the appendices, on the natural gas situation in the U.S. + Canada:
http://www.npc.org/Prudent_Development-Topic_Papers/1-8_Onshore_Natural_...
As one of the authors, and a 30+ year oilfield vet (petroleum engineer), most of the commentary here seems rather myopic, as well as Art's views on the natgas situation. But I never thought I would disagree with Rock - IMHO the recent technology innovations, namely cost-effective fracture stimulation in horizontal wellbores, are profound and should be considered "game changing".
Pages 25-32 deal with the resource analysis germane to the discussions above. Resource is assessed via two methods (1) a "bottom-up" approach utilizing the referenced MITe report and substantiated by the detailed work of the ANGA members aggregate supply study we were privy to; and (2) a "top-down" Hubbert Linearization that is quite popular on this site. For the top-down approach, we use a superposition of conventional, "old" unconventional (tight rocks developed without horizontal fractured wellbore tech), and "new" unconventional. The paper is, admittedly, a hard read, but we wanted to be comprehensive. As almost another two years have passed since we performed our study, I feel that Resource Case One, the low case, can actually be dispensed with.
Arguments about EURs per well and near-term economics don't really accomplish much in a macro sense (we can always drill more wells as price permits), nor does impugning the companies and people that provide the energy for society. The energy equivalent price for gas relative to oil would be about $15/mcfg; so there is a lot of headroom where they can and do compete, both for market and oilfield supplies.
A lot of info here. Note that supply is quite elastic up to about $20/mcf, which is equivalent to maybe $150 or $200 oil. There is a lot of it, but after that supply is constrained. This only makes sense, as EROEI would be getting lower for such supplies too.
I have read that average shale oil cost is $60/bbl today, with marginal cost at about $90, which explains why rigs are slowing today. At today's gas prices, the recoverable gas is much less -- we're past the halfway point.
To me, none of this indicates "100 years of supply" unless other limits greatly slow production. Water and proppant are already restrictions at today's low prices. Regulation will be too. Still, production at current rates could be sustained for decades at moderate costs of $10 it seems. It not a panacea, but not Armageddon 2015 either.
Can't find any mention of EROEI in the report. Using 20:1 oil to extract 2:1 gas might make $/bbl look good, but using that gas for the "energy invested" part would require a ~10x increase in production to maintain the current net output. Then decades become years.
Rock
I always enjoy your thoughts on the biz.
As per your comment above, I stand by the statement that the 26 bcf/day increase in US shale gas production
between 2000 and 2012 represents the largest infusion of new energy into the American economy in many decades.
Prudhoe, flush, was about 1.5 MBd, as I recall. http://tinyurl.com/b345kyy
So... is this a "revolution"? Is it a game changer? The coal industry would sure as hell say it was.
Cheniere would sure as hell say it was, since it stranded their billion dollar investment in LNG imports. The game
changer isn't doing wind industry any favors, either. Or the CBM play in the PRB for that matter. Or the Russians.
Perhaps in 2000 or thereabouts, I think some of you guys in the biz understood that the Barnett wasn't a one-off, but the EIA certainly early in the last decade and even the NPC was saying we gonna need 10 bcf/day of LNG imports. Dozens of LNG terminals were planned. People in the biz were frankly freaked by the first year decline rates they were seeing in Texas conventional wells. 56% was the number in an OGJournal article from that period by a respected analyst. Swindell?
-------
I think at TOD we get stuck in defending our EROEI, finite fuel, steep decline rate world view--and that has prevented many of us from fully appreciated what the industry and technology have wrought.
At the same time, the cheerleading about shale gas and shale oil seems so over the top sometimes, and so ignorant of climate change and so heedless of what these staggering depletion rates in shale wells really mean... that an autoimmune reaction is going to be fierce, particularly at this web site.
Recall that the 1.5 mbd from Prudhoe... this came from 200 wells. Just 200. I think there's still fewer than 600 production wells there now.
And how many shale wells has it taken to get to 26 bcf/day. Don't have that number, but am guessing we've drilled about 240,000 gas wells in the U.S. since 2000, perhaps 40% into the shales. Would be interested in seeing the real number, if someone has it handy. But certainly the number of shale gas wells must now number 30,000 or more.
The o/g industry has leased at least 10% of the Lower 48 now, and will need to drill perhaps 1,000,000 to 2,000,000 gas wells
over the coming century for the "100 year promise" to pan out.
And then? What comes then, pray tell?
I think what so many people miss is that it's not turtles all the way down. Shales are the source rocks. Once they're drilled up, well then all bets are on abiotic gas and hydrates. LOL
Timing is important. The longer fossil fuels last, the easier they are to replace, as alternative tech gets cheaper (batteries, wind, solar, etc).
Of course, the climate needs help sooner than that...
What a gem!
Rudall – Yes…a nice 30% increase in NG production but not all from the shales. A good bit from conventional reservoirs but the shales did dominate. But the upturn in production was the result of the rapid pace of drilling and not the individual well rate. Most of the conventional NG wells I’ve drilled came on at rate many times what the shale wells do. The big difference is that there were never as many conventional locations to drill at the same time as there are shale wells to drill. Which, in an odd way, indicates our energy problem IMHO: with so few conventional reservoirs to drill the pubcos had no choice but charge into the shale trends. Had they not a huge percentage of those companies wouldn’t exist today IMHO.
“People in the biz were frankly freaked by the first year decline rates they were seeing in Texas conventional wells.” Did you misspeak and meant “Texas unconventional wells”? Both Texas conventional oil and gas wells have a very low decline rate. The only conventional reservoirs with high decline rates these days are in the Deep Water GOM.
If you did mean unconventional wells I can assure you no one in the biz was freaked out by first year decline rates. That reservoir dynamic has been understood for decades. Perhaps you’re referring to some PR spin from the pubcos. What freaked out many folks, like my cohorts at Devon, was the sudden and very deep collapse of NG prices at the end of ’08.
I agree about the hype but that’s how the oil patch has worked for the last 100+ years. And will continue forever if not worse IMHO. LOL.
BTW: I just noticed that the EIA has shown NG production to be virtually flat for the last 12 months. Rather significant IMHO given how many more wells have been drilled. Especially when you consider how much longer laterals are being drilled, how many more frac stages being used and how many more infield wells are being drilled.
Rock
In the late 1990s and early 2000s first year decline rates for Texas gas wells were going through the roof.
56% according to this paper for wells drilled in 1998. http://gswindell.com/txselect.htm
http://gswindell.com/texasgas.jpg has an excellent chart of vintage
The whole article is here. http://gswindell.com/tx-depl.htm
I think he's looking at all TX gas wells, not just "conventional," so maybe early Barnett wells are beginning to
have an impact, but the deterioration is stunning and consistent.
Macro - It sounds like the disagreement is over those "new innovative techniques". So I'll say it again: they aren't doing anything in the shales today we weren't doing 20+ years ago. I was personally drilling longer dual wing laterals in the Austin Chalk than a typical shale well. I was doing 500,000# fracs in the carbonate shale of the Edwards Formation in Texas over 30 years ago using the same type of frac trucks and same prop pant being used today. I drilled and frac'd my first Eagle Ford well over 25 years. The first "game changer" IMHO was the anticipated NG price run up back in '07. That pushed my client at the time (Devon) to have 18 rigs running in the E Texas shales by the middle of '08. And then NG prices collapsed. With the same hz and frac tech we have today Devon released 14 of those 18 rigs in early '09. And paid $40 million in cancelation penalty. Same tech but much lower NG price. As they say follow the money. If oil drops in price like NG did then the oily shales will tank IMHO. Of course, I'm not predicting that will happen. But if it does the same tech that didn't keep the dry gas shales from tanking won't save the oily shales either. Or are you predicting that the shales will keep booming despite a price collapse? If so key me into that new magical tech. I can surely use the help. LOL
No arguments regarding age of the basic tech Rock, we cover that off rather extensively in the paper. Today, we're just doing a lot more of it a lot more efficiently via coiled tubing, diversion, materials and other improvements. Most of it enabled by price, and then disabled by price, as you mention.
macro - Enabled/disabled...I like that. A simple vision.
Natural Gas
It seems anyone who has taken a class in economics would know the supply/demand/price curves of the market and know if you produce much MORE natural gas, the price will probably FALL. I guess the CEOs took the class a long time ago.
One of the problems is associated gas: oil/liquid production pays for the drilling, and the NG is a bonus, worth selling at almost any price.
Every time I read arbitrary number jugling article released by some '* Institute' my alarm bells go off. Most of these so-called institutes are nothing more then a mail-box shell in Chicaco or DC and pure political lobby organisations, many of them advancing right-wing, conservative or libertarian worldviews. Such organisations have very long history of being economical with the truth when it suits their ideology.
The public is in no position to distinguish good science from bad and this is what these lobby groups exploit by releasing phony research to leave the public confused and unfavorable policy unimplemented.
The American Enterprise Institute is such a lobby group. There will always be some (wannabe) scholar with matching worldview to produce sciency articles to influence policy and public opinion, not surprisingly many of these are scholars in Economy.
So AEI advocated that there was no cost-benefit in regulating smoking in the past and with this case it's clear that this message is intended to extend the dream in the public that it can continue using fossil fuels. Brought to you with financial support of Philip Morris and Exxon. Thank you and sleep well!
Here is a big argument about fuel production along with intimations of dishonesty directed at Art Berman ... taken note of.
Meanwhile, consumption is left to sort itself out as always. Everything is always fine on the consumption side ... right?
It doesn't matter how much 'energy' is out there in the world if the customers cannot afford to buy it. There is an affordability crisis right now everywhere in the world. The crisis has emerged in credit markets: why is the credit taken on?
A: to pay for fuel and fuel waste toys and all that goes along with these things.
Right now, what is supposed to pay for fuel is the waste of the same fuel. Both supply and waste are subsidized entirely by debt. The cost of the fuel is added to the cost of credit needed to buy the fuel ... there must also be cash-on-cash returns. This last is to keep up appearances. The costs of extraction from unconventional formations are very high. Extraction cost + credit costs are approaching the point where costs are greater than what end users can bear.
Upstream costs are always and have been greater than returns on the waste of fuel. The big change is that the gap between costs and returns has widened dramatically since 2000 due to exhaustion of cheap conventional fuels. Cost matters, indeed it is the only thing that does right now.
Credit has its own exponentially increased costs which must be themselves financed. At some point costs exceed cash flow. More credit cannot be then justified.
Almost all current fuel consumption is simple waste for entertainment purposes. This waste must be financed by the economy taking on more debt.
To paraphrase Bill Clinton, "It's the consumption, stupid!"
Until we humans can come up with more enduring uses for resource capital we will spiral continually toward ruin ... as the credit costs to pay for our pleasure mount up.
See, 'Eurozone' which is where this dynamic is underway. Also see 'Japan', 'China', 'USA' etc. We're all on the Titanic ... right now ... having 'problems' ... not because of a shortage of coal in the bunkers.
Am I right or the shale boosters? Just watch and see what takes place in Europe.
Of God, Peak Oil and Turkeys ...
It gets worse from here ...
Oil, and energy, don't explain everything in the world.
Greece has been defaulting on it's debts every 25 years for the last 200 years.
Now, I absolutely agree with you that we should kick the oil & FF habits ASAP. Still, let's not overreach in our arguments...
Nick, you clearly do not understand the difference between industrial civilization and the agricultural revolution civilization that preceded it. Oil and energy are responsible for the industrial world we live 100%. The fact that you can't grasp this basic concept explains why you think peak oil/high fossil fuel prices are no problem.
Oil and energy are responsible for the industrial world we live 100%.
Energy is certainly needed, but oil isn't.
Heck, oil wasn't an important part of industrial civilization until about 1910, and the US was pretty heavily industrialized at that point.
Oil was convenient, but hardly necessary - the world could have proceeded quite nicely (if slightly more slowly) with EVs, trains, etc.
why you think peak oil/high fossil fuel prices are no problem.
It all depends on the context. PO is certainly a real problem (it may be knocking a percentage point off of world growth, which is a very big deal), but it's very, very far from TEOWTAWKI.
Now, Fossil Fuels (coal, NG) are a slightly different conversation. On the one hand, we have quite enough to allow a transition to renewables over some decades - certainly enough to allow replacement by attrition, which would be very cheap. On the other hand, Climate Change certainly demands greater speed - the faster we do it, the more current infrastructure becomes obsolete, and that can be a bit pricey. Still, coal plants are aging, and just replacing them with wind (instead of new FF plant) would go a long way...
Maybe a lot of it is wasted by inefficiency, but it is not entertainment to travel to work, operate a tractor on a farm, transport goods, heat a house, turn on a lamp, run a refrigerator, power a military.... Entertainment would be watching TV, traveling on vacation, gaming... which far less than "almost all current fuel consumption."