| Tech Talk - Some Thoughts on Energy in 2013 | The Oil Drum | Tech Talk - Miles Driven, Gas Used, and OPEC Projections |
Oil Watch: Reconciliation of JODI and EIA C+C Production Data
Posted by Euan Mearns on January 17, 2013 - 5:50am
Executive Summary
Oil production and consumption data reported by JODI (Joint Organisations Data Initiative) is reported to JODI by national governments giving us reason to believe that this may be the most reliable data set upon which to base interpretations about national and global oil supply and demand. However, the JODI data set is incomplete. 15 countries that report production data to JODI have incomplete returns since the project began in January 2002. Furthermore, there are 15 countries for which the EIA (US Energy Information Agency) report data that do not report to JODI at all. Based on the observation that JODI and EIA C+C (crude oil + lease condensate) data for OECD countries are very closely aligned we have used EIA data to patch the gaps in the JODI data set. This has produced a very close alignment between JODI and EIA global C+C data (Figure 1) and since the JODI data is based on returns from national governments, this in turn provides confidence in the veracity of the EIA data which is more complete and easier to use.
The IEA (International Energy Agency) and BP (British Petroleum) do not report C+C separately and so cannot be compared to the EIA and JODI (corrected) C+C data. However, there is good alignment between EIA, IEA and BP for C+C+NGL since January 2002 although the IEA data is currently >2 million bpd higher than the EIA and this reporting gap will one day need to be closed (Figure 2).
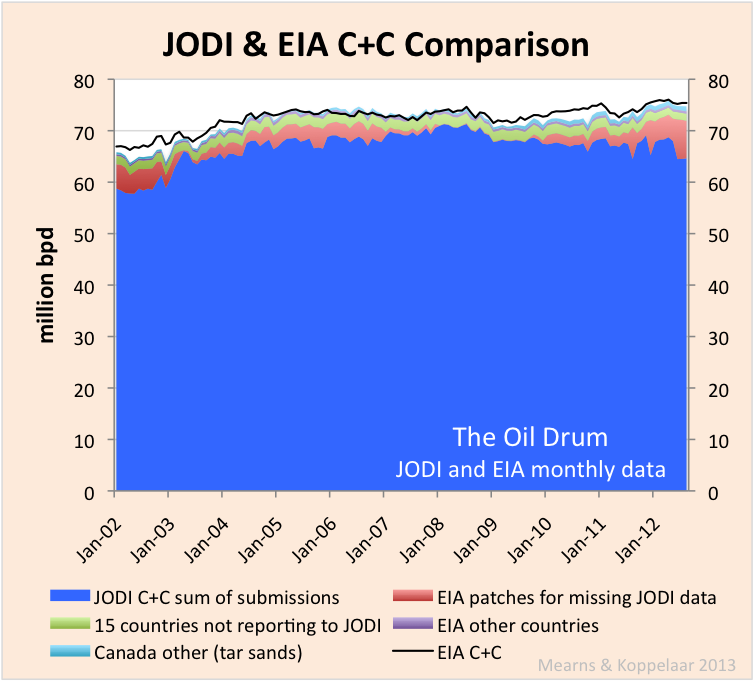
Figure 1 Patches for missing JODI data taken from the EIA results in good agreement between global C+C production estimates for JODI and the EIA.
Oil Watch posts are joint with Rembrandt Koppelaar.

Figure 2 Comparison of C+C published by JODI and the EIA and of C+C+NGL as published by the EIA, IEA and BP.
As part of our drive to restart Oil Watch Quarterly we have plotted hundreds of charts in recent weeks. Getting close to the data we began to recognise a large number of disparities between the various organisation's data leading to a crisis of confidence - are any of the data and the charts we are plotting meaningful? This drew us to the JODI database where the provenance of the data is known. National governments have been reporting oil production and oil products consumption data to JODI since January 2002 making it a powerful source of energy statistics. However, the incompleteness of the JODI production data has hindered its use in tracking global oil production trends.
47 countries report oil production data to JODI. However, the JODI production database suffers from 5 significant shortcomings:
1. 15 of these 47 countries have incomplete reporting records.
2. 15 further countries followed by the EIA do not report to JODI at all.
3. The EIA reports a further category of "other countries" for each continent which are an amalgamation of very small producers and these too are not included by JODI,
4. Canadian tar sands production is not included in the JODI C+C category.
5. Countries only began reporting NGL to JODI in January 2009 and these reports are very fragmented to the extent that JODI NGL reports are not currently useful at a global scale.
As described below, correcting the JODI C+C data for shortcomings 1 to 4 provides a close alignment with the global C+C data reported by the EIA - problem solved!
Alignment of JODI and EIA data for OECD countries
The alignment of JODI and EIA C+C data for most OECD countries is very good and is near perfect for the last 4 years. See for example data for the USA and Norway in Figures 3 and 4. This led us to believe that the EIA data could perhaps be used to patch the holes in the JODI production database.
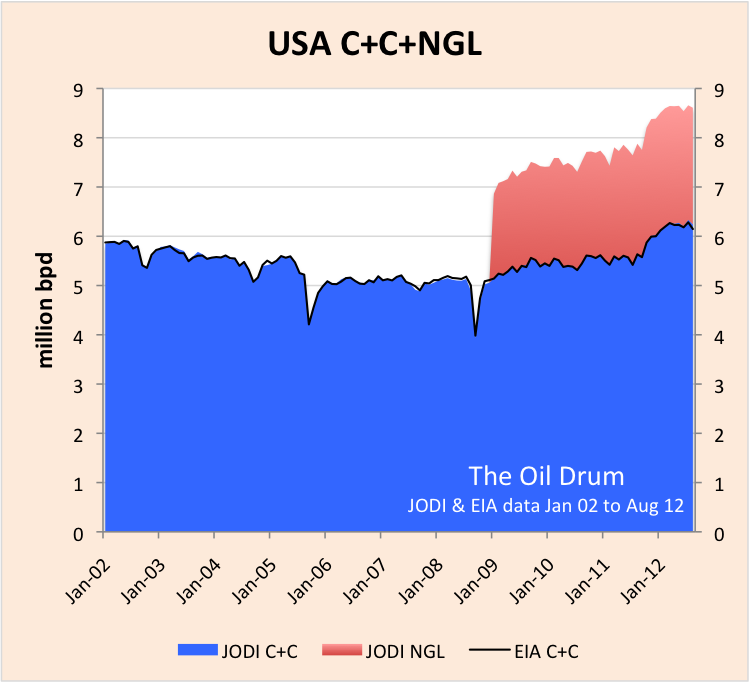
Figure 3 There is excellent agreement between JODI and EIA C+C production data for the USA. In fact for the last 4 years the agreement is exact suggesting that the EIA and JODI are using the same data reported by the US government.
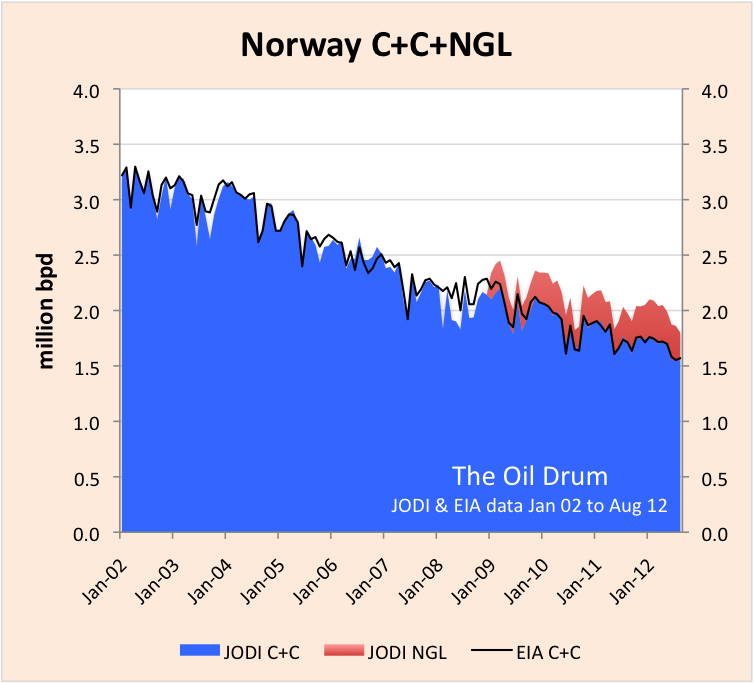
Figure 4 There is also excellent agreement between JODI and EIA C+C production data for Norway and as a general rule this applies to all OECD countries.
Incomplete records of 15 countries
15 countries reporting oil production data to JODI have incomplete records including some important producers like Kazakhstan (Figure 5), Iraq (Figure 6) and smaller producers like Oman (Figure 7). Other notable countries like Iran, Libya, Columbia and Romania have incomplete records. In order to try and make sense of the JODI data, these data gaps have been patched using data from the EIA. Incomplete records are the greatest source of disparity between JODI and EIA data and are weighted towards the beginning and end of the 10 year period since January 2002, approximately 5 million bpd at the beginning and 7 million bpd at the end of the reporting period. During 2008 the JODI reports were complete and the missing data patch is zero (Figure 1).
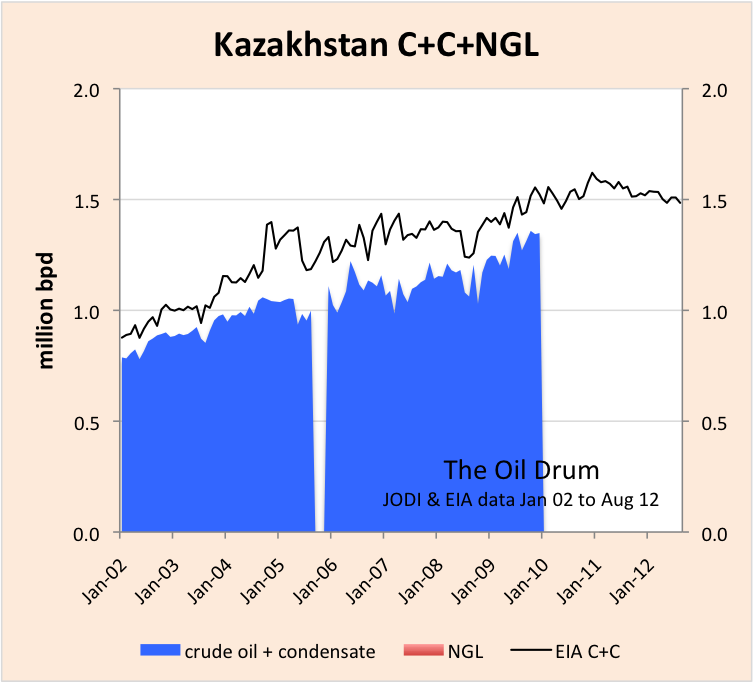
Figure 5 The JODI record for Kazakhstan is incomplete and there is poor agreement between the JODI and EIA C+C production data. Data gaps such as those shown have been patched using EIA data to produce the corrected JODI global C+C chart (Figure 1). It is often, though not always the case that the EIA estimates are higher than JODI.
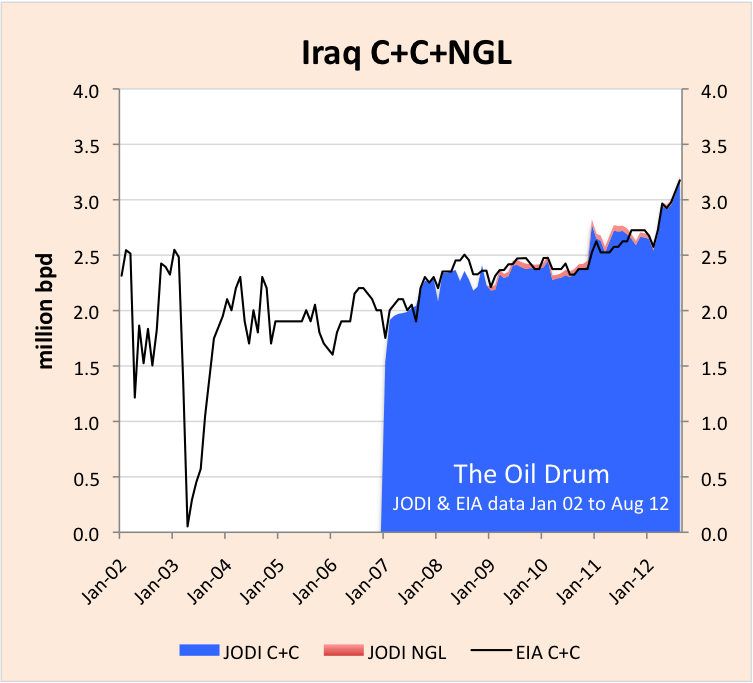
Figure 6 The JODI record for Iraq is incomplete but since Iraq began reporting in January 2007 there has been good agreement with the EIA data.
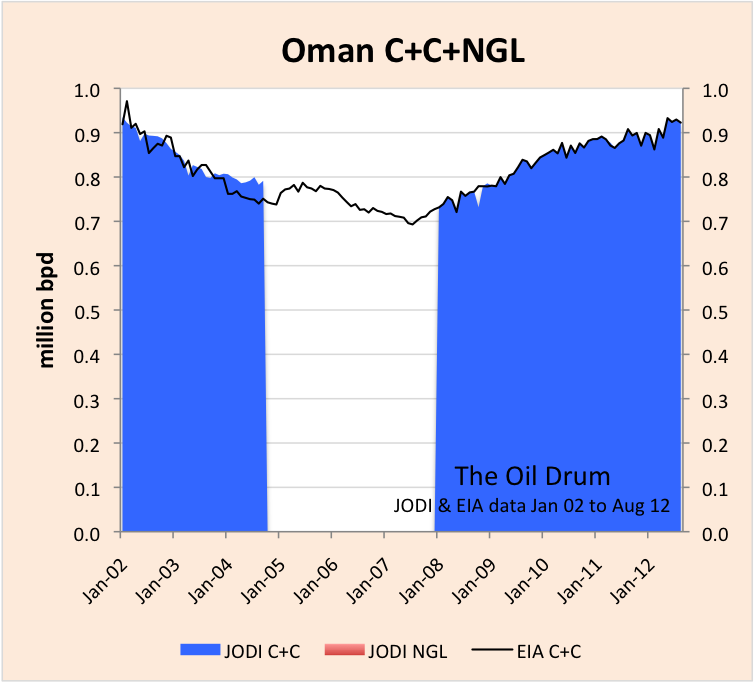
Figure 7 The JODI C+C production record for Oman is also incomplete but like Iraq, there is good agreement with the EIA for the periods where JODI reports exist.
15 countries not reporting to JODI
There are 15 individual countries for which the EIA report data that do not report to JODI. These are mainly very small producers like Pakistan and Bangladesh but includes some more important new producers like Sudan and larger nations like Ukraine that does not have much production. The missing countries patch ranges between 1.5 and 2 million bpd (Figure 1).
Other countries category
The EIA also reports a category of "other countries" for each continent being an amalgamation of very small producers. This patch varies between 300 and 600, 000 bpd (Figure 1)
The curious case of Canada
While JODI C+C data for the vast majority of OECD countries is closely aligned with the equivalent EIA data (see above). Somewhat surprisingly this is not the case for Canada where the EIA estimates are considerably higher. Since January 2009, JODI have reported an additional category of "other" defined as "Refinery feedstocks + additives/oxygenates + other hydrocarbons" and adding this to the JODI C+C figure produces alignment with the EIA C+C. In Jan 2012, the other category = 937,174 bpd which matches exactly the synthetic crude production from tar sands reported by Statistics Canada and thus Canadian synthetic crude production needs to be added to the JODI C+C number. However, synthetic crude only represents about half of tar sands output with Crude Bitumen representing the rest at around 800,000 bpd. The only other country to have a substantial entry under the JODI other category is the USA and I suspect this may be linked to upgrading and refining Crude Bitumen but at present I am unsure how to handle this component - if anyone can advise...

Figure 8 The EIA C+C production data for Canada is significantly higher than the JODI estimate. The disparity is due to synthetic crude production that is reported in the JODI other category. A patch for synthetic crude production has been applied since Jan 2002 (Figure 1). It is unclear at present how crude bitumen should be handled.
Wild cards
While adjusting the JODI data for a variety of omissions has produced good alignment with the EIA (Figure 1) there are also a significant number of anomalies that seem to cancel each other out in the production stack. Angola, for example, shows good agreement up until 2008 when the two data sets begin to diverge (Figure 9). The EIA data for Algeria is way higher than the JODI data (Figure 10). As already mentioned there is a tendency for EIA data for non-OECD countries to be higher than JODI but this bias is cancelled by Venezuela where the EIA data comes in significantly lower (Figure 11). It would be interesting to hear from the EIA their views on the origins of these significant discrepancies. There are several more.
Finally, it is interesting to note that the Iranian authorities do not concur with the EIA view that their production is in decline under the weight of international sanctions (Figure 12).
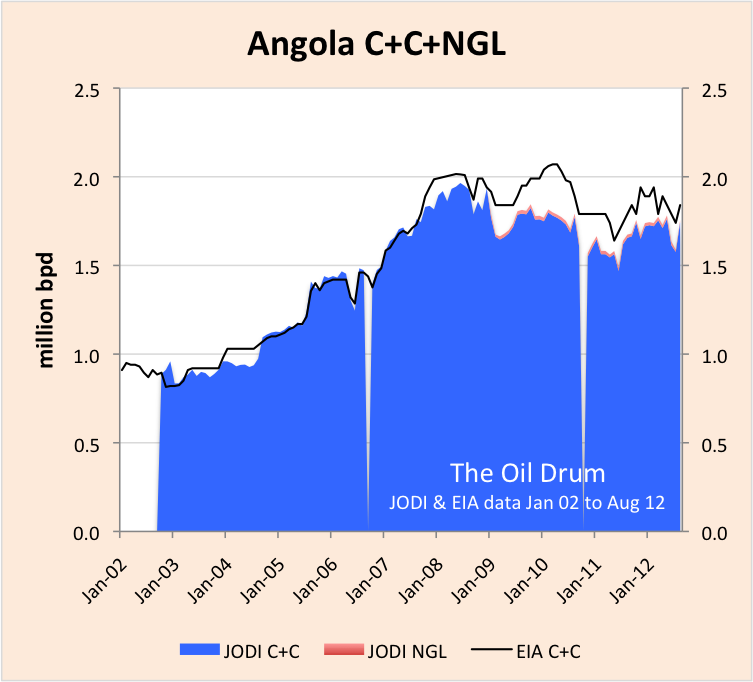
Figure 9 JODI - EIA C+C production comparison for Angola.

Figure 10 JODI - EIA C+C production comparison for Algeria.
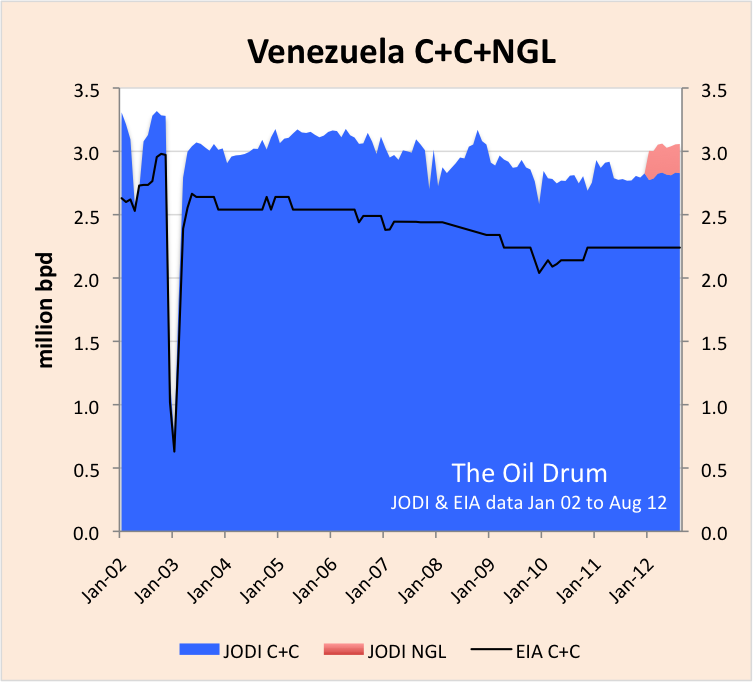
Figure 11 JODI - EIA C+C production comparison for Venezuela.
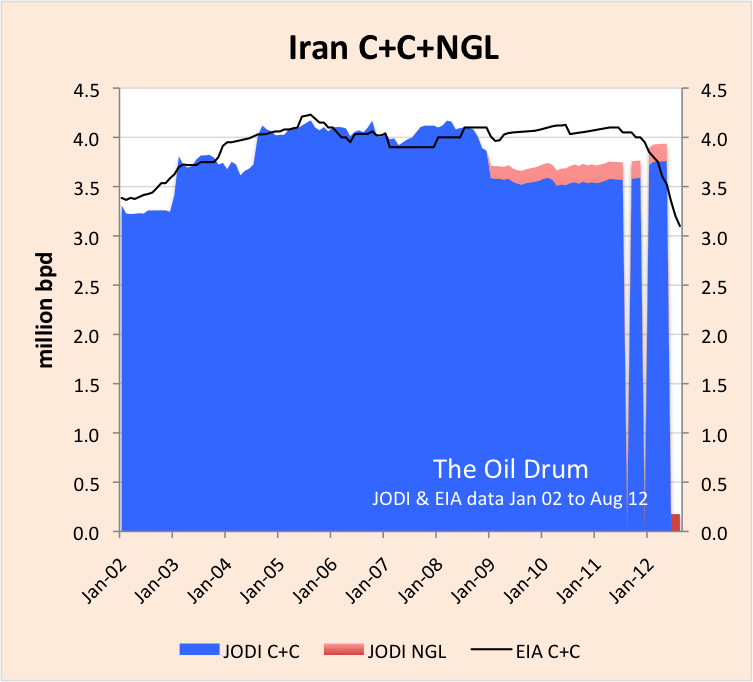
Figure 12 JODI - EIA C+C production comparison for Iran. Note that the EIA view is that Iranian production is falling, the result of international sanctions whilst the Iranian authorities' data reported to JODI shows production stable / rising.
Concluding thoughts
Whilst the gaps in the JODI production data are a frustrating inconvenience this venture is highly worthwhile providing a means of cross checking data published by other agencies whose independence may on occasions be questioned. In addition to production data JODI also gathers extensive data on oil products consumption that will be the subject of a future post. With natural gas becoming an ever more important part of the global energy mix, it would be wonderful to see JODI begin to start gathering natural gas statistics.
Contact
- Content: editors at theoildrum dot com
- Tech support: support at theoildrum dot com
License

This work is licensed under a Creative Commons Attribution-Share Alike 3.0 United States License.
Nice work.
As long as the plateau continues in C+C production, it shows the limited utility of heuristics such as Hubbert Linearization. It would be interesting if someone were to do the HL with the plateau results included, as the results would not be pretty.
In my opinion, the path forward on analyzing depletion data is a combination of careful accounting of oil production data (including keeping tabs on unconventional crude separately) and non-heuristic flow rate models. The latter can be used to model the reality of price-boosted plateauing and fast depletion behavior such as observed on the Bakken fields.
The problem with heuristics has always been that since they are not based on any fundamental models, they can change on a whim. The problem with HL in particular is that it will start to give nonsense results if the data does not change according to the assumptions built into the heuristic.
Robert Rapier has a similar take from this classic TOD post:
http://www.theoildrum.com/node/2389
However, the fact remains that Deffeyes' prediction for a global crude oil peak (between 2004 and 2008, mostly likely in 2005) nailed a major inflection point in global crude oil production. Global annual (Brent) crude oil prices doubled from $25 in 2002 to $55 in 2005, and then they doubled again, from $55 in 2005 to $111 in 2011 (with one year over year decline, in 2009). Following is the production response to the first price doubling, versus the production response to the second price doubling (it does look like global crude oil production exceeded 75 mbpd in 2012).
Note that Yergin, circa 2005, was predicting a continued 3%/year rate of increase in global production, which would have resulted in a 2011 global crude oil production rate of about 89 mbpd.
Probably the best recent work on global production has been by Michael Kumhof, et al, with the IMF. While acknowledging that the Peak Oilers, e.g., Deffeyes, were basically right about conventional global crude oil supplies, their thesis is that the rapid increase in oil prices has been sufficient to cause a small increase in global production, from conventional + unconventional sources, at a rate much lower than we have previously seen, e.g., 2002 to 2005.
Westtexas: Useful comment with an exceptional graph which should settle the argument that higher prices will boost production but maybe they just aren't high enough. Maybe we need another doubling.
hugho - Some food for thought. Let's see how US oil production responded to higher prices and drill rig counts in the past. In 1971 US oil production peaked at 9.64 million bopd. The price at that time was $3.60/bbl. No...that isn't a typo. But then came the boom. The US rig count exploded to the max ever seen in the US: on 28 Dec 1981 we had 4,530 rigs drilling according to Baker Hughes. The rig count boomed because oil had increased to $37.42 in 1980...about a 1,000% increase. And how did US oil production respond to the price induced drilling surge" It dropped from 9.65 million bopd to 8.97 million bopd. The increase in drilling did produce a small plateau from 1978 to 1985 that did bring a temporary halt to our decline rate. In fact from a low in 1976 of 8.15 million bopd the "boom" added 820,000 bopd to our rate.
Of course, this isn't 1980. And the shale plays are a different animal than the conventional oil reservoirs the industry was chasing in the late 70's. For one thing there are few dry holes in the shales. Even a shale well that doesn't recover 100% of its costs does produce some oil. A convention dry hole adds nothing. So more rigs drilling shales means more oil production even if the rig count is only half of that 1981 max. OTOH the conventional oil fields discovered in the late 70's didn't have the high decline rates all the shale plays exhibit. So it is a bit of apple to orange comparison on several levels.
But there are some truisms that hold: higher oil prices lead to more drilling which leads to more oil production. And no oil boom has ever lasted for decades. Lower oil prices eventually kill a boom just as it did in the mid 80's. Killed the boom because the high oil prices sent the world into a major recession that decreased demand which decreased oil prices by 70% which killed the rig count.
Is history on the verge of repeating itself? Few believe oil prices will drop that much again. OTOH in 1980 virtually no one predicted oil prices would drop at all. Many projected 2X to 3X increases. They were wrong. This time someone will be wrong again. Just a question of which side of the argument.
Note that the last time we drilled the crap out of the country we actually discovered fields:
In contrast to the current resource plays. All of that poking holes in the ground led to a bit of an uptick in the lower 48, but nothing too terribly exciting:
CA and the GOM bumped up a bit, TX barely at all - one year plateaus before heading back through the floor. Is the current boom out-performing the last one? In the 80s about 300k was added over the course of 9 years, but you'd want to discount AK from that to get an idea of how useful all the drilling was; same with the GOM for the current situation. We seem to have gained maybe 170kb/d in only 3 years here.
KLR - Very interesting charts...had not seen most before. Thanks. Someone asked why so many companies are chasing the shales if they really weren't all that profitable. If the hype is on and there's investor money being pushed your way you drill whether you have enough viable prospects or not. I started in 1975 just as the boom started. Being a pup then I didn't realize at first just how crappy most prospects were. Probably half those 4,500 rigs were drilling prospects that had almost no chance of working. But I learned quickly. I handled a joint venture for a pipeline company that invested in 18 wildcats with a small operator. And they drilled 18 dry holes in a row. Why did the p/l company hook up with such a poor performer? They were desperate to take advantage of the surge in oil/NG prices and didn't have an exploration staff in place to do it. And why did that operator drill all those bad prospects? Easy answer: because they made a small fortune from their partners in the joint venture. They didn't invest a penny in the drilling effort but got big front end fees for running the JV. The senior guys with the operator retired millionaires. Not a lot of millions but in 1980 you didn't need a lot to be very comfortable.
And it's not just promoters who skin foolish investors...some companies do it to themselves. In 1980 I began working for a public company that generated and drilled their own prospects. And spent $550 million to find $60 million of oil/NG. A sad combination of incompetence and graft. But mostly incompetent management.
I tell these little stories on TOD because it's just about impossible for folks to find them elsewhere. These are not isolated incidents. I could go on for thousands of words describing other examples of what we insiders call MDW's: Money Disposal Wells. And yes...we really use that term and we all understand the implication. Somebody tells me Company X is selling interest in a prospect and I'm told that company is an expert in MDW's I know to not waste time looking at the deal. I could name dozens of MDW's drillers I've run into the last 37 years. Folks see what's goes on in the oil patch and get confused because they sense things are happening that don't make sense. And they won't make sense unless you understand some of the dirty little secrets that drive some of the dynamics. The primary objective of the oil patch isn't to find oil and NG. It's to make money. You won't hear such a statement on one of those cute Chevron TV ads.
Hi KLR,
I am trying to understand your top graph. The graph says "Count of number of oil and gas wells discovered". Normally wells are not discovered. Should it say # of oil or gas fields discovered?
Is this EIA data? And where can I look it up? It seems very useful.
Jon - KLR may need to correct me but I beleive they mean drilled by "discovered"
The question would be to what degree higher prices can bring significantly sized new production online.
Looking at the old crude producers you can see remarkably small reaction to much higher prices over the period. Its mainly a case of more infill drilling and reworking it seems - which shouldn't be too surprising. These fields are old and the country is suddenly getting much higher prices for their oil. Although they are often looking decline in the face, all the ramp up in prices seems to do is produce virtual plateaus as production is sustained - and given they can see even higher prices down the track and today's prices are due to supply scarcity, it shouldn't be a surprise.
As for the new production, it mainly seems to be the tight oil giving a small uptick, outside of special cases where fields have been left unproduced. Tight Oil is the original red queen race - your production is directly tied to your drilling rig count. So, if oil prices were $200 rather than $100, would there be many more drilling rigs out there? Seems that the answer is there would be more drilling, but that the prospect quality is falling off, making them more expensive.
Pull it together and I'd suggest that the aim is plateau, with prices gradually rising to keep the tight oil flowing, but not gushing onto the market. After all, the optimum route for most producers is to raise revenue by sustaining the rising prices; much cheaper than drilling the dregs.
However, there is a timeline on how long that can work. Infill drilling is just more straws into the last of the milkshake and fracking looks to only ever be worth a pimple on the overall production level (maybe a boil at most). Eventually the production will turn down as big old fields can't be reworked again. Then the price will undergo a superspike as people realise the shape of the coming years. Wars will be fought and permanent recessions will hit (hell, we are already there in parts of the world).
About the only way to avoid that fate for another decade is a major technological advance in drilling of tight oil, making it much cheaper and less manpower intensive to drill new wells. That way a significant impact could be made to overall production levels. Something in the way of major automation, etc. However, although it seems obvious, there seems to be little investment in such tech going on, because in our contracted world the people who would be developing such tech are the same people who make their money off existing drilling technology. For all the US far right hates government interference, this is a case where someone with deep pockets and long time horizons would need to step forward; and they are being forced to step back by budget issues...
gary - Excellent summary IMHO. Thanks. I'll toss in a few points. "...special cases where fields have been left unproduced." Not that it may have happened in rare cases but in 37 years I've never seen a newly discovered oil field. And in more than a few cases the correct decision would have been not proceed with development. An example: about 30 years ago a 600 bopd well in Mississippi (the highest flow rate in the state at that time) was offset by 5 non-commercial wells. As coonass said: No...I don't need help holding on to this gator...I need help letting go. LOL.
Actually the drilling frac'ng process is become more expensive per well due to longer laterals and many more frac stages. Some of the fracs in the Eagle Ford are costing more than the drilling costs. Those efforts are done to increase the productivity of an individual well but at a cost. As far as tech investments those are almost all in the hands of the service companies like Halliburton. The majors gave up most research on the drilling/completion side over 20 years ago. And those service companies are very competitive with each other and have spent many, many tens of $millions try to improve their products. And they have been flush with all the capex needed for such research for several years now. I saw the stat that for a while the operators were transferring $2 billion/month to the service companies in just the eagle Ford alone. They have zero budget restraint. The govt might have deeper pockets but it couldn't come within a million miles of matching the expertise of the service companies IMHO.
Thanks Rockman, to expand on the issues you raise:
1) I was talking about fields left dormant to cover the Saudi/Iraq cases where we know the fields were discovered decades ago, but where for 'reasons' they haven't been exploited. In general I expect few instances where a treasure chest of gold has been discovered, but where it hasn't been spent on wine, women and song. Real people just aren't like that - they gorge.
2) As we both say, the research on new drilling techniques is down to those service companies. However, as you have said in the past, they are conservative (with a small and big C) and tend to evolve on the things they know.
As far as novel drilling approaches for fracking are concerned, we'd have to be looking at a target of an order of magnitude reduction in typical drilling cost, together with much greater scalability, if we were to be able to use tight oil to change the oil production trajectory much (red queen race rears it's head). All the while we are on the cost structure and scalability limits of today's tech, I just don't see the whole system capability to deliver > 2-5MBpd of extra oil in the next decade.
In detail, we can see our approach today doing hundreds of drilling rigs, but to get from there to the 10,000 that would be needed for shale oil to change the price of fish doesn't work. Not only are the system structures inherently not scalable, we don't have the people resources to employ them. We in no way could scale fast enough and far enough to produce enough oil to make a difference. At the same time, I have personal knowledge of those drilling service companies putting money into research programmes only to take the resulting techniques, patent them, and put them on the shelf to beat-up any competitor that could use it to compete. Eg they act as patent trolls.
The reason is fairly obvious. A service company today that sees the scope for drilling 1000 wells a year cannot suddenly produce a revolutionary system that cuts costs to a tenth of the current price. Whilst they might be able to make profitable hay for a while, the general competition it would create would drive down prices over time - resulting in less turnover for the services company and the same number of wells drilled. It's a 'too brave' commercial decision, and as you always point out, oil companies are in it to make money, not provide fuel.
So I don't see any chance of the oil industry making the 'revolutionary' advance that would be needed to make tight oil a viable route to changing the future production capacity.
That's why I say government and research teams from outside the industry being necessary if that were ever to happen. They both don't know what conservative drilling experts know won't work, have no vested interest in the status quo, and do know whole new areas of novel tech to apply. In addition the government can break that patent and IP logjam if they want - and they DO have an interest in keeping the fuel flowing.
It's faint chance. I can see what would be necessary to change the game, but as to if it were possible, that's a whole different issue. Just to take one element, to make a scalable solution you would need to decouple the fracking fluid issue so that 10,000 wells could frack without a bottleneck killing the scalability. That probably means no fracking fluid (good for the environmental red tape as well), but HOW the hell could you do that? No idea personally.
So, overall I doubt that any of that will happen, but it is the faintest sliver of a bridge from where we are to a future that doesn't have double digit decline rates in oil availability, so I mention it. However <1% chance of happening I think.
gary - Got ya. I was thinking about US production alone. NOC's are well known for not moving fast. As long as their cash flow is satisfying the govt's needs they don't have the profit motive that drives public/private companies.
The service companies can be very conservative when it comes to expanding infrastructure too fast. Considering that new drill rig might take 3+ years to recover the initial investment. But that's only if the rig is under contract every day. Back when the early 80's bust hit I watch three huge rigs sit in a yard in Victoria, Texas for 4 years and never left to drill one well. Eventually they were sold for scrap. The owners lost tens of $millions. Such memories don't fade.
But the service companies can be rather aggressive on the research side. For them it doesn't matter what their profit margin is if the operators don't use them. So they are always trying to develop the next best flavor to pitch to the oil companies. And there have been some nice advances in frac'ng and directional drilling. But interesting only to us operators...nothing close to a game changer.
I really can't imagine the govt or private researchers coming close to anything very useful regardless of how much money they throw at it IMHO a better approach would be to sweeten the tax structure for the service companies as far as research and infrastructure. One of the big complaints from everyone (govt, environmentalists, ag companies and the oil patch) is the water consumption. I have an associate that used risk venture capital to develop a filtering system that can reuse 90%+ of the produced frac water. Not cheap, of course, but it's about the closest development I've see close to a step change. And AFAIK the govt/private research haven't seen addressed this problem. Another development you may have seen is using various gases to deliver a frac instead of water. Developed by a Canadian company that has been bought by Halliburton (?).
Scalability: about all I've seen along those lines are the walking rig/pad drilling approach. Saves money bug doesn't seem to be a huge leap forward. As far as the rest of the drilling /frac'ng in the Eagle Ford the costs have actually been increasing significantly the last two years. That's on a per well basis: longer laterals and many more frac stages. But even at the higher costs those expanded efforts may be generating a better ROR and also may be allowing more drilling in less perspective areas. Too early to tell if this might significantly change the game in the long run.
I agree with your overall assessment. The movement of more Canadian oil from Cushing to the Texas coast may offset whatever gains have been seen. Folks focus so much on WTI and Brent prices and ignore how much of our oil is sold as Light La. Sweet (as I sell my Texas oil). That price has fallen almost $20/bbl from the high I was getting. In addition to the 150,000 bopd added from Cushing with the reversal of that one p/l new lines will be adding another 600,000+ bopd in the next couple of years. I don't know how much lower a price the Eagle Ford players can handle but I'm sure many of them are worried about the short term just as I am with my current EOR project in conventional fields.
Rockman,
If they got the 'A' research teams on it, I can readily see revolutionary changes coming out - kind of like the risible film Armageddon, in reverse.
Domain knowledge is a blessing and a curse. Whilst the service companies know what they know very well, they don't know what they don't know, and don't know that some of what they know is wrong. If approached from a scalable, order of magnitude cheaper, perspective I'd bet that something different from the ordinary would result.
To really make tight oil a life saver they would certainly need the step/revolutionary level of change. Recycling frack fluids/walking rigs would be useful, but we'd be talking technologies beyond that (as you suggest) to deliver what's needed to ramp up by an order of magnitude or two the number of active wells at a lower cost whilst the quality of the prospects decline. Not totally impossible, but pretty close to it.
I've not heard of gas based fracking, I'd have thought it too compressible. Mind I can see additional techniques to enhance recovery that could play with such degrees of freedom.
In the end someone has to be strategising from a system of systems perspective if irons are to be pulled out of the fire and arses saved - and I really don't see that happening. About the only place it's viable to happen is in government agencies (companies are too much about local optimisation), but even here I think they are dropping the ball significantly. Hell, put the same money that was put into hydrogen vehicles into automated, scalable rigs - and redirect some of the defence research minds at the problem.
Given enough pressure, carbon dioxide will liquidify which may solve your compressible gas issue (no idea how compressible it is as a liquid though). At the temperatures found in a well, it may be in a super-fluid state that can make it behave in odd ways and become an excellent solvent.
NAOM
The only company I know about is GASFRAC out of Calgary.
http://www.gasfrac.com/
They use LPG (Liquified Petroleum Gas - mix of propane and butane).
They still appear to be independent at the moment, though a few rough spots, some executive departures.
This may be of some interest - a general overview of non-water frac fluids and why, though a bit technical. This include terse slides up front, then text toward the back.
http://www.epa.gov/hfstudy/unconventionalfracturingfluids-what-where-why...
You're thinking of ARPA-E, which is financing a lot of interesting stuff.
Not really.
That is a funding mechanism for point research suggestions, not a overarching, targeted, systematic approach to achieving an objective. Think of it as tactical sniping, rather that a strategic armoured thrust. You can get some interesting outcomes via it, and its very easy to manage, but it only makes small, short term, piecewise advances.
Gotta be smarter if you want to make the big steps, more skunkworks teams than individual point interest research.
Can you think of an example or two of what you have in mind?
ARPA-E (and DARPA) fund researcher-proposed items, usually relatively limited, point, items of research. So they might fund a new idea for a fracking fluid (if a researcher comes forward with the idea in the first place), but they won't easily fund system level solutions which include multiple areas of technology, all working together towards a known target.
Closest DARPA gets is their 'Grand Challenge', but for real progress you are looking much more at an X-Prize type competition, or more particularly the output from a skunkworks - where you bringing together a targeted list of researchers to work on one system level project.
The two approaches are complementary, with different plus and minus points - but for the type of question we are talking about, the skunkworks type model would work better.
Deffeyes was not the least bit rigorous in his modeling based on what I read in his book.
He opted for a loose unstructured approach which framed his narrative of having an intuitive grasp at what was happening with respect to oil depletion. Look at the way he described HL as an example.
The problem with this lack of rigor is that it all falls apart when the heuristics stop working. So his intuition was right, but the supporting math has not stood the test of time.
A flow or rate based model can adequately describe a plateau, but HL fails miserably.
Is it possible that splitting the differences so to speak on a topic with so many variables actually turned out to be a better way of pinpointing the correct time period than hard and fast math? Afterall math is only as good as the data input, which varies depending on subjective viewpoints. For example different individuals may use different percentages of URR and that will change the target date. I am sure if you gathered 50 professional oil people into a room and explained all the variables giving them all the same math totals, then asked them to determine a time period like Deffeyes did, the predictions would fit into a very wide range.
The problem I think was that Deffeyes used his intuition but supported it with the Hubbert Linearization.
Now consider that someone without Deffeyes' intuition will be motivated to use the HL by itself, and they will come up with incorrect results. These could be cornucopians, who will twist the results by pointing to Deffeyes' credibility on these matters.
btw, the trick to understanding the HL approach is that it senses an inverted parabola at the peak. The flatter the plateau, the more it senses a wide parabola and the higher the ultimate URR becomes. There is thus no accounting for how the diminishing return comes about because that is locked into the original assumptions for logistic growth. So the real subjectivity was not in the data but the original Hubbert curve model.
How long will this plateau last is really the ultimate question.
Yes, lets keep track. Kudos to Euan & Rembrandt and WT and all.
Kumhof (IMF) interview is here
http://petrole.blog.lemonde.fr/2012/12/05/peak-oil-warning-from-an-imf-e...
Yes, the JODI vs EIA puzzle was looked at back in May 2011 on TOD.
Most of the discrepancies found then are being worked out. One of the strange results from back then was that the JODI and EIA numbers would differ significantly for each country but that the total would sum to an equivalent number. And then around 2009 the totals started to diverge.
Just a quick aside off-thread to WHT. I note that Kumhof has re-introduced entropy to economics (and to peak oil economics) for the first time since 1971 Georgescu-Roegen & the earlier Soddy. This relates to dissipation of infra-structure and its maintenance, a neccessary condition for high rates of oil production along with a lot else.
Hi westtexas,
Your "gap chart" is quite interesting. If one was not overly optimistic (Yergin) and realized that the long term trend of oil output is not affected very much by prices, then one would use a longer term trend than four years. If we take the output trend over 1982 to 2004 the output gap is considerably smaller, dropping from 14.5 MMb/d to 2.5 MMb/d in 2011. Note that extending the trend from 1982 to 2005 would increase the 2011 gap to 3 MMb/d(that figure is not shown.)
DC
So, 2005 was a major inflection point?
In any case, a sustained multiyear increase in oil prices is certainly a good way to find out how much actual surplus capacity we have globally, and as noted in my post, global annual crude oil prices doubled from $25 in 2002 to $55 in 2005, and then doubled again, from $55 in 2005 to $111 in 2011.
This is why I think that the 2002 to 2005 production response to the first price doubling is relevant, as is the 2005 to 2011 production response to the second price doubling.
You may recall that Saudi Arabia, in early 2004, publicly stated their support for the $22 to $28 OPEC price band--as they boosted their net exports from 7.2 mbpd in 2002 to 9.1 mbpd in 2005 (total petroleum liquids, BP). At this rate of increase, their net exports would have been in excess of 14 mbpd in 2011, versus the actual 2011 value of 8.3 mbpd.
IMO, Deffeyes was basically right about global conventional crude oil reserves, but the price increase was sufficient to add enough production from unconventional sources to keep us on the undulating plateau, with a slight upward bias (and this is basically what the IMF analysts concluded).
However, because of overall rising consumption in the oil exporting countries, we have seen a measurable decline in net exports, relative to 2005. Following is the complete list of "Gap Charts."
Updated “Gap” Charts:
EIA Total Liquids, 14 mbpd Gap:
(2002-2005 rate of change: +3.1%/year; 2005-2011 rate of change: +0.5%year)
http://i1095.photobucket.com/albums/i475/westexas/EIA_total-liquids_02-1...
BP Total Petroleum Liquids., 13 mbpd Gap:
(2002-2005 rate of change: +3.0%/year; 2005-2011 rate of change: +0.4%year)
http://i1095.photobucket.com/albums/i475/westexas/BP-world-production_02...
EIA Crude + Condensate, 14.5 mbpd Gap:
(2002-2005 rate of change: +3.1%/year; 2005-2011 rate of change: +0.07%year)
http://i1095.photobucket.com/albums/i475/westexas/EIA-CC_02-11_gap-1.jpg
Global Net Exports, 18 mbpd Gap:
(2002-2005 rate of change: +5.3%/year; 2005-2011 rate of change: -0.7%year)
http://i1095.photobucket.com/albums/i475/westexas/GNE_02-11_Gap-1.jpg
Available Net Exports (GNE Less Chindia’s Net Imports), 17 mbpd Gap:
(2002-2005 rate of change: +4.4%/year; 2005-2011 rate of change: -2.2%year)
http://i1095.photobucket.com/albums/i475/westexas/ANE_02-11_gap-1.jpg
If I remember that right, then Hubbert assumed that crude oil would be replaced by something else at approximately the same or lower price. He had nuclear energy in mind I think, I remember a graph showing an oil production curve and a nuclear energy curve picking up where the oil curve went down. That didn't happen. Thus the basis of his model was destroyed: prices rose, leading to a shift from resources to reserves that Hubbert had not anticipated (e.g. tight oil became economical), and the production curve became asymmetrical. If you look at the curve for the US, all of the US, then it is obvious that the downslope is flatter than the rise.
Sorry, this is a comment to WebHubbleTelescope on January 15, 2013 - 7:58am, is this at the right level in the threads? How can I change the level, i.e. move it one bit to the right?
If you click reply on that message, it should be in the same thread, but you'll have to click subthread of parent subthread to line a thread up properly.
Hope that helps. Leanan is the best person to ask. These threads are smarter than I am!
Best,
Kate
I would suggest that the move from conventional oil to tight oil sources isn't on a continuum. If one looks at both the costs and returns on Bakken fields as a comparison, the transition is a step function.
Do the bookkeeping on that source separately, and then we can always gauge its potential while carefully keeping track of conventional crude depletion.
Hi WHT,
The idea of keeping track of unconventional vs unconventional is a good one.
To my mind the primary unconventional categories are tight oil, deep water offshore, and extra heavy oil/tar sands. We can get a pretty good idea of Bakken production in North Dakota (though only Rune Likvern has managed a good look at a decline rates for the average well). I have looked at the Eagle ford Shale which is the other major tight oil play of current interest. Though I am a little unsure about the timeliness of the TRRC data, there is good agreement with EIA data up to late 2011, then the RRC data diverges.
There are other tight oil plays such as the Permian Basin in Texas and New Mexico (58 % of total Texas C+C in 2011 was from the Permian Basin), since 2006 only the Spraberry Trend area has been increasing output (when considering only the top 10 producing fields from 1993 to 2011.)
See http://www.rrc.state.tx.us/permianbasin/index.php .
There are a few other tight oil plays in the US which are not as developed as the Eagle Ford or Bakken. Looking at Baker Hughes Rig counts and focusing on horizontal and directional oil rigs gives some indication of activity. About 60 % of the active oil rigs are horizontal rigs and of these rigs about 75 % are operating in the Williston (Bakken), Eagle Ford, Permian, Mississippian, and Granite Wash Basins (188, 153, 146, 71, and 59 rigs respectively). These are 13 week averages for the period ending 12/7/2012 from the Baker Hughes pivot table and refer to horizontal oil rigs. The Mississippian Basin activity is mostly (94 %) in Oklahoma with a bit of the rigs in Kansas. The Granite Wash activity is split between Texas and Oklahoma.
Darwinian gives occasional updates on deepwater output from the Gulf of Mexico, keeping track of other deepwater output in Africa and South America may prove more difficult.
Oil sands output is pretty easy to track because Canadian data is reliable, but Venezuelan Extra heavy from the Orinoco will be difficult to track.
Another way to approach the problem is to look at total liquid fuel production and put it in energy terms rather than just volume to account for the lower energy per unit volume of NGL and biofuels.
DC
Who in the U.S. reports U.S. C+C production to JODI?
If the EIA reports it to them, then the data should be identical. Any differences, there are small ones in Figure 3, would be very suspect. It would also be invalid to use agreement between EIA data and JODI data for the U.S. to support the validity of using EIA data to patch the omissions in JODI data.
I don't know, but, someone could find out. I guess it may be the EIA. I have longstanding correspondence with DECC, the UK government dept of energy. They report figures to JODI and can tell you who does it. But they don't know where the IEA, EIA and BP get their figures from.
The fact that JODI and EIA data are closely aligned for all OECD producers tells you that the EIA data are pretty good, I reckon that the EIA have probably started to use JODI data for many OECD countries.
To infinity and beyond.
Total denial.
http://carnegieendowment.org/globalten/?fa=50162
http://www.eia.gov/forecasts/aeo/pdf/0383(2012).pdf
Wow, I did not realize Canada was not part of North America prior to 2010!
This is what Canada's contribution actually looks like:
http://fuelfix.com/files/2011/09/Bentek-North-American-Oil-Production-Gr...
To be fair, I looked at the EIA 2012 Energy Outlook and didn't see that same figure that you link so it could be a third-party interpretation.
My opinion remains that the EIA is loaded with bureaucrats who can write whatever they want and not have to worry about going through a peer-review process.
I didn't see the graph either. But they do present it on their site (carnegie endowment that is).
“Carnegie remains a first-rate source of policy analysis and practical guidance on all the major international issues and I rely on the advice and counsel of many Carnegie scholars.”
– John McCain, U.S. Senator
“It is truly a global think tank…completely and appropriately reflective of the nature of the challenges that we face today.”
– John Kerry, U.S. Senator
They ran for president yes?
Yes, and they both lost!
It is so strange. They have a 30 year decline and never stop to ask "why?". Energy Return on Energy Invested predicts a different path: As energy quality declines, net energy will fall. As net energy falls the demand side of the economy will forced to contract.
The only way you will get those high growth curves can only happen if some other energy source with a high EROeI grows even faster to pay to subsidize the oil production. What energy source? Natural gas? That has falling EROeI. Wind? Solar? They cannot grow that fast and hold a positive EROeI. Cheap Chinese coal in the form of drill pipes etc? High oil prices make shipping steel more expensive than US steel. Very unlikely that subsidy will survive the high oil prices needed to pay for the drilling.
No - just the energy system dynamics render that outcome a fantasy. There is not likely enough surplus energy in the world to power that result. This is why we have peaks and declines. Production goes through a peak and trying to reverse the peak results in falling net energy. Both ways you end up with a decline. That forces demand to follow the downward production slope.
Now, if the world invented some kind of much more efficient solar cell that could be produced for a fraction of the current cost, with no toxic side effects, then you might see solar panels powering this kind of oil extraction. But then electricity would be so cheap, we would all drive electric. Oil loses again.
A very cogent argument.
If the subsequent rise does occur after a prolonged valley, the economists would really need to explain the mechanism. Our current valley must be explained by cheaper foreign oil compensating for the total required to sustain the economy. As that cheap oil disappears due to depletion and ELM losses, the USA has to make up for it some way.
The missing fraction is supplied by a combination of very expensive to extract fuel and a greater pressure to extract what we have now. It could become less expensive if some new technology was invented, but we are running out of our energy seed corn and energy feedstock to make that happen.
Imagine that some little stripper well or Bakken field supplies the energy to a garage entrepreneur who figures out some nanobot technology that allows unlimited extraction. That is the myth-making scenario that is playing out. Technology always saves us at the end.
The cost of solar cells is coming down rapidly. And their efficiency is constantly improving, too, through technological advances. In many countries, rooftop solar is at or near grid parity. Certainly there are issues around the scarcity of materials for manufacturing some forms of solar cells, but we shouldn't write solar power off on that account.
The transition to a sustainable energy economy will be far from painless. But it won't be a case of die-back - not by a long shot.
I'm glad solar panels will feed us and enable us to live sustainably. Will there be flying electric cars?
Actually, flying cars exist right now - there just aren't many people who have a long enough driveway...
No, not by a long shot.
In case I hadn't made it clear with my previous post, I don't think that BAU is possible. I also don't think it's desirable, either. The society I'm working for will have walkable cities, with personal transport beyond walking distance accomplished by public transport and bicycles. There will be taxis for those who need them, but they won't have right of way.
And the transition will be painful, particularly for those who live in North America. It's in North America that the car culture is most ingrained and has come to dominate the geography of the entire society, so there will have to be effort put into deconstructing some of the pernicious infrastructure as well as using the existing infrastructure more wisely. And maybe some cities like Phoenix will have to be abandoned, as being just too expensive to support with water transported so far.
Finally, I think food production will not collapse. Instead, it will change - and the waste will be purged from the system. The land presently given over to the car (a substantial portion of most cities) can be devoted to "victory gardens" that will replace a substantial portion of the production lost from the growing shortage of oil, while the rest can be achieved through change in diet (e.g. less meat & virtually no sugar) and the elimination of the vast waste involved in current systems of production & distribution.
The problem with doomers is fundamentally a lack of imagination. They see that BAU is unsustainable, but can't imagine anything else in its place. So they see the end of BAU as the end of civilisation.
I don't think that BAU is possible. I also don't think it's desirable, either.
"Possible" is very different from "desirable".
It's certainly possible to keep on with "car culture" - cars can be renewably powered EVs, manufactured with all recycled materials.
Now, I don't drive much, and I'd love to see more trains and walkability in general, but PO won't do much to force that to happen.
First post after a long abscenece. I got bored watching the slow motion trainwreck but still lurked on a bi-monthly basis! Seems that supply constraints causing high oil prices stopped us slipping over the other side too quickly so the collapse is happening in slow motion.
Just a quick question. I've seen historical GDP vs oil price overlayed on a graph in 2010. But it would be nice to have a triple overlay of global GDP + C+C (as above) + Oil Price with up to date data. Anyone fancy this challenge?
Marco.