| Oil Watch: Reconciliation of JODI and EIA C+C Production Data | The Oil Drum | Ten Reasons Why High Oil Prices Are a Problem |
Tech Talk - Miles Driven, Gas Used, and OPEC Projections
Posted by Heading Out on January 23, 2013 - 10:59am
Leanan has noted the API report of the continuing drop in US oil demand. It would be wrong, I believe, to explain this purely by reference to the increased efficiency of vehicles now on the road, nor would it be realistic to expect that these changing conditions will result in a lowering of gas prices.
To explain the rationale behind these thoughts requires reference to two sets of data. The most potent is the behavior of the Kingdom of Saudi Arabia (KSA), but before discussing their actions the story begins with the changes in the miles travelled reports that are issued by the Federal Highway Administration each month. Driven by a comment on recent versions of that plot, it is worth revisiting the summary of the rolling total of miles travelled in the United States, with the October 2012 plot being the last available.
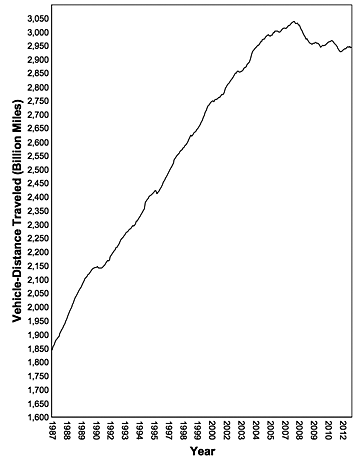
It should be noted that this is not the amount of fuel used, but rather the distance travelled, and thus in itself this does not reflect any changes in vehicle performance because of the increased efficiency of their engines.
And while there does not appear to be any great difference between the numbers for 2011 and 2012 when broken down by month for rural and urban travel, they both lie below the values for 2010.
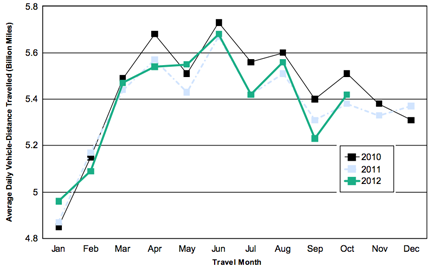
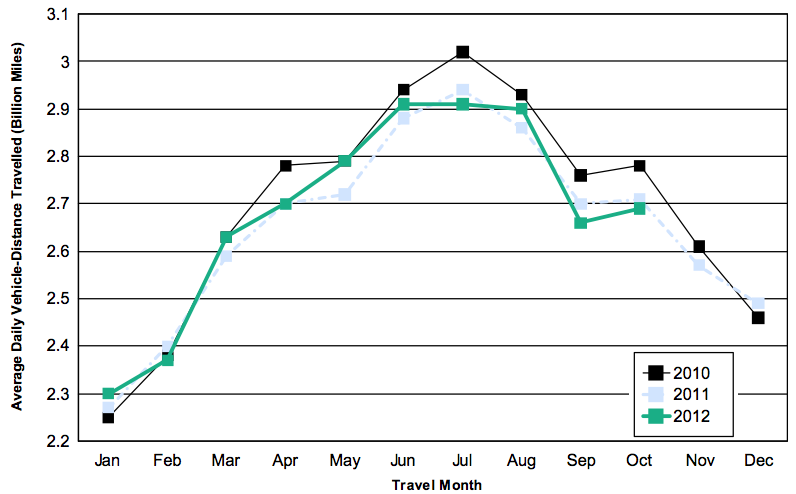
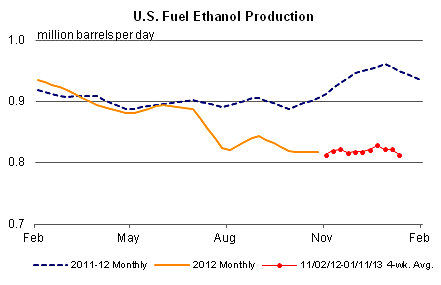
This shows that folk are actually driving less than they have previously, which may be reflective of the current economic condition when combined with the high price for gasoline in relative historic terms. One can compare these curves with the demand for gasoline from This Week in Petroleum, though this has data through the end of the year and a slightly different lower scale range.
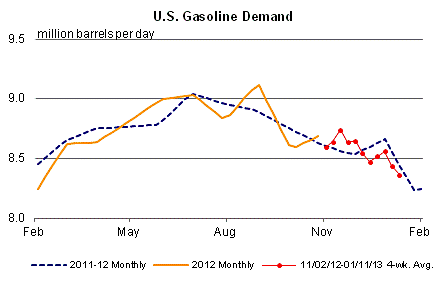
Demand for gasoline, as with miles travelled, seems relatively equivalent for data for 2011 and 2012. The demand for ethanol, on the other hand, seems to be significantly less, assuming production matches that demand.
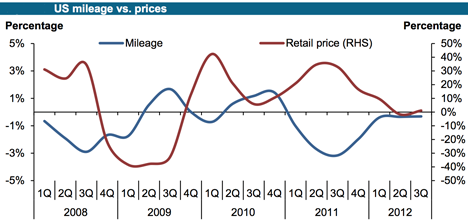
OPEC take a keen interest in those activities that impact the demand for oi lin the United States, and in their latest Monthly Oil Market Report (MOMR) have plotted the variation in oil price with miles driven:
Driven by increased demands for vehicular fuel, OPEC anticipates continued growth in domestic demand for oil, both in the Middle East and in Latin America.
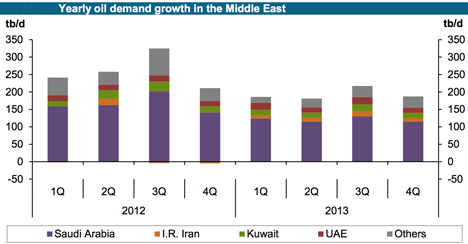
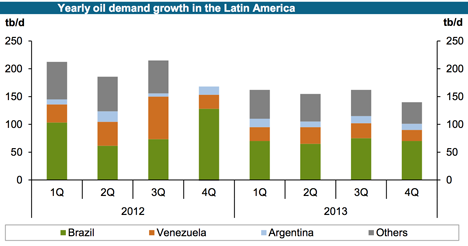
Both of these tables feed into and support the position that Westexas has discussed in regard to the drop in available exports of oil in the coming years.
OPEC is not expecting to increase production in the coming year, but rather expects that increase in demand will be met by production growth from the non-OPEC nations with numbers similar to those discussed earlier. And as noted, most of that production growth is expected to come from America.
The report confirms that OPEC and particularly Saudi Arabia is willing to cut production when demand falls, so that price levels are sustained. As in previous months, the numbers showing production differ when the reports come from the countries themselves in contrast with reports from secondary sources.
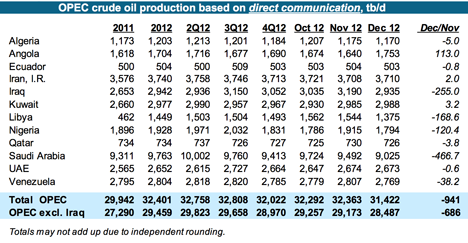
There are significant drops in production reported for Iraq, Libya, Nigeria, and Saudi Arabia so that the reported drop in production comes close to 1 mbd. There is not quite the same amount of sacrifice evident in the numbers from secondary sources.
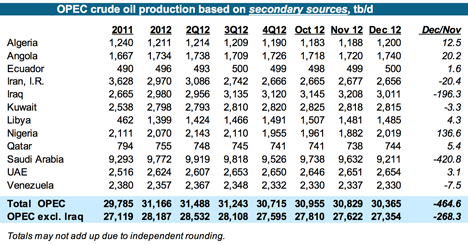
Overall production is down only around 500 kbd, with almost all of that being a reduction from Saudi Arabia. The difference between the production numbers from Nigeria (they report cutting production 120 kbd while others report they have increased production 136 kbd) are perhaps indicative of some of the problems that exist within the OPEC organization when they try and balance the supply:demand equation.
However, given that KSA is willing to do the heavy lifting, it seems likely that prices will continue at their current levels despite any changes in American production levels.
Contact
- Content: editors at theoildrum dot com
- Tech support: support at theoildrum dot com
License

This work is licensed under a Creative Commons Attribution-Share Alike 3.0 United States License.
Thanks, HO. Thought I would toss this out - EIA:
I couldn't find any data on China's VMT, but it's clear they will do their best to take up any consumption slack, and then some.
...and: Chinese gasoline demand to grow by 12% in 2013 on rising vehicle sales: Report-
Interesting times ahead.
I think that the most accurate assessment of the global situation is that net oil importing OECD countries like the US are gradually being forced out of the global market for exported oil as the developing countries, led by China, have consumed an increasing share of a declining post-2005 volume of Global Net Exports of oil.
Our data base shows that the ratio of GNE to Chindia's Net Imports of oil (CNI) fell from 11.0 in 2002 to 5.3 in 2011, and the rate of decline in the ratio has accelerated in recent years, falling from 8.9 in 2005 to 5.3 in 2011.
At the 2005 to 2011 rate of decline in the GNE/CNI ratio, in only 18 years the Chinidia region alone (China + India) would theoretically consume 100% of GNE.
Rising US oil crude oil production (to a level well below our 1970 peak rate) certainly helps, but it's a near certainty that we finished 2012 with the highest overall decline rate from existing wellbores in US history, and I have a hard time believing that thousands and thousands wellbores quickly headed toward stripper well status, 10 bpd or less, will make a material long term difference in the global net export situation.
*Top 33 net exporters in 2005, BP + Minor EIA data, total petroleum liquids
Good China graph, they may need to use biomass, coal and natural gas to make some synthetic gasoline, diesel and jet fuel. They can not continue to import 8-10+ million barrels of oil per day, the world may max out at 100 million per day and less of that will be for export.
The increased demand from China, India, Brazil, and all other developing countries is likely to more than offset any decrease in demand from the OECD so overall, if prices were to remain the same we would see higher levels of worldwide consumption. On the supply side, OPEC expects that non-OPEC output will increase, though I think any increases in North America will be offset by declines on other continents so that the overall non-OPEC increase in supply will be modest. By mid year when demand tends to be higher I think that OPEC will need to increase output levels or real (inflation adjusted) oil prices will rise (probably both things will occur.) How much prices rise depends on both how much demand increases and how much supply can increase in response to higher prices. Interesting times indeed.
DC
Why are we talking about the US?
China is the real story
the growth in oil consumption is virtually a straight line, and I saw no dip during the 2008 crash, and no slow down in the past 10 years with the massive price increase to $110
New cars in China this year estimated at 22M (!)
the US is struggling to get back to 14M
New miles of multilane highway in China - something like 88,000 soon to be bigger than the US intestate
From the chart I estimate 6.5% growth, which will put them at 20MBD, with 16MBD being imports, in 11 years.
Some experts (Grantham, Gross, Rubin, Gail, etc) are forecasting "The end of Growth" or growth at 1%, partly because of oil prices
Not in China... yet
Eventually, China will have to live within the limits of what it can procure through balanced bilateral trade. My guess is that this limit for oil imports will be well below 16MBD.
I reconstructed the above graph with 2012 estimate from here. And I added the yoy growth. Growth seems not to be a straight line. Seems to be something cyclic around a decreasing average.
Thank you Richard Nixon for "opening up China". Thanks not just for giving our CEOs a place to send American jobs and production knowledge, but also for helping the world blow through oil faster.
It wasn't just Nixon. Mao was looking for an ally against the Soviet Union. If Nixon had turned him down, Mao would have wooed the Europeans. The industrialisation of China would have followed a somewhat different course, but it would have occurred nevertheless.
Trying to interpret the reduction in mileage is an exercise in correlation.
In other words, is the reduction elastic with respect to oil price?
Here is a rough redraw of Figure 6 with the inverse price (i.e. cheapness) plotted instead of price.
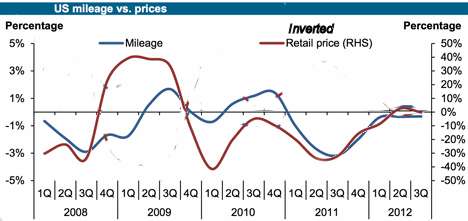
After the initial shock of 2008, where people were trying to establish their bearings in the new economy, it appears that a rhythm of adapting to price is being established.
A change in price of 10% is implying a change in mileage of 1%. It could be pure budgetary adjustments as consumers determine continuously how much they are willing to drive depending on the instantaneous price of gasoline.
BTW, there is another interesting cause/correlation in the news recently. This has to do with the reduction of lead additive in gasoline with the reduction in violent crime over the years. I can see this one because it is a similar kind of correlation, but it has a lag of about 20 years, which is the time it takes for a boy to become a violence-prone adult while ingesting lead during this time. This is a pure oil shock model convolution exercise as well, but substitute lead content level for the gasoline itself.
A redraw of the VMT total chart:
I prefer zero scaled charts. From the chart at Moneybox, it looks like VMT per capita was on a plateau from roughly 1972 to 1982. So it looks like this is a response to higher oil prices and recession. It takes time for people to adjust to new circumstances (moving closer to work, telecommuting, vacationing closer to home, etc).
In the present case, real gas prices have roughly doubled since 2002, they almost doubled from 1972 to 1981 (increase of 86 %) and then fell back to 1972 levels (in real terms) by 1999. From 1986 to 1996 real gasoline prices were flat. Also of interest, the real gasoline price was falling from 1949 to 1972 by 36 %.
see http://www.eia.gov/totalenergy/data/annual/showtext.cfm?t=ptb0524
and http://www.eia.gov/forecasts/steo/realprices/
It will probably take another doubling of price to get VMT down significantly, at present trends this will take another 11 years without increased fuel taxes.
DC
Zero scaling can have its uses but (for me) is not the holy grail of charting. Although non-zero scaled charts can be used to misrepresent zero scaled charts can have the same effect.
Take for example body temperature. If one were to zero scale body temperature on a kelvin scale the difference between having a normal body temperature and a deadly fever would not be noticeable and thus useless. I'd rather have my doctor look at my temperature chart which has a range from 35C to 45C than one that goes from OK to 1000K.
Also, zero is a bit of a random starting point (see my temperature example above). As scales have a minimum and maximum values then what would be the "right" maximum value? Clearly choosing the maximum value also has a big effect on what a chart looks like. What if the max value on the VMT chart where 38,567 trillion or some other huge number?
I don't think there is one right way to look at data graphically but I think that if data is represented in multiple contexts the chance of it conveying a message increases.
Rgds
WeekendPeak
WeekendPeak,
A zero scale is not always appropriate, generally I think it is, though the example you give is a case where it is not. A chart without a zero scale is also needed if focusing on small changes, but generally for data such as VMT, I think a zero scaled graph is better. You are correct that one could choose a scale of zero to 1 million light years and that would not be very informative. I like the chart I presented better than the one presented in the post which squashed the chart in the horizontal direction and streched it in the vertical direction as well as not zero scaling the vertical axis. This creates the illusion of a very steep rise in VMT and what looks to be the beginning of a steep fall, YMMV.
DC
The main problem with the chart is that it shows absolute numbers of miles traveled, instead of % change per year. Absolute numbers aren't very informative.
I disagree. Absolute numbers are the basics. They give a function from which you can calculate a derivative (like %change is a sort of derivative).
Sure - they make a good starting point to frame the discussion, but then you need to proceed to something more meaningful and detailed to really understand what's going on.
Of course absolute numbers mean something.
You always seem to argue for arguments sake.
Of course absolute numbers mean something.
Yes, that's what I said.
argue for arguments sake.
Well thank you for caring enough to give personal advice (I actually mean that, as I hope you on some level meant that positively), but:
No, good graphic presentation is not easy, and it's very important.
Verwimp was saying that you need both absolute numbers and the derivative, and I was agreeing with him. But, I was adding that the derivative chart is actually much more meaningful.
I've done that chart, and IIRC, it shows that the decline in annual VMT growth started well before PO Lite.
WHT -- Just wanted to follow up on my previous comment to you about shale data that the Post Carbon Institute / Richard Heinberg have gotten. I agree that while it would be great if they could share the data with everyone, the impression I got is that the data they've gotten is something they have to pay money to access (it's not their data to share freely with the world, as much as I'm sure they'd like to). It's a proprietary dataset of North Dakota oil production. So I'm sure they'd love your help in analysis if you could help them, as I doubt they can legally share the raw data.
If the goal is to convey datapoints only a table may make more sense. I think that it is almost impossible to make any graph which does not have some kind "emotional bias".
Rgds
WP
dcoyne78, I much prefer your chart for this particular example. Keep up the good work.
Thanks for mentioning the Lead Article as this particular study is absolutely a watershed argument that should be discussed at great length as it dismantles a GREAT number of previously held beliefs about society, the benefit of the EPA, Dr. Steve Pinkers assertions, incarceration rates and the Kettering Doctrine. The premise of this article should be used to re structure society and the implementation of new technologies introduced into the public sphere. I will eventually write a long treatise on this article's implication, but for know I would question the quote "lag time".
I am fairly confident there is little or no lag time associated with airborne lead exposure and aggression, but the lag time is associated with incarceration or tolerance of behavior in society. I postulate that the aggression is present, but society chooses not to jail until the miscreant enters adulthood. I grew up in the 1970s in the suburbs and I believe that adolescents were much more aggressive then than now. I would also expect to find the higher concentrations of airborne lead (density) increased the aggression.
Greg Hunter, whose hometown is named after Charles F. Kettering - Destroyer of the Environment and Incarcerator of Innocents.
http://daytonos.com/?p=650
Regarding the top graph showing vehicle miles traveled in the US:
in the Federal Highway Administration link the data is formulated using traffic counts at 4000 locations throughout the country. I have my doubts about the accuracy of this method, largely because the economic downturn has caused traffic patterns to change in many areas of the country. Also, note that the FHWA data shows North Dakota traffic increasing 1.4% from 2010 to 2011. From my observation of frequent travels in that state, the increase is probably more like 5 to 7% increase. Some roads in western North Dakota have ten times the traffic load of only five years ago. And Fargo North Dakota actually has what could be called "rush hour".
I am not degrading H.O.'s post, just questioning some of the government data collection methods.
Your estimate of the growth in North Dakota's traffic may be correct but let's not forget that the state has far fewer people than many of the larger counties in the country, like Harris County, TX, for example. (ND's pop is approaching 700,000 while Harris County's is over 4 million.) Being such a small portion of the whole, any increase there, even a very large % increase, will have an extremely minor impact on the national figure, of course.
My point was not that ND traffic by itself made much difference. The data could be flawed for the entire US, since the ND data is flawed, IMO. As I stated in my post, having 4000 data location collection points may not be correctly monitoring traffic in the US, which is 3,560,000 square miles, has over a million miles of roads, and has a population of 330 million.
Perhaps an ambitious person could take the data collected on how much money is spent per month on gasoline with credit cards, and attempt to factor in population each month and the change is median 'gas mileage' over time.
These are permanent count stations, maintained using roadway-embedded sensors. Most of the locations are on various classes of federally funded roadways. This five-year downtrend has simply not happened before. It has implications for how we fund roadway maintenance and construction (as well as the portion of the gas tax used for public transit.) As others have noted, we also have a trend among young people away from automobile driving, and this is occurring outside of the large metropolitan areas as well as within them.
At the same time Amtrak and Greyhound are setting new ridership records. For Amtrak, the growth is happening on almost every route in the system. Both Amtrak and Greyhound have seen a total increase of 50 percent over the last decade or so.
This summer my wife and I traveled on Amtrak's Empire Builder from Chicago to Seattle/Portland. This is the only train that serves North Dakota. We happened to share a dining car table with oil field workers on two occasions. One guy lived in Seattle and took the train for his two-week work shift, returning back home for a week or so off. At Winniston, in the heart of the oil boom, over a hundred people get on or off the train, an amazing volume for a community of that size. Clearly, not all of the workers there are driving, which may explain in part the rather modest increase in traffic in that state.
Most state transportation departments and some municipal governments post historic traffic counts online; the drop in traffic volume is obvious in many more locations. I do a lot of intersection-level counts during peak hours, and find that counts at the same locations made several years ago are consistently higher than now. Media coverage focuses on red state/blue state, how many guns are being purchased, or what "doomsday preppers" are doing, but across the United States, in both rural and urban areas, a historic shift in driving habits is underway. Americans are reacting to the end of cheap energy, even if they cannot yet articulate what is happening.
The cost of fuel is just part of the equation. The average wage has fallen nearly 10% since the peak while the cost of vehicles both new and used has increased, insurance has increased, yearly tax and license fees have increase, smog checks are more expensive, etc.
I believe what we are seeing in reduced vehicle use is a reflection of lower living standards more than the current price of fuel.
The average wage has fallen nearly 10% since the peak
Where do you find that stat? Wage income is at an all time high, per the BEA:
http://www.bea.gov/iTable/iTable.cfm?ReqID=9&step=1
I'm using average wage as a euphemism for median household income which has fallen in inflation adjusted dollars from about $55,000/yr in 2008 to about $50,000/yr now. That stat comes from the Census Bureau.
There are several additional considerations. There is the increasingly skewed distribution of incomes. Also, I suspect statistics for wages do not take into account the widespread loss/reduction of benefits. It used to be quite common for large employers to provide extensive benefits, often at minimal or no cost. Now, these are funded to a much larger extent by payroll deductions and/or have been slashed (think about defined benefit pension plans).
Yes, it has often occurred to me that if all the unemployed were added to the process of figuring median income, all the zeros, when figured in, would give a truer picture of the nation's economic health.
Yeah, it looks like it fell from $54,489 in 2007 to $50,054 in 2011 a drop of -8.1% (we don't have 2012, which should be just a hair better). It looks like that's mostly due to unemployment, which is greater at lower income levels - that reduces the median, even while the average is growing.
Also IMO the median is a much better measure for middle income than the average.
No doubt who has been capturing the real income growth this time around plays to that big time.
I'm guessing newer figures will moderate the top 1% take some if taken through 2012--do you think the top 1% have managed to capture 75-80% of this recovery's total real income growth so far?
I agree that the demographics of the typical American driver going 15,000 or 20,000 miles/year is changing. Certain segments of the population are not driving as much, either by choice or by predicament. The relatively high unemployment rate has taken 2 or 3% of the traveling public mostly off the roads compared to six years ago. Likewise the cost of gas has made some vacation trips too expensive, so leisure travel is probably down too.
The troubling thing is the states insistance that more new roads be built (I-69 from Indiana to Arkansas and Kansas wanting a second outer belt around Kansas City). Then some states want to impose new sales taxes on its residents to fund roads (Virgina). The problem is that the pols just love roads, regardless of whether the taxpayer can afford them or not and as gas tax revenues declines.
DFT.
You apparently have knowledge of how the data are collected: permanent ... roadway-embedded sensors. I think that embedded senors in there most simple give a single number, namely the number of axles rolled over the sensor since the last reset of the counter. I can well imagine that what is actually done in this modern cheap digital electronics is much more than my imagined most simple form, but how much more? I read claims that the number of miles traveled has declined. Can one reduce the data in some way as to extract a distance traveled per vehicle from road embedded sensors alone? How? is some other data source used in conjunction with the road sensors, perhaps? What source? I can imagine that in a major urban area, the count rate goes down not because of fewer vehicles on the road, but because the vehicles are sitting in stop-and-go traffic. Can this situation be detected with the current data collection system?
Of course I don't think traffic jams corrupt the data in rural North Dakota, but in general, just how good is the data when judged against its use in trying to answer current questions? Maybe urban ring roads are not crowded because the feeder roads are jammed. Do we have data? What can you say about these kinds of questions?
Geek, the transportation departments in the various states have a number of locations which are counted on a regular basis: some continuous (via the embedded sensors or similar devices), some annually, and some every four to five years. In the second and third cases traffic technicians lay down pneumatic tubes (the black rubber tubes you see stretched along the road) or use some type of portable sensor mounted on a nearby pole or laying flat in the center of the lane under a synthetic rubber mat. At some urban intersections in major cities data are collected in real time as a means to adjust signal timing "on the fly" or to shift to another phase of the signal cycle.
Whether the collection device is a pneumatic tube or a sensor, the processing is the same. Each pass of an axle is recorded, but the time between axles is also noted. This allows an in-box computer to determine whether the vehicle passing is a car, a motorcycle, or a tri-axle truck. This same method allows traffic engineers to collect data on the percentage of truck traffic or the distribution of speeds on a roadway. As a traffic engineer I use these data to make decisions on everything from pavement design to speed limits. The methods have been around for many years and are quite standard. More recently, research has focused on crowd-source data such as cell phone transmissions.
Of course, we also still collect some traffic data the old fashioned way using a manual count board, although most of those are now digital to remove some of the human error (such as counting too long for a given period).
The permanent count stations used in the FHWA historic data are intentionally located away from normal queuing of traffic. That is, they are at mid-block locations between intersections. Of course, over time development may spread closer to a count station, and that station might be reclassified from rural to urban, but in terms of trends nationwide, the data are statistically reliable. Realize, also, that we are looking in this case at 24-hour counts, although counts may also be available in increments as small as five minutes. That removes the impact of time delays due to congestion.
How do we get from the number of vehicles crossing a given point in a given lane in a given direction to the total vehicle miles of travel? For that calculation, we have several conversion sources: origin-destination studies, license-plate observations and car-following methods, a series of in-depth Census surveys where travel diaries and other methods are used, and several others I would have to look up. These have been calibrated over time, and researchers track changes in such these as vehicle miles per driver, average length of a home-to-work trip, and other measures. Basically, researchers at the various university-based traffic institutes track these changes and make adjustments as needed to keep results consistent. This way, changes in volume on a given class of highway can be translated into the probable change in total vehicle miles of travel.
There were some engineering students driving around in a Mini, and every time they saw one of those black rubber tubes on the road, they would drive the front wheels across, stop, get out, and carry the rear wheels across. They figured it would confuse the traffic engineers because they would have half a car running running through all their statistics.
At least it was less adventurous than some of the other engineering stunts, such as dismantling a car and reassembling it on the roof of a skyscraper, or dangling it underneath a major bridge.
Rocky, the techs probably just figured a unicycle had gone by!
Bill McBride at Calculated Risk also follows the miles driven report, and he has two additional demographic comments. First, the aging population would suggest less miles driven since older people, especially retired people, tend to drive less. Second, young people, especially teens, appear to be driving less as a group, independently of economic circumstances.
Two other comments on that chart: the drop on the one at Calculated Risk doesn't look anywhere near as large, probably because the Y axis hasn't been chopped off way above zero. The visuals are important! Secondly, I'd really like to see a chart of miles driven per capita, since the population was steadily increasing during that period.
We all prefer zero rated graphs but however you show it that is one hell of a discontinuity. And surely this is the point; no one should be planning for this century to be a repeat of the last one and the evidence is everywhere that this change has already happen.
Everywhere urban at least investment in movement needs to be aggressively shifted to the missing electric Transit modes and away from continuing to try to subsidise unaffordable auto dependency: Better get ready.
The chart you asked for is here, posted November 28 2012:
http://www.slate.com/blogs/moneybox/2012/11/22/vehicle_miles_per_capita_...
eyeballing the chart, it appears that the current per-capita rate (using the approximate middle of the seasonal swing)is about the level as it was in ~ 1993-1994.
Side note: My wife, as I was typing this, commented about a commercial on the TV machine, run during the Atlanta Falcons-San Fran football game, featuring the Dodge Dart, extolling the fact that the manufacturer has set up an on-line registry with which a young driver's relatives can contribute to buying them a car! It said...'Dad can buy the engine, your grandma can get you the rims for a graduation gift,...' and so forth.
http://www.foxnews.com/leisure/2013/01/18/dodge-launches-kickstarter-lik...
I smell a little desperation...the auto industry does not want young people to grow up without cars.
VMT per capita statistics go way back.
Fascinating to see it grow from 3000 to more than 10000 during the last 60 years.
And now in decline.
The Bakken and Eagle Ford get all the play but this conservation of "distance traveled"
is a remarkable phenomenon.
http://cta.ornl.gov/data/chapter8.shtml
See the second chart at that site.
Isn't the real story here the rise from zero circa 1900? And isn't the plateau we're now on awfully suggestive for us at this site? We are headed back to zero circa 2100. The big question is on what basis do we get there? Rational reconstruction and soft landing, or BAU/Mad Max?
I agree strongly: we focus too much on description of our current situation and on de consequences in the next 5-10 years. We need to build a scenario for 40-60 years given PO as precondition. How do we manage this? I hardly hear any answer (I don't have an answer myself: that is true.)
I would be very interested in seeing the stats from Europe which has had a drop in car sales greater than the US. Europe has much greater access to Green Transit than the US and has always had higher gas / diesel prices. In Ireland after the carbon tax gasoline is now $8 per gallon. Overall Irish energy consumption has appeared to decrease due to the carbon tax.
Maybe they will go back to bicycles!
As usual the politicians are behind both the public and reality who want more Green Transit options to "Happy Motoring". Such as Gov Christie's cancellation of the NYC tunnel from NJ and absconding with the Port Authority toll hikes to waste $7 Billion on widening the NJ Turnpike and Garden State Parkway. Like Gov Cuomo's plan to waste $5 Billion on a new autos only Tappan Zee bridge even though the surrounding communities want LightRail and Rail transit.
Unfortunately Obama's Inaugural Address included the same tired promotion of Auto Addiction:
"Happy Motoring by any means necessary"!
The vested interests behind Auto Addiction are huge and bipartisan. For example, here in NJ amazingly enough (or maybe not) one of the construction union heads has endorsed Gov. Christie even as he has bashed labor and workers. No doubt due to Christie's short-term promotion of endless highway repaving, $70 Million overpasses, the pre-Hurricane proposed new Mantaloking bridge for over $600 Million, and of course the $7 Billion expansion of the Garden State Parkway and NJ Turnpike into the Pine Barrens.
But as pointed out in this TOD piece on reduced driving there are the attempts to control Reality and Reality itself which will insure that Auto Addiction will take a major contraction.
and Reality itself which will insure that Auto Addiction will take a major contraction.
It's certainly possible to keep on with "car culture" - cars can be renewably powered EVs and manufactured with all recycled materials, roads can be paved with low-CO2 concrete, etc.
Now, I take electric trains more than I drive, and I'd love to see more trains and walkability in general, but PO won't do much to force that to happen.
Hi Nick,
As energy choices become more constrained, energy prices will rise. The car culture you envision will likely be unaffordable for many. How expensive will the renewably powered EV's be both the car and the renewable electricity? How much does the low CO2 concrete cost? How about the grid upgrades to make the renewable power work well?
I would like to see all of this happen and I don't think it is impossible to do, but I think you are unrealistic if you think this will be inexpensive.
If I am correct, and I realize that my crystal ball is no better than yours, the more expensive "car culture option" may be supplanted to a large degree by trains, light rail, and other public transport options as well as a buildout of more walkable transit oriented development. The EV car may proivide a bridge to get us from here to there and it may be used by the very wealthy in the future, but I think middle class people may not be driving motorized vehicles in 30 to 40 years, except maybe in the most rural areas of the US. Farmers will still be using tractors (I am talking about cars for personal transit.)
DC
As energy choices become more constrained, energy prices will rise.
Wind and solar costs are falling, and will continue to do so.
On-shore wind in the US is at about 6.5 cents per kWh. That is very affordable: at .3 kWh per mile for an EV, that's only about 2 cents per mile.
The car culture you envision will likely be unaffordable for many.
The average new vehicle costs about $30k. The average vehicle on the road in the US gets about 22MPG. A Prius C costs about $19k, and gets about 50MPG. A plug-in Prius C, with a $10k battery would still be less expensive than the average new vehicle, but it's tiny fuel needs could be provided by current ethanol production.
Nissan just announced that new Leaf S base model is $28,800. That is BEFORE the $7500 Fed tax-credit.
No, it is not as cheap as cheap ICE cars, it has limited range (73 miles EPA rated), and takes time to recharge. But if gasoline were to cost $20/gallon, I'm sure a lot of people would be happy to drive such a "limited" car.
The whole country is scared. Not on the outside, not everyone ... but in private, people know this is the end of 'something', the end of how we do business.
People turn on the TV and distract themselves: they don't like the conclusion they arrive at after some time figuring out what the endless Boss-man lies really mean ...
The future of the United States has already arrived in places like Detroit ... Gary ... Baltimore ... Philadelphia ... Las Vegas ... as well as in other parts of the world: Syria, Somalia and Greece. What is underway is breakdown and everyone understands what it means ... nobody wants to 'go there' ... the bosses don't have the nerve to tell people the truth and they don't have the tools the people need to change because they have never had do ... they don't know how.
There aren't going to be any trains or light rail or public transport options ... there won't be a buildout of walkable developments. Nothing can be like now any more. People cannot afford these things, every penny was long ago borrowed and squandered on the oil the cars the waste the freeways the tract houses the stuff the vacations the flat screens and igadgets. Whatever financial slack might have been in the system 20 years ago has been siphoned off and sent to China ... where the locals are squandering it as fast as 1.2 billion can on the oil the cars the waste the freeways and thousands upon thousands of gigantic empty buildings that hulk over the countryside like gigantic tombstones!
What's coming is extreme poverty and deprivation, affording something to eat is going to really matter. This is the reason people are terrified, it's a very good reason, indeed! In the stillness of the night when the distracting noises are muffled ... minds and hearts know what's coming and it can't be negotiated- or reasoned with.
First to go in a crisis is convenience, whatever forms it might take.
And this apocalyptic vision is due to PO?
I would imagine Peak Oil and other resource constraints are surely a large part of it. If commodities cost a third of what they do today, conditions would be much better in the aforementioned parts of the world.
Hmmm, maybe not - it's complex.
Much of the developing world got hurt badly by under-priced food from the US. They lost local farmers. Now, of course, food prices have gone back to the neighborhood they should have been, but those countries are now dependent on imports...
Why not?!
http://www.ted.com/talks/jaime_lerner_sings_of_the_city.html
Jaime Lerner reinvented urban space in his native Curitiba, Brazil. Along the way, he changed the way city planners worldwide see what’s possible in the metropolitan landscape.
What, exactly, gives you this special insight into the private lives of "the whole country"?
You're entitled to your opinion, but it's worth being realistic about the fact that it's your opinion, not that of "the whole country".
...Pittsburgh? My namesake city has had reasonable success reinventing itself as a small hub for knowledge jobs (health and tech especially). I had a very negative stereotype of the city before I'd been there, but it's actually rather nice now.
Much of the world does not conform to your negative vision.
There's already a buildout of walkable developments:
"For the first time in a century, most of America's largest cities are growing at a faster rate than their surrounding suburbs
....
While economists tend to believe the city boom is temporary, that is not stopping many city planning agencies and apartment developers from seeking to boost their appeal to the sizable demographic of 18-to-29-year olds. They make up roughly 1 in 6 Americans, and some sociologists are calling them "generation rent." The planners and developers are betting on young Americans' continued interest in urban living, sensing that some longer-term changes such as decreased reliance on cars may be afoot."
I believe Pittsburgh was rated the most livable city in the US by some magazine, several years ago.
Tah Daah! dcoyne78, meet the Aerorider: Fully-Enclosed electric-assist bicycle. Personal motorized/human powered vehicle transport for the American middle class circa 2045... that is if Climate Change doesn't get us first!
http://www.gizmag.com/go/1811/
You can buy one today to get a preview of that future will be like.
And here's my Presidential version:
Edit: And if this guy can ride mass transport so can the rest of us!
http://gma.yahoo.com/blogs/abc-blogs/sergey-brin-wearing-google-glasses-...
Unfortunately the Aerorider is more of a wishful thinking concept than a real vehicle. There are very few Google hits on recently updated pages. There are several other concept vehicle also, but Aerorider is by far the best aesthetically. Wish it were real. If these things were manufactured in quantity, they could be mass purchased by urban centers and scattered about the area for the convenient use of an citizen or visitor. Given enough of them, traditional multi-passenger private vehicles could well be banned and the land presently designated for streets and thoroughfares could be just open space.
Fit it with twin machine guns and a rocket launcher, and let James Bond use it in his next movie.
Revive Jaws and his steel teeth. At the climax Bond mashes his face into the battery terminals and electrocutes him.
You gotta promote these things.
(I saw Skyfall last night so I'm a bit Bond-verskrik, as we say here.)
It will be great to see how electric plugins work during extreme weather events in certain countries, such as UK eg. flooding. Not so much the vehicles themselves as the road induction charging method to extend range - do they work under roadwater for example at junctions ?
One nice thing about plugins is that in an emergency they're truly dual-fuel: if there are fuel shortages, go electric, if there are power shortages, use fuel.
DC, I tend to agree with you regarding the long term role of EVs for the wealthy and a lack of personal transport vehicles for most people in urban areas. Transportation and land use are fused together as a chicken-and-egg issue. As personal transportation costs rise (or household incomes fall) the outermost suburbs of metro areas will feel the stress first. California's Inland Empire is a good example: cheap houses too far from job opportunities, and shopping/leisure options nearby being limited.
Consider a 50-lot subdivision, half-acre lots, constructed in the late 80's, located on a winding, narrow county road. Said county is once removed from the urban area, say a 30 mile commute. There is no sanitary sewer available, and the potable water lines may or may not include fire hydrants with sufficient pressure. Assume this site was built on prime, flat farm land, that a third of the homeowners are "underwater" with their mortgages and have lost household income. One home is vacated and weeds start to grow. The county is low on inspectors, and nothing happens. A second and third home go vacant. None of the homes is well-constructed, and owners/lenders cannot afford the repairs and upkeep. Without a change in the economy (unlikely in an energy-constrained world), this subdivision does not have a viable future. At some point the site is more valuable as prime farmland near a large city than as a residential subdivision. The houses will be stripped (legally or otherwise), structures razed, waterlines ripped out, and streets used by farm equipment.
EVs will be used by the wealthy (or maybe Bentley hybrids), but EVs will not help the people in this subdivision, and eventually they will relocate to rental housing near transit lines somewhere in the urban core. The metropolitan area will begin to shrink, and new, mixed use development with walkable neighborhoods will occur within the core or along high frequency transit corridors. In 30 or 40 years, the horizon you cited, the metro area is transformed.
And, yet, EVs aren't expensive. So why would energy costs have much to do with this scenario?
Good, then buy me one. I'll send you the info on where to have it delivered. The truth is after the latest economic downturn many, including myself, neither have the money nor the credit to buy ANY kind of a newer car, yet alone some overpriced, limited range, newfangled toy. Just look at the age of the auto fleet, it’s getting older. Now why is that? By the way, I have, and can, rebuild my car many times over. Can you? Of course, the lucky ones such as you will never have to worry about being able to afford the newest toys, will you? End of rant.
I recommend buying 7 year old cars and keeping them for 20+ years, for the best value - that's what I do.
You can get cheap hybrids that way. The original Honda Insight will give you 70MPG.
OTOH, car sales are up to pretty much their historic average, so most people are back to their normal car buying habits.
The thing is that EVs are expensive, for what you get. A 30-mile commute, if you don't have a recharge point at work, puts you close to the maximum range. Turn on the A/C or heater, add a few side trips to pick up groceries, dry cleaning, and the kids at school, and you're screwed. You almost but not quite make it home with the kids and 50 pounds of groceries in 100 degree heat. Range anxiety triumphs over all.
The far flung suburbs are going to be dead and starting to smell like the meat you bought will after a few hours in the sun, and the residents as happy as your kids will be after walking a few miles home. The closer-in suburbs will survive. Knock down those abandoned houses on half-acre lots, build 4 to 10 condo units in their place, add bicycle paths, electric trolley buses, and light rail to get people to work, and you have a viable community.
In fact, it would look like some of the Italian cities I was in last fall. More bicycles and motorcycles than cars, buses - many of them electric trolley buses - running all over the place, and all the cars small or even smaller. In fact even the trucks are tiny, and many of them have three wheels. Italy also has high speed rail to get you from city to city.
The US could look like that some day. Probably the food or the coffee won't be as good as in Italy, but you can always hope.
Rocky,
Tha's mighty unrealistic. Only a small percentage of commuters drive more than 60 miles per day and then add a few side trips on top of that. Further, why assume no charging during the day - if it's really needed, it will develop. finally, the Leaf can get 100+ miles of range with careful driving - the EPA measurement is for "typical" driving.
Even so, it doesn't matter: Why focus on pure EVs? That's just a distraction. A current hybrid (a partial EV) will give you 50MPG, and a carefully designed one like the original Honda Insight will give you 70MPG. Gas could be $7 per gallon, and your cost would still be 10 cents per mile.
Again, the average new car costs $30k, and a plugin Prius C with 40 miles of range (which would put you at 130 miles per gallon for a 65 mile trip) would cost less than that. Even if gas goes $12/gallon (and do you think it ever will in the US, without a carbon tax?) your cost (including electricity) would still be about 10 cents per mile.
The thing about Peak Oil is that, as production is brought down by geological factors (as well as any other, above-ground ones), the price of oil will rise to whatever level is needed to bring demand back within the limits of available supply. The more determined people are to drive, the higher the price will go.
That's very true.
The thing is, it doesn't matter much because there are much cheaper alternatives to $12/gallon fuel. So, when oil production falls to 10M bpd, oil just won't be the main thing people look to.
Heck, synthetic fuel (using carbon from atmospheric or seawater CO2, combined with electrolyzed hydrogen from seawater using renewable power) is very likely to be less than $10/gallon. Double heck - if it uses cheap surplus renewable power it's likely to be less than $5.
Hi Nick,
If one assumes that the $7500 tax credit is not extended forever, then EV's are expensive. Also keep in mind that a plug-in hybrid does not help much with a 60 mile commute. An EV might work if the weather is not too cold (say northern Maine or Minnesota) where temperatures this morning were -20 F (Limestone, Maine). One can assume that there will be improvements, but sometimes physics intervenes.
Also note that windpower sites on land are not unlimited and the sun does not always shine. I am all for using as much renewable energy as possible, but I would think that most people would accept that there are limits. For those that don't like nuclear power (and I am not a big fan), the only realistic option is a drastic cut in energy use over the long term assuming one believes that global warming is real.
When you suggest 6.5 cents per kwh for onshore wind, you do realize that distribution and transmission (D+T)costs are not included correct? Where I live the residential price for D+T is 8 cents per kwh, so if we assume 6.5 for wind the total residential price would be 14.5 cents per kwh. Note that investment in HVDC transmission needed to make a mostly renewable grid feasible is likely to increase transmission costs over the short term.
On the other hand grid upgrades need to be done anyway so upgrading to HVDC and more modern infrastructure might reduce transmission costs over the long term. There is also the potential for efficiency improvements in lighting and electical appliances. Also keep in mind that a rise in prices is probably the only way to accomplish (or maybe the best way) a transition to a more sustainable world, a carbon tax would go a long way to moving us in the right direction.
We need to move forward on as many fronts as possible.
DC
These conversations tend to get off track, if we don't focus. So, let's focus on the 1st question before we go to others.
The first question: will the far suburbs (30 mile commute each way) ever be unaffordable due to PO?
The answer is no. A plug-in with 40 mile electric range based on a Prius C would cost less to buy than the average new ICE car, and only use 1/2 gallon of fuel each day. That's affordable even if fuel is $10/gallon.
Ok, now on to secondary questions:
If one assumes that the $7500 tax credit is not extended forever, then EV's are expensive.
The newest Nissan Leaf costs less to buy than the average new car, even without the tax credit. It's operating cost will be much less. It's total lifecycle cost will be comparable to the cheapest of ICE cars.
An EV might work if the weather is not too cold (say northern Maine or Minnesota)
ICE cars need block heaters when it gets too cold. Plugins like the Chevy Volt use the ICE briefly to warm up the battery.
windpower sites on land are not unlimited and the sun does not always shine.
Wind can provide at least a terawatt, and probably much more. Solar can provide orders of magnitude more than the roughly 2 terawatts of electricity and 10 TW of other energy now "used" by humans (I put that in quotes, because 99% of the energy humans use reallly comes from the sun - what temperature would the Earth's atmosphere be without the sun??). The Earth receives 100,000TW continuously - we could capture at least .1% of that, if we wanted to.
the only realistic option is a drastic cut in energy use over the long term assuming one believes that global warming is real.
As a practical matter, I agree. Passive House etc makes enormous sense. Efficiency is just easier and more elegant than increasing energy production.
When you suggest 6.5 cents per kwh for onshore wind, you do realize that distribution and transmission (D+T)costs are not included correct?
Sure. In the US the average retail cost of power is about 11 cents, and about half of that is generation. So, wind is slightly more expensive than the status quo. Very, very slightly.
I agree with the rest of what you said.
Nick you said the costs of windpower is low, this is true for onshore wind and the resource is large.
http://www.energyboom.com/wind/government-study-shows-us-wind-resources-...
37 TWh according to the link above.
http://www.eia.gov/todayinenergy/detail.cfm?id=4630
The link above shows that the resource is mostly in the middle of the country in places where the population density is low, we need quite a lot of HVDC Transmission to get the electricity provided by wind to the east and west coasts where the bulk of the US population lives (about 51 %). Solar is available more widely, but is considerably more expensive, though we can use some "ruthless extrapolation" to get costs down to 6.5 cents per kwh.
DC
Yes, the sun doesn't always shine, but there are now solar thermal power plants:
http://en.wikipedia.org/wiki/Solar_thermal_energy#High-temperature_colle...
A variety of storage solutions, including molten salt, exist:
http://en.wikipedia.org/wiki/Solar_thermal_energy#Heat_storage
This should sort out the problems of night time and rainy days.
Nick, you're trying to keep the American suburban commuter lifestyle alive in a world where it is increasingly less viable. That lifestyle requires driving enormous distances because nothing is close. An EV won't work for that lifestyle because the batteries will run down during the day, and the dreaded range anxiety will set in as the battery gauge gets lower and lower.
An EV would work in denser communities closer to work and shopping, but as the density rises, light rail and electric trolley buses become more and more practical, while car traffic grinds to a halt. In that environment it is better for commuters to take buses and rail to work, and reserve the EV for runs to the local shopping center. It has lots of range for that, and can always use the recharger at home.
That's the lifestyle I lived for years, taking the wind-powered electric trains to work and reserving my little Toyota rice burner for runs to the shopping center and back. It is a very cheap way to live because the little cars lasted for 20+ years with very low fuel and maintenance costs, and the monthly transit passes were not very expensive. Replace the little gas sipper with a little EV and you have a lifestyle that most people can afford.
Trying to preserve the suburban commuter lifestyle with an expensive long range EV rather than a souped up golf cart will probably only work for the wealthy - and you have to question why the average taxpayer, who will not be able to afford suburban commuting any more, should have to subsidize people who can afford it.
Of course, that's the American tax system in a nutshell, isn't it? - the poor subsidize the rich.
What makes you think US gas prices won't go to $12/gallon in a decade or two? You will pay $12 with your low taxes, the Europeans will pay $16 with their carbon taxes, and the Chinese will outbid both of you for most of the supply.
Rocky,
you're trying to keep the American suburban commuter lifestyle alive in a world where it is increasingly less viable
Nah. I don't live that way, but I just know that a lot of people can't afford to move to much more expensive housing. "Drive until you Qualify" is very much alive.
Now, I use rail to commute, and I think that it's great. I hope rail gets extended to anyone who wants it for commuting. I'm just arguing that no one is going to be *forced* out of suburbia by PO.
Oil is very unlikely to go to $12/gallon - that's about $500/barrel, and there are much cheaper substitutes. Almost all transportation would go to renewable electricity (EVs and electric rail) long before that point. As you know, oil production is unlikely to go below 5M bpd for centuries, and that's more than enough to supply all of the $300 oil that anyone might want.
If all US personal transportation used as much fuel as a Chevy Volt, all of it's fuel needs could be provided by ethanol.
Synthetic fuel (using carbon from atmospheric or seawater CO2, combined with electrolyzed hydrogen from seawater using renewable power) is very likely to be less than $400/barrel. Heck - if it uses cheap surplus renewable power it's likely to be less than $200.
And, eventually EVs will be just fine for 60 mile commutes. It's mighty unrealistic to envision a world where people are losing their life savings because they have to abandon their homes and move to much more expensive close-in housing because they don't:
1) arrange for charging at work, or
2) drive carefully and get the designed distance of 100 miles, or
3) pay $2-3K more and get a slightly larger battery and driving range.
How do you generate the power to charge all the EVs? You're talking about tens of millions potentially. However, I do agree people won't be leaving their houses. Take a look at most urban areas in the U.S., they are dilapidated dinosaurs. Retail is dead and is being replaced by online shopping, manufacturing is dead and is being replaced by more economical offshore manufacturing and automated processes locally, there is a continued push for more automation in practically every industry. You really only need to leave your home to work (not all jobs of course), buy groceries, and for recreation. Even schooling will most likely ultimately be done by computers, why students need to physically go to some place and be taught when they can do it via a web based program? I see no case for cities to be popular in the future.
How do you generate the power to charge all the EVs?
Wind, solar, nuclear, hydro, etc.
You're talking about tens of millions potentially
We're talking hundreds of millions. Heck, China sells tens of millions of e-bikes right now.
Manufacturing labor is declining, it's true. OTOH, manufacturing is, on balance, returning to the US at the moment.
On the 3rd hand, you do have a point. Heck, I don't leave the house to buy most groceries - I can do it online.
You have to consider that 3/4 of the fuel is wasted as heat in an ICE. You need with batteries only 25% of the final energy of the fossile fuel. Lighter cars etc. should give further reductions.
In Germany 600 TWh fuel are used for transportation. To produce around 100 TWh electricity you need 35 GW of modern wind turbines, the current onshore turbines are around 3 MW and have 2500-4000 FLH, this means I need additional ~10.000, even in Germany with a much higher population density no problem. Or you can use a mix of wind and PV, therefore, I see no real physical problem in the USA: With two fold higher usage of cars and fourfold higher population this means around ~80,000 windmills.
How do you generate the power to charge all the EVs?
Do nothing. Most of the power is already available right now. At night, when EVs are charged, there is a massive amount of extra generation capacity. All we need to do is add a little bit more generation capacity as needed. Replace a few local transformers.
We will also need to produce more coal and natural gas to fire the extra generation capacity. Natural gas turbine plants combined with EVs might provide a doubling of efficiency over ICEs but existing coal and biomass fired power plants will only substitute about 1:1 with gas and might be a little less efficient than diesel.
In this scenario, EVs are just one method of converting from an oil based system to a natural gas and coal based system. Compressed natural gas, methanol, DME, propane, GTL, CTL, etc can also accomplish the same function.
In this scenario, EVs are just one method of converting from an oil based system to a natural gas and coal based system.
That would be for the very, very short term. In the longer term, we're talking wind, solar, nuclear, hydro, etc.
Agreed, but I guess in terms of timing it would depend on your definition of short term. There is enough natural gas and coal to keep a hybrid system going for a few decades.
Sure. We have a choice - we can keep a hybrid system going for quite a long time, and we can phase it out faster or slower depending on our priorities vis a vis climate change, etc.
Nick,
Oil is very unlikely to go to $12/gallon - that's about $500/barrel, and there are much cheaper substitutes. Almost all transportation would go to renewable electricity (EVs and electric rail) long before that point.
I was talking about gasoline at $12/gal which implies crude oil at $350/bbl or so. Crude oil went from about $10/bbl in 2000 to $148/bbl in 2008, so don't be surprised if it spikes considerably higher than the current $110/bbl (Brent) in the next decade or so.
As you know, oil production is unlikely to go below 5M bpd for centuries, and that's more than enough to supply all of the $300 oil that anyone might want.
After having worked for 35 years in the oil industry, I don't know anything of the sort. What I do know is that like rust, depletion never sleeps, and if you are producing oil you are always involved in a race with the Red Queen. Keeping up production is always a challenge. Many companies I worked for lost the race and are no longer in existence.
If you're talking about GLOBAL oil production, then 5 million b/d in 2100 or 2200 is believable. If you mean US oil production, it falls into the "When pigs can fly" category. Depletion curves approach the axis asymptotically. They never actually reach zero, but they can get awfully close. A few outliers on a fat-tail curve don't change that.
Of course, I can't completely rule it out, but I can't rule out flying pigs, either, what with genetic modification and all.
Crude oil went from about $10/bbl in 2000 to $148/bbl in 2008, so don't be surprised if it spikes considerably higher than the current $110/bbl (Brent) in the next decade or so.
That would be "ruthless extrapolation", in Tom Murphy's phrase. Pricing went from the historic regime in which there was always excess supply to one of scarcity, and speculators tested the upper limits in 2008.
The fact is that oil isn't worth much more than about $80 in the long-term: the longer it stays above $80, the longer substitutes are being pursued very strongly, so that eventually oil will be pretty much obsolete except for small niches: a portion of long-distance water and air travel, seasonal farm work, etc. In the long term synthetic fuels will put a price cap on oil well below $500/barrel ($500 divided by about 45 gallons (with expansion) per barrel plus refining & distribution = about $12), and the volume of consumption will be low enough that synthetics will be affordable.
I wouldn't be surprised by a $200+ spike, but it wouldn't stay there very long, unless there was a very large supply disruption, like war in the Persian Gulf - consumption would fall quickly.
Finally, if you think such a spike is likely anytime in the next 7 years, have you gone long on oil futures?
If you're talking about GLOBAL oil production
Yes, I'm talking global, and thinking especially of very heavy oil, like Canada's. Of course, that's conservative.
Nick,
Oil prices have been rising since 2002 and if they continue on their current trajectory they will reach $300/ barrel in real terms (Jan 2013 $) by 2020 which would probably be about $8/gallon (assuming taxes remain at current levels). I think you are correct that people will move to EV's for short trips, but trains will be needed for longer trips.
On cold weather for EV's, you can live without block heaters at -20 or so, but you usually need the defroster so you can see, this cuts back on range so that 60 mile(round trip) commutes would not work well, especially if there is traffic. For these types of commuters if there was no public transit, life would be difficult.
On the ethanol question and how it could substitute for all fuel needs, I disagree. In 2010 there were about 230 million light duty vehicles registered in the US and they travelled about 11,000 miles/year on average for a total of 2530 billion vehicle miles travelled (light duty vehicles only).
See http://www.fhwa.dot.gov/policyinformation/statistics/2010/vm1.cfm
Let us assume all light duty vehicles become Chevy Volts which according to the EPA get 62 MPGe this leads to 40.8 billion gallons per year or 2.66 million barrels of gasoline per day. Before the recent drought the US was producing about 8.7 mb/d of gasoline, about 10 % of this was ethanol or .87 million barrels per day. EIA data see link below
http://www.eia.gov/dnav/pet/hist/LeafHandler.ashxn=PET&s=W_EPOOXE_YIR_NU...
This falls far short of what would be needed unless you are proposing that everyone drive carefully so that the average MPGe would in fact be 186 MPGe?
DC
Oil prices have been rising since 2002 and if they continue on their current trajectory they will reach $300/ barrel in real terms (Jan 2013 $) by 2020
I don't think you can extrapolate like that. Because of PO-Lite we basically moved about 7 years ago from a consumer dominated regime, with very roughly $20 oil, to a supplier dominated regime, with very roughly $100 oil. That regime looks pretty stable: price declines will be prevented by supply cuts, and price rises will be prevented by consumption cuts (and a bit of extra production).
trains will be needed for longer trips.
If prices were to rise sharply, people would take fewer long trips (staycations), or they'd switch to crowded, higher efficiency cars. Also, long distance travel is a small percentage of overall personal fuel consumption - well below 20%.
Chevy Volts which according to the EPA get 62 MPGe
Is that really what the EPA assigns? I remember something much higher. In any case, that's a very unrealistic number, as it tries to convert electricity into "equivalent fuel". A Volt driver that drives the statistical average of 30 miles per day will use no fuel at all. The average Volt driver uses much less than 100 gallons of fuel to drive 11,000 miles - if they're careful they'll easily use less than 50 gallons.
According to cleanmpg (a hypermiling website) Volt owners report 100 mpge, this is those who hypermile. It still does not allow ethanol to take care of all light duty travel at current output levels, they would need to double. I am sure you will claim this can be easily accomplished. Also your assumption that the plugin can be charged at work is not always valid so the plug in would use 4/5 of a gallon per day, assuming no traffic.
DC
According to cleanmpg (a hypermiling website) Volt owners report 100 mpge, this is those who hypermile.
I took a quick look, and found the top efficiency ratings for hybrids were Volts with 352 MPG, and 216 MPG: http://www.cleanmpg.com/index.php?page=garage&displayunits=MPG%28US%29&p...
Do you happen to have a link for what you saw? Remember that mpge is not the same as MPG. I'm just talking about liquid fuel.
On average, cars are driven about 30 miles per day, which can be done without liquid fuel. Of course, there are some longer trips than that, but they only account for about 20% of all miles driven.
the plugin can be charged at work is not always valid so the plug in would use 4/5 of a gallon per day, assuming no traffic.
I wasn't assuming charging at work. A 60 mile roundtrip commute (what % of commuters go further than that?) could be driven on electricity for the first 40 miles, and then would require about 1/2 gallon for the last 20 miles. So, 1/2 gallon for 60 miles.
Charging at work, of course, would eliminate all liquid fuel consumption for a 60 mile commute. And why wouldn't almost everyone arrange for that? In a world of $8-12/gallon gasoline every employer would understand the need, and cities would start building them into parking garages, lots and meters.
$300/barrel seems high when considered against the cost of alternative fuels and energy conservation.
Yeah.
That would give you $8/gallon fuel. That's in the range of European pricing, and Europeans (with a little help from historical travel patterns, no doubt) only use 18% as much fuel per capita for personal travel.
That would give you $8/gallon fuel.
Nick, you have a weak grasp of the economics of oil refining. $300/bbl crude oil does not translate into $8/gallon gasoline.
According to the EIA, What do I pay for in a gallon of regular gasoline?
Crude oil at $300 per 42 gallon barrel converts to $8.33 per gallon. However, that is only 64% of the final price. If the crude oil is delivered to the refinery at $300 per barrel, the gasoline will be delivered to the consumer at about $13 per gallon including crack spread, distribution, marketing and deliver costs, profits, and taxes.
Now, you can argue that just because the cost of crude oil goes up, refining and delivery costs, profits, and taxes shouldn`t go up. They always have and they always will. Get used to it. It`s just the way the system works.
Taxes are a particularly bad sticking point because governments in the US are going broke at current tax levels. They are not covering costs. If people drive more efficient cars, the gas tax revenue goes down, but the maintenance costs stay the same. At some point governments will have a choice between letting the road system collapse, going broke, or raising taxes. Your choice (as a voter). Voters elsewhere in the world have opted for much higher taxes.
And there`s no guarantee that oil prices will stop rising at $300 per barrel. It`s not just the US, you know. Just because consumers and governments go bankrupt in the US, it doesn`t mean consumers in other countries will stop buying oil, or that their governments will stop subsidizing it. I was thinking of China and the OPEC countries in particular.
Rocky,
Perhaps you're getting frustrated, but let's not go for personal criticisms. I can easily be wrong about something, of course (learning new things is part of what makes this interesting) but let's see.
Yes, the cost of oil is only 64% of the cost of gasoline, when gasoline costs $3.75 per gallon. But, the cost of refining, distribution, profits and taxes is mostly not proportional to the cost of oil. Distribution, profits and taxes could pretty much stay the same, at less than one dollar (adjusted for inflation).
you can argue that just because the cost of crude oil goes up, refining and delivery costs, profits, and taxes shouldn`t go up.
Federal taxes haven't gone up a penny in what, 20 years, while inflation has reduced it's value by perhaps 50%. Meanwhile, oil has gone up in price by, what, 5x? So that component has gone down, even while (as you point out) there is a compelling public interest in raising that revenue source. Finally, the Motor Fuel Tax Fund deficit is only about 25%, so it would only take a 10 cent per gallon increase to restore the MFT Fund to the level needed for highway maintenance.
I'd like to actually see an analysis, rather than a handwaving argument that "those things always go up". For instance, we could compare the US to other countries: I suspect that the cost of refining, distribution and profit is fairly similar in the US and in other countries where fuel costs twice as much at the pump. Or, we could look at other industries, where if the price of goods go up it doesn't affect those other items much.
Heck, if you adjust for inflation, I suspect you'll see that "those things" haven't gone up that much. I suspect profit has gone up a bit more than the rest, as marking up the product in proportion to the price is an old tradition. But, even that would break down if the price of oil went high enough.
Of course, that's just a detail. If we were to pursue it, it would be a distraction, a red herring. The following is more important to our debate:
And there`s no guarantee that oil prices will stop rising at $300 per barrel.
No,I think it would stop at $200. Heck, by your argument above, $200 oil would give us $8 per gallon gasoline, and that would put us squarely in the European pricing range.
It`s not just the US, you know. Just because consumers and governments go bankrupt in the US
I'm not talking about consumers and governments going bankrupt, I'm talking about consumers saying "oil isn't worth this much, I'm going to order a hybrid and carpool until it arrives".
Again, consumers in Europe, where fuel costs twice as much, use only 18% as much fuel per capita for personal transportation. That's helped by history and geography, of course, but mostly it's the fuel price. If fuel went above $8 per gallon, consumption would decline very, very quickly.
When oil went above $120 in 2008 container ships started slowing down - they can slow down by 20% and reduce fuel costs by 50%. That's a tradeoff, as slowing down costs them something, but that tradeoff (and many more like it) becomes worthwhile if prices rise enough. In the longer term, ship design would change, as efficiency became more important.
A lot of substitutions would become economical above $150 per barrel.
, it doesn`t mean consumers in other countries will stop buying oil, or that their governments will stop subsidizing it. I was thinking of China and the OPEC countries in particular.
Actually, it really, really does. In India, for instance, the cost of subsidies has already forced them to stop subsidizing gasoline. India is still in enormous trouble financially just paying for a subsidy on diesel - that subsidy certainly won't go up -they just can't afford it. China has relatively small price controls/subsidies for fuel - prices are fairly close to market - even the modest existing price controls are putting enormous strain on the Chinese refiners.
As for OPEC, the only way prices could go to $300 any time soon, even temporarily, is if half of OPEC's production were to be halted by some kind of disaster - I don't know what that would do to their fuel consumption, but it probably wouldn't be good. The same argument applies for the long-term: if oil were to go to $300 that would mean that OPEC production was much lower than today, and they certainly wouldn't be subsidizing the internal consumption that was eating away at the exports that finance those subsidies as well as everything else.
Weekly data on this is available for California going back to 1999. From a quick scan, the only noticeable difference between the price breakdowns for 1999 and 2012 is that the state excise tax went up some time in between.
Overall, crude+$1 is a good approximation for the price of gas in either year, despite a 10x difference in crude prices (and despite ~30% inflation).
Thanks - good info.
Always good to see your input.
Nick, I am getting somewhat frustrated, but that is because $12/gallon gasoline is a Black Swan event, and people are not prepared for it.
For people not familiar with Black Swan Theory, Taleb said,
It is so called because Europeans used to believe that all swans were white because they had never seen a black swan. "As rare as a black swan" was a common expression of impossibility. Then they discovered Australia, and Australia had black swans. It was a much more likely event than they had believed. Similarily, just because Americans have never seen $12/gallon gasoline doesn't mean they aren't going to see $12/gallon gasoline.
I've looked at oil markets closely, and there is nothing in the theory and practice of markets to prevent it. As an outlier, it is a much higher probability event than most people imagine. In fact, when we get onto the steep part of the Peak Oil production decline curve, it will start to get closer to a certainty - and it will obviously have a severe impact on the average American lifestyle.
Americans will have to rationalize it after it happens because they certainly aren't prepared for it now. The turkey never knows that Thanksgiving is coming.
Having had 35 years experience in the oil industry and having significant investments in oil companies, I'm more in the position of being the butcher myself.
Rocky,
I'd say your long experience in the oil industry is working against you, and creating an enormous blind spot for you.
Oil shortages as a Black Swan? Nothing could be further from the truth. The US military has been terrified of that ever since WWII - why else do we have a military alliance with Saudi Arabia, and have been fighting oil wars ever since? Heck, the last time the US had a balance of payments surplus was when Saudi Arabia "reimbursed the US for it's expenses" after the 1990 Gulf war.
No, the real black swan here (to the extent to which some people can't see it) is that oil is rapidly becoming obsolete. The higher the oil price, the faster it becomes a thing of the past.
Have you thought about the examples I gave of substitutes for oil?
Sure there are substitutes for oil. When I worked for oil companies, we used to use a lot of them - e.g. running our field equipment and trucks on natural gas, running our electronics on solar power.
The problem is that the average individual isn't doing any of this, nor are governments doing anything adequate to help. They could introduce electric powered rail or electric trolley buses, build walkable communities, etc, but I don't see that happening now. Replacing the entire automobile fleet with EVs would involve a huge capital expense which might take decades to accomplish. I don't see any significant forward momentum happening. When there is a supply interruption, prices will take a huge spike due to the short term supply/demand inelasticity of oil. And nobody is prepared for it.
As far as Saudi Arabia is concerned, what happens if,
1) Their biggest oil field, Ghawar suddenly goes into steep decline like Mexico's Cantarell did?
2) The Arab Spring hits them and they suddenly overthrow their government?
3) They get into a war with Iran, possibly involving nukes and/or a blockade of the Persian Gulf?
4) Their production goes into decline at the same time as the world's other big exporter, Russia also goes into decline?
There are a lot of "Black Swan" events that could cause a sudden, sharp spike in world oil prices on very short notice. These are just a few of them. All of them are more probable than most people think.
We're getting rather closer to agreement.
I agree that supply interruptions are reasonably likely - I'm thinking of civil war or KSA-Iran war. The others will happen eventually, but they'll be much slower (and that's without the extraordinary efforts that KSA & Russia would throw at the problem - think how few rigs KSA really has right now, compared to the US...).
I agree that we're not preparing nearly fast enough. Still, the increase in US CAFE regs, and the recent world-wide development of electric vehicles (hybrids, plug-ins, EREVs and pure EVs) are providing the basis for a reasonably fast ramp-up. That kind of ramp-up wouldn't be that expensive if done through attrition, and wouldn't take forever - 50% of miles driven comes from vehicles less than 6-7 years old.
Now, a very sudden supply interruption would be very inconvenient, but really - the US could reduce it's net fuel imports by 60% in a matter of weeks with really aggressive carpooling. $8 gas will do most of it all by itself, but making all highway lanes HOV (except for hybrids, EVs, etc) would be a very big help too, to get the more affluent complying with the program. Imagine how quickly smart phone apps would be developed for the purpose...
Rail would be good for personal transportation, but it isn't necessary - EVs (including hybrids, etc) will do just fine.
Of course, rail is the sensible thing for freight. Most freight already moves by rail, and considerable rail capacity is being freed up by the decline in coal deliveries.
Now, that's for N. America, which is in a far better position than the rest of the world. Europe, for instance, would have to stop it's (relative) subsidies of diesel, and get serious about moving to rail freight...
#2 won't hit them unless #1 already has. As much as I would love to see them fall, the House of Saud is firm on the throne until the oil money runs out. They might be ratbags, but they're not dills. When they saw the first stirrings of the Arab Spring there (immediately after the fall of Mubarak in Egypt), they instituted a massive increase to social spending. Of course, this means they're now dependent on a pretty high level of oil exports to fund this spending, but as long as Ghawar keeps it up, they're safe.
Yeah, most oil exporters did the same thing. The positive thing for oil importers is that the exporters are no longer hoarding their export earnings, which caused imbalances in the world financial system. Instead, they're recycling them by importing stuff, which is much healthier for all concerned.
Yeah, I think there is a good chance of one of these oil supply cut-offs happening. And it is not like they haven't happened in the past . . 1973, 1979, Gulf war, Iraq war, Libya revolution are all big & small examples. One could happen at any time . . . or not. But what if those terrorists attacked an oil facility in Algeria instead of a natural gas plant (and blew it up)? What if the current cold war & sanctions with Iran turns hot? What if an Arab spring type of thing happens in Saudi Arabia, Kuwait, Qatar, or other oil-exporter? What if the central government in Iraq gets into a nasty dispute with the Kurds who are selling oil through to Turkey? What if a revolution occurs in Nigeria? What if Yemen becomes a failed state and there is spill over into Saudi Arabia? What if Chavez dies and a civil war breaks out in Venezuela among competing factions?
There are so many vulnerable situations in much of the oil exporting world. If (when) a small one happens, Saudia Arabia could make up for it. But what if two small ones happen? What if one big one happened?
I don't foresee $12/gallon gas though (unless something really big happened). But I would not at all be surprised if we see a spike up to $8/gallon in places within 5 years or so due to some unforeseen meltdown in some part of the oil exporting world.
There is little slack in the system right now and a lot of potential international flare-ups.
If we could quantify our suspicions about such a spike, we could become billionaires on the futures market.
Or not.
Nick, it is an interesting scenario to envision.
It is, isn't it? If an extended range EV like the Volt used only ethanol, it could be optimized for it's higher compression ratio - such engines have shown about 88% of the power output of gasoline, I believe, despite ethanol's low energy density.
We're going to need to learn how to make ethanol out of something besides corn to ever come close to this goal.
Well, US ethanol production is very roughly 14B gallons, and that's about 60 gallons per car. That's enough.
My point is that the 14B gallons requires a significant amount of diesel to produce. A long term solution will require a feedstock that is not as energy intensive. Methanol might end up being a better choice as it can be produced by gasifying woody organics.
On the one hand, the diesel used in agriculture is a pretty small % of overall fuel consumption, and it can be reduced substantially - extended range EV tractors, PV powered irrigation, etc.
OTOH, seasonal use (migrating combines, etc) is one of the more compelling uses of agriculture.
On the 3rd hand, your larger point is that there will be several competing sources of demand for liquid fuel, and personal transportation is just one of them.
That's a good point - my argument about a national EREV fleet powered by ethanol is mostly intended to be illustrative. I suspect that we'll find it convenient to continue to produce 5-10M bpd of oil for quite a long time, until alternatives become equally cheap and convenient.
Methanol from woody plants might be one. Pure synthetics (from CO2 and H2 pulled from seawater) and better batteries are also contenders.
We can synthesize fuel from corn stalks and other cellulose. We can synthesize ethanol, gasoline, diesel or jet fuel from biomass cellulose, this has all been proven decades ago.
We can use the waste heat from power plants to make fuel synthesis more cost effective. The synthetic fuel is lower in sulfur, reduces oil imports and is CO2 neutral. This can all be done, but is not being done.
When FFF power plants are phased out, it's very likely that renewable power will also have substantial surplus power for most of the time. So, there's a large opportunity for various kinds of fuel synthesis.
They can convert coal fired power plants to combined cycle natural gas then make synthetic fuels out of the coal using the waste heat from the new plant.
Yes, it's much more expensive closer in if you look for something the same size as you have in outer suburbia, but the size of suburban houses these days is extreme. People can survive quite comfortably in places that are much smaller. It just requires a change of mindset.
Peak Oil will force people to decide that they need to live closer to where they work, and in many cases will force people to live in a smaller dwelling than they had been expecting. And, when people move to larger premises, it will be at a later stage when the second child arrives, rather than when they first buy. Empty nesters will sell up their big house and move closer in. At the aggregate level, a lot more people will be living in apartments of some variety and considerably fewer in houses.
But, why would people go the the enormous expense and inconvenience of moving? Why not just buy a plug-in?
Plug-ins are no more expensive than ICEs even now. Even if they were slightly more expensive, that premium would be far smaller than the other trade-offs.
Let's say that exurban costs are $100 per square foot, and the average exurban house is 2,000 square feet. That means people are willing to pay $100,000 to live in a 2,000 sq ft house rather than a 1,000 SF house in the same area. Why wouldn't they be willing to pay, say, $5,000 to continue to live there instead of moving close in and living in 1,000 SF?
Heck, that's less than the cost of moving and furnishing a new house, let alone buying it. They could just put in Formica instead of marble, or some such other small change in finishes or optional items.
Very important considerations. The middle projection has US population at about 550 million by 2100.
Very unlikely the US will go for the Hong Kong density model. Lots of possible fill in/higher density multiple core scenarios for much of suburbia when the moderate population growth projection is factored in. Of course the strain that US population would put on global resources without substantial change to resources/capita consumed is at the center of the sustainability debate, well that and that all former serfdom of Chindia is trying to gobble up a bigger per capita resource chunk as well. Then you have the possibility of a 3 foot or better sea level rise by 2100
Projection of sea-level rise from 1990 to 2100, based on IPCC temperature projections for three different emission scenarios. The sea-level range projected in the IPCC AR4 for these scenarios are shown for comparison in the bars on the bottom right. Also shown in red is observed sea-level (Vermeer 2009).
--these are interesting times to say the least.
[general note: a couple weeks back when replying to a key post highlighting US shrinking personal transport fuel use I made a major error in my back of the envelope calculations for US post WWII population growth--I was using stuff I had laying around but who knows how i got the 1950-1960 number in the set below it should have read ~28.0
in millions
1950-1960 ~
15.3~281960-1970 ~24.4
1970-1980 ~22.6
1980-1990 ~22.0
1990-2000 ~32.7
2000-2010 ~27.2
This would be a bit closer but few read my comments and no one bothered to correct my egregious error--which was actually central to the comment I was making ?-) ]
The second chart, which has no source attributed, relies entirely on extrapolating recent trends in immigration into the US. I believe that the extrapolation is wildly misleading.
While I have no detailed knowledge of US immigration, I don't suppose its dynamics* to be hugely different from immigration into Australia, where I live and where I am much more familiar with the trends. And the history of Australian migration is quite illuminating.
Until World War II, most migration to Australia was from Britain & Ireland. Australia maintained a White Australia Policy, designed to keep out the Asian hordes. There had been a bit of migration from continental Europe (mainly Germany & Italy), but not enough to disturb the pattern. The existing population of Australia had a reflexive opposition to immigration of any variety, but were willing to tolerate people who were like them.
World War II, and especially the close approach of the Japanese advance to Australia, gave the political establishment a massive scare and all political parties adopted the slogan of "populate or perish". It was entirely within the framework of White Australia, since it was based on an intensified fear of Asia.
And here is where it gets interesting. It wasn't long before the Australian Government found that there weren't enough migrants coming from Britain - even with the offer of an assisted passage (you could migrate from Britain for £10, provided you stayed a couple of years). So in the late 1940s, the Government went looking for people from elsewhere in Europe who could fit the bill. They first imported displaced people from Central & Eastern Europe, including the Baltic States. They were obviously "white" and could fit in. By the early 1950s, the supply of displaced people from Central & Eastern Europe had pretty well dried up and the Government turned to Southern Europe. First a lot of Greeks came, because they were labouring under a Right wing dictatorship. Then came the Italians, mostly from the South. We had entire villages from Calabria & Sicily move here. After the Greeks stopped coming in large numbers, the Yugoslavs starting arriving. By the end of the 1960s, Australia had large numbers of people from all over Europe.
During the 1960s, the White Australia Policy lost support and began to be watered down. It was officially abandoned in 1972. During the 1970s, other countries started being major sources of migration into Australia - starting with Turkey and Lebanon, then spreading to Vietnam and China. These days, while there is a steady moderate level of migration from Britain, most other places in Europe are supplying very few migrants, while the major migrant sources are from China, India and South-East Asia - and, so a lesser extent, refugees from West Asia and Africa. While migration into Australia has been at historically high levels in recent years, this has masked a fundamental change. New sources of migrants are supplanting older ones. And there is a reason for this.
When a country is at an extremely low level of development, it generates very few migrants - and what migrants it does generate come overwhelmingly from the privileged classes. The vast majority of people are living a traditional life on the land and have no vision further than that. As it develops, however, the people start to look around more and to migrate. Most migrate to the cities, unless there is some barrier in their way. Some, however, migrate to other countries, where they think they can build a better life for themselves. The choice of country is based on a mixture of economic opportunities and social compatibility - basically, the greater the economic opportunity, the more foreign the environment people are prepared to move to.
As the country urbanises, the flow of migrants speeds up, but eventually the countryside is emptied of under-employed peasants and migration dries up. This includes international migration, too, because when migrants stop flowing into the cities, a labour shortage emerges and economic opportunities open up at home. You will continue to get a degree of emigration, but it will be countered by immigration and the return of emigrants. We can see for example that, in recent years, Ireland and Italy have become recipients of immigration on a large scale for the first time - and have had to confront the challenges of multi-culturalism for themselves.
The urbanisation process in China & India still has some way to run, but it is already well advanced. Indeed, in China, due to the One Child Policy, it is quite far advanced. The population of working age will peak this year and begin shrinking. Across much of the rest of Asia, urbanisation is also well advanced.
The conclusion of the urbanisation process in Asia will have world-shaking results. First of all, it will lead to these countries ceasing to generate large numbers of emigrants. Secondly, it will lead to them becoming migration destinations. Indeed, there is already a minor tendency towards this, with Indonesia supplying workers to Malaysia, Burma supplying workers to Thailand, etc. When the factories of the Shanghai region, or the Pearl River Delta, however, start having trouble filling their vacancies, two things will happen. First, wages will go up. And second, the Chinese Government will start looking for immigrants. Both these things will cause major change in the world economy.
Rising wages in China will raise the floor for wages around the world. This will have a major effect in middle income countries (especially in Latin America and Eastern Europe), because the lesser degree of competition from lower wage countries will open up more opportunities at home. And the reversal of the migration flow from China will lead to massive competition for migrants from the remaining low-wage and developing countries. Cambodia, Laos, Burma and Nepal will obviously be sending more migrants to China than to anywhere else, while I predict there will also, in time, be a program of importation of guest workers from Africa.
What effect will all this have on the existing countries of immigration, like Australia and the US? It means that there will be fewer sources of immigrants and more competitors for them. Immigration will, by 2030, have decreased greatly, since there won't be nearly as many people wanting to move there. And, of course, if the US has a period of economic retrenchment in order to address its national debt, its attractiveness as a migration destination will be further diminished.
So the second chart will not come to pass. Not by a long way.
* By dynamics, I refer to the mechanisms driving the push and pull factors in migration. The precise origins of migrants into the two societies are determined by historical and geographical factors, but this is secondary.
That's very interesting.
We can see some signs of it - immigration from Mexico to the US has pretty much completely dried up at the moment, and there is reverse migration of knowledge workers from the US to China.
Mexico's total fertility rate has also fallen dramatically over the past decade. The TFR is now below replacement rate.
At 2.3 and a population that is growing by 1.5% it doesn't look like it is below replacement rate.
Sure it does. Mexico's replacement rate is at least 2.3.
Don't forget the problem of momentum - lots of young women. That will take a little while to get past.
the population projection chart came from
http://www.mnforsustain.org/united_states_population_growth_graph.htm
assumptions are given/linked at bottom of page
The US is quite a different place than Australia--far more land with a temperate climate. It has added the equivalent of all of Australia's population even during its weakest growth decades since WWII and with our continuing high fertility rate (for a developed country) we have been managing ~4,000,000 live births a year again since the late 1980s.
US economic growth depends on increasing consumption and major industries, most notably agriculture, depend on a large mass of low wage workers to keep flowing in. Unlike Australia low skilled farmers can hop freights all the way from the deepest parts of third world Mexico to the Imperial Valley of CA and beyond (not saying that is the biggest channel just trying to highlight the relative barriers to population mobility in the two regions). The middle range is not all that out of line assuming some sort of BAU continues until 2100. Of course the sea level chart suggests that may not be the case.
I do understand your main point. Of course one must ask--the conclusion of the Asian urbanization process will occur when??? Could be why there is such a range of projections for when global population will peak.
As for recruiting African migrants, hop in cab in Chicago or NY City and it sounds like we are doing that already (yes I understood your sequence of migrants section). You might also note that there were a good many migrants from Africa to the US through the 17th, 18th and early 19th century--they weren't voluntary mind you.
The US has had a far different immigration dynamic than Australia through large sections of its history. There are more than a few reasons why the US is the third most populous country in the world, and why 'white' will likely not long by the biggest column when 'race' is tabulated here. With lots of real estate from the arctic to the tropics (I've eaten in a Korean immigrant's restaurant in Kotzebue, AK) somehow I've a feeling the US will be able to compete for immigrants for some time...if that is what it takes to grow the economy...and assuming BAU more or less keeps stumbling along...
My thanks to Luke H for the citation:
It is comforting, on the one hand, to know that the projection comes from the US Census Bureau and not some bunch of cranks. On the other hand, I find it quite surprising for there to be such a huge difference between the High & Middle Case projections, given the very minor difference in assumptions.
The High Case projection, however, is very unrealistic, since it makes incorrect assumptions about the drivers of immigration into the US. In particular, it assumes they are constant. In reality, however, these drivers are temporary.
1. As I noted above, China is far advanced in its urbanisation. It is already more than half urban, and the bulk of the non-urban population are either too old or too young for the workforce. As agriculture is hardly industrialised at all yet, there is a substantial minimum which will be necessary to maintain agricultural production. The flow of peasants into the cities of the coastal provinces slowed down a few years ago and the central government responded with a Go West policy, pushing development into the interior provinces. I am expecting the urbanisation process to be finished for most practical purposes within 5 years - 10 at the outside. It should also be noted that wages are already rising quickly in China. They will rise even more quickly when the villages are empty.
2. Latin America currently supplies the US with massive numbers of immigrants. This is not going to continue much beyond the end of the urbanisation of China. This is because the shift businesses to China, and the consequent pressure on the lower end of the labour market, will slow right down. Expect another wave of maquiladora factories in places like Reynosa, Ciudad Juarez, Nogales, Mexicali & Tijuana. With economic growth getting a kick on at home, far more people will decide to make a go of it there rather than slot into the lowest part of the labour market in the US (and where they are being made to feel increasingly less welcome). Certainly the impending decline of the oil industry in Mexico might delay the transition in that case, but growth in the rest of Latin America will provide other outlets for ambitious young people who want to try their luck outside Mexico.
3. Korea won't be supplying many more restaurant workers to either the US or Australia for very long at all. Although substantial numbers have migrated in the last couple of decades (there's one middle income suburb of Sydney where you'd swear you were in Seoul if you didn't look carefully), the Total Fertility Rate crashed about 30 years ago and has been in free fall ever since. It's now down to 1.23 and the number of children 0-4 is only about two thirds the number of adults 30-34. And South Korea is only the most spectacular case of the reversal of population trends in East Asia. Take a look at the following TFRs:
Taiwan 1.1
Japan 1.39
China 1.55
Thailand 1.66
Brunei 1.85
Vietnam 1.89
Source: CIA Factbook
https://www.cia.gov/library/publications/the-world-factbook/rankorder/21...
The population of Japan is already going backwards and the populations of both South Korea and China will be following shortly.
4. In the long run, the rest of the world is closing the gap with living standards in the US. At some point, the economic benefits of emigration will cease to exceed the cultural disadvantages. This will be the case regardless of whether Peak Oil turns out to be a major disaster or a relatively minor adjustment, because the US is the world's highest intensity user of oil, so whatever the effect is, it will be strongest in the US.
Apparently, you are not very familiar with the reproductive rates of Catholics, Muslims, and Mormons. Poverty has not proven to be a hindrance to increasing population and economic development is not universally a deterrent either. It depends on the social, cultural, and religious norms of a given country or ethnic group.
In the US, the push is for legalizing currently illegal immigrants which will result in a new wave of chain migration. There is also a push to increase legal immigration through increased use of the H1B, L1 and other business oriented immigration programs.
The long and short of it is that in the US there is a very strong push to maintain a 1+% growth rate in order to keep GDP growing. The limiting factor on this is likely to be economic in terms of how long the US dollar remains the world reserve currency.
not very familiar with the reproductive rates of Catholics
Catholics in the US have fertility and contraception behavior which are essentially identical to the larger population.
That is probably true of native born Catholics but isn't necessarily true of recent immigrants or Latin America. Even with some self deportation in the last several years, due to the economy, the US population has continued to grow around 1% a year and with an amnesty is poised to continue that trend. In the US, population growth and GDP growth are linked and that link will be difficult to sever as GDP growth seems to trump everything else.
Immigrant fertility is dropping quite quickly - 23% in the last few years, and much faster than that of native-born.
Employers of immigrants are the primary group promoting immigration.
Employers of immigrants are the primary group promoting immigration? Hardly, there is a wide coalition of groups promoting immigration. Some are economic like homebuilders and banks that need an ever increasing population to make their business model work. Some are indirect employers who enjoy the benefit to themselves of cheaper yard work and house cleaning. Others are immigration rights groups that promote family reunification and a larger representation of their cultural group in the overall population. Other groups are busy trying to "save the world" by allowing excess population in other countries to immigrate to the US since they seem to believe that US growth potential is infinite.
At the core of it though seems to be an underlying believe among the US population that economic growth is paramount to any other issue and population growth is necessary to achieve this goal. The whole growth is good meme.
Good stuff. A couple of quibbles:
Latin America currently supplies the US with massive numbers of immigrants.
I believe that's not the case right now - emmigration from Latin America to the US has pretty much dried up at the moment. That flow may not recover: Mexico's TFR has just about dropped to replacement rate, and Mexico IIRC is growing faster than the US.
because the US is the world's highest intensity user of oil, so whatever the effect is, it will be strongest in the US.
The US will do better than most countries, as it will eliminate oil imports much more easily than most importers - it just has to reduce oil consumption to a European level.
.In the long run, the rest of the world is closing the gap with living standards in the US. At some point, the economic benefits of emigration will cease to exceed the cultural disadvantages. This will be the case regardless of whether Peak Oil turns out to be a major disaster or a relatively minor adjustment, because the US is the world's highest intensity user of oil, so whatever the effect is, it will be strongest in the US.
That long run will be going pretty far out for a whole lot of the 3 billion people in the $2/day world. And no doubt the US will not feel the oil adjustment the most, we grow a whole lot of food in this reource rich country (climate adjustment of course is the wild card). Poorer places just climbing up the standard of living ladder will feel it most. Egypt could well be a poster child--high birth rate, food importer, recently went from oil exporter to importer, increasingly better educated population with extremely limited employment prospects. Plenty of countries out there with similar situations--lots of potential immigrants if these countries cannot turn around their economies.
By the way you missed a major eastern Asia country in your short list
Phillipines, TFR 3.15, country number 55 out of 224.
The western hemisphere has but a few places with a TFR below 2 though Brazil's turnaround is notable and does support your story line. And of course the high growth projection in the chart I posted was ridiculous, but midway in the mid growth area seems likely. That still has the US pushing 400,000,000 somewhere around the turn of the century. And if you recall I used that growth to support the idea that the sprawl around our cities will clump not implode with a steadily growing population. US policies and attitudes seem in line with the projection for now.
But since you brought up the long run--the trends you are highlighting will have humans going the way of the Shakers given enough time/?-) Pesonally I'm glad to have been here in growing times--much livelier, though I have gravitated toward thinner populated growing areas pretty far out on the edge. I lived in one dying area and got out quick.
Luke,
The best cutoff is really about 2.1, which is the replacement rate. About 50% of the countries on the list are below that, and I suspect they account for 75% of the world's population.
I think adjustments made for the TFR set the replacement rate at 2 at least that is how I understood the explanation at the top of the page
This entry gives a figure for the average number of children that would be born per woman if all women lived to the end of their childbearing years and bore children according to a given fertility rate at each age. The total fertility rate (TFR) is a more direct measure of the level of fertility than the crude birth rate, since it refers to births per woman. This indicator shows the potential for population change in the country. A rate of two children per woman is considered the replacement rate for a population, resulting in relative stability in terms of total numbers
https://www.cia.gov/library/publications/the-world-factbook/rankorder/21...
you can work out suspicions with this page though you will find 239 coutries have populations while only 224 have a birth rates ?-)
I do suspect your 75% figure is a bit high if ~3 billion of us are earning less the $2/day. Lions share of that group is in places with a high birth rate (though China does have a share if I recall)--all part of the vicious circle from which we need to aid the escape. Lots of resistance to educating women in some of those quarters but things have been improving.
Sadly, I think the CIA got it wrong. In fact, I checked the (very good) wikipedia entry for TFR, and found the following:
"If there were no mortality in the female population until the end of the childbearing years (generally taken as 44 or 49, though some exceptions exist) then the replacement level of TFR would be very close to 2.0 (actually slightly higher because of the excess of boy over girl births in human populations). The replacement fertility rate is roughly 2.1 births per woman for most industrialized countries (2.075 in the UK for example), but ranges from 2.5 to 3.3 in developing countries because of higher mortality rates.[4] Taken globally, the total fertility rate at replacement is 2.33 children per woman. At this rate, global population growth would trend towards zero."
http://en.wikipedia.org/wiki/Total_fertility_rate
So, we see that the replacement rate is substantially higher than 2 for the developing countries with higher fertility rates, bringing many of them into the "lower than replacement rate" group. This article says the world TFR in 2009 was 2.58 and the world replacement rate is 2.33, so we're getting close.
And, yes, we gotta help women get education....
But somehow they keep growing so maybe wiki isn't completely correct on this one.
And, the world TFR in 2012 is at 2.40 - that's mighty close to replacement.
http://www.prb.org/pdf12/2012-population-data-sheet_eng.pdf
They keep growing because of "demographic momentum" - lots of young people. When they grow up, population growth will slow down sharply.
2.6 to 2.4 in 3 years? So in 6 years we should hit 2.0?
Why, you sound skeptical. That's only -2.4% per year, not at all unusual for post WWII fertility declines...
The closer the number gets to 2.0 the slower the convergence, in the mean time, the world continues to grow by over 80,000,000 per year and is project to continue to do so for quite awhile.
The closer the number gets to 2.0 the slower the convergence
That's certainly what everyone in the Public Health/Population Planning community was afraid of, but it doesn't seem to be happening nearly as strongly as people were worried about.
Even assuming BAU, one wonders what all this excess population will do? Automation has eliminated many jobs and I cannot see there being less automation in the future. As they say, "idle hands are the devil's playthings". Certainly these projected populations cannot maintain the quality of life we have grown used to, the demands placed on resources would be massive.
Idle hands indeed. That's been one of the big issues in the Arab spring world. Lots of angry young unemployed men. Provide them with no job prospects, rising prices, and the sexually repressive nature of Islam and you are guaranteed a revolt.
First of all, the US has the highest level of residential mobility in the industrialised world. People are moving all the time. Peak Oil will merely change the factors influencing their location decision.
Second, living closer in cuts down driving time - for commuting and for just about everything else. Life is just so much more convenient when you've halved the time to the shops, the school, the hospital, etc. There are lots of reasons for getting closer to town and Peak Oil will add to them. I live in Australia and we are already seeing a boom in high and medium density development in big cities like Sydney & Melbourne, while developers on the urban fringe (what would be called "ex-urbs" in the States) are finding it hard to move their stocks.
Third, increased density in the inner and middle suburban areas will make public transport more viable. And public transport, done intelligently, improves the attractiveness of areas within its footprint even further.
I agree with that, mostly, though I would caution against over estimating those changes. For instance, the US mobility thing reminds me of an old joke:
"Somewhere in the country, every 30 seconds a woman gives birth.
And..
we've got to find her and stop her!"
On average, Americans move every 7 years, but that average disguises a minority which moves a lot, and a majority which does it not so much. Further, many of the moves are in the same neighborhood.
So, PO will make a difference, but it's impact is much smaller than most of the other factors, like housing costs and the value of one's time.
Until there is a decent range electric jeep, I know what works better in extreme climatic weather, such as flooding - SUVs / 4 by 4s. Sure a high powered electric vehicle could be produced, but really not sure how well the 'road induction charging' solution works under 3 foot of surface water. If the UK government/local councils cannot even afford to maintain pot holes, I find it fanciful if it could maintain induction points (when private toll companies go bust).
Road induction charging appears to be a red herring. It's a nice idea, but it's certainly not necessary to the success of EVs.
Cordless charging at home and public could be big, but in road is not likely IMO.
I agree. OTOH, there is a bit of potential for isolated spots, like places where buses and taxis stand for extended periods.
Taxi stands are a natural, but driving down the road on a wireless highway is a bit farther into the future. We could see autonomous taxis that return to charging spots, no need to tip the driver.
Yeah, I'm not sure it will ever make sense to build that much expensive wiring into highways.
OTOH, the recent progress of autonomous cars is astonishing. I never thought that it would take off like this, but the combination of incremental implementation and the risk-taking of Google seems to be really making it happen.
At the peak of rail travel in 1900, 12,000 passengers were killed annually in accidents. Now the rail death rate is negligible.
The same thing could happen with car accidents with autonomous driving.
Yes but the number of people traveling by rail is also negligible:). Commuter rail has a lot of passengers, but not long distance, and yes I agree the death rate per passenger mile is much lower today.